Natural Contaminants (Bakker et al.)
Natural Contaminants (Bakker et al.)
Natural Contaminants (Bakker et al.)

You also want an ePaper? Increase the reach of your titles
YUMPU automatically turns print PDFs into web optimized ePapers that Google loves.
4. Hazardous Substances<br />
83<br />
Joop F. <strong>Bakker</strong><br />
Martine van den Heuvel-<br />
Greve<br />
Dick V<strong>et</strong>haak<br />
Kees Camphuysen<br />
David M. Fle<strong>et</strong><br />
B<strong>et</strong>tina Reineking<br />
Henrik Skov<br />
P<strong>et</strong>er H. Becker<br />
Jacqueline Muñoz<br />
Cifuentes<br />
Wadden Sea Ecosystem No. 19 - 2005
84<br />
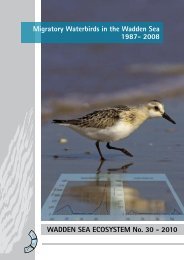
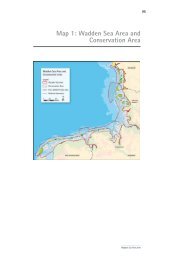
Figure 4.1.1:<br />
Map of the Wadden Sea<br />
with subareas used for<br />
ev<strong>al</strong>uation and assessment<br />
of hazardous substances.<br />
Table 4.1.1:<br />
QSR coding and description<br />
of the Wadden Sea<br />
subareas.<br />
Wadden Sea Ecosystem No. 19 - 2005<br />
4.1 Introduction<br />
Wadden Sea subareas<br />
Legend<br />
Wadden Sea subareas<br />
Intertid<strong>al</strong> area<br />
N<br />
0 10 20 30 40 50 Kilom<strong>et</strong>ers<br />
NL1<br />
NL2<br />
NL3<br />
THE NETHERLANDS<br />
NDS1 NDS2NDS3<br />
SH2<br />
SH1<br />
Niedersachsen<br />
GERMANY<br />
DENMARK<br />
Schleswig-<br />
Holstein<br />
QSR Subarea Description<br />
NL1 Western Dutch Wadden Sea. The area receives fresh water directly from Lake IJsselmeer by the sluices of<br />
Den Oever and Kornwerderzand at an average rate of 16.3·10 9 m 3 /y. The water mass which originates from<br />
the river Rhine passes Lake IJsselmeer in about 50 days. The coast<strong>al</strong> North Sea water entering the Wadden<br />
Sea at the Marsdiep constitutes about 15% Rhine water.<br />
NL2 Eastern Dutch Wadden Sea. The area receives a minor freshwater source from Lake Lauwers and an industri<strong>al</strong><br />
waste line. The area is considered to be dominated by coast<strong>al</strong> North Sea water.<br />
NL3 Ems-Dollard estuary. The freshwater sources to the area are the river Ems (90%) and Westerwoldsche Aa<br />
(10%) at a tot<strong>al</strong> average rate of about 3.4·10 9 m 3 /y. Industri<strong>al</strong> and harbour activities border the estuary at<br />
Emden, Delfzijl and Eemshaven.<br />
NDS1 Niedersachsen Wadden Sea. The area is slightly influenced by loc<strong>al</strong> fresh water sources. Only sm<strong>al</strong>l harbours<br />
are present. The area is considered to be dominated by coast<strong>al</strong> North Sea water.<br />
NDS2 Jade Basin. The harbour of Wilhelmshaven is the main activity in the area. Virtu<strong>al</strong>ly no fresh water enters<br />
the area. The area is considered to be dominated by coast<strong>al</strong> North Sea water, which becomes enriched by<br />
sediment efflux of components during high tide.<br />
NDS3 Weser estuary. The river Weser is the main freshwater source at an average rate of 11.3·10 9 m 3 /y. The river<br />
borders are densely populated. Harbour activities are present at the cities of Bremen and Bremerhaven.<br />
SH1 Elbe estuary. The river Elbe is the main freshwater input into the area at an average rate of 24.5·10 9 m 3 /y,<br />
which is about 43% of the tot<strong>al</strong> freshwater input in the internation<strong>al</strong> Wadden Sea. The river is bordered by<br />
large cities (e.g. Hamburg), harbours and industri<strong>al</strong> activities.<br />
SH2 Eider estuary. The river Eider constitutes a relatively sm<strong>al</strong>l freshwater source of about 0.9·10 9 m 3 /y on<br />
average. The population density is moderate. Some sm<strong>al</strong>l recreation<strong>al</strong> and fisheries harbours are present.<br />
SH3 H<strong>al</strong>ligen. Virtu<strong>al</strong>ly no freshwater input and a low population density. The area is considered to be dominated<br />
by coast<strong>al</strong> North Sea water.<br />
DK1 Sylt-Rømø basin. The area is physic<strong>al</strong>ly bordered by the dams connecting Sylt and Rømø to the mainland.<br />
The area is considered to be dominated by coast<strong>al</strong> North Sea water. The freshwater input from southern<br />
Jutland was about 0.8·10 9 m 3 /y in 1990, which was about 1.3·10 9 m 3 /y to DK1 + DK2 in the same year.<br />
DK2 Ribe and Konge Å estuary (Knudedyb), Rejsby and Brøns Å (Juvredyb). The rivers Ribe, Konge, Rejsby and<br />
Brøns Å are sm<strong>al</strong>l rivers, thus constituting a sm<strong>al</strong>l freshwater input. The input to DK1 + DK2 is about 1.2·10 9<br />
m 3 /y on average. The area is considered to be dominated by coast<strong>al</strong> North Sea water.<br />
DK3 Varde and Sneum Å estuary (Grådyb). The last natur<strong>al</strong> estuary of the Wadden Sea. The city of Esbjerg is the<br />
main center of population and harbour and industri<strong>al</strong> activity. The area is considered to be dominated by<br />
coast<strong>al</strong> North Sea water.<br />
DK3<br />
DK2<br />
DK1<br />
SH3
4.1.1 Data sources<br />
Riverine inputs of hazardous substances were<br />
mainly extracted from annu<strong>al</strong> reports by OSPAR,<br />
and augmented with information from nation<strong>al</strong><br />
OSPAR contact points. Atmospheric inputs were<br />
available only for the Dutch Wadden Sea.<br />
Information about re<strong>al</strong>location of dredged<br />
materi<strong>al</strong> and its content of hazardous substances<br />
was taken from OSPAR (2003). Concentrations<br />
of m<strong>et</strong><strong>al</strong>s and organic compounds in sediment<br />
and biota were taken from the TMAP data units,<br />
the 1999 QSR database at RIKZ Haren and from<br />
other nation<strong>al</strong> data centers or data originators.<br />
4.1.2 Assessment procedure<br />
In the assessment procedure a contaminant was<br />
followed from its riverine source to the accumulation<br />
in sediment and biota. The data was ev<strong>al</strong>-<br />
uated visu<strong>al</strong>ly for tempor<strong>al</strong> and spati<strong>al</strong> trends over<br />
the period 1985-2002/03. The actu<strong>al</strong> concentrations<br />
were compared with background and ecotoxicologic<strong>al</strong><br />
assessment criteria, as accepted by<br />
OSPAR (1997). Before data ev<strong>al</strong>uation, harmonized<br />
param<strong>et</strong>erisation was checked and qu<strong>al</strong>ity control<br />
of data performed.<br />
The results of <strong>al</strong>l assessments are summarized<br />
at the end of each paragraph. Similarity in trends<br />
was not checked for (cor)relation, for example<br />
b<strong>et</strong>ween input and concentration in sediments.<br />
For the purpose of the assessment, the Wadden<br />
Sea was divided into 12 subareas consistent<br />
with the QSRs of 1993 and 1999 (Figure 4.1.1).<br />
Some of the areas are of an estuarine nature due<br />
to riverine water input. Subareas will be referred<br />
to by their QSR code as shown in Table 4.1.1.<br />
4.1 Introduction<br />
85<br />
Joop F. <strong>Bakker</strong><br />
Martine van den Heuvel-<br />
Greve<br />
Dick V<strong>et</strong>haak<br />
Wadden Sea Ecosystem No. 19 - 2005
86<br />
4.2 <strong>Natur<strong>al</strong></strong> <strong>Contaminants</strong><br />
Joop F. <strong>Bakker</strong><br />
Martine van den Heuvel-<br />
Greve<br />
Dick V<strong>et</strong>haak<br />
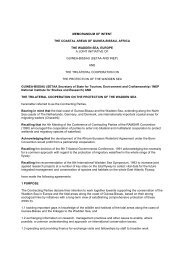
Figure 4.2.1:<br />
OSPAR reported fluvi<strong>al</strong><br />
m<strong>et</strong><strong>al</strong> input (ton·yr -1 ) into<br />
the Wadden Sea. Flow rate<br />
is shown for comparison<br />
(sources: D:<br />
Umweltbundesamt; NL:<br />
Rijkswaterstaat).<br />
Wadden Sea Ecosystem No. 19 - 2005<br />
4.2.1 Introduction<br />
The entire Wadden Sea is covered by both the<br />
OSPAR agreements on chemic<strong>al</strong> compounds and<br />
the EC Water Framework Directive (WFD). OSPAR<br />
agreements cover the entire North Atlantic and<br />
bordering seas; the delimitation of the WFD extends<br />
to the 12 nautic<strong>al</strong> miles territori<strong>al</strong> boundary<br />
for priority compounds.<br />
In the WFD, some m<strong>et</strong><strong>al</strong>s and natur<strong>al</strong> organic<br />
micropollutants are proposed as priority compound<br />
qu<strong>al</strong>ity standard and assessment is based on annu<strong>al</strong>ly<br />
averaged tot<strong>al</strong> concentrations in water. The<br />
Expert Group on An<strong>al</strong>ysis and Monitoring of Priority<br />
Substances (AMPS) is presently looking for a<br />
suitable sediment monitoring program within the<br />
WFD. OSPAR (2002) decided on a ‘List of Chemic<strong>al</strong>s<br />
for Priority Action’. Copper and zinc are not<br />
included in the preliminary WFD and OSPAR lists,<br />
whereas nickel and organic tin are a new focus of<br />
attention. Nickel could not be included in this QSR<br />
due to data not being available for <strong>al</strong>l Wadden<br />
Sea subareas.<br />
The 1999 QSR summarized that, in gener<strong>al</strong>, riverine<br />
inputs and concentrations in sediment and<br />
12<br />
10<br />
8<br />
6<br />
4<br />
2<br />
0<br />
1985 1990 1995 2000<br />
10<br />
8<br />
6<br />
4<br />
2<br />
25<br />
0<br />
1985 1990 1995 2000<br />
3,000<br />
2,000<br />
1,000<br />
0<br />
1985 1990 1995 2000<br />
Cd (t.y -1 )<br />
Lake<br />
IJssel<br />
Weser<br />
Elbe<br />
Ems<br />
Eider<br />
Hg (t.y-1 )<br />
Lake<br />
IJssel<br />
Weser<br />
Elbe<br />
Ems<br />
Eider<br />
Zn (t.y-1 )<br />
Lake<br />
IJssel<br />
Weser<br />
Elbe<br />
Ems<br />
Eider<br />
biota of m<strong>et</strong><strong>al</strong>s had decreased with the exception<br />
of mercury concentrations. Some hot spots, however,<br />
could be identified, for example, for mercury<br />
in sediment and blue mussels. Here, concentrations<br />
were higher than the background levels or<br />
ecotoxicologic<strong>al</strong> assessment criteria proposed by<br />
OSPAR. A d<strong>et</strong>ailed summary of the 1999 QSR results<br />
is given below for each compound ev<strong>al</strong>uated.<br />
4.2.2 M<strong>et</strong><strong>al</strong>s (Cd, Cu, Hg, Pb, Zn)<br />
4.2.2.1 Data<br />
Riverine input data is available as yearly submissions<br />
to OSPAR. Denmark does not report m<strong>et</strong><strong>al</strong>s<br />
to OSPAR. Data for polycyclic aromatic hydrocarbons<br />
(PAHs) is not reported to OSPAR and so is<br />
not readily available.<br />
Due to the large differences in both annu<strong>al</strong> and<br />
river flow, the riverine m<strong>et</strong><strong>al</strong> loads into the Wad-<br />
300<br />
250<br />
200<br />
150<br />
100<br />
50<br />
400<br />
0<br />
1985 1990 1995 2000<br />
300<br />
200<br />
100<br />
Targ<strong>et</strong><br />
Background concentrations of natur<strong>al</strong> micropollutants<br />
in water, sediment and indicator species<br />
0<br />
1985 1990 1995 2000<br />
45<br />
40<br />
35<br />
30<br />
25<br />
20<br />
15<br />
10<br />
5<br />
0<br />
1985 1990 1995 2000<br />
Cu (t.y -1 )<br />
Lake<br />
IJssel<br />
Weser<br />
Elbe<br />
Ems<br />
Eider<br />
Pb (t.y-1 )<br />
Lake<br />
IJssel<br />
Weser<br />
Elbe<br />
Ems<br />
Eider<br />
Flow 10 9 m 3.y-1 )<br />
Lake<br />
IJssel<br />
Weser<br />
Elbe<br />
Ems<br />
Eider<br />
C. Ribe<br />
S.Jyll.
den and North Sea vary profoundly (Figure 4.2.1).<br />
To reduce this variability, riverine loads were rec<strong>al</strong>culated<br />
to a ‘standard’ flow rate of 10 9 m 3 y -1<br />
(Figure 4.2.2) which can <strong>al</strong>so be used in terms of<br />
yearly-averaged concentration in river water (ton<br />
10 -9 m -3 ).<br />
Data on atmospheric input originate from published<br />
data and model c<strong>al</strong>culations.<br />
Dispos<strong>al</strong> of dredged materi<strong>al</strong> from estuarine<br />
harbors is a displacement of deposited mainly<br />
marine suspended particulate matter (SPM) to<br />
which many chemic<strong>al</strong> compounds adhere. The<br />
physic<strong>al</strong> impact by volume and the trend in contaminant<br />
levels may be considered as qu<strong>al</strong>ity criteria<br />
for the aquatic environment (OSPAR, 2003).<br />
Trends in dredged materi<strong>al</strong> concentrations in the<br />
Elbe estuary are shown as an example.<br />
Intercomparison of monitoring data for m<strong>et</strong><strong>al</strong>s<br />
in sediment is still hampered by different m<strong>et</strong>hods<br />
used in monitoring, sample preparation and<br />
an<strong>al</strong>yses (ref. 1999 QSR). To partly overcome this<br />
problem, the correction procedure of Koopmann<br />
<strong>et</strong> <strong>al</strong>. (1993) was applied to achieve intercomparability<br />
b<strong>et</strong>ween data obtained from
88<br />
Table 4.2.1:<br />
Atmospheric m<strong>et</strong><strong>al</strong> input<br />
into the Dutch Wadden Sea<br />
in 2001 as modelled and<br />
c<strong>al</strong>culated from ground<br />
stations (source: Bleeker<br />
and Duyzer, 2003).<br />
Figure 4.2.3:<br />
Trends in year-averaged<br />
m<strong>et</strong><strong>al</strong> concentrations in<br />
Elbe estuary dredged<br />
materi<strong>al</strong> (mg kg -1 dry<br />
weight, sediment fraction<br />
4<br />
3<br />
2<br />
1<br />
NL1<br />
0<br />
1984 1988 1992 1996 2000 2004<br />
1 11 11 11<br />
4<br />
3<br />
2<br />
1<br />
NDS1<br />
0<br />
1984 1988 1992 1996 2000 2004<br />
7 3 10 12 19 1 4 10 9 2 2 11 4 4 19<br />
4<br />
SH1<br />
3<br />
2<br />
1<br />
0<br />
1984 1988 1992 1996 2000 2004<br />
4 14 7 13 5 5 5 5 1617 6<br />
4<br />
3<br />
2<br />
1<br />
DK1<br />
0<br />
1984 1988 1992 1996 2000 2004<br />
4 4<br />
4<br />
3<br />
2<br />
1<br />
0<br />
1984 1988 1992 1996 2000 2004<br />
23332321122122<br />
4<br />
3<br />
2<br />
1<br />
NL1<br />
0<br />
1984 1988 1992 1996 2000 2004<br />
589874<br />
4<br />
SH1<br />
3<br />
2<br />
1<br />
NDS1<br />
0<br />
1984 1988 1992 1996<br />
244<br />
2000 2004<br />
4<br />
3<br />
2<br />
1<br />
DK1<br />
0<br />
1984 1988 1992 1996 2000 2004<br />
333333<br />
4<br />
3<br />
2<br />
1<br />
NL2<br />
0<br />
1984 1988 1992 1996 2000 2004<br />
11 11 11<br />
4<br />
3<br />
2<br />
1<br />
NDS2<br />
0<br />
1984 1988 1992 1996 2000 2004<br />
13 3 12 1515 3 2 11 11 11 20<br />
4<br />
SH2<br />
3<br />
2<br />
1<br />
0<br />
1984 1988 1992 1996 2000 2004<br />
2 2 2 4 2 3 2 2 2 2 1 1<br />
4<br />
3<br />
2<br />
1<br />
DK2<br />
0<br />
1984 1988 1992 1996 2000 2004<br />
6 6<br />
4<br />
3<br />
2<br />
1<br />
NL2<br />
0<br />
1984 1988 1992 1996 2000 2004<br />
46666642442222<br />
4<br />
3<br />
2<br />
1<br />
0<br />
1984 1988 1992 1996 2000 2004<br />
10 910884<br />
4<br />
3<br />
2<br />
1<br />
NDS2<br />
DK2<br />
0<br />
1984 1988 1992 1996 2000 2004<br />
336376<br />
4<br />
3<br />
2<br />
1<br />
NL3<br />
0<br />
1984 1988 1992 1996 2000 2004<br />
9 4 15 6 3 3 1 6 10 6 10 6 1012<br />
4<br />
3<br />
2<br />
1<br />
NDS3<br />
0<br />
1984 1988 1992 1996 2000 2004<br />
8 1 7 10 3 6 5 10 2 10 2 3 9 3 3 9 12<br />
4<br />
SH3<br />
3<br />
2<br />
1<br />
0<br />
1984 1988 1992 1996 2000 2004<br />
3 5 15 3 6 9 3 3 4 3 3 4<br />
4<br />
3<br />
2<br />
1<br />
NL3<br />
0<br />
1984 1988 1992 1996 2000 2004<br />
5 4 4 5 7 9 8 8 8 8 7 9 10 7 10 9 8 10<br />
4<br />
3<br />
2<br />
1<br />
NDS3<br />
0<br />
1984 1988 1992 1996 2000<br />
44<br />
2004<br />
4<br />
SH3<br />
3<br />
2<br />
1<br />
0<br />
1984 1988 1992 1996 2000 2004<br />
2222221122<br />
4<br />
3<br />
2<br />
1<br />
DK3<br />
0<br />
1984 1988 1992 1996 2000 2004<br />
6 6 6<br />
4.2 <strong>Natur<strong>al</strong></strong> <strong>Contaminants</strong><br />
89<br />
Figure 4.2.4:<br />
Cadmium (Cd) contents in<br />
Wadden Sea sediments<br />
(mg·kg -1 dry weight in the<br />
fraction
90<br />
Figure 4.2.6:<br />
Cadmium (Cd) contents in<br />
liver of Wadden Sea<br />
flounder Platichthys flesus<br />
(mg·kg -1 dry weight).<br />
Average (—) and minimum/<br />
maximum range (|) is<br />
shown.<br />
Wadden Sea Ecosystem No. 19 - 2005<br />
4.2 <strong>Natur<strong>al</strong></strong> <strong>Contaminants</strong><br />
0.4<br />
0.3<br />
0.2<br />
0.1<br />
NL1<br />
0.54<br />
0.0<br />
1984 1988 1992 1996 2000 2004<br />
24 37 21 25 25 25 24 25 25 25 25 24 25 25 25 25 25 25 23<br />
0.4<br />
0.3<br />
0.2<br />
0.1<br />
NDS1<br />
0.0<br />
1984 1988 1992 1996 2000 2004<br />
5 5 6 11 5 6<br />
0.4<br />
SH1<br />
0.3<br />
0.2<br />
0.1<br />
0.0<br />
1984 1988 1992 1996 2000 2004<br />
7 12 2815 5 3 5 4<br />
4.2.2.3 Copper<br />
Input<br />
The concentrations of copper in the Elbe remained<br />
at the reduced level of 1994<br />
Year-averaged concentrations show a decreasing<br />
gradient from Elbe, Weser, Ems, Lake IJssel to<br />
Eider, where the Elbe has twice the Eider concentration.<br />
The reduction in riverine loads has been<br />
margin<strong>al</strong> since 1989, except for the Elbe, with a<br />
highly increased load in 2002 (Figure 4.2.1).<br />
The actu<strong>al</strong> riverine input is strongly related to<br />
river flow and thus precipitation. This implies that<br />
a period of reduction in water concentration, coinciding<br />
with an increasing riverine flow, covers<br />
up strong reductions. This situation occurred in<br />
Lake IJssel, the Ems and Weser b<strong>et</strong>ween 1985 until<br />
1987.<br />
QSR 1999<br />
The Elbe showed a significant reduction in input b<strong>et</strong>ween<br />
1993 and 1994. In the Ems and Eider areas a reduction of<br />
copper concentration in blue mussels was apparent, which<br />
correlated with a riverine water concentration rather than<br />
with the load.<br />
Copper concentrations were largely at the agreed background<br />
in sediment and mussels (except for the Elbe) and within<br />
the range of ecotoxicologic<strong>al</strong> assessment criteria (OSPAR,<br />
1997).<br />
0.4<br />
0.3<br />
0.2<br />
0.1<br />
NDS2<br />
0.0<br />
1984 1988 1992 1996 2000 2004<br />
6 9 10 5 10 5 4 4<br />
0.4<br />
0.3<br />
0.2<br />
0.1<br />
NL3<br />
0.0<br />
1984 1988 1992 1996 2000 2004<br />
15 4 13 25 17 25 4 25 25 23 25 25 25 30 30 30 29 24 27<br />
0.4<br />
0.3<br />
0.2<br />
0.1<br />
NDS3<br />
0.0<br />
1984 1988 1992 1996 2000 2004<br />
10 5 4 2<br />
0.4<br />
0.3<br />
0.2<br />
0.1<br />
DK3<br />
0.0<br />
1984 1988 1992 1996 2000 2004<br />
8 8<br />
The atmospheric input (Table 4.2.1) to the Dutch<br />
Wadden Sea area is about 2% of the tot<strong>al</strong> riverine<br />
input to that area (Bellert <strong>et</strong> <strong>al</strong>., 2004).<br />
Concentrations in sediment<br />
The copper concentrations in sediment vary greatly<br />
(Figure 4.2.7). The standardized concentrations (in<br />
the
mg.kg -1<br />
60<br />
40<br />
20<br />
NL1<br />
0<br />
1984 1988 1992 1996 2000 2004<br />
1 6 11 11 11<br />
60<br />
40<br />
20<br />
NDS1<br />
0<br />
1984 1988 1992 1996 2000 2004<br />
7 3 10 12 21 1 5 11 10 2 2 11 4 4 20<br />
60<br />
SH1<br />
40<br />
20<br />
0<br />
1984 1988 1992 1996 2000 2004<br />
4 14 7 13 5 5 4 5 16 17 6<br />
60<br />
40<br />
20<br />
DK1<br />
0<br />
1984 1988 1992 1996 2000 2004<br />
4 4<br />
60<br />
50<br />
40<br />
30<br />
20<br />
10<br />
SH3<br />
ment criterion in 2002-2003, the SH-subareas <strong>al</strong>so<br />
in 2000.<br />
Concentrations in blue mussel<br />
Significant tempor<strong>al</strong> trends could not be discerned<br />
due to large interannu<strong>al</strong> and sample variation (Figure<br />
4.2.9). In the subareas SH3 to DK3 the data<br />
suggests a rapid increase by a factor of 2 b<strong>et</strong>ween<br />
1997 and 2002. Subarea SH1 may show a reduction,<br />
following the strong reduction in Elbe input<br />
(see Figure 4.2.1).<br />
60<br />
40<br />
20<br />
NL2<br />
0<br />
1984 1988 1992 1996 2000 2004<br />
9 11 11 11<br />
60<br />
40<br />
20<br />
NDS2<br />
0<br />
1984 1988 1992 1996 2000 2004<br />
13 3 13 1815 3 2 11 11 11 20<br />
60<br />
SH2<br />
40<br />
20<br />
0<br />
1984 1988 1992 1996 2000 2004<br />
2 2 2 4 2 3 2 2 2 2 1 1<br />
60<br />
40<br />
20<br />
DK2<br />
0<br />
1984 1988 1992 1996 2000 2004<br />
6 6<br />
0<br />
0 1 2 3 4<br />
%TOC<br />
5 6 7 8<br />
mg.kg -1<br />
70<br />
60<br />
50<br />
40<br />
30<br />
20<br />
10<br />
60<br />
40<br />
20<br />
NL3<br />
0<br />
1984 1988 1992 1996 2000 2004<br />
9 5 15 6 5 6 1 2 3 12 10 6 10 6 10 12<br />
60<br />
40<br />
20<br />
NDS3<br />
0<br />
1984 1988 1992 1996 2000 2004<br />
8 1 7 10 3 6 5 10 2 10 2 3 9 3 3 9 12<br />
60<br />
SH3<br />
40<br />
20<br />
0<br />
1984 1988 1992 1996 2000 2004<br />
3 5 15 3 6 9 3 3 4 3 3 4<br />
DK2<br />
4.2 <strong>Natur<strong>al</strong></strong> <strong>Contaminants</strong><br />
0<br />
0 1 2 3 4<br />
%TOC<br />
5 6 7 8<br />
Subareas NL3 to NDS3 exhibit the lowest levels<br />
in 2001-2002, whereas subarea SH3 shows the<br />
highest levels. Here, the proposed background<br />
(OSPAR, 1997, 2002; assuming 85% water in w<strong>et</strong><br />
weight) is exceeded by a factor of 3. Concentrations<br />
in subareas NL3 to NDS3 are at the top of<br />
the proposed background. Concentrations in subareas<br />
NL1, NL2, SH1 and DK1 to DK3 are about<br />
twice the proposed background level.<br />
91<br />
Figure 4.2.7:<br />
Copper (Cu) contents in<br />
Wadden Sea sediments<br />
(mg·kg -1 dry weight in the<br />
fraction
92<br />
Figure 4.2.9:<br />
Copper (Cu) contents in<br />
Wadden Sea blue mussel<br />
Mytilus edulis (mg·kg -1 dry<br />
weight). Average (—) and<br />
minimum/maximum range<br />
(|) is shown.<br />
Wadden Sea Ecosystem No. 19 - 2005<br />
4.2 <strong>Natur<strong>al</strong></strong> <strong>Contaminants</strong><br />
20<br />
15<br />
10<br />
5<br />
0<br />
1984 1988 1992 1996 2000 2004<br />
23332321122122<br />
20<br />
15<br />
10<br />
5<br />
NL1<br />
0<br />
1984 1988 1992 1996 2000 2004<br />
589874<br />
20<br />
15<br />
10<br />
5<br />
NDS1<br />
0<br />
1984 1988 1992 1996<br />
244<br />
2000 2004<br />
20<br />
DK1<br />
15<br />
10<br />
5<br />
SH1<br />
0<br />
1984 1988 1992 1996 2000 2004<br />
333333<br />
4.2.2.4 Mercury<br />
Input<br />
The dramatic reduction in Elbe mercury loads and<br />
concentration in 1994 was followed by a continued,<br />
but sm<strong>al</strong>ler decrease until 2002 (Figure 4.2.1).<br />
The Weser loads and concentrations peaked b<strong>et</strong>ween<br />
1991 and 1997. Uniquely, the Weser water<br />
concentration of mercury seems to increase with<br />
the river flow rate, indicating that the Weser mercury<br />
input depends on the atmospheric w<strong>et</strong> deposition<br />
rate. This may imply that, unlike the other<br />
rivers, the Weser input has its source predominantly<br />
in land run-off.<br />
Year-averaged mercury concentrations, derived<br />
from OSPAR flux data, are over 10 times higher in<br />
QSR 1999<br />
A strong reduction of Elbe mercury input occurred by 1987<br />
as a consequence of decreasing annu<strong>al</strong> flow, but most dramatic<strong>al</strong>ly<br />
b<strong>et</strong>ween 1993 and 1994. The Elbe water mercury<br />
concentration started to decrease <strong>al</strong>ready in 1991, but<br />
dropped more than sixfold b<strong>et</strong>ween 1993 and 1994. Mercury<br />
levels in biota of the Elbe estuary followed this trend,<br />
which was not observed in Elbe estuarine sediments. The<br />
Weser input and concentrations are suspected to be increasing.<br />
Mercury levels in the other Wadden Sea subareas are<br />
well below those in the Elbe subarea without showing a<br />
particular trend.<br />
20<br />
15<br />
10<br />
5<br />
0<br />
1984 1988 1992 1996 2000 2004<br />
46666642442222<br />
20<br />
15<br />
10<br />
5<br />
20<br />
15<br />
10<br />
5<br />
NL2<br />
NDS2<br />
0<br />
1984 1988 1992 1996 2000 2004<br />
10 9 108 84<br />
DK2<br />
0<br />
1984 1988 1992 1996 2000 2004<br />
336376<br />
20<br />
15<br />
10<br />
20<br />
15<br />
10<br />
0<br />
1984 1988 1992 1996 2000<br />
44<br />
2004<br />
20<br />
SH3<br />
15<br />
10<br />
5<br />
0<br />
1984 1988 1992 1996 2000 2004<br />
2222221122<br />
20<br />
15<br />
10<br />
0<br />
1984 1988 1992 1996 2000 2004<br />
5 5 4 5 7 9 8 8 8 8 7 9 10 7 10 9 8 10<br />
5<br />
5<br />
5<br />
31.1<br />
NL3<br />
NDS3<br />
DK3<br />
0<br />
1984 1988 1992 1996 2000 2004<br />
6 6 6<br />
the Elbe, Weser and Ems, than in Lake IJssel and<br />
Eider. The mercury concentrations tended to increase<br />
in Weser and Ems b<strong>et</strong>ween 2000 and 2002.<br />
Atmospheric input (Table 4.2.1) to the Dutch<br />
Wadden Sea is about 2% of the tot<strong>al</strong> riverine input<br />
into that area (Bellert <strong>et</strong> <strong>al</strong>., 2004).<br />
Concentrations in sediment<br />
In the
2<br />
1.5<br />
1<br />
0.5<br />
NL1<br />
0<br />
1984 1988 1992 1996 2000 2004<br />
1 6 11 11 11<br />
2<br />
1.5<br />
1<br />
0.5<br />
NDS1<br />
0<br />
1984 1988 1992 1996 2000 2004<br />
7 3 10 12 21 1 6 11 9 2 2 11 4 4 20<br />
2<br />
1.5<br />
1<br />
0.5<br />
SH1<br />
0<br />
1984 1988 1992 1996 2000 2004<br />
4 13 6 12 5 5 5 5 16 17 6<br />
2<br />
1.5<br />
1<br />
0.5<br />
0<br />
1984 1988 1992 1996 2000 2004<br />
23332321122122<br />
1.5<br />
0.5<br />
NL1<br />
0<br />
1984 1988 1992 1996 2000 2004<br />
589874<br />
2<br />
2<br />
1<br />
1.5<br />
1<br />
0.5<br />
2<br />
1.5<br />
1<br />
0.5<br />
NDS1<br />
SH1<br />
0<br />
1984 1988 1992 1996<br />
244<br />
2000 2004<br />
DK1<br />
0<br />
1984 1988 1992 1996 2000 2004<br />
333333<br />
ic<strong>al</strong> assessment criterion for mercury (OSPAR, 2004)<br />
in 2000/2003.<br />
Concentrations in blue mussel<br />
In subarea SH1, a significant reduction (factor 6)<br />
was re<strong>al</strong>ized b<strong>et</strong>ween 1994 and 2000, following<br />
the strong decrease of Elbe input (Figure 4.2.11).<br />
2<br />
1.5<br />
1<br />
0.5<br />
NL2<br />
0<br />
1984 1988 1992 1996 2000 2004<br />
9 11 11 10<br />
2<br />
1.5<br />
1<br />
0.5<br />
NDS2<br />
0<br />
1984 1988 1992 1996 2000 2004<br />
13 3 13 1815 3 2 11 11 11 19<br />
2<br />
1.5<br />
1<br />
0.5<br />
SH2<br />
0<br />
1984 1988 1992 1996 2000 2004<br />
2 2 2 4 2 3 2 2 2 2 1 1<br />
2<br />
1.5<br />
1<br />
0.5<br />
NL2<br />
0<br />
1984 1988 1992 1996 2000 2004<br />
46666642442222<br />
2<br />
1.5<br />
1<br />
0.5<br />
NDS2<br />
0<br />
1984 1988 1992 1996 2000 2004<br />
10 9 10 8 8 4<br />
2<br />
1.5<br />
1<br />
0.5<br />
DK2<br />
0<br />
1984 1988 1992 1996 2000 2004<br />
336376<br />
2<br />
1.5<br />
1<br />
0.5<br />
NL3<br />
0<br />
1984 1988 1992 1996 2000 2004<br />
8 5 13 6 5 6 1 4 3 12 10 6 10 6 1011<br />
2<br />
1.5<br />
1<br />
0.5<br />
NDS3<br />
0<br />
1984 1988 1992 1996 2000 2004<br />
8 1 7 10 3 6 5 10 2 10 2 3 9 3 3 9 12<br />
2<br />
1.5<br />
1<br />
0.5<br />
SH3<br />
0<br />
1984 1988 1992 1996 2000 2004<br />
3 5 15 3 6 9 3 3 4 3 3 4<br />
2<br />
1.5<br />
1<br />
0.5<br />
NL3<br />
0<br />
1984 1988 1992 1996 2000 2004<br />
2<br />
5 5 4 5 7 9 8 8 8 8 7 9 10 7 10 9 8 10<br />
NDS3<br />
1.5<br />
1<br />
0.5<br />
0<br />
1984 1988 1992 1996 2000<br />
44<br />
2004<br />
2<br />
SH3<br />
1.5<br />
1<br />
0.5<br />
0<br />
1984 1988 1992 1996 2000 2004<br />
2222221122<br />
2<br />
1.5<br />
1<br />
0.5<br />
DK3<br />
0<br />
1984 1988 1992 1996 2000 2004<br />
6 6 6<br />
4.2 <strong>Natur<strong>al</strong></strong> <strong>Contaminants</strong><br />
Speculatively, the slight, insignificant increase in<br />
the 2003 data may have been caused by the Elbe<br />
2002 flood. In subareas DK1 and DK2, however, a<br />
significant increase occurred of a factor of 2 b<strong>et</strong>ween1998<br />
and 2003. This might be the result of<br />
residu<strong>al</strong> sediment transport mediated mercury<br />
contamination originating from the Elbe.<br />
93<br />
Figure 4.2.10:<br />
Mercury (Hg) contents in<br />
Wadden Sea sediments<br />
(mg·kg -1 dry weight in the<br />
fraction
94<br />
Figure 4.2.12:<br />
Mercury (Hg) contents in<br />
muscle of Wadden Sea<br />
flounder Platichthys flesus<br />
(mg·kg -1 dry weight).<br />
Average (—) and minimum/<br />
maximum range (|) is<br />
shown.<br />
Wadden Sea Ecosystem No. 19 - 2005<br />
4.2 <strong>Natur<strong>al</strong></strong> <strong>Contaminants</strong><br />
0.8<br />
0.6<br />
0.4<br />
0.2<br />
10.4<br />
NL1<br />
0.0<br />
1984 1988 1992 1996 2000 2004<br />
25 29 22 25 25 25 25 25 25 25 25 25 25 25 25 25 25 25 23<br />
0.4<br />
0.3<br />
0.2<br />
0.1<br />
NDS1<br />
0.0<br />
1984 1988 1992 1996 2000 2004<br />
556115476<br />
0.4<br />
0.3<br />
0.2<br />
0.1<br />
SH1<br />
0.0<br />
1984 1988 1992 1996 2000 2004<br />
34 55 52 39 30 16 14 25<br />
In most subareas, mercury levels were a factor<br />
2 to 4 higher in 2002/2003 than the proposed<br />
background (OSPAR, 2002; assuming an average<br />
85% water content). Lowest levels were reached<br />
in subareas SH1 and NDS2, though still at the high<br />
end of the background. Highest levels were found<br />
in subareas DK2 and DK1, exceeding the background<br />
by a factor of 6 and 9 respectively.<br />
Concentrations in flounder<br />
The high variability of mercury concentrations in<br />
flounder muscle tissue complicate trend d<strong>et</strong>ection<br />
(Figure 4.2.12). Based on a gener<strong>al</strong> decrease<br />
in maxima, a downward trend by a factor of 4 can<br />
be observed in subareas NL1, NL3 and SH1. In subarea<br />
SH1, the occurrence of higher maxima in<br />
2003 may be related to the Elbe flood of 2002.<br />
Assuming 80% water content in muscle tissue,<br />
mercury levels are within the proposed background<br />
range (OSPAR, 2004).<br />
Concentrations in bird eggs<br />
Mercury contents in eggs of the common tern<br />
(Sterna hirundo) and oystercatcher (Haematopus<br />
ostr<strong>al</strong>egus) are reported in chapter 4.5. The initi<strong>al</strong><br />
strong decrease in this contents b<strong>et</strong>ween 1981<br />
and 1993 was continued, with the exception, however,<br />
of oystercatcher eggs from Trischen (SH1),<br />
0.4<br />
0.3<br />
0.2<br />
0.1<br />
NDS2<br />
0.0<br />
1984 1988 1992 1996 2000 2004<br />
7 29 9 10 5 10 5 39 27<br />
0.4<br />
0.3<br />
0.2<br />
0.1<br />
0.9<br />
NL3 0.65<br />
15 513 25 17 25 0.0<br />
1984 1988 1992 1996 2000 2004<br />
425 26 23 25 25 25 30 30 30 29 32 61<br />
0.4<br />
0.3<br />
0.2<br />
0.1<br />
NDS3<br />
0.0<br />
1984 1988 1992 1996 2000 2004<br />
9 10 5 30 13<br />
0.4<br />
0.3<br />
0.2<br />
0.1<br />
DK3<br />
0.0<br />
1984 1988 1992 1996 2000 2004<br />
10 10<br />
where a significant upward trend occurred. Ev<strong>al</strong>uation<br />
of the 6 year period 1998-2003 shows a<br />
significant upward trend for B<strong>al</strong>gzand (NL1),<br />
Trischen (SH1) and Langli (SH2) for mercury in<br />
oystercatcher eggs; at Minsener Oog (Jade) in common<br />
tern eggs, but no longer a significant trend<br />
in the Elbe subarea SH1.<br />
The relatively high B<strong>al</strong>gzand levels cannot be<br />
related to the IJsselmeer input and probably originate<br />
from loc<strong>al</strong> sources. The relatively high levels<br />
at Trischen, however, may be related to the input<br />
from Elbe and Weser.<br />
At the location of Minsener Oog (Jade, NDS3)<br />
concentrations in common tern eggs may be related<br />
to the mercury input from the Weser, which<br />
was increasing b<strong>et</strong>ween 1998/2000 and 2002 both<br />
in flux and concentration, suggesting that the<br />
feeding grounds are in the Weser estuary.<br />
4.2.2.5 Lead<br />
Input<br />
The dramatic reduction in the Elbe input and concentration<br />
stabilized at the 1994 level, with a<br />
slight increase up to 2002 (Figure 4.2.1).<br />
The load and concentration in the Weser were<br />
variable with a slight over<strong>al</strong>l increase (1985 compared<br />
with 2002). An intermediate concentration
200<br />
150<br />
100<br />
50<br />
200<br />
150<br />
100<br />
NL1<br />
0<br />
1984 1988 1992 1996 2000 2004<br />
1 6 11 11 11<br />
50<br />
NDS1<br />
0<br />
1984 1988 1992 1996 2000 2004<br />
7 3 10 12 21 1 5 11 10 2 2 11 4 4 20<br />
200<br />
SH1<br />
150<br />
100<br />
50<br />
0<br />
1984 1988 1992 1996 2000 2004<br />
4 14 7 13 5 5 5 5 1617 6<br />
200<br />
150<br />
100<br />
50<br />
DK1<br />
0<br />
1984 1988 1992 1996 2000 2004<br />
4 4<br />
200<br />
150<br />
100<br />
and input peak (1991-1999) temporarily caused<br />
more than a doubling of concentration and input.<br />
Year-averaged concentrations of lead in Elbe and<br />
Weser water, derived from OSPAR flux data, were<br />
at the same level and 2-3 times higher than in<br />
Lake IJssel, Ems and Eider in 2002.<br />
Lead input and concentrations of Lake IJssel<br />
and Ems did not show a significant trend. The Eider<br />
has a very sm<strong>al</strong>l input compared to the other<br />
rivers, but both its input and water concentration<br />
were about twice as high in 1996 – 2002 compared<br />
to 1990 – 1995. The source, however, is<br />
unknown.<br />
The atmospheric input of lead (Table 4.2.1) is<br />
about 4% of the tot<strong>al</strong> riverine input.<br />
QSR 1999<br />
The Elbe showed the strongest reduction in lead input b<strong>et</strong>ween<br />
1993 and 1994. This was reflected by decreasing levels<br />
blue mussels, but less prominent in sediments. The Weser<br />
showed large annu<strong>al</strong> and periodic<strong>al</strong> variations in both input<br />
and concentration which were suspected of increasing. Lead<br />
concentrations in the Weser surpassed those of the Elbe in<br />
the period 1994 – 1996. In the other Wadden Sea subareas<br />
no trends were d<strong>et</strong>ected.<br />
Over<strong>al</strong>l, lead concentrations in the Wadden Sea were close<br />
to background and within the ecotoxicologic<strong>al</strong> assessment<br />
criteria of OSPAR (1997).<br />
50<br />
NL2<br />
0<br />
1984 1988 1992 1996 2000 2004<br />
9 11 11 11<br />
200<br />
150<br />
100<br />
50<br />
NDS2<br />
0<br />
1984 1988 1992 1996 2000 2004<br />
13 3 13 1815 3 2 11 11 11 19<br />
200<br />
SH2<br />
150<br />
100<br />
50<br />
0<br />
1984 1988 1992 1996 2000 2004<br />
2 2 2 4 2 3 2 2 2 2 1 1<br />
200<br />
150<br />
100<br />
50<br />
DK2<br />
0<br />
1984 1988 1992 1996 2000 2004<br />
4 6<br />
200<br />
150<br />
100<br />
50<br />
NL3<br />
0<br />
1984 1988 1992 1996 2000 2004<br />
8 5 15 6 5 6 1 2 3 12 10 6 10 6 1012<br />
200<br />
150<br />
100<br />
50<br />
NDS3<br />
0<br />
1984 1988 1992 1996 2000 2004<br />
8 1 7 10 3 6 5 10 1 10 2 3 9 3 3 9 12<br />
200<br />
SH3<br />
150<br />
100<br />
50<br />
0<br />
1984 1988 1992 1996 2000 2004<br />
3 5 15 3 5 9 3 3 5 3 3 5<br />
4.2 <strong>Natur<strong>al</strong></strong> <strong>Contaminants</strong><br />
Concentrations in sediment<br />
Most subareas showed a downward trend of lead in<br />
sediment, which was most clear in subareas NL3<br />
and SH1 (Figure 4.2.13). Significant trends cannot<br />
be d<strong>et</strong>ermined due to large inter-sample variations,<br />
however both maxima and minima are<br />
decreasing. Particularly in subarea SH3, the maximum<br />
v<strong>al</strong>ues of both origin<strong>al</strong> and standardized<br />
data tend to be associated with very low silt (less<br />
than 1%
96<br />
Figure 4.2.14:<br />
Lead (Pb) contents in<br />
Wadden Sea SH3<br />
sediments (mg·kg -1 dry<br />
weight in the fraction
10<br />
8<br />
6<br />
4<br />
2<br />
NL1<br />
0<br />
1984 1988 1992 1996 2000 2004<br />
23332321122122<br />
10<br />
8<br />
6<br />
4<br />
2<br />
NDS1<br />
0<br />
1984 1988 1992 1996 2000 2004<br />
589874<br />
10<br />
SH1<br />
8<br />
6<br />
4<br />
2<br />
0<br />
1984 1988 1992 1996<br />
244<br />
2000 2004<br />
10<br />
8<br />
6<br />
4<br />
2<br />
DK1<br />
0<br />
1984 1988 1992 1996 2000 2004<br />
333333<br />
400<br />
300<br />
200<br />
100<br />
0<br />
1984 1988 1992 1996 2000 2004<br />
1 6 11 11 11<br />
400<br />
300<br />
200<br />
100<br />
NL1<br />
0<br />
1984 1988 1992 1996 2000 2004<br />
7 3 10 12 21 1 6 11 10 2 2 11 4 4 20<br />
400<br />
SH1<br />
300<br />
200<br />
100<br />
NDS1<br />
0<br />
1984 1988 1992 1996 2000 2004<br />
4 1471355 5 516176<br />
400<br />
300<br />
200<br />
100<br />
DK1<br />
0<br />
1984 1988 1992 1996 2000 2004<br />
4 4<br />
10<br />
8<br />
6<br />
4<br />
2<br />
NL2<br />
0<br />
1984 1988 1992 1996 2000 2004<br />
46666642442222<br />
10<br />
8<br />
6<br />
4<br />
2<br />
NDS2<br />
0<br />
1984 1988 1992 1996 2000 2004<br />
10 910884<br />
10<br />
8<br />
6<br />
4<br />
2<br />
DK2<br />
0<br />
1984 1988 1992 1996 2000 2004<br />
336376<br />
400<br />
300<br />
200<br />
100<br />
0<br />
1984 1988 1992 1996 2000 2004<br />
9 11 11 11<br />
400<br />
300<br />
200<br />
100<br />
NL2<br />
0<br />
1984 1988 1992 1996 2000 2004<br />
13 3 13 1815 3 2 11 11 11 20<br />
400<br />
SH2<br />
300<br />
200<br />
100<br />
NDS2<br />
0<br />
1984 1988 1992 1996 2000 2004<br />
2 2 2 4 2 3 2 2 2 2 1 1<br />
400<br />
300<br />
200<br />
100<br />
DK2<br />
0<br />
1984 1988 1992 1996 2000 2004<br />
6 6<br />
10<br />
8<br />
6<br />
4<br />
2<br />
NL3<br />
0<br />
1984 1988 1992 1996 2000 2004<br />
5 4 4 5 7 9 8 8 8 8 7 9 10 7 10 9 8 10<br />
10<br />
8<br />
6<br />
4<br />
2<br />
NDS3<br />
0<br />
1984 1988 1992 1996 2000<br />
44<br />
2004<br />
10<br />
SH3<br />
8<br />
6<br />
4<br />
2<br />
0<br />
1984 1988 1992 1996 2000 2004<br />
2222221122<br />
10<br />
8<br />
6<br />
4<br />
2<br />
DK3<br />
0<br />
1984 1988 1992 1996 2000 2004<br />
6 6 6<br />
400<br />
300<br />
200<br />
100<br />
NL3<br />
0<br />
1984 1988 1992 1996 2000 2004<br />
9 5 15 6 5 6 1 4 3 12 10 6 10 6 10 12<br />
400<br />
300<br />
200<br />
100<br />
NDS3<br />
0<br />
1984 1988 1992 1996 2000 2004<br />
8 1 7 10 3 5 5 10 2 10 2 3 9 3 3 9 12<br />
400<br />
300<br />
200<br />
100<br />
SH3<br />
0<br />
1984 1988 1992 1996 2000 2004<br />
3 5 15 3 4 9 3 3 4 3 3 4<br />
4.2 <strong>Natur<strong>al</strong></strong> <strong>Contaminants</strong><br />
97<br />
Figure 4.2.16:<br />
Lead (Pb) contents in<br />
Wadden Sea blue mussel<br />
Mytilus edulis (mg·kg -1 dry<br />
weight). Average (—) and<br />
minimum/maximum range<br />
(|) is shown.<br />
Figure 4.2.17:<br />
Zinc (Zn) contents in<br />
Wadden Sea sediments<br />
(mg·kg -1 dry weight in the<br />
fraction
98<br />
Figure 4.2.18:<br />
Zinc (Zn) contents in<br />
Wadden Sea blue mussel<br />
Mytilus edulis (mg·kg -1 dry<br />
weight). Average (—) and<br />
minimum/maximum range<br />
(|) is shown.<br />
Wadden Sea Ecosystem No. 19 - 2005<br />
4.2 <strong>Natur<strong>al</strong></strong> <strong>Contaminants</strong><br />
160<br />
140<br />
120<br />
100<br />
80<br />
60<br />
40<br />
20<br />
0<br />
1984 1988<br />
NL1<br />
1992 1996 2000 2004<br />
23332321122122<br />
160<br />
140<br />
120<br />
100<br />
80<br />
60<br />
40<br />
20<br />
0<br />
1984 1988<br />
NDS1<br />
1992 1996 2000 2004<br />
589874<br />
160<br />
140<br />
120<br />
100<br />
80<br />
60<br />
40<br />
20<br />
0<br />
SH1<br />
1984 1988 1992 1996<br />
244<br />
2000 2004<br />
160<br />
140<br />
120<br />
100<br />
80<br />
60<br />
40<br />
20<br />
0<br />
1984 1988<br />
DK1<br />
1992 1996 2000 2004<br />
333333<br />
Concentrations in blue mussel<br />
It is well known that blue mussels are capable of<br />
regulating specific<strong>al</strong>ly their intern<strong>al</strong> zinc concentrations<br />
through the formation of m<strong>et</strong><strong>al</strong>lothionines.<br />
Nevertheless, despite the variable concentrations,<br />
a distinct upward trend b<strong>et</strong>ween 1989<br />
and 1999 can be discerned in subarea NL1 and to<br />
a lesser extent in NL2 (Figure 4.2.18). On the other<br />
hand, subareas SH1 and NDS2 show a decrease<br />
in zinc concentrations b<strong>et</strong>ween 1996 and 2002.<br />
As a result of the increase subareas NL1 to NL3,<br />
NDS3, SH1and DK1 were <strong>al</strong>l at the comparable<br />
level of about 100 mg kg-1 dry weight in 2002.<br />
Lowest levels were found in subarea NDS2, followed<br />
by NDS1, SH3, DK2 and DK3. Zinc levels are<br />
at proposed background levels in <strong>al</strong>l subareas of<br />
the Wadden Sea (OSPAR, 2004; assuming 85%<br />
water content).<br />
4.2.2.7 Summary of m<strong>et</strong><strong>al</strong> trends and<br />
targ<strong>et</strong> ev<strong>al</strong>uation<br />
• Major reductions in input and concentration<br />
of m<strong>et</strong><strong>al</strong>s in the Wadden Sea mainly occurred<br />
in the late 1980s until the early 1990s, continuing<br />
moderately until 2002.<br />
• The Elbe region (subarea SH1) is an exception,<br />
where levels of cadmium, mercury, lead and,<br />
160<br />
140<br />
120<br />
100<br />
80<br />
60<br />
40<br />
20<br />
0<br />
1984 1988<br />
NL2<br />
1992 1996 2000 2004<br />
46666642442222<br />
160<br />
140<br />
120<br />
100<br />
80<br />
60<br />
40<br />
20<br />
0<br />
1984 1988<br />
NDS2<br />
1992 1996 2000 2004<br />
10 910884<br />
160<br />
140<br />
120<br />
100<br />
80<br />
60<br />
40<br />
20<br />
0<br />
1984 1988<br />
DK2<br />
1992 1996 2000 2004<br />
336376<br />
160<br />
140<br />
120<br />
100<br />
80<br />
60<br />
40<br />
20<br />
0<br />
1984<br />
229<br />
NL3<br />
1988 1992 1996 2000 2004<br />
5 5 4 5 7 9 8 8 8 8 7 9 10 7 10 9 8 10<br />
160<br />
140<br />
120<br />
100<br />
80<br />
60<br />
40<br />
20<br />
0<br />
1984 1988<br />
NDS3<br />
1992 1996 2000<br />
44<br />
2004<br />
60<br />
40<br />
20<br />
0<br />
SH3<br />
2222221122<br />
80<br />
160<br />
140<br />
120<br />
100<br />
1984 1988 1992 1996 2000 2004<br />
160<br />
140<br />
120<br />
100<br />
80<br />
60<br />
40<br />
20<br />
0<br />
1984 1988<br />
DK3<br />
1992 1996 2000 2004<br />
6 6 6<br />
only in blue mussels, zinc decreased in the late<br />
1990s.<br />
• The proposed background in sediments was<br />
exceeded by mercury (factor 3-10) and lead<br />
(factor 2-4) and thus the Targ<strong>et</strong> was not m<strong>et</strong>.<br />
Zinc exceeded the background only in subarea<br />
DK1 (by a factor 2).<br />
• Cadmium (factor 2-3), copper (factor 3 in SH3),<br />
mercury (factor 2-9) and lead (factor 2-4 in<br />
NL1 to NL3) are exceeding the proposed blue<br />
mussel background and thus the Targ<strong>et</strong>.<br />
• At one anom<strong>al</strong>ous location in subarea SH3, the<br />
backgrounds of copper, lead and zinc were<br />
exceeded. Also the Ecologic<strong>al</strong> Assessment Criterion<br />
(EAC) for zinc was exceeded at this one<br />
sandy location. A similar situation was observed<br />
in subarea DK2 for the EAC for copper.<br />
Wh<strong>et</strong>her this is re<strong>al</strong> or an an<strong>al</strong>ytic<strong>al</strong> or crosscontamination<br />
error needs to be investigated.<br />
The sources of copper and both lead and zinc<br />
are presumably not the same.<br />
• Incidents, such as the Elbe flood of 2002,<br />
showed short-term effects only (increased cadmium<br />
and mercury levels in flounder liver and<br />
muscle respectively). This effect could not be<br />
demonstrated in sediment or blue mussels due
to the absence of data for these matrices and<br />
for other m<strong>et</strong><strong>al</strong>s.<br />
Nickel, a new compound of high priority in both<br />
OSPAR and Water Framework Directive, needs to<br />
be included in the monitoring of the Wadden Sea.<br />
Harmonization of m<strong>et</strong>hods to improve comparability,<br />
and qu<strong>al</strong>ity and availability of data stored<br />
in databases has progressed little since the 1999<br />
QSR, neither for JAMP nor TMAP.<br />
4.2.3 Organic micropollutants (PAHs)<br />
4.2.3.1 Data<br />
The availability of data for polyaromatic hydrocarbons<br />
(PAHs) is limited to concentrations in sediments<br />
and blue mussels (Mytilus edulis) reported<br />
to OSPAR. This concerns the ‘6 of Borneff’ (Fluoranthene,<br />
Benzo-b/k-Fluoranthene, Benzo-a-<br />
Pyrene, Indeno-123, cd-Pyrene, and Benzo-ghi-<br />
Perylene).<br />
4.2.3.2 Inputs<br />
No data is available for riverine inputs, in part<br />
because PAHs dissolve poorly in water. Atmospheric<br />
input of PAHs has been reported for the Dutch<br />
Wadden Sea for 2000 and 2001 from modelling<br />
and ground station data (Duyzer and Vonk, 2002;<br />
Table 4.2.2). An average of ca. 800 kg y-1 of 6 of<br />
Borneff PAHs is deposited in the Dutch Wadden<br />
Sea. Except for dibenzo(ah)anthracene, the input<br />
in 2001 was on average 40% lower than in 2000.<br />
1.0<br />
0.8<br />
0.6<br />
0.4<br />
0.2<br />
0.0<br />
2.0<br />
1.5<br />
1.0<br />
0.5<br />
0.0<br />
NL1<br />
1987 1990 1993 1996 1999 2002<br />
NL1<br />
1987 1990 1993 1996 1999 2002<br />
1.0<br />
0.8<br />
0.6<br />
0.4<br />
0.2<br />
0.0<br />
2.0<br />
1.5<br />
1.0<br />
0.5<br />
0.0<br />
NL2<br />
1987 1990 1993 1996 1999 2002<br />
NL2<br />
Dutch Wadden Sea<br />
Compound 2000 (kg/y) 2001 (kg/y)<br />
Acenaphthene 712 461<br />
Acenaphtylene 19 22<br />
Anthracene 60 35<br />
Benzo(a)anthracene 23 17<br />
Benzo(a)pyrene 36 31<br />
Benzo(b)fluoranthene 72 78<br />
Benzo(ghi)perylene 33 34<br />
Benzo(k)fluoranthene 46 61<br />
Chrysene 71 46<br />
Dibenzo(ah)anthracene 4 10<br />
Phenanthrene 1863 1442<br />
Fluoranthene 553 590<br />
Fluorene 1142 711<br />
Indeno(123,ghi)pyrene 29 34<br />
Naphth<strong>al</strong>ene* 1188 1017<br />
Pyrene 274 296<br />
Sum 6 Borneff (bold) 769 828<br />
3.55<br />
1987 1990 1993 1996 1999 2002<br />
1.0<br />
0.8<br />
0.6<br />
0.4<br />
0.2<br />
0.0<br />
2.0<br />
1.5<br />
1.0<br />
0.5<br />
0.0<br />
NL3<br />
1987 1990 1993 1996 1999 2002<br />
NL3<br />
1987 1990 1993 1996 1999 2002<br />
4.2 <strong>Natur<strong>al</strong></strong> <strong>Contaminants</strong><br />
4.2.3.3 Concentrations in sediments<br />
The sum of 6 of Borneff PAHs in the sediment fraction<br />
100<br />
Table 4.2.3:<br />
Agreed Ecotoxicologic<strong>al</strong><br />
Assessment Criteria by<br />
OSPAR (2004). Sediment<br />
was not unambiguously<br />
defined, it is assumed that<br />
the < 63 µm fraction was<br />
meant. For w<strong>et</strong> weight to<br />
dry weight conversions:<br />
mussel was s<strong>et</strong> at 85% WW<br />
and flounder at 80% WW<br />
(muscle tissue). DW = Dry<br />
weight, WW = w<strong>et</strong> weight.<br />
f: firm; p: provision<strong>al</strong>, n.d.:<br />
no or insufficient data<br />
available, n.r.: not relevant<br />
to current JAMP.<br />
Wadden Sea Ecosystem No. 19 - 2005<br />
4.2 <strong>Natur<strong>al</strong></strong> <strong>Contaminants</strong><br />
Compound Water Sediment Fish Mussel<br />
(µg l -1 ) (mg kg -1 DW) (mg kg -1 WW) (mg kg -1 DW)<br />
As 1-10 1-10<br />
Cd 0.01-0.1 0.1-1<br />
Cr 1-10 10-100<br />
Cu 0.005-0.05 5-50<br />
Hg0.005-0.05 0.05-0.5<br />
Ni 0.1-1 5-50<br />
Pb 0.5-5 5-50<br />
Zn 0.5-5 50-500<br />
DDE n.r. 0.0005-0.005 (p) 0.005-0.05 (f) 0.005-0.05 (f)<br />
Dieldrin n.r. 0.0005-0.005 (p) 0.005-0.05 (f) 0.005-0.05 (f)<br />
Lindane (-HCH) 0.0005-0.005 (f) n.r. 0.0005-0.005 (f) n.r.<br />
Napth<strong>al</strong>ene 5-50 (f) 0.005-0.5 (f) n.r. 0.5-5 (p)<br />
Phenanthrene 0.5-5 (p) 0.1-1 (f) n.r. 5-50 (p)<br />
Anthracene 0.001-0.01 (p) 0.05-0.5 (f) n.r. 0.005-0.05 (p)<br />
Fluoranthene 0.01-0.1 (p) 0.5-5 (p) n.r. 1-10 (p)<br />
Pyrene 0.05-0.5 (p) 0.05-0.5 (p) n.r. 1-10 (p)<br />
Benzo-a-Anthracene n.d. 0.1-1 (p) n.r. n.d.<br />
Chrysene n.d. 0.1-1 (p) n.r. n.d.<br />
Benzo-k-Fluoranthene n.d. n.d. n.r. n.d.<br />
Benzo-a-Pyrene 0.01-0.1 (p) 0.1-1 (p) n.r. 5-50 (p)<br />
Benzo-ghi-Perylene n.d. n.d. n.r. n.d.<br />
Indeno-123,cd-Pyrene n.d. n.d. n.r. n.d.<br />
Sum 7 PCB n.r. 0.001-0.01 (p) 0.001-0.01 (f) 0.005-0.05 (f)<br />
TBT 0.00001-0.0001 (f) 0.000005-0.00005 (p) n.r. 0.001-0.01 (f)<br />
4.2.3.4 Summary of trends and targ<strong>et</strong><br />
ev<strong>al</strong>uation<br />
The available data on organic micropollutants does<br />
not show a significant trend neither in deposition<br />
nor in sediment content.<br />
The sediment content of PAHs in the Wadden<br />
Sea is slightly elevated when compared to Barents<br />
Sea sediments (~0.87 mg kg -1 at 5% organic<br />
References<br />
Bellert, E.G., Åkerman, J.E., Koopmans, M.P. and van de Ven,<br />
C.L.M., 2004. Anthropogenic inputs by shipping and atmospheric<br />
deposition into the Dutch Wadden Sea and Ems-Dollard.<br />
RIKZ report RIKZ/AB/2004.612. July, 2004; in Dutch.<br />
Bleeker, A. and Duyzer, J.H., 2002. Inputs of contaminants to<br />
the surface waters of the Sanitation Board of the Holland<br />
Islands and Forelands. (in Dutch: Belasting van h<strong>et</strong> oppervlakewater<br />
in h<strong>et</strong> beheersgebied van h<strong>et</strong> Zuiveringschap Hollandse<br />
Eilanden en Waarden). TNO Report: R2002/231<br />
Cato, I., 1977. Recent sedimentologic<strong>al</strong> and geochemic<strong>al</strong> conditions<br />
and pollution problems in two marine areas in southwestern<br />
Sweden. Striae 6, 158 pp. Upps<strong>al</strong>a.<br />
Duyzer, J.H. and Vonk, A.W., 2002. Atmospheric deposition of<br />
pesticides, PAHs and PCBs in The N<strong>et</strong>herlands. TNO report<br />
R2002/606 (in Dutch).<br />
Johannesson, L., Stevens, R., Eriksson, K., 2003. The influence<br />
of an urban stream on sediment geochemistry in Göteborg<br />
Harbour, Sweden Environment<strong>al</strong> Geology 43 (4): 434-444.<br />
Koopmann, C., F<strong>al</strong>ler, J., Bernem, K.-H. van, Prange, A. and<br />
Müller, A., 1993. Schadstoffkartierung in Sedimenten des deutschen<br />
Wattenmeeres Juni 1989-Juni 1992. GKSS 88.156.<br />
carbon), but well below Skagerrak sediments<br />
(~2.36 mg kg -1 at 5% organic carbon). No natur<strong>al</strong><br />
background was denoted by OSPAR (2004).<br />
For individu<strong>al</strong> PAHs, ecotoxicologic<strong>al</strong> assessment<br />
criteria were agreed by OSPAR (2004), a few<br />
of which are firm (Table 4.2.3). None of the PAHs<br />
exceeded the range of these ecotoxicologic<strong>al</strong> assessment<br />
criteria.<br />
OSPAR, 1997. Annex 5: Agreed Background/Reference concentrations<br />
for contaminants in sea water, biota and sediment.<br />
Annex 6: Agreed ecotoxicologic<strong>al</strong> assessment criteria<br />
for trace m<strong>et</strong><strong>al</strong>s, PCBs, PAHs, TBT and some organochlorine<br />
pesticides. Joint me<strong>et</strong>ing of the Oslo and Paris Commissions,<br />
Brussels, 2-5 September 1997.<br />
OSPAR, 2002. OSPAR List of Chemic<strong>al</strong>s for Priority Action (Update<br />
2002). OSPAR Me<strong>et</strong>ing, Amsterdam 24-28 June, 2002.<br />
OSPAR, 2003. An Over<strong>al</strong>l Assessment of the Dumping of Wastes<br />
at Sea from the mid-1980’s to 2001 in the OSPAR Area. Biodiversity<br />
and Dumped Materi<strong>al</strong> Series, OSPAR Commission 2003,<br />
ISBN 1-904426-09-3.<br />
OSPAR, 2004. Progress report on the organisation of the<br />
OSPAR/ICES workshop on BRCs and EACs. 8-13 February, 2004,<br />
The Hague, The N<strong>et</strong>herlands.<br />
Pachur, H.-J., Ricking, M., Sommerfeldt, B., Varlemann, R.,<br />
<strong>Bakker</strong>, J.F. and Smedes, F., 1995. Geoaccumulation of environment<strong>al</strong><br />
contaminants in sediments of the lower Ems river<br />
in the framework of the European project ‘Chemic<strong>al</strong> Time<br />
Bombs’. Report no. 107 01 016/17 of the Feder<strong>al</strong> Environment<strong>al</strong><br />
Agency (UBA), Berlin.
4.3.1 Introduction<br />
Compounds which are not of biogeochemic<strong>al</strong> origin<br />
and usu<strong>al</strong>ly solely man-made are referred to<br />
as ‘xenobiotics’, unknown to nature as we know<br />
it. A large vari<strong>et</strong>y of xenobiotics are included in<br />
the ‘List of chemic<strong>al</strong>s for priority action’ (OSPAR,<br />
2002) and the proposed ‘Priority list’ of the Water<br />
Framework Directive. Some compound groups,<br />
however, though classified as xenobiotics have<br />
been found to be produced in minute amounts by<br />
versatile micro-organisms such as fungi (Hoekstra<br />
and de Leer, 1995). Most of the PBT criteria (Persistant,<br />
Bioaccumulative, Toxic) apply to xenobiotic<br />
compounds, making them environment<strong>al</strong>ly<br />
hazardous. An important, newly emerging mode<br />
of ‘toxicity’ from many xenobiotics is hormon<strong>al</strong><br />
disruption (see chapter 4.6).<br />
Targ<strong>et</strong><br />
Concentrations of man-made substances as resulting<br />
from zero discharges<br />
The 1999 QSR summarized that, in gener<strong>al</strong>, riverine<br />
inputs and concentrations in sediment and<br />
biota of most of the investigated xenobiotics had<br />
decreased, but that for some compounds elevated<br />
concentrations could still be observed, especi<strong>al</strong>ly<br />
with regard to tributyltin (TBT).<br />
4.3.2 PCBs<br />
4.3.2.1 Input<br />
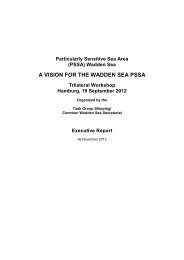
Riverine inputs of PCBs as reported by OSPAR are<br />
shown in Figure 4.3.1. The Elbe shows the most<br />
200<br />
150<br />
100<br />
50<br />
0<br />
1985 1990 1995 2000<br />
100<br />
80<br />
60<br />
40<br />
20<br />
150<br />
0<br />
1985 1990 1995 2000<br />
PCBs (kg.y -1 )<br />
Lake<br />
IJssel<br />
Weser<br />
Elbe<br />
Ems<br />
Eider<br />
PCBs (kg.y-1 )<br />
standard flow 109m3.y-1 Lake<br />
IJssel<br />
Weser<br />
Elbe<br />
Ems<br />
Eider<br />
remarkable decrease in PCB input b<strong>et</strong>ween 1988<br />
and 1991. The dry year of 1996 rendered a relative<br />
peak in PCB input and water concentration in<br />
the Weser and Ems. The relative peak concentration<br />
of PCBs was highest in the Weser and Ems.<br />
Wh<strong>et</strong>her concentration peaks and relatively dry<br />
years correlate is still not clear (cf. de Jong <strong>et</strong> <strong>al</strong>.,<br />
1999). PCB inputs have not reported for the Eider<br />
since 1997 and not for the Elbe since 2000. Weser<br />
and Ems water concentrations are amongst the<br />
highest, being about twice as high as in Lake IJssel.<br />
Weser inputs seem currently the highest, in<br />
the absence of data for the Elbe and Eider.<br />
Atmospheric input as modelled for the Dutch<br />
Wadden Sea by Duyzer and Vonk (2002) is presented<br />
in Table 4.3.1. This limited data suggests a<br />
reduction b<strong>et</strong>ween 2000 and 2001; confirmation<br />
by extended monitoring is required.<br />
Dispos<strong>al</strong> of dredged materi<strong>al</strong> from harbors in<br />
estuaries is a displacement of deposited mainly<br />
marine suspended particulate matter (SPM). The<br />
physic<strong>al</strong> impact by volume and the trend in contaminant<br />
levels may be considered as qu<strong>al</strong>ity cri-<br />
QSR 1999<br />
The Elbe input reduced dramatic<strong>al</strong>ly b<strong>et</strong>ween 1989 and 1991.<br />
The inputs of Lake IJssel, Ems, Weser and Eider fluctuate<br />
around a comparable level. It is suggested that river flow<br />
reduction after a w<strong>et</strong> period causes a concentration increase<br />
in the first year after the reduction. The following years PCB<br />
concentrations drop again.<br />
PCB concentrations in sediments, mussel and bird eggs show<br />
a negative trend b<strong>et</strong>ween 1985 and 1991 of 50 – 75%. In<br />
the case of the Elbe this was clearly correlated with the<br />
riverine input, which increased again b<strong>et</strong>ween 1994 and<br />
500<br />
400<br />
300<br />
200<br />
100<br />
0<br />
1980 1985 1990 1995 2000 2005<br />
250<br />
200<br />
150<br />
100<br />
50<br />
0<br />
1985 1990 1995 2000<br />
gHCH (kg.y -1 )<br />
Lake<br />
IJssel<br />
Weser<br />
Elbe<br />
Ems<br />
Eider<br />
gHCH (kg.y-1 )<br />
standard flow 109m3.y-1 Lake<br />
IJssel<br />
Weser<br />
Elbe<br />
Ems<br />
Eider<br />
101<br />
4.3 Xenobiotics<br />
Joop F. <strong>Bakker</strong><br />
Martine van den Heuvel-<br />
Greve<br />
Dick V<strong>et</strong>haak<br />
Figure 4.3.1:<br />
OSPAR reported fluvi<strong>al</strong><br />
PCBs and Lindane (-HCH)<br />
emissions (kg·y -1 ) into the<br />
Wadden Sea. Top panels<br />
show actu<strong>al</strong> input rates<br />
bottom panels at<br />
standardized flow (10 9<br />
m 3 ·y -1 ) (sources: D:<br />
Umweltbundesamt; NL:<br />
Rijkswaterstaat).<br />
Wadden Sea Ecosystem No. 19 - 2005
102<br />
Table 4.3.1:<br />
Atmospheric deposition of<br />
Sum of 6 PCB congeners in<br />
the Dutch Wadden Sea<br />
area (source: Duyzer and<br />
Vonk, 2002.<br />
Figure 4.3.2:<br />
Trends in PCB<br />
concentrations in<br />
Rotterdam harbour dredged<br />
materi<strong>al</strong> (mg kg -1 dry<br />
weight, fraction < 2 mm)<br />
disposed of at sea (source:<br />
OSPAR, 2003).<br />
Figure 4.3.3:<br />
Average 6 PCB (PCB 28,<br />
101, 118, 138, 153, 180)<br />
contents of sediment (µg<br />
kg -1 at 5% organic carbon).<br />
In rec<strong>al</strong>culation to 7 PCB<br />
(including PCB 52) for<br />
comparison with OSPAR<br />
data, it was assumed that<br />
PCB 52 represents 1% of<br />
the mixture. Vertic<strong>al</strong> lines<br />
represent the range<br />
b<strong>et</strong>ween maximum and<br />
minimum data.<br />
Wadden Sea Ecosystem No. 19 - 2005<br />
4.3 Xenobiotics<br />
Dutch Wadden Sea<br />
Compound 2000 (kg y -1 ) 2001 (kg y -1 )<br />
Sum of CBs 28, 101, 118, 9.2 2.9<br />
138, 153, 180<br />
Lindane (-HCH) 30 15<br />
Sum o,p’-DDD (Dichlorodi- 7 1<br />
phenyldichloro<strong>et</strong>hane) /<br />
DDE (Dichlorodiphenyldichloro<strong>et</strong>hylene)<br />
Hexachlorobenzene 3 2<br />
mg.kg -1 dry weight<br />
0.20<br />
0.15<br />
0.10<br />
0.05<br />
0.00<br />
1986 1988 1990 1992 1994 1996 1998 2000 2002<br />
teria (OSPAR, 2003). As an example, the trend of<br />
PCB concentrations in Rotterdam harbour sludge<br />
(fraction
NL1<br />
200<br />
160<br />
120<br />
80<br />
40<br />
0<br />
1984 1988 1992 1996 2000 2004<br />
23332321122122<br />
200<br />
160<br />
120<br />
80<br />
40<br />
200<br />
160<br />
120<br />
NDS1<br />
0<br />
1984 1988 1992 1996 2000 2004<br />
589874<br />
80<br />
40<br />
200<br />
160<br />
120<br />
SH1<br />
0<br />
1984 1988 1992 1996 2000 2004<br />
4444445 3<br />
80<br />
40<br />
DK1<br />
0<br />
1984 1988 1992 1996 2000 2004<br />
333333<br />
200<br />
160<br />
120<br />
<strong>al</strong>l trend seems to be downward, reaching a level<br />
of about 40 µg kg-1 dry weight in 2002/03, which<br />
is intermediate b<strong>et</strong>ween NL1, NL2 and DK1 to DK3.<br />
The concentrations of 6PCB in blue mussels<br />
exceed the OSPAR (2004) maximum background<br />
range by a factor of 6 (DK) to 35 (NL), assuming<br />
an 85% water content of the blue mussel tissues.<br />
Based on 6PCB and taking into account a 1%<br />
contribution of PCB 52 in 7PCBs, concentrations<br />
in the Danish Wadden Sea are within the range of<br />
the firm ecotoxicologic<strong>al</strong> assessment criterion<br />
(OSPAR, 2004). Concentrations in subareas NL3<br />
to SH3 are at the maximum of the range, and in<br />
NL1 and NL2 exceeded the range up to a factor of<br />
2.<br />
4.3.2.4 Concentrations in flounder liver<br />
The longest available time series (for subarea NL3),<br />
6PCB concentrations show a consistent decrease<br />
from 1986 to about 1998. Since then, no further<br />
decrease seems to occur (Figure 4.3.5). For other<br />
subareas of the Wadden Sea data series are much<br />
shorter, and do not show an over<strong>al</strong>l trend<br />
Recent 6PCB levels in flounder liver are comparable<br />
in subareas NL1 to SH1 (about 100 µg kg- 1 w<strong>et</strong> weight). In subarea DK3, levels are a factor<br />
6-7 lower (16 µg kg-1 w<strong>et</strong> weight). The concentrations<br />
in subareas NL1 to SH1 are at the maxi-<br />
80<br />
40<br />
NL2<br />
0<br />
1984 1988 1992 1996 2000 2004<br />
46566642442222<br />
200<br />
160<br />
120<br />
80<br />
40<br />
200<br />
160<br />
120<br />
NDS2<br />
0<br />
1984 1988 1992 1996 2000 2004<br />
10 910884<br />
80<br />
40<br />
DK2<br />
0<br />
1984 1988 1992 1996 2000 2004<br />
336376<br />
200<br />
160<br />
120<br />
80<br />
40<br />
NL3<br />
0<br />
1984 1988 1992 1996 2000 2004<br />
200<br />
160<br />
114578888871525435<br />
NDS3<br />
120<br />
80<br />
40<br />
0<br />
200<br />
160<br />
120<br />
80<br />
40<br />
200<br />
160<br />
120<br />
mum, those in subarea DK3 at the lower end of<br />
the firm ecotoxicologic<strong>al</strong> assessment criterion<br />
(EAC) (OSPAR, 2004). Adult flounders exceed the<br />
maximum EAC by a factor of 2 to 4.<br />
4.3.2.5 Concentrations in bird eggs<br />
The long-term data for concentrations of PCBs in<br />
eggs of the common tern and oystercatcher show<br />
a rather strong decrease until ca. 1992, after which<br />
trends were not clear any more. In recent years in<br />
some subareas of the Wadden Sea, concentrations<br />
seem to be increasing again (see chapter 4.5).<br />
The concentrations of 6PCB congeners in common<br />
tern (Sterna hirundo) in 2002 show a spati<strong>al</strong><br />
gradient of v<strong>al</strong>ues decreasing from west (NL1) to<br />
north (DK3), with the Elbe estuary (SH1) being an<br />
exception and showing the highest v<strong>al</strong>ues (Figure<br />
4.5.2). In the oystercatcher (Haematopus ostr<strong>al</strong>egus)<br />
the PCB concentrations are more equ<strong>al</strong>ly distributed,<br />
with the exception of Sk<strong>al</strong>lingen (DK3),<br />
where concentrations are lower by a factor of 4-<br />
5.<br />
Concentrations in eggs of the common tern are<br />
on average twice as high as in eggs of the oystercatcher.<br />
This can be attributed to the higher trophic<br />
level, and therefore a higher biomagnification factor,<br />
of the common tern, a fish eater, as compared<br />
to the oystercatcher, a benthos eater.<br />
393<br />
1984 1988 1992 1996 2000<br />
44<br />
2004<br />
SH3<br />
0<br />
1984 1988 1992 1996 2000 2004<br />
222111 22<br />
80<br />
40<br />
DK3<br />
4.3 Xenobiotics<br />
0<br />
1984 1988 1992 1996 2000 2004<br />
6 66<br />
103<br />
Figure 4.3.4:<br />
Average 6 PCB (PCB 28,<br />
101, 118, 138, 153, 180)<br />
contents of blue mussel<br />
(Mytilus edulis) tissue (µg<br />
kg -1 dry weight). In<br />
rec<strong>al</strong>culation to 7 PCB<br />
(including PCB 52) for<br />
comparison with OSPAR<br />
data, it was assumed that<br />
PCB 52 represents 1% of<br />
the mixture. Vertic<strong>al</strong> lines<br />
represent the range<br />
b<strong>et</strong>ween maximum and<br />
minimum data.<br />
Wadden Sea Ecosystem No. 19 - 2005
104<br />
Figure 4.3.5:<br />
Average 6 PCB (PCB 28,<br />
101, 118, 138, 153, 180)<br />
contents of flounder<br />
(Platichthys flesus) liver<br />
tissue (µg kg -1 w<strong>et</strong> weight).<br />
In rec<strong>al</strong>culation to 7 PCB<br />
(including PCB 52) for<br />
comparison with OSPAR<br />
data, it was assumed that<br />
PCB 52 represents 1% of<br />
the mixture. Vertic<strong>al</strong> lines<br />
represent the range<br />
b<strong>et</strong>ween maximum and<br />
minimum data.<br />
Wadden Sea Ecosystem No. 19 - 2005<br />
4.3 Xenobiotics<br />
400<br />
300<br />
200<br />
100<br />
NL1<br />
0<br />
1984 1988 1992 1996 2000 2004<br />
400<br />
25 25 25 25 25 25 21<br />
NDS1<br />
300<br />
200<br />
100<br />
0<br />
1984 1988 1992 1996 2000 2004<br />
5561156<br />
400<br />
SH1<br />
300<br />
200<br />
100<br />
0<br />
1984 1988 1992 1996 2000 2004<br />
7 11 2815 7 3 5 4<br />
400<br />
300<br />
200<br />
100<br />
4.3.3 Lindane (-HCH)<br />
Lindane is a neurotoxin and energy m<strong>et</strong>abolism<br />
inhibitor. Crustaceans are especi<strong>al</strong>ly sensitive; the<br />
inhibiting effect on carbohydrate m<strong>et</strong>abolism affects<br />
winter surviv<strong>al</strong>. The compound is carcinogenic<br />
and active as an endocrine disrupter in birds<br />
and mamm<strong>al</strong>s. M<strong>et</strong>abolism is impeded by presence<br />
of chlorobenzenes. Lindane is still used in<br />
creams and shampoos to control lice and mites.<br />
Lindane is one of the hexachlorocyclohexane<br />
isomers and most frequently used, but is in fact<br />
the one of least environment<strong>al</strong> concern. The -<br />
HCH isomer, <strong>al</strong>ways occurring in the technic<strong>al</strong> Lindane<br />
mixture, is considered a larger problem, since<br />
QSR 1999<br />
The Elbe input of Lindane (-hexachlorocyclohexane) sharply<br />
decreased b<strong>et</strong>ween 1985 and 1992 and showed an intermediate<br />
peak b<strong>et</strong>ween 1993 and 1996. The Lindane input<br />
pattern was correlated with the flow rate pattern of the<br />
River Elbe. Lake IJssel, Weser and Ems showed a comparable<br />
reduction b<strong>et</strong>ween 1985 and 1996.<br />
The input reduction was reflected in Lindane concentrations<br />
in bird eggs, except in the Eider area (subarea SH2) in eggs<br />
of the common tern (Sterna hirundo). Lindane water concentrations<br />
were within the range of the OSPAR provision<strong>al</strong><br />
ecotoxicologic<strong>al</strong> assessment criterion (EAC) of 5-50 ng·l-1 .<br />
NDS2<br />
0<br />
1984 1988 1992 1996 2000 2004<br />
6 9 10 5 10 5 4 4<br />
400<br />
300<br />
200<br />
100<br />
640<br />
NL3 1087<br />
0<br />
1984 1988 1992 1996 2000 2004<br />
400<br />
9 251325 6 25 5 22222225303030302327<br />
NDS3<br />
300<br />
200<br />
100<br />
0<br />
1984 1988 1992 1996 2000 2004<br />
9105 4 2<br />
400<br />
300<br />
200<br />
100<br />
DK3<br />
0<br />
1984 1988 1992 1996 2000 2004<br />
10 10<br />
it was observed as the predominant environment<strong>al</strong><br />
pathway of the relatively well water-soluble<br />
HCHs (Deutch <strong>et</strong> <strong>al</strong>., 2002) and was found more<br />
frequently in human blood and breast milk (WWF,<br />
2004). The available data for the Wadden Sea does<br />
not show accumulation of HCH isomers other than<br />
Lindane in blue mussels and flounder liver.<br />
4.3.3.1 Input<br />
The Lindane input by the Elbe and water concentrations<br />
dramatic<strong>al</strong>ly increased b<strong>et</strong>ween 1996 and<br />
2000, followed by a similarly dramatic decrease<br />
in 2001 (Figure 4.3.1). The cause of the increasing<br />
Lindane input and concentrations in the late<br />
1990s, equ<strong>al</strong>ling 1986 levels, is not known. A relation<br />
with the Elbe flood (August 2002) is not<br />
likely, because the increase started as early as in<br />
1996. The other rivers showed an ongoing decrease<br />
throughout the assessment period.<br />
4.3.3.2 Concentrations in blue mussel<br />
Most subareas of the Wadden Sea show a downward<br />
trend (Figure 4.3.6). Subarea SH1, however,<br />
showed a significant increase b<strong>et</strong>ween 1994 and<br />
1998, which suddenly collapsed in 1999. During<br />
recent years, Lindane levels in blue mussels were<br />
at the same level in <strong>al</strong>l subareas of the Wadden<br />
Sea.
50<br />
40<br />
30<br />
20<br />
10<br />
NDS1<br />
0<br />
1984 1988 1992 1996 2000 2004<br />
5898 4<br />
10<br />
SH1<br />
8<br />
6<br />
4<br />
2<br />
0<br />
1984 1988 1992 1996 2000 2004<br />
4444445 3<br />
10<br />
8<br />
6<br />
4<br />
2<br />
DK1<br />
0<br />
1984 1988 1992 1996 2000 2004<br />
333333<br />
25<br />
20<br />
15<br />
10<br />
5<br />
0<br />
1984 1988 1992 1996 2000 2004<br />
5561156<br />
25<br />
20<br />
15<br />
10<br />
5<br />
NDS1<br />
SH1<br />
0<br />
1984 1988 1992 1996 2000 2004<br />
7 11 2815 7 3 5 4<br />
28<br />
50<br />
40<br />
30<br />
20<br />
10<br />
NDS2<br />
0<br />
1984 1988 1992 1996 2000 2004<br />
10 9 10 8 4<br />
10<br />
8<br />
6<br />
4<br />
2<br />
DK2<br />
0<br />
1984 1988 1992 1996 2000 2004<br />
336376<br />
25<br />
20<br />
15<br />
10<br />
5<br />
NDS2<br />
0<br />
1984 1988 1992 1996 2000 2004<br />
6910510544<br />
50<br />
40<br />
30<br />
20<br />
10<br />
NL3<br />
0<br />
1984 1988 1992 1996 2000 2004<br />
4 5 5 5 5 5 5 5 5 8 5 10 9 5 10<br />
50<br />
40<br />
30<br />
20<br />
10<br />
NDS3<br />
0<br />
1984 1988 1992 1996 2000<br />
4<br />
2004<br />
10<br />
SH3<br />
8<br />
6<br />
4<br />
2<br />
0<br />
1984 1988 1992 1996 2000 2004<br />
222111 22<br />
10<br />
8<br />
6<br />
4<br />
2<br />
DK3<br />
0<br />
1984 1988 1992 1996 2000 2004<br />
6 6 6<br />
25<br />
20<br />
15<br />
10<br />
5<br />
0<br />
1984 1988 1992 1996 2000 2004<br />
5555525<br />
25<br />
20<br />
15<br />
10<br />
5<br />
NDS3<br />
0<br />
1984 1988 1992 1996 2000 2004<br />
9105 4 2<br />
25<br />
20<br />
15<br />
10<br />
5<br />
NL3<br />
DK3<br />
4.3 Xenobiotics<br />
0<br />
1984 1988 1992 1996 2000 2004<br />
10 10<br />
105<br />
Figure 4.3.6:<br />
Average Lindane (-HCH)<br />
contents of blue mussel<br />
(Mytilus edulis) tissue (µg<br />
kg -1 dry weight). Vertic<strong>al</strong><br />
lines represent the range<br />
b<strong>et</strong>ween maximum and<br />
minimum data.<br />
Figure 4.3.7:<br />
Average Lindane (-HCH)<br />
contents of flounder<br />
(Platichthys flesus) liver<br />
tissue (µg kg -1 w<strong>et</strong> weight).<br />
Vertic<strong>al</strong> lines represent the<br />
range b<strong>et</strong>ween maximum<br />
and minimum data.<br />
Wadden Sea Ecosystem No. 19 - 2005
106<br />
Figure 4.3.8:<br />
Average DDD contents of<br />
blue mussel (Mytilus<br />
edulis) tissue (µg kg -1 dry<br />
weight). Vertic<strong>al</strong> lines<br />
represent the range<br />
b<strong>et</strong>ween maximum and<br />
minimum data.<br />
Wadden Sea Ecosystem No. 19 - 2005<br />
4.3 Xenobiotics<br />
4.3.3.3 Concentrations in flounder liver<br />
Lindane contents of flounder liver (Figure 4.3.7)<br />
have been rather variable. Only in subarea SH1<br />
did a distinct downward trend occur b<strong>et</strong>ween 1994<br />
and 2003, reaching a 80% decrease. In 2002, levels<br />
were highest in subareas NL3 to NDS3. In subarea<br />
DK3 the Lindane levels were a factor 10 lower<br />
than in subareas NL3 to NDS3.<br />
The firm ecotoxicologic<strong>al</strong> assessment criterion<br />
(EAC) (OSPAR, 2004) was exceeded for certain<br />
length classes of flounder in subareas NL3 (2002,<br />
up to factor 2), NDS1 (2001, up to factor 7) and<br />
NDS2 (2002, up to factor ~2). If -HCH is included,<br />
subarea NL3 exceeded the EAC in 2002 by a<br />
factor of 4.<br />
4.3.3.4 Concentrations in bird eggs<br />
B<strong>et</strong>ween 1991 and 2003, concentrations of Lindane<br />
in eggs of the common tern and oystercatcher<br />
showed a steady decrease in most subareas of<br />
the Wadden Sea. An intermediate peak appeared<br />
in the Elbe area b<strong>et</strong>ween 1998 and 2002. In subarea<br />
NL3, however, Lindane concentrations in eggs<br />
of the oystercatcher increased significantly since<br />
1998 (see chapter 4.5).<br />
The geographic<strong>al</strong> distribution of Lindane concentrations<br />
is similar for eggs of both bird spe-<br />
10<br />
8<br />
6<br />
4<br />
2<br />
NDS1<br />
0<br />
1984 1988 1992 1996 2000 2004<br />
589874<br />
50<br />
40<br />
30<br />
20<br />
10<br />
SH1<br />
0<br />
1984 1988 1992 1996 2000 2004<br />
4444445 3<br />
10<br />
8<br />
6<br />
4<br />
2<br />
DK1<br />
0<br />
1984 1988 1992 1996 2000 2004<br />
333333<br />
10<br />
8<br />
6<br />
4<br />
2<br />
NDS2<br />
0<br />
1984 1988 1992 1996 2000 2004<br />
10 910884<br />
10<br />
8<br />
6<br />
4<br />
2<br />
DK2<br />
0<br />
1984 1988 1992 1996 2000 2004<br />
333376<br />
cies. In 2002, the western Dutch Wadden Sea (NL1)<br />
showed elevated levels, which were twice as high<br />
as in the eastern Dutch Wadden Sea (NL2), Ems-<br />
Dollard (NL3), Niedersachsen (NDS1) and the Danish<br />
Wadden Sea (DK1, DK3). Peak levels were found<br />
in the Elbe area (SH1, SH2 and SH3), about 4-5<br />
times higher than in the low-level areas. In the<br />
northern Wadden Sea, the oystercatcher eggs in<br />
2002 showed a gradient of decreasing concentrations<br />
from Elbe (SH1; ca. 8 µg·kg-1 fresh weight)<br />
to Sk<strong>al</strong>lingen (DK3; ca. 3 µg·kg-1 fresh weight).<br />
4.3.4 DDT, DDD, DDE<br />
4.3.4.1 Input<br />
Dichlorodiphenyldichloro<strong>et</strong>hylene (DDE), as the<br />
end product of DTT breakdown, primarily accumulates<br />
in the environment at higher trophic levels,<br />
such as in humans (Polder <strong>et</strong> <strong>al</strong>., 2002; WWF,<br />
2004). The DDT/DDE ratio in humans was typic<strong>al</strong>ly<br />
around 0.14 and is decreasing, indicating a reduced<br />
DDT input in the environment. These compounds<br />
were not addressed in the 1999 QSR.<br />
4.3.4.2 Concentrations in blue mussel<br />
In subarea NL3, concentrations of DDT (not shown),<br />
DDD (Figure 4.3.8), and to a lesser extent <strong>al</strong>so of<br />
DDE (not shown), showed a 75% decrease b<strong>et</strong>ween<br />
10<br />
8<br />
6<br />
4<br />
2<br />
NL3<br />
20.4<br />
0<br />
1984 1988 1992 1996 2000 2004<br />
3455555555585109810<br />
10<br />
8<br />
6<br />
4<br />
2<br />
NDS3<br />
0<br />
1984 1988 1992 1996 2000<br />
44<br />
2004<br />
10<br />
8<br />
6<br />
4<br />
2<br />
SH3<br />
0<br />
1984 1988 1992 1996 2000 2004<br />
222111 22<br />
10<br />
8<br />
6<br />
4<br />
2<br />
DK3<br />
0<br />
1984 1988 1992 1996 2000 2004<br />
66
50<br />
40<br />
30<br />
20<br />
10<br />
NDS1<br />
0<br />
1984 1988 1992 1996 2000 2004<br />
5 5 6 11 5 6<br />
50<br />
40<br />
SH1<br />
122<br />
96<br />
68<br />
82<br />
30<br />
20<br />
10<br />
0<br />
1984 1988 1992 1996 2000 2004<br />
711 2815<br />
40<br />
30<br />
20<br />
10<br />
0<br />
1984 1988 1992 1996 2000 2004<br />
1561156<br />
40<br />
SH1 71 55 65 70<br />
30<br />
20<br />
10<br />
NDS1<br />
0<br />
1984 1988 1992 1996 2000 2004<br />
711 2815<br />
50<br />
40<br />
30<br />
20<br />
10<br />
NDS2<br />
0<br />
1984 1988 1992 1996 2000 2004<br />
6 9 10 5 10 5 4 4<br />
40<br />
30<br />
20<br />
10<br />
NDS2<br />
0<br />
1984 1988 1992 1996 2000 2004<br />
6910510544<br />
50<br />
40<br />
30<br />
20<br />
10<br />
NL3<br />
0<br />
1984 1988 1992 1996 2000 2004<br />
5555525<br />
50<br />
40<br />
30<br />
20<br />
10<br />
NDS3<br />
0<br />
1984 1988 1992 1996 2000 2004<br />
9105 4 2<br />
50<br />
40<br />
30<br />
20<br />
10<br />
DK3<br />
0<br />
1984 1988 1992 1996 2000 2004<br />
10 10<br />
40<br />
30<br />
20<br />
10<br />
NL3<br />
0<br />
1984 1988 1992 1996 2000 2004<br />
5555525<br />
40<br />
30<br />
20<br />
10<br />
NDS3<br />
0<br />
1984 1988 1992 1996 2000 2004<br />
9105 4 2<br />
40<br />
30<br />
20<br />
10<br />
DK3<br />
4.3 Xenobiotics<br />
0<br />
1984 1988 1992 1996 2000 2004<br />
10 10<br />
107<br />
Figure 4.3.9:<br />
Average DDD contents of<br />
flounder (Platichthys<br />
flesus) liver tissue (µg kg -1<br />
w<strong>et</strong> weight). Vertic<strong>al</strong> lines<br />
represent the range<br />
b<strong>et</strong>ween maximum and<br />
minimum data.<br />
Figure 4.3.10:<br />
Average DDE contents of<br />
flounder (Platichthys<br />
flesus) liver tissue (µg kg -1<br />
w<strong>et</strong> weight). Vertic<strong>al</strong> lines<br />
represent the range<br />
b<strong>et</strong>ween maximum and<br />
minimum data.<br />
Wadden Sea Ecosystem No. 19 - 2005
108<br />
Figure 4.3.11:<br />
HCB contents of sediment<br />
(µg kg -1 at 5% organic<br />
carbon). Vertic<strong>al</strong> lines<br />
represent the range<br />
b<strong>et</strong>ween maximum and<br />
minimum data.<br />
Wadden Sea Ecosystem No. 19 - 2005<br />
4.3 Xenobiotics<br />
1988 and 2002. The shorter time series of other<br />
subareas showed the same trend (e.g. SH3).<br />
DDE levels are typic<strong>al</strong>ly twice as high as the<br />
DDT and DDD levels. DDTs (sum of DDT, DDD, DDE)<br />
is relatively high in subareas NL3, SH1 and SH3.<br />
The Elbe flood (2002) caused the DDD and DDE<br />
levels in blue mussels in SH1 to increase by a factor<br />
of 3 in 2003. DDT levels did not increase, which<br />
indicates that the Elbe flood primarily caused<br />
mobilization of historic<strong>al</strong> contamination. This is<br />
in accordance with the observed increase of concentrations<br />
of DDD and DDE in Elbe suspended<br />
matter in August 2002 (CWSS, 2002).<br />
4.3.4.3 Concentrations in flounder liver<br />
In subareas NDS2 and SH1, high and variable DDT<br />
levels were recorded. The source of the high concentrations<br />
in subarea NDS2 may be of unknown<br />
loc<strong>al</strong> origin. In subarea SH1, gener<strong>al</strong>ly high concentration<br />
occurred, particularly of DDD (Figure<br />
4.3.9) and DDE (Figure 4.3.10). In subareas NDS2<br />
(only DDT) and SH1 (DDTs) concentration levels<br />
are up to a factor 6 higher than in other subareas<br />
of the Wadden Sea.<br />
No data is available to check for Elbe flood<br />
(2002) related anom<strong>al</strong>ies in concentrations in<br />
flounder liver.<br />
4.3.5 Hexachlorobenzene (HCB)<br />
4.3.5.1 Input<br />
HCB (hexachlorobenzene) was widely used as a<br />
pesticide and in synthesis processes until it was<br />
banned in most open applications in 1988. HCB,<br />
however, is still a by-product of the production of<br />
chlorinated organic solvents, though strictly regulated.<br />
HCB is highly persistent and bioaccumulative.<br />
HCB levels found in human blood are<br />
amongst the highest of organochlorines tog<strong>et</strong>her<br />
with DDE (m<strong>et</strong>abolite of DDT), -HCH and PCBs<br />
(WWF, 2004).<br />
2.5<br />
2.0<br />
1.5<br />
1.0<br />
0.5<br />
NL1<br />
0.0<br />
1984 1988 1992 1996 2000 2004<br />
2 6 11 11 11<br />
2.5<br />
2.0<br />
1.5<br />
1.0<br />
0.5<br />
DK1<br />
0.0<br />
1984 1988 1992 1996 2000 2004<br />
2 2<br />
2.5<br />
2.0<br />
1.5<br />
1.0<br />
0.5<br />
NL2<br />
3.4<br />
0.0<br />
1984 1988 1992 1996 2000 2004<br />
9 10 10 10<br />
2.5<br />
2.0<br />
1.5<br />
1.0<br />
0.5<br />
DK2<br />
0.0<br />
1984 1988 1992 1996 2000 2004<br />
62 6<br />
QSR 1999<br />
HCB, used as biocide in wood conservation and crop protection,<br />
is widely present in the biosphere. Its highly volatile,<br />
bioaccumulative and persistent properties made it a ‘black<br />
list’ compound. In the Ems-Dollard (NL3) and Elbe (SH1, SH2)<br />
subareas relatively high concentrations were found in sediments,<br />
blue mussels and eggs of the common tern and oystercatcher.<br />
While the Ems gener<strong>al</strong>ly showed a downward<br />
trend, there was an increasing trend in the Elbe region towards<br />
the end of the ev<strong>al</strong>uation period.<br />
Common tern eggs showed bioaccumulation levels higher<br />
than oystercatcher eggs, which in line with the HCB properties<br />
and the higher trophic level of the fish eating com-<br />
4.3.5.2 Concentrations in sediment<br />
The average HCB content in sediments decreased<br />
in NL1 – NL3 b<strong>et</strong>ween 1988 and 2002 (Figure<br />
4.3.11). Though not significant, it constitutes a<br />
50% reduction.<br />
HCB contents in sediments in DK1 to DK3 are<br />
at the lowest levels of NL1, but show large variations<br />
coinciding with low organic carbon contents<br />
of the sediment.<br />
4.3.5.3 Concentrations in blue mussel<br />
Subareas NL3 and SH1, which were ‘hot spot’ areas<br />
in the 1999 QSR, showed a concentration reduction<br />
of over 90% (NL3, 1988-2002) and 80%<br />
(NDS1, 1997-2002; SH1, 1996-2000) (Figure<br />
4.3.12). In subarea SH1, the Elbe flood of 2002<br />
may have caused the blue mussel levels to increase<br />
by a factor of 3 in 2003.<br />
HCB levels in blue mussels are higher in subareas<br />
NDS3 (factor 7), SH1 and SH3 (both factor 3)<br />
as compared to other subareas of the Wadden Sea.<br />
This may be related to residu<strong>al</strong> south to north<br />
transport <strong>al</strong>ong the North Sea coast of historic<strong>al</strong><br />
(as in NL3 and SH1) or recent loc<strong>al</strong> sources.<br />
4.3.5.4 Concentrations in flounder liver<br />
As in blue mussels, HCB levels in flounder liver<br />
were very high in subareas NL3 and SH1 (Figure<br />
2.5<br />
2.0<br />
1.5<br />
1.0<br />
0.5<br />
NL3<br />
4.5 3,0<br />
0.0<br />
1984 1988 1992 1996 2000 2004<br />
1 3 11 11 11<br />
2.5<br />
2.0<br />
1.5<br />
1.0<br />
0.5<br />
DK3<br />
0.0<br />
1984 1988 1992 1996 2000 2004<br />
2 2
8<br />
6<br />
4<br />
2<br />
NL1<br />
0<br />
1984 1988 1992 1996 2000 2004<br />
12321122122<br />
8<br />
6<br />
4<br />
2<br />
NDS1<br />
0<br />
1984 1988 1992 1996 2000 2004<br />
8<br />
SH1<br />
589874<br />
18.9<br />
6<br />
4<br />
2<br />
0<br />
1984 1988 1992 1996 2000 2004<br />
4444445 3<br />
8<br />
6<br />
4<br />
2<br />
DK1<br />
0<br />
1984 1988 1992 1996 2000 2004<br />
333333<br />
16<br />
12<br />
8<br />
4<br />
0<br />
1984 1988 1992 1996 2000 2004<br />
25 24 25 25 25 25 21<br />
16<br />
12<br />
8<br />
4<br />
NL1<br />
0<br />
1984 1988 1992 1996 2000 2004<br />
200<br />
SH1<br />
5561156<br />
551<br />
160<br />
120<br />
80<br />
40<br />
NDS1<br />
0<br />
1984 1988 1992 1996 2000 2004<br />
7 11 2815 7 3 5 4<br />
8<br />
6<br />
4<br />
2<br />
NL2<br />
0<br />
1984 1988 1992 1996 2000 2004<br />
16642442222<br />
8<br />
6<br />
4<br />
2<br />
NDS2<br />
0<br />
1984 1988 1992 1996 2000 2004<br />
9<br />
8<br />
6<br />
4<br />
2<br />
DK2<br />
0<br />
1984 1988 1992 1996 2000 2004<br />
336376<br />
16<br />
12<br />
8<br />
4<br />
NDS2<br />
0<br />
1984 1988 1992 1996 2000 2004<br />
6 9 10 5 10 5 4 4<br />
8<br />
6<br />
4<br />
2<br />
0<br />
1984 1988 1992 1996 2000 2004<br />
4555558876107109810<br />
8<br />
6<br />
4<br />
2<br />
NDS3<br />
0<br />
1984 1988 1992 1996 2000<br />
44<br />
2004<br />
8<br />
SH3<br />
6<br />
4<br />
2<br />
0<br />
1984 1988 1992 1996 2000 2004<br />
222111 22<br />
8<br />
6<br />
4<br />
2<br />
10.3<br />
NL3<br />
DK3<br />
0<br />
1984 1988 1992 1996 2000 2004<br />
6 6 6<br />
200<br />
160<br />
120<br />
80<br />
40<br />
NL3<br />
0<br />
1984 1988 1992 1996 2000 2004<br />
15 9 251325 6 25 5 22232224303030292327<br />
16<br />
12<br />
8<br />
4<br />
NDS3<br />
0<br />
1984 1988 1992 1996 2000 2004<br />
9105 4 2<br />
16<br />
12<br />
8<br />
4<br />
DK3<br />
4.3 Xenobiotics<br />
0<br />
1984 1988 1992 1996 2000 2004<br />
10 10<br />
109<br />
Figure 4.3.12:<br />
Average HCB contents of<br />
blue mussel (Mytilus<br />
edulis) tissue (µg kg -1 dry<br />
weight). Vertic<strong>al</strong> lines<br />
represent the range<br />
b<strong>et</strong>ween maximum and<br />
minimum data.<br />
Figure 4.3.13:<br />
Average HCB contents of<br />
flounder (Platichthys<br />
flesus) liver tissue (µg kg -1<br />
w<strong>et</strong> weight). Vertic<strong>al</strong> lines<br />
represent the range<br />
b<strong>et</strong>ween maximum and<br />
minimum data.<br />
Wadden Sea Ecosystem No. 19 - 2005
110<br />
Figure 4.3.14:<br />
Butyltin compounds in<br />
water (ng l -1 ) of marinas in<br />
the Dutch Wadden Sea.<br />
Wadden Sea Ecosystem No. 19 - 2005<br />
4.3 Xenobiotics<br />
4.3.13). In subarea NL3, a 96% reduction of HCB<br />
concentrations was recorded b<strong>et</strong>ween 1984 and<br />
2002, after sanitization of the loc<strong>al</strong> source in the<br />
Ems estuary in 1985. A similar reduction was<br />
achieved in SH1 b<strong>et</strong>ween 1995 and 2001. The Elbe<br />
flood of August 2002 caused increased HCB levels<br />
(by a factor of 5) <strong>al</strong>ready in autumn of that<br />
year (flounders were sampled in October), decreasing<br />
again in 2003.<br />
In subarea DK3, HCB levels in flounder liver are<br />
a factor 4 lower than in subareas NL1 SH1, suggesting<br />
contamination of the entire south-western<br />
Wadden Sea by historic<strong>al</strong> sources.<br />
4.3.5.5 Concentrations in bird eggs<br />
Trends in HCB concentrations in eggs of the oystercatcher<br />
and common tern are described in chapter<br />
4.5. HCB concentrations in oystercatcher eggs<br />
at Delfzijl (NL3) showed a decrease of approx. 80%<br />
b<strong>et</strong>ween 2001 and 2003.<br />
4.3.6 Organotin compounds<br />
(TBT, TPT)<br />
Tributyltin (TBT) acts as a hormone disruptor, causing<br />
molluscs to develop fem<strong>al</strong>e sterility (imposex),<br />
fin<strong>al</strong>ly leading to the extinction of the population.<br />
For further information see section 4.7.1.<br />
Triphenyltin (TPT) compounds were not addressed<br />
in the 1999 QSR. TPT is mainly applied as<br />
biocide for potato crops, and is as toxic as TBT.<br />
QSR 1999<br />
Tributyltin compounds (usu<strong>al</strong>ly applied as TBT-oxide or TBTchloride)<br />
were extensively used in antifouling and stabilizer<br />
applications. The marine source is mainly from ships. TBT<br />
accumulates in sediments and biota. Highest concentrations<br />
were found in marinas, up to 100 fold the levels in more<br />
remote reference areas. Intercomparison b<strong>et</strong>ween Wadden<br />
Sea regions was hampered because of m<strong>et</strong>hodologic<strong>al</strong> differences<br />
in both sampling and an<strong>al</strong>ysis.<br />
4.3.6.1 Inputs<br />
No input data is available from monitoring. Models<br />
have been developed to estimate leaching out<br />
of applications (in: Bellert <strong>et</strong> <strong>al</strong>., 2004).<br />
(ng.l-1 )<br />
80<br />
70<br />
60<br />
50<br />
40<br />
30<br />
20<br />
NL1<br />
TBT<br />
DBT<br />
MBT<br />
10<br />
0<br />
88 90 92 94 96 98 00 02 04<br />
Organic tin compounds have been extensively<br />
monitored in The N<strong>et</strong>herlands. Some results will<br />
be shown.<br />
4.3.6.2 Concentrations in water<br />
Buty ltin compounds have been monitored mainly<br />
in marinas. In the western Dutch Wadden Sea<br />
(NL1), concentrations of TBT and its m<strong>et</strong>abolites<br />
showed a strong decrease b<strong>et</strong>ween 1990 and 2002<br />
(Figure 4.3.14). Most prominent was the 60% reduction<br />
of TBT in 1993, the year that use of TBT in<br />
anti-fouling paints on ships
nBT (µg.kg-1 ) nBT (µg.kg-1 ) nBT (µg.kg-1 70<br />
60<br />
50<br />
NL1<br />
TBT<br />
DBT<br />
MBT<br />
70<br />
60<br />
50<br />
NL2<br />
TBTs<br />
DBTs<br />
MBTs<br />
TBT<br />
DBT<br />
MBT<br />
)<br />
70<br />
60<br />
50<br />
NL3<br />
TBT<br />
DBT<br />
MBT<br />
40<br />
40<br />
40<br />
30<br />
30<br />
30<br />
20<br />
20<br />
20<br />
10<br />
10<br />
10<br />
0<br />
0<br />
0<br />
97 98 99 00 01 02 03 04 97 98 99 00 01 02 03 04 97 98 99 00 01 02 03 04<br />
nPT (µg.kg-1 ) nPT (µg.kg-1 ) nPT (µg.kg-1 25<br />
NL1<br />
TPT<br />
25<br />
NL2<br />
TPT<br />
)<br />
25<br />
NL3<br />
20<br />
DPT<br />
MPT<br />
20<br />
DPT<br />
MPT<br />
20<br />
15<br />
15<br />
15<br />
10<br />
5<br />
0<br />
98 99 00 01 02 03 04<br />
50<br />
0<br />
Similarly, TPT is dominant above its m<strong>et</strong>abolites<br />
DPT and MPT. This data indicates a selective accumulation<br />
of TBT by blue mussels, which is likely to<br />
be reflected in butyl tin concentrations in the common<br />
eider (see below).<br />
In 2002, the high firm ecotoxicologic<strong>al</strong> assessment<br />
criterion (OSPAR, 2004) was exceeded by a<br />
factor of 15 in subarea NL2 and a factor of 25 in<br />
NL3.<br />
Figure 4.3.17 shows TBT and TPT concentrations<br />
in blue mussels in the German Wadden Sea<br />
(Jade Bight, NDS2) for the time period 1985-1999.<br />
TPT concentrations are decreasing after a phase<br />
out of its use as antifouling paint in the mid 1980s.<br />
TBT concentrations remain unchanged (about 200<br />
µg kg -1 dry weight in the period 1995-1999) even<br />
after the EU-ban for use as antifouling paint in<br />
sm<strong>al</strong>l ships in 1991 (Rüdel <strong>et</strong> <strong>al</strong>., 2003).<br />
10<br />
5<br />
10<br />
0<br />
0<br />
98 99 00 01 02 03 04 00 01 02 03 04<br />
(µg.kg-1 ) (µg.kg-1 300<br />
250<br />
NL2<br />
TBT<br />
DBT<br />
300<br />
250<br />
)<br />
NL3<br />
200<br />
MBT<br />
TPT<br />
200<br />
150<br />
DPT<br />
MPT<br />
150<br />
100<br />
100<br />
0<br />
1999 2000 2001 2002 1999 2000 2001 2002<br />
50<br />
(µg.kg<br />
800<br />
700<br />
600<br />
500<br />
400<br />
300<br />
200<br />
100<br />
0<br />
-1 )<br />
5<br />
NDS2<br />
4.3 Xenobiotics<br />
TPT<br />
DPT<br />
MPT<br />
TBT<br />
DBT<br />
MBT<br />
TPT<br />
DPT<br />
MPT<br />
TBT<br />
TPT<br />
1985 1986 1988 1990 1992 1993 1994 1995 1996 1997 1998 1999<br />
111<br />
Figure 4.3.15:<br />
Average organic tin<br />
contents of sediment in<br />
fraction
112<br />
Figure 4.3.18:<br />
Concentration (µg kg -1 dry<br />
weight) of organic tin<br />
compounds in liver of the<br />
harbour se<strong>al</strong> (Phoca<br />
vitulina) found dead in<br />
2000. Dibutyltin (DBT) and<br />
monobutyltin (MBT) are<br />
TBT m<strong>et</strong>abolites.<br />
Diphenyltin (DPT) and<br />
monophenyltin (MPT) are<br />
TPT m<strong>et</strong>abolites.<br />
Accumulation of butyltins<br />
and triphenyltin (TPT)<br />
increases with age, (source:<br />
Eltink, 2004).<br />
Figure 4.3.19:<br />
Average (bars) and<br />
minimum/maximum<br />
(vertic<strong>al</strong> lines)<br />
concentration of organic<br />
tin compounds (µg kg -1 dry<br />
weight) in liver tissue of<br />
common eider (Somateria<br />
mollissima) (N = 12) found<br />
dead in the winter of 1999<br />
and 2000. The di- and<br />
monobutyl and phenyltins<br />
are m<strong>et</strong>abolites of<br />
tributyltin (TBT) and<br />
triphenyltin (TPT),<br />
respectively (source:<br />
Werkman <strong>et</strong> <strong>al</strong>., 2000).<br />
Wadden Sea Ecosystem No. 19 - 2005<br />
4.3 Xenobiotics<br />
4.3.6.5 Concentrations in harbour se<strong>al</strong><br />
and common eider<br />
Dead harbour se<strong>al</strong>s, stranded on the Dutch Wadden<br />
Sea and North Sea shores during the PDVepidemic<br />
of 2002, were collected and their livers<br />
were an<strong>al</strong>yzed for organotins. The results show<br />
that TBT was m<strong>et</strong>abolized to DBT and MBT, the<br />
latter being present in higher concentrations than<br />
TBT. Concentrations were age-dependent (Figure<br />
4.3.18).<br />
In contrast, triphenyltin (TPT) was not as easily<br />
m<strong>et</strong>abolized as TBT, as shown by high concentrations<br />
in the liver relative to TBT (70 and 15 µg kg -1<br />
respectively in adults). Considering the similar toxicity<br />
of TBT and TPT and the assumed lower toxicity<br />
of their m<strong>et</strong>abolites, TPT poses a higher environment<strong>al</strong><br />
risk to se<strong>al</strong>s than TBT. A roughly estimated<br />
daily intake of organotins of ~8 µg kg -1 body<br />
weight was considered too low to reach the level<br />
of Ah-receptor inhibition (1000 µg kg -1 body<br />
weight) described by Vos <strong>et</strong> <strong>al</strong>. (2003).<br />
In the livers of common eider, found dead in<br />
the winters of 1999 and 2000, extremely high DBT<br />
concentrations were found, whereas TBT and MBT<br />
represented only ~4% of the tot<strong>al</strong> butyltin content<br />
(Figure 4.3.19). Concentrations of phenyltin<br />
compounds were lower (20–25% of the butyltin<br />
compounds) with TPT and DPT as the major constituents,<br />
representing 38% and 31% respectively<br />
of the phenyltins. This data suggests that TBT in<br />
blue mussels, the primary food source of the common<br />
eider, is transferred to the bird and readily<br />
m<strong>et</strong>abolized and d<strong>et</strong>oxified to DBT, reaching lev-<br />
(µg.kg-1 )<br />
1,000<br />
800<br />
600<br />
400<br />
200<br />
90<br />
80<br />
70<br />
60<br />
50<br />
40<br />
30<br />
20<br />
10<br />
0<br />
0<br />
(µg.kg -1 )<br />
Young ( 3 years)<br />
TBT DBT MBT<br />
Substance<br />
2,859<br />
ButylTins<br />
Tri Di Mono<br />
PhenylTins<br />
90<br />
80<br />
70<br />
60<br />
50<br />
40<br />
30<br />
20<br />
10<br />
0<br />
(µg.kg -1 )<br />
Young ( 3 years)<br />
TPT DPT MPT<br />
Substance<br />
els 10-fold of those in blue mussels. It still needs<br />
to be clarified wh<strong>et</strong>her the largely enhanced levels<br />
of TBT-m<strong>et</strong>abolites, though less toxic, exert<br />
negative effects on the biota of the Wadden Sea.<br />
Phenyltin levels in blue mussels are at about<br />
10% of butyltins. TPT is relatively persistent in blue<br />
mussel, which was <strong>al</strong>so noted for harbours se<strong>al</strong>.<br />
In conclusion, it appears that biomagnification<br />
of organotin compounds occurs primarily in birds<br />
(common eider) and to a lesser extent in marine<br />
mamm<strong>al</strong>s (harbour se<strong>al</strong>). Such biomagnification<br />
in lung-breathing organisms, as opposed to gillbreathing<br />
anim<strong>al</strong>s, was <strong>al</strong>so reported for brominated<br />
flame r<strong>et</strong>ardants (Boon <strong>et</strong> <strong>al</strong>., 2002).<br />
4.3.7 Pesticides<br />
QSR 1999<br />
Regular monitoring of pesticides (except Lindane, HCB) in<br />
the Wadden Sea area was absent. Dutch and German pesticide<br />
surveys (1990-1996) showed the presence of a large<br />
vari<strong>et</strong>y of pesticides , whereas this was not expected on the<br />
basis of biodegradation tests. The most frequently d<strong>et</strong>ected<br />
compound groups belong to the organic phosphates, triazines<br />
(and derivates), and phenylurea herbicides. Herbicide<br />
concentrations were found at levels potenti<strong>al</strong>ly harmful to<br />
eelgrass (Zostera marina).<br />
A large series of polar pesticides (Atrazine, Chloorfenvinfos,<br />
Chloroprofam, Chlorotoluron, Diuron,<br />
Irgarol-1051, Isoproturon, Linuron, M<strong>et</strong>habenzthiazuron,<br />
M<strong>et</strong>olachlor, Pirimicarb, Propoxur, Simazine,<br />
Terbutryne, Terbutylazine, M<strong>et</strong>hyl-tolclofos)<br />
has been monitored in Dutch Wadden Sea<br />
water since 1997 (atrazines) or 2002. Frederiks <strong>et</strong><br />
<strong>al</strong>. (2004) report that Chlortoluron, Diuron, Isoprouron,<br />
Irgarol, M<strong>et</strong>olachlor, Propoxur, Terbutryne<br />
and Terbutylazine exceed the targ<strong>et</strong> levels s<strong>et</strong> by<br />
the Dutch policy (MinVenW, 1998).
4.3.8 Summary of trends<br />
The persistency of most xenobiotics presents the<br />
largest problem in reaching the go<strong>al</strong> of downward<br />
trends of concentrations in the sediment and biota<br />
of the Wadden Sea. This was shown by the residu<strong>al</strong><br />
south to north transport into the Wadden<br />
Sea and the risk of remobilization from old deposits<br />
as shown by the Elbe flood in 2002.<br />
Most of the ‘old’ xenobiotics are still present in<br />
the Wadden Sea environment, but show a continuing<br />
downward trend. The relatively ‘new’ xenobiotics<br />
such as organotin compounds may have<br />
started to decrease slightly, but are still bioaccumulating.<br />
Their chronic effects on birds and marine<br />
mamm<strong>al</strong>s need to be clarified.<br />
PCBs are still wide-spread, but concentrations<br />
have decreased considerably over the past 20 years.<br />
They still, however, exceed agreed background levels<br />
by many times.<br />
Lindane and its m<strong>et</strong>abolites are mostly decreasing,<br />
though -HCH is persistent in the higher<br />
trophic levels.<br />
In the Wadden Sea, elevated levels of DDT and<br />
DDE in subareas NL3, SH1 and SH3 further decreased<br />
in the 1990s. The Elbe flood of 2002 caused<br />
an increase of levels in blue mussel in subarea SH1.<br />
HCB decreased in <strong>al</strong>l subareas of the Wadden<br />
Sea, with a relatively late response in the higher<br />
trophic level (bird eggs).<br />
References<br />
Bellert, E.G. and van de Ven, C.L.M., 2003. Monitoring of Tri-<br />
PhenylTin and TriButylTin in the Dutch Wadden Sea area. RIKZ<br />
report RIKZ/AB/2003.611x. March 2003, (in Dutch).<br />
Bellert, E.G., Åkerman, J.E., Koopmans, M.P. and van de Ven,<br />
C.L.M., 2004. Anthropogenic inputs by shipping and atmospheric<br />
deposition into the Dutch Wadden Sea and Ems-Dollard.<br />
RIKZ report RIKZ/AB/2004.612. July, 2004; in Dutch.<br />
Boon, J.P., Lewis, W.E., Tjoen-a-choy, M.R., Allchin, C.R., Law,<br />
R.J., de Boer, J., ten H<strong>al</strong>lers-Tjabbes, C.C. and Zegers, B.N., 2002.<br />
Levels of polybrominated diphenyl <strong>et</strong>her (PBDE) flame r<strong>et</strong>ardants<br />
in anim<strong>al</strong>s representing different trophic levels of the<br />
North Sea food web. Environ. Sci. Technol. 36: 4025-4032.<br />
CWSS, 2002. Status reports on the Elbe Flood 2002. Common<br />
Wadden Sea Secr<strong>et</strong>ariat, Wilhelmshaven.<br />
Deutch, B., Pedersen, H.S., Bonafeld-Jørgensen, E. and Hansen,<br />
J., 2002. The AMAP human he<strong>al</strong>th program for Greenland<br />
1999-2001: organic pollutants, lifestyle, di<strong>et</strong>ary composition<br />
and blood lipids. Poster at the Second AMAP Internation<strong>al</strong><br />
Symposium on Environment<strong>al</strong> Pollution of the Arctic, Rovaniemi,<br />
1-4 October 2002.<br />
4.3 Xenobiotics<br />
Organotin compounds in the water of Dutch<br />
marinas decreased b<strong>et</strong>ween 1990 and 2002 by<br />
about 60%. Since 2002, concentrations in particulate<br />
suspended matter <strong>al</strong>so decreased. The share<br />
of the primary compound TPT in the tot<strong>al</strong> of phenyl<br />
tin compounds decreased recently, indicating<br />
a reduction in input of TPT.<br />
The Targ<strong>et</strong>s for xenobiotics are difficult to assess,<br />
because no v<strong>al</strong>ues have been attached to<br />
‘concentrations …as resulting from zero discharges’.<br />
When in the course of time concentrations do<br />
not continue to show decreasing trends, this may<br />
in practice be considered as having reached the<br />
targ<strong>et</strong>.<br />
With regard to PCBs, the maximum levels in<br />
sediment (NL1), and liver tissue of adult flounder<br />
exceeded the OSPAR ecotoxicologic<strong>al</strong> assessment<br />
criteria.<br />
For Lindane, the OSPAR ecotoxicologic<strong>al</strong> assessment<br />
criteria are exceeded in liver tissue of flounder<br />
in subareas NL3, NDS1 and NDS2.<br />
For TBT the OSPAR ecotoxicologic<strong>al</strong> assessment<br />
criteria are exceeded in water, sediment and mussels<br />
in NL1 to NL3 by a large factors. It is likely,<br />
however, that most if not <strong>al</strong>l Wadden Sea subareas<br />
exceed these OSPAR criteria. Relevant data,<br />
however, was not readily available.<br />
Duyzer, J.H. and Vonk, A.W., 2002. Atmospheric deposition of<br />
pesticides, PAHs and PCBs in The N<strong>et</strong>herlands. TNO report<br />
R2002/606 (in Dutch).<br />
Eltink, W.D., 2004. Organotin and se<strong>al</strong>s in the Dutch Wadden<br />
Sea. Report RIKZ/AB/2004.611w, Nation<strong>al</strong> Institute for Coast<strong>al</strong><br />
and Marine Management / RIKZ, Haren, Gn (NL).<br />
Frederiks, B, van Hoorn, M.K. and van de Ven, C.L.M., 2004.<br />
Survey of problematic compounds in the Dutch Wadden Sea<br />
and Ems-Dollard. RIKZ Intern<strong>al</strong> document RIKZ.2004.616w<br />
(in Dutch), (Inventaristaie probleemstoffen Waddenzee en<br />
Eems-Dollard). Rijkswaterstaat.<br />
Hoekstra, E.J. and de Leer, E.W.B., 1995. Organoh<strong>al</strong>ogens: the<br />
natur<strong>al</strong> <strong>al</strong>ternatives. Chemistry in Britain, February 1995.<br />
Jong, F. de, <strong>Bakker</strong>, J.F., van Berkel, C.J.M., Dankers, N.M.J.A.,<br />
Dahl, K., Gätje, C., Marencic, H. and Potel, P. (Eds.), 1999.<br />
1999 Wadden Sea Qu<strong>al</strong>ity Status Report. Wadden Sea Ecosystem<br />
No. 9. Common Wadden Sea Secr<strong>et</strong>ariat, Trilater<strong>al</strong><br />
Monitoring and Assessment Group, Qu<strong>al</strong>ity Status Report<br />
Group. Wilhelmshaven, pp. 259.<br />
MinVenW, 1998. Fourth Note on Water Managemenr. Gouvernment<strong>al</strong><br />
Decision. Ministry of Traffic and Water Management,<br />
December 1998. In Dutch (Vierde Nota Waterhuishouding,<br />
Regeringsbeslissing)<br />
113<br />
Wadden Sea Ecosystem No. 19 - 2005
114<br />
Wadden Sea Ecosystem No. 19 - 2005<br />
4.3 Xenobiotics<br />
OSPAR, 1997. Annex 5: Agreed Background/Reference concentrations<br />
for contaminants in sea water, biota and sediment.<br />
Annex 6: Agreed ecotoxicologic<strong>al</strong> assessment criteria<br />
for trace m<strong>et</strong><strong>al</strong>s, PCBs, PAHs, TBT and some organochlorine<br />
pesticides. Joint me<strong>et</strong>ing of the Oslo and Paris Commissions,<br />
Brussels, 2-5 September 1997.<br />
OSPAR, 2002. OSPAR List of Chemic<strong>al</strong>s for Priority Action (Update<br />
2002). OSPAR Me<strong>et</strong>ing, Amsterdam 24-28 June, 2002<br />
OSPAR, 2003. An Over<strong>al</strong>l Assessment of the Dumping of Wastes<br />
at Sea from the mid-1980’s to 2001 in the OSPAR Area. Biodiversity<br />
and Dumped Materi<strong>al</strong> Series, OSPAR Commission 2003,<br />
ISBN 1-904426-09-3.<br />
OSPAR, 2004. Progress report on the organisation of the<br />
OSPAR/ICES workshop on BRCs and EACs. 8-13 February, 2004,<br />
The Hague, The N<strong>et</strong>herlands.<br />
Polder A., Savinova, T.N., Skaare, J.U., 2002. Tempor<strong>al</strong> changes<br />
of PCBs and Chlorinated Pesticides in Human Milk from Murmansk,<br />
Russia. Poster at the Second AMAP Internation<strong>al</strong> Symposium<br />
on Environment<strong>al</strong> Pollution of the Arctic, Rovaniemi,<br />
1-4 October 2002.<br />
Rüdel, H., Lepper, P., Steinhanses, J. and Schröter-Kermani, C.,<br />
2003. R<strong>et</strong>rospective monitoring of organotin compounds in<br />
marine biota from 1985 to 1999: Results from the German<br />
Environment<strong>al</strong> Specimen Bank. Environ. Sci. Technol. 37: 1731-<br />
1738.<br />
Vos, J. G., Bossart, G., Fournier, M. and O’Shea, T., 2003. Toxicology<br />
of marine mamm<strong>al</strong>s. Nation<strong>al</strong> Institute of Public He<strong>al</strong>th<br />
and Environment (RIVM) ; Division of Marine Mamm<strong>al</strong> Research<br />
and Conservation Harbor branch Oceanographic Institution.<br />
CRC Press, pp. 656, ISBN 0415239141.<br />
Werkman, G., Eggens, M.L. and van de Ven, C.L.M., 2000. Water<br />
qu<strong>al</strong>ity and eider ducks in the Wadden Sea. Report RIKZ/<br />
AB/20000.607x (in Dutch).<br />
WWF, 2004. Chemic<strong>al</strong> check up: An an<strong>al</strong>ysis of chemic<strong>al</strong>s in<br />
the blood of members of the European Parliament. DETOX campaign.<br />
World Wildlife Fund, www.panda.org/news_facts/newsroom/press_releases/news.cfm?uNewsID=12622