A. Vandenbohede and L. Lebbe - SWIM Site
A. Vandenbohede and L. Lebbe - SWIM Site
A. Vandenbohede and L. Lebbe - SWIM Site

Create successful ePaper yourself
Turn your PDF publications into a flip-book with our unique Google optimized e-Paper software.
18 <strong>SWIM</strong>. Cartagena 2004, Spain. (Ed. Araguás, Custodio <strong>and</strong> Manzano). IGME<br />
DENSITY DEPENDENT GROUNDWATER FLOW MODEL OF THE SHORE AND<br />
DUNE AREA OF THE WESTHOEK NATURE RESERVE (BELGIUM)<br />
Abstract<br />
A. VANDENBOHEDE <strong>and</strong> L. LEBBE<br />
Dept. Geology <strong>and</strong> Soil Science, Ghent University. Krijgslaan 281 (S8), B-9000 Gent, Belgium.<br />
Tel: 32-(0)9-2644652, Fax: 32-(0)9-2644652<br />
E-mails: Alex<strong>and</strong>er.<strong>V<strong>and</strong>enbohede</strong>@UGent.be<br />
Luc.<strong>Lebbe</strong>@UGent.be<br />
The Westhoek nature reserve is a dune area situated along the French-Belgian border. Below the dunes a<br />
fresh-water lens is found. A particular distribution of salt-water occurring above fresh-water is found under<br />
the adjacent shore. This less known water quality distribution is in dynamic equilibrium. A 2D density<br />
dependent groundwater flow model was made using the MOCDENS3D code. First, the groundwater flow<br />
<strong>and</strong> water quality evolution under the shore <strong>and</strong> in the dunes are modelled. Then the possible impact of<br />
sea level rise is simulated for a number of different scenarios. These scenarios reflect different reactions of<br />
coastal morphology <strong>and</strong> human intervention on the sea level rise. Depending on the scenario, the extent<br />
of the shore’s salt-water lens can increase, decrease of even completely disappear. Simultaneously, the<br />
extent of the dune’s fresh-water lens can significantly be altered. The simulations illustrates also, besides<br />
the effects of sea level rise, that changes in boundary conditions (drainage levels, shore morphology, sea<br />
water level), either natural or human induced, can importantly alter the water quality distribution. Because<br />
of the high ecological value of the area <strong>and</strong> the dune’s importance for drinking water production, these<br />
changes should be well studied beforeh<strong>and</strong>.<br />
Keywords: coastal aquifers, sea level rise, modelling, water quality distribution, Belgium<br />
Introduction<br />
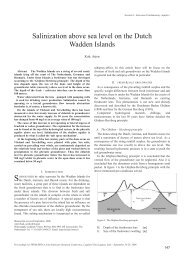
The Westhoek nature reserve is situated on the most western point of the Belgian coast along the French-<br />
Belgian border (Figure 1). It is a dune area of about 340 ha in size <strong>and</strong> is one of the last unfragmented<br />
dune areas along the Belgian coast. The Westhoek dunes are part of the north-western European coastal<br />
dunes, which form a long, narrow dune strip from Calais (France) to the north of Denmark. Since 1957 the<br />
Westhoek dunes are designated as a state nature reserve <strong>and</strong> are currently in h<strong>and</strong>s of the Nature<br />
Corresponding author<br />
197
Density dependent groundwater flow model of the shore <strong>and</strong> dune area of the Westhoek nature reserve (Belgium)<br />
Department of the Ministry of the Flemish Community. The ecological value of the nature reserve <strong>and</strong><br />
adjacent shore is recognised to be high because of its high diversity of fauna <strong>and</strong> flora. Fresh-water is<br />
present in the phreatic dune aquifer. Therefore, the nature reserves bordering dune areas are also the<br />
primary source for drinking water production in the area.<br />
In the south, a low laying hinterl<strong>and</strong>, a polder area, bounds the dunes. Salt-water is present in the polder.<br />
The shore between the Westhoek dunes <strong>and</strong> the sea is one of the widest in Belgium (between 500 <strong>and</strong><br />
600 m) <strong>and</strong> has low angle dip. It is a tidal dominated s<strong>and</strong>y runnel <strong>and</strong> ridge beach. The mean tidal range<br />
is 4.08 m, which is relatively large. A salt-water lens above fresh-water, present under the shore, was<br />
observed <strong>and</strong> studied by <strong>Lebbe</strong> (1978, 1981, 1983, 1999). It was shown that a salt-water lens is present<br />
under the shore above a fresh-water tongue emanating from the dunes towards the sea. This inverse<br />
density distribution is in a dynamical equilibrium.<br />
The lower substratum of the phreatic aquifer is formed by clay of the Kortrijk Formation, Ieper Group. It is<br />
of early Eocene age <strong>and</strong> is considered as impermeable for this study. The lower part of the aquifer consists<br />
of medium to coarse medium s<strong>and</strong>s of Eemian age. The larger part of the aquifer is formed by Holocene<br />
fine-medium s<strong>and</strong>s in which lenses of silty-fine s<strong>and</strong> can occur. The top of the aquifer consists of medium<br />
s<strong>and</strong>s. Generally, the aquifer becomes more heterogeneous going in eastern direction from the French-<br />
Belgian border.<br />
In this paper the development of the water quality distribution in the dunes <strong>and</strong> under the shore is<br />
modelled using the density dependent groundwater flow model MOCDENS3D. Secondly, the impact of<br />
expected sea level changes on this distribution is simulated for three different scenarios: (1) a coastal<br />
defence is present between the shore <strong>and</strong> the dunes, (2) a coastal defence is present between the shore<br />
<strong>and</strong> dunes <strong>and</strong> the shore is heightened <strong>and</strong> (3) the coastline is retreating.<br />
Evolution to the current situation<br />
The MOCDENS3D code (Oude Essink, 1998, 2001) is used. It is based on the three-dimensional solute<br />
transport computer code MOC3D (Konikow et al., 1996), but adapted for density differences.<br />
A 2D model is made simulating the groundwater flow in the polder, dunes <strong>and</strong> under the shore in a crosssection<br />
perpendicular on the coastline. The model consists of 30 layers <strong>and</strong> 330 columns, so the grid has<br />
9900 cells. Every cell has a width of 10 m <strong>and</strong> the thickness of every layer is 1.0 m. So, the model grid is<br />
3300 m in width <strong>and</strong> 30 m deep. It is divided in four parts, columns 1 to 75 represents the polder, columns<br />
76 to 245 the dunes, columns 246 to 299 the shore <strong>and</strong> columns 300 to 330 the sea. The aquifer is<br />
bounded below by clay of the Kortrijk Formation, which is considered impermeable here. The vertical<br />
boundary in the polder is a constant salt-water head boundary recalculated to corresponding fresh-water<br />
heads. The upper boundary is located in the polder, dunes, on the shore <strong>and</strong> the sea. In the polder a<br />
recharge of 280 mm/year is used <strong>and</strong> drainage to a certain drainage level (see further). In the dunes a<br />
constant vertical flow boundary is assumed with a recharge rate of 280 mm fresh-water per year. A<br />
constant head boundary is set on the shore <strong>and</strong> the sea. The values of these fresh-water heads were<br />
deduced from measurements made on the shore (<strong>Lebbe</strong>, 1981). They range from 4.5 mTAW (mTAW is the<br />
198
18 <strong>SWIM</strong>. Cartagena 2004, Spain A. VANDENBOHEDE <strong>and</strong> L. LEBBE<br />
Belgian ordnance datum referring to mean low water level, about 2.3 m below mean sea level) on the<br />
dune/shore transition to 2.36 mTAW on the shore/sea transition. The fresh-water head further seaward<br />
corresponds with the mean sea level of 2.36 mTAW. The seaward vertical boundary is an impermeable<br />
boundary.<br />
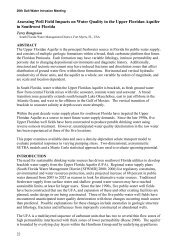
Figure 1. Localisation of the Westhoek nature reserve along the French-Belgian border.<br />
Horizontal hydraulic conductivity of all layers in the dunes <strong>and</strong> under the shore <strong>and</strong> sea is 10.0 m/d <strong>and</strong><br />
vertical hydraulic conductivity is 0.1 m/d. Horizontal hydraulic conductivity for layers in the polders is<br />
6.5 m/d <strong>and</strong> its vertical hydraulic conductivity is 0.065 m/d. Longitudinal, transverse horizontal <strong>and</strong><br />
transverse vertical dispersivity are respectively 0.2 m, 0.02 m <strong>and</strong> 0.002 m. Effective porosity is 0.38. At<br />
the beginning of the simulation, the groundwater reservoir is completely filled with salt-water. This saltwater<br />
has a TDS of 27000 mg/L <strong>and</strong> a density of 1019 kg/m 3 . The fresh replacement water has a TDS of<br />
500 mg/L <strong>and</strong> a density of 1000 kg/m 3 , resulting in a buoyancy of 0.019. A time period of 700 years is<br />
simulated in one stress period divided in 5600 timesteps of 0.125 year. It is hereby considered that from<br />
1300 AD onward the sea had no permanent access in the dunes. A general overview of the evolution of<br />
the Belgian coastal plain can be found in <strong>V<strong>and</strong>enbohede</strong> et al. (2005). After each time step the<br />
groundwater flow is recalculated taking into account the salt-fresh-water distribution from the previous<br />
timestep. Sixteen particles are placed per cell <strong>and</strong> the fresh-water head change criterion for convergence<br />
is 0.1 mm.<br />
Figure 2 shows the results of the simulation of the water quality evolution to the current situation. Due to<br />
the recharge of fresh-water, a fresh-water lens develops under the dunes. This fresh-water lens is almost<br />
completely formed in the first 200 years. A water divide is present in the dunes whereby part of the dune’s<br />
recharge water flows towards the sea <strong>and</strong> part towards the polder. Fresh-water also recharges in the<br />
199
Density dependent groundwater flow model of the shore <strong>and</strong> dune area of the Westhoek nature reserve (Belgium)<br />
Figure 2. Evolution of water quality distribution in the polder, dunes <strong>and</strong> under the shore <strong>and</strong> sea. The simulation<br />
starts in 1300 AD <strong>and</strong> 500 year simulation time corresponds with 1800 AD, 700 years with 2000 AD or the<br />
current situation. Lines of constant fresh-water head are indicated together with isoconcentration lines <strong>and</strong><br />
groundwater flow <strong>and</strong> its velocity using arrows.<br />
200
18 <strong>SWIM</strong>. Cartagena 2004, Spain A. VANDENBOHEDE <strong>and</strong> L. LEBBE<br />
polder. Almost all of this water is, however, drained immediately so that the groundwater reservoir remains<br />
filled with salt-water. Salt-water also recharges on the backshore during high tide. Due to the hydraulic<br />
gradient on the shore, this salt-water flows out on the foreshore <strong>and</strong> seabed, principally during low tide.<br />
Due to the hydraulic gradient between the dunes <strong>and</strong> the mean sea level, fresh-water flows from the dunes<br />
towards the sea. This, with the recharge of salt-water on the backshore, leads to the development of a saltwater<br />
lens above a fresh-water tongue under the shore. The simulations also show that this water quality<br />
distribution is present from about 200 years after the start of the simulation meaning that the nowadaysobserved<br />
water quality distribution is in a dynamical equilibrium.<br />
Drainage levels in the polders altered in recent historical times. Before 1800 AD (simulation time 500 years)<br />
this level is estimate to be 3.0 mTAW. Around 1800 AD the drainage system was ameliorated by the<br />
construction of a few larger channels <strong>and</strong> the drainage level became 2.4 mTAW (simulation time between<br />
500 <strong>and</strong> 700 years). This has its effects on the general water quality distribution. The water dive in the<br />
dunes shifts 640 meter seawards. Therefore, less fresh dune water flows towards the sea diminishing the<br />
dimensions of the fresh-water tongue <strong>and</strong> enlarging the dimensions of the salt-water lens. So, the<br />
combination of a large shore with low relief, a relatively large tidal amplitude <strong>and</strong> a permeable<br />
groundwater reservoir makes that the observed inverse density distribution came into existence.<br />
Sea level rise<br />
The effects of a sea level rise of 0.4 m per century are investigated with the model. This rate of sea level<br />
rise is in line with the ‘Business as Usual’ scenario of the Intergovernmental Panel on Climate Change<br />
(Houghton et al., 1990). This scenario considers the effects when no active steps are taken to limit CO 2<br />
<strong>and</strong> other greenhouse gas releases <strong>and</strong> other conditions (little is done to promote energy-saving measures,<br />
world energy supplies remain heavily dependent on fossil fuels, tropical deforestation continued…) remain<br />
the same. Three different scenarios were modelled.<br />
In a first scenario it is assumed that a coastal defence is present, most likely a dike. Sea level will rise<br />
against this defence <strong>and</strong> the width of the shore will diminish in time. This is modelled by changing the<br />
constant head boundary of the shore <strong>and</strong> dune’s first layer. Results are given in Figure 3. In time, the shore<br />
becomes less wide. Therefore the flow cycle in the salt-water lens, where salt-water infiltrates on the<br />
backshore <strong>and</strong> flows out on the foreshore, becomes smaller. Result is that the salt-water lens dimensions<br />
are diminishing. In the end, when no shore is present, a typical textbook water quality distribution <strong>and</strong><br />
interface between fresh <strong>and</strong> salt-water evolves. Of note is also the seaward shift of the dune’s water divide<br />
after 500 years because its boundary conditions are altered (the constant head on the backshore is now<br />
larger).<br />
In a second scenario it is assumed that a coastal defence is present (for instance a dike) <strong>and</strong> that the shore<br />
is heightened with the same amount as the sea rises, for instance by s<strong>and</strong> suppletion. Thus, the width of<br />
the shore remains always the same. This is again modelled by altering the constant head boundary in the<br />
first layer on the shore <strong>and</strong> sea. Results are given in Figure 4. Because the mean sea level <strong>and</strong> the level of<br />
the shore rise in time, boundary conditions are importantly changed <strong>and</strong> the dune’s water divide shifts<br />
seaward. Therefore, less fresh-water flows towards the sea <strong>and</strong> the dimensions of the fresh-water tongue<br />
201
Density dependent groundwater flow model of the shore <strong>and</strong> dune area of the Westhoek nature reserve (Belgium)<br />
Figure 3. Water quality evolution, fresh-water head <strong>and</strong> flow under the shore, dunes <strong>and</strong> polder along the French-<br />
Belgian border with a sea level rise of 0.4 m <strong>and</strong> in the case a coastal defence is present. This is shown for 2100<br />
AD, 2250 AD <strong>and</strong> 2500 AD. Lines of constant fresh-water head are indicated together with isoconcentration lines<br />
<strong>and</strong> groundwater flow <strong>and</strong> its velocity using arrows.<br />
diminish. This also means that the dimensions of the salt-water lens enlarge.<br />
In a third scenario it is assumed that the coastline is retreating: the width of the shore remains constant<br />
but it moves inl<strong>and</strong>. The transition between polder <strong>and</strong> dunes does not change meaning that the width of<br />
the dune belt decreases. Additionally the shore is heightened in parallel with sea level rise. This is a<br />
simplification of the case where no coastal defence is present <strong>and</strong> the coastline has to retreat due to the<br />
sea level rise. This is again modelled by altering the boundary conditions of the first layer. The position of<br />
the dune’s water divide is here again very important. This water divide moves relatively in the direction of<br />
the sea meaning that less water flows from the dunes towards the sea. As seen before, this leads to an<br />
enlargement of the salt-water lens. At a certain point in time the salt-water lens will reach the substratum<br />
of the ground water reservoir eliminating the flow of fresh-water from the dunes towards the sea. This is<br />
completed when the dune’s water divide is positioned on the transition between the shore <strong>and</strong> the dunes<br />
202
18 <strong>SWIM</strong>. Cartagena 2004, Spain A. VANDENBOHEDE <strong>and</strong> L. LEBBE<br />
Figure 4. Water quality evolution, fresh-water head <strong>and</strong> flow under the shore, dunes <strong>and</strong> polder along the French-<br />
Belgian border with a sea level rise of 0.4 m <strong>and</strong> in the case a dike is present <strong>and</strong> the shore is heightened. This<br />
is shown for 2100 AD, <strong>and</strong> 2250 AD. Lines of constant fresh-water head are indicated together with<br />
isoconcentration lines <strong>and</strong> groundwater flow <strong>and</strong> its velocity using arrows.<br />
<strong>and</strong> fresh-water is no longer allowed to flow to the sea. With a further sea level rise salt-water infiltrates<br />
on the backshore. There is flow of salt-water towards the sea <strong>and</strong> towards the polder. This diminishes the<br />
dune’s fresh-water lens importantly.<br />
Conclusions<br />
Under the shore of the western Belgian coastal plain, an interesting inverse density distribution is found.<br />
A salt-water lens occurs above a fresh-water tongue. This is the combined effect of a permeable<br />
groundwater reservoir, a wide shore with low dip <strong>and</strong> an important tidal amplitude whereby salt-water<br />
infiltrates on the backshore during high tide <strong>and</strong> flows out on the foreshore, principally during low tide. A<br />
fresh-water lens is present in the dunes <strong>and</strong> salt-water is found in the bordering polder. With the<br />
simulations it was shown that sea level rise has an important impact on the groundwater flow <strong>and</strong> water<br />
quality distribution in the dunes <strong>and</strong> under the shore. The shore’s salt-water lens can enlarge, diminish or<br />
even completely disappear. The same can be said about the outflow of the dune’s fresh-water on the sea<br />
floor. In the dunes, the water divide can shift l<strong>and</strong>wards or seawards <strong>and</strong> the dimensions of the fresh-water<br />
lens can alter.<br />
Sea level rise is, speaking in terms of policy <strong>and</strong> management, considered as a long-term issue. The<br />
calculations can, however, also been seen as simulations of changes to the systems boundary condition.<br />
203
Density dependent groundwater flow model of the shore <strong>and</strong> dune area of the Westhoek nature reserve (Belgium)<br />
Figure 5. Water quality evolution, fresh-water head <strong>and</strong> flow under the shore, dunes <strong>and</strong> polder along the French-<br />
Belgian border with a sea level rise of 0.4 m <strong>and</strong> in the case the coastline is retreating. This is shown for 2100<br />
AD, 2250 AD, 2375 AD <strong>and</strong> 2500 AD. Lines of constant fresh-water head are indicated together with<br />
isoconcentration lines <strong>and</strong> groundwater flow <strong>and</strong> its velocity using arrows.<br />
204
18 <strong>SWIM</strong>. Cartagena 2004, Spain A. VANDENBOHEDE <strong>and</strong> L. LEBBE<br />
Thereby, they show what can happen if for instance the shore’s morphology is changed, drainage levels in<br />
the polder relative to the mean sea level are altered or the dune’s water divide is displaced.These are shortterm<br />
operations. Simulation show that important changes to the groundwater flow <strong>and</strong> water quality<br />
distribution can be the result of that. The area of <strong>and</strong> surrounding the Westhoek nature reserve has a high<br />
ecological value <strong>and</strong> rich diversity of fauna <strong>and</strong> flora partially originating from the underlying<br />
hydrogeology. Moreover the dunes are the only source for drinking water production in the area. Therefore<br />
generally human interference in coastal plains must be carefully studied <strong>and</strong> planned beforeh<strong>and</strong>.<br />
References<br />
HOUGHTON, J.T.; JENKINS, G.J. <strong>and</strong> EPHRAUMS, J.J. (eds) (1990). Climate Change. The IPCC Scientific Assessment.<br />
Intergovernmental Panel on Climate Change (IPCC), Science Working Group (I). Cambridge University Press.<br />
KONIKOW, L.F.; GOODE, D.J. <strong>and</strong> HORNBERGER, G.Z. (1996). A three-dimensional method-of- characteristics solutetransport<br />
model (MOC3D). U.S.G.S. Water Resources Investigation Report 69-4267.<br />
LEBBE, L. (1978). Hydrogeologie van het duingebied ten westen van De Panne. Ph.D. Thesis, Geological Institute,<br />
Ghent University. (Hydrogeology of the dune area west of De Panne; in Dutch). (Unpublished).<br />
LEBBE, L. (1981). The subterranean flow of fresh <strong>and</strong> salt-water underneath the western Belgian beach. 7th Salt-water<br />
Intrusion Meeting, Uppsala. Sver. Geol. Unders. Rap. Meddel. 27: 193-219.<br />
LEBBE, L. (1983). Mathematical model of the evolution of the fresh-water lens under the dunes <strong>and</strong> beach with semidiurnal<br />
tides. 8th Salt-water Intrusion Meeting, Bari. Geologia Applicata e Idrogeologia, XVIII(II): 211-226.<br />
LEBBE, L. (1999). Parameter identification in fresh-salt-water flow based on borehole resistivities <strong>and</strong> freshwater head<br />
data. Advances in Water Resources, 22(8): 791-806.<br />
OUDE ESSINK, G.P. (1998). MOC3D adapted to simulate 3D density-dependent groundwater flow. In: Proc. of<br />
MODFLOW ’98 Conference, October, 4-8, 1998, Golden, Colorado, USA, I: 291-303.<br />
OUDE ESSINK, G.H.P. (2001). Salt-water Intrusion in a Three-Dimensional Groundwater System in The Netherl<strong>and</strong>s: A<br />
Numerical Study. Transport in Porous Media, 43(1): 137-158.<br />
VANDENBOHEDE, A.; LINSTER, T. <strong>and</strong> LEBBE, L. (2005). Modelling of density dependent groundwater flow in the<br />
southwestern Belgian coastal plain. This volume.<br />
205