

ANNUAL REPORT 2003 INEX PARTNERS OY
ANNUAL REPORT 2003 INEX PARTNERS OY
ANNUAL REPORT 2003 INEX PARTNERS OY

Create successful ePaper yourself
Turn your PDF publications into a flip-book with our unique Google optimized e-Paper software.
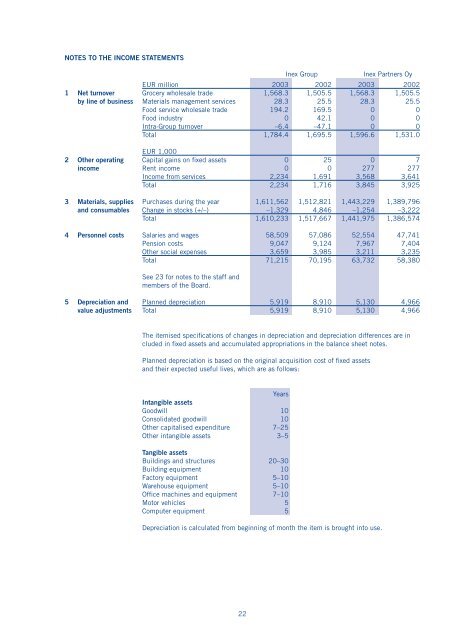
NOTES TO THE INCOME STATEMENTS<br />
Inex Group Inex Partners Oy<br />
EUR million <strong>2003</strong> 2002 <strong>2003</strong> 2002<br />
1 Net turnover Grocery wholesale trade 1,568.3 1,505.5 1,568.3 1,505.5<br />
by line of business Materials management services 28.3 25.5 28.3 25.5<br />
Food service wholesale trade 194.2 169.5 0 0<br />
Food industry 0 42.1 0 0<br />
Intra-Group turnover –6.4 –47.1 0 0<br />
Total 1,784.4 1,695.5 1,596.6 1,531.0<br />
EUR 1,000<br />
2 Other operating Capital gains on fi xed assets 0 25 0 7<br />
income Rent income 0 0 277 277<br />
Income from services 2,234 1,691 3,568 3,641<br />
Total 2,234 1,716 3,845 3,925<br />
3 Materials, supplies Purchases during the year 1,611,562 1,512,821 1,443,229 1,389,796<br />
and consumables Change in stocks (+/–) –1,329 4,846 –1,254 –3,222<br />
Total 1,610,233 1,517,667 1,441,975 1,386,574<br />
4 Personnel costs Salaries and wages 58,509 57,086 52,554 47,741<br />
Pension costs 9,047 9,124 7,967 7,404<br />
Other social expenses 3,659 3,985 3,211 3,235<br />
Total 71,215 70,195 63,732 58,380<br />
See 23 for notes to the staff and<br />
members of the Board.<br />
5 Depreciation and Planned depreciation 5,919 8,910 5,130 4,966<br />
value adjustments Total 5,919 8,910 5,130 4,966<br />
The itemised specifi cations of changes in depreciation and depreciation differences are in<br />
cluded in fi xed assets and accumulated appropriations in the balance sheet notes.<br />
Planned depreciation is based on the original acquisition cost of fi xed assets<br />
and their expected useful lives, which are as follows:<br />
Years<br />
Intangible assets<br />
Goodwill 10<br />
Consolidated goodwill 10<br />
Other capitalised expenditure 7–25<br />
Other intangible assets 3–5<br />
Tangible assets<br />
Buildings and structures 20–30<br />
Building equipment 10<br />
Factory equipment 5–10<br />
Warehouse equipment 5–10<br />
Offi ce machines and equipment 7–10<br />
Motor vehicles 5<br />
Computer equipment 5<br />
Depreciation is calculated from beginning of month the item is brought into use.<br />
22