

ANNUAL REPORT 2003 INEX PARTNERS OY
ANNUAL REPORT 2003 INEX PARTNERS OY
ANNUAL REPORT 2003 INEX PARTNERS OY

You also want an ePaper? Increase the reach of your titles
YUMPU automatically turns print PDFs into web optimized ePapers that Google loves.
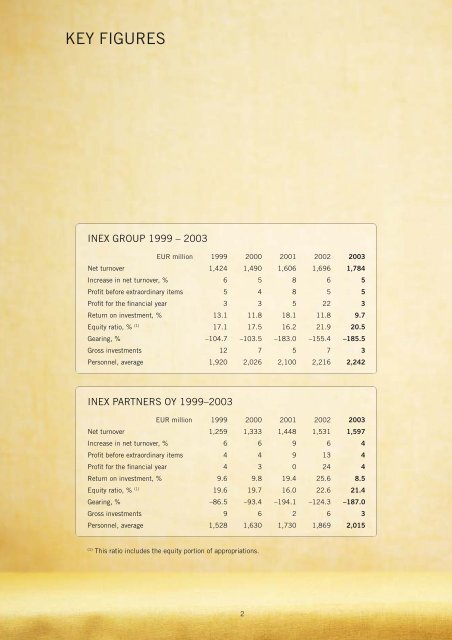
KEY FIGURES<br />
<strong>INEX</strong> GROUP 1999 – <strong>2003</strong><br />
EUR million 1999 2000 2001 2002 <strong>2003</strong><br />
Net turnover 1,424 1,490 1,606 1,696 1,784<br />
Increase in net turnover, % 6 5 8 6 5<br />
Profi t before extraordinary items 5 4 8 5 5<br />
Profi t for the fi nancial year 3 3 5 22 3<br />
Return on investment, % 13.1 11.8 18.1 11.8 9.7<br />
Equity ratio, % (1) 17.1 17.5 16.2 21.9 20.5<br />
Gearing, % –104.7 –103.5 –183.0 –155.4 –185.5<br />
Gross investments 12 7 5 7 3<br />
Personnel, average 1,920 2,026 2,100 2,216 2,242<br />
<strong>INEX</strong> <strong>PARTNERS</strong> <strong>OY</strong> 1999–<strong>2003</strong><br />
EUR million 1999 2000 2001 2002 <strong>2003</strong><br />
Net turnover 1,259 1,333 1,448 1,531 1,597<br />
Increase in net turnover, % 6 6 9 6 4<br />
Profi t before extraordinary items 4 4 9 13 4<br />
Profi t for the fi nancial year 4 3 0 24 4<br />
Return on investment, % 9.6 9.8 19.4 25.6 8.5<br />
Equity ratio, % (1) 19.6 19.7 16.0 22.6 21.4<br />
Gearing, % –86.5 –93.4 –194.1 –124.3 –187.0<br />
Gross investments 9 6 2 6 3<br />
Personnel, average 1,528 1,630 1,730 1,869 2,015<br />
(1) This ratio includes the equity portion of appropriations.<br />
2