

1 The wavelet transform - International Computer Science Institute
1 The wavelet transform - International Computer Science Institute
1 The wavelet transform - International Computer Science Institute

Create successful ePaper yourself
Turn your PDF publications into a flip-book with our unique Google optimized e-Paper software.
83<br />
Audio encoding schemes<br />
output signal. <strong>The</strong> 16 buttons together correspond to the complete <strong>transform</strong> block. Activating<br />
the first button on the left will set one sixteenth of the <strong>transform</strong> coefficients to zero. In order to<br />
use this kind of compression in a meaningful way, it is necessary to know how the <strong>transform</strong><br />
coefficients are arranged within the <strong>transform</strong> interval. When a signal is compressed its reconstruction<br />
from the remaining <strong>transform</strong> coefficients differs from the original signal. In the top<br />
right corner of the user interface the error label (11) gives a coarse measurement of a mean<br />
error history. We calculate the mean error with<br />
e<br />
n – 1<br />
1<br />
= -- u<br />
n ∑ k – ûk k = 0<br />
where n is the number of samples, ui the i -th coefficient of the original sample vector and ûi the i -th coefficient of the reconstructed vector. Since this value varies too quickly with every<br />
other <strong>transform</strong>ation, we rather display an error value that is an average over the history of the<br />
mean error with<br />
eh = 0, 99eh + 0, 01e<br />
<strong>The</strong> error label (11) shows the value multiplied with a scaling factor of 100.<br />
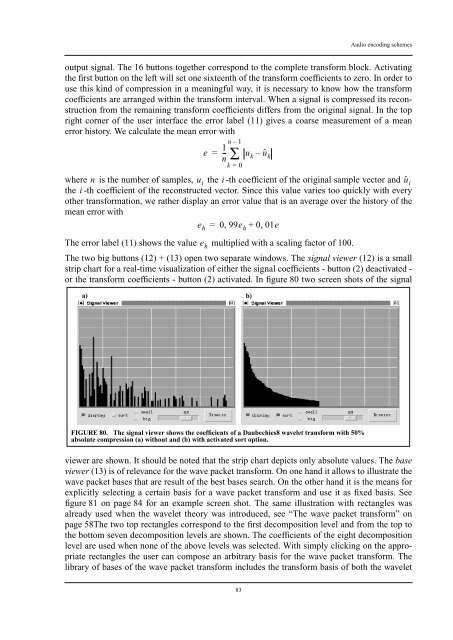
<strong>The</strong> two big buttons (12) + (13) open two separate windows. <strong>The</strong> signal viewer (12) is a small<br />
strip chart for a real-time visualization of either the signal coefficients - button (2) deactivated -<br />
or the <strong>transform</strong> coefficients - button (2) activated. In figure 80 two screen shots of the signal<br />
a) b)<br />
e h<br />
FIGURE 80. <strong>The</strong> signal viewer shows the coefficients of a Daubechies8 <strong>wavelet</strong> <strong>transform</strong> with 50%<br />
absolute compression (a) without and (b) with activated sort option.<br />
viewer are shown. It should be noted that the strip chart depicts only absolute values. <strong>The</strong> base<br />
viewer (13) is of relevance for the wave packet <strong>transform</strong>. On one hand it allows to illustrate the<br />
wave packet bases that are result of the best bases search. On the other hand it is the means for<br />
explicitly selecting a certain basis for a wave packet <strong>transform</strong> and use it as fixed basis. See<br />
figure 81 on page 84 for an example screen shot. <strong>The</strong> same illustration with rectangles was<br />
already used when the <strong>wavelet</strong> theory was introduced, see “<strong>The</strong> wave packet <strong>transform</strong>” on<br />
page 58<strong>The</strong> two top rectangles correspond to the first decomposition level and from the top to<br />
the bottom seven decomposition levels are shown. <strong>The</strong> coefficients of the eight decomposition<br />
level are used when none of the above levels was selected. With simply clicking on the appropriate<br />
rectangles the user can compose an arbitrary basis for the wave packet <strong>transform</strong>. <strong>The</strong><br />
library of bases of the wave packet <strong>transform</strong> includes the <strong>transform</strong> basis of both the <strong>wavelet</strong>