

Year 2012 - Volume 1 - Issue 1 - IJMS
Year 2012 - Volume 1 - Issue 1 - IJMS
Year 2012 - Volume 1 - Issue 1 - IJMS

You also want an ePaper? Increase the reach of your titles
YUMPU automatically turns print PDFs into web optimized ePapers that Google loves.
10<br />
<strong>IJMS</strong><br />
International Journal of<br />
Medical Students<br />
There was no observable trend toward higher or lower readings<br />
regardless of the device used, average SBP or order of<br />
the blood pressure assessment. Variability was consistent<br />
across the range of SBP (85-135 mmHg).<br />
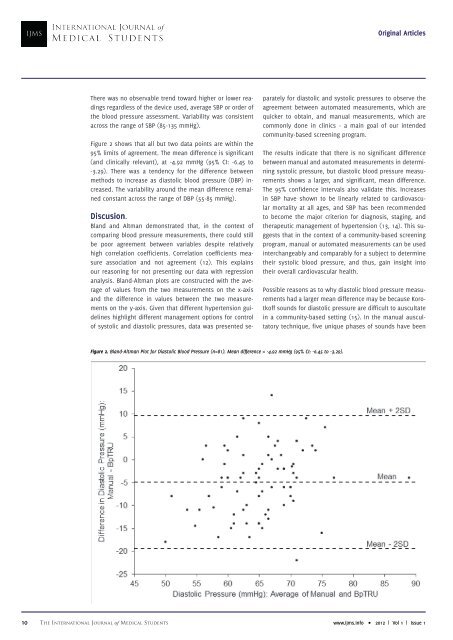
Figure 2 shows that all but two data points are within the<br />
95% limits of agreement. The mean difference is significant<br />
(and clinically relevant), at -4.92 mmHg (95% CI: -6.45 to<br />
-3.29). There was a tendency for the difference between<br />
methods to increase as diastolic blood pressure (DBP) increased.<br />
The variability around the mean difference remained<br />
constant across the range of DBP (55-85 mmHg).<br />
Discusion.<br />
Bland and Altman demonstrated that, in the context of<br />
comparing blood pressure measurements, there could still<br />
be poor agreement between variables despite relatively<br />
high correlation coefficients. Correlation coefficients measure<br />
association and not agreement (12). This explains<br />
our reasoning for not presenting our data with regression<br />
analysis. Bland-Altman plots are constructed with the average<br />
of values from the two measurements on the x-axis<br />
and the difference in values between the two measurements<br />
on the y-axis. Given that different hypertension guidelines<br />
highlight different management options for control<br />
of systolic and diastolic pressures, data was presented se-<br />
Original Articles<br />
parately for diastolic and systolic pressures to observe the<br />
agreement between automated measurements, which are<br />
quicker to obtain, and manual measurements, which are<br />
commonly done in clinics - a main goal of our intended<br />
community-based screening program.<br />
The results indicate that there is no significant difference<br />
between manual and automated measurements in determining<br />
systolic pressure, but diastolic blood pressure measurements<br />
shows a larger, and significant, mean difference.<br />
The 95% confidence intervals also validate this. Increases<br />
in SBP have shown to be linearly related to cardiovascular<br />
mortality at all ages, and SBP has been recommended<br />
to become the major criterion for diagnosis, staging, and<br />
therapeutic management of hypertension (13, 14). This suggests<br />
that in the context of a community-based screening<br />
program, manual or automated measurements can be used<br />
interchangeably and comparably for a subject to determine<br />
their systolic blood pressure, and thus, gain insight into<br />
their overall cardiovascular health.<br />
Possible reasons as to why diastolic blood pressure measurements<br />
had a larger mean difference may be because Korotkoff<br />
sounds for diastolic pressure are difficult to auscultate<br />
in a community-based setting (15). In the manual auscultatory<br />
technique, five unique phases of sounds have been<br />
Figure 2. Bland-Altman Plot for Diastolic Blood Pressure (n=81). Mean difference = -4.92 mmHg (95% CI: -6.45 to -3.29).<br />
The International Journal of Medical Students www.ijms.info • <strong>2012</strong> | Vol 1 | <strong>Issue</strong> 1