


Create successful ePaper yourself
Turn your PDF publications into a flip-book with our unique Google optimized e-Paper software.
24<br />
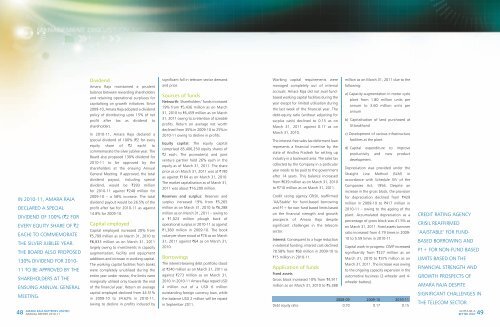
Production in million units<br />
M&HCV Tractors<br />
3-wheelers LCV<br />
Cars Utility vehicles<br />
1.05 0.26 0.43 0.17 0.22 0.31<br />
1.24 0.31 0.56 0.23 0.29 0.36<br />
1.42 0.35 0.50 0.25 0.29 0.35<br />
1.52 0.32 0.50 0.22 0.19 0.34<br />
1.52 0.32 0.50 0.22 0.19 0.34<br />
2.45 0.53 0.80 0.42 0.34 0.52<br />
2005-06<br />
2006-07<br />
2007-08<br />
2008-09<br />
2009-10<br />
2010-11<br />
CAGR for the last five years (2005-06<br />
to 2010-11): Car – 18.6%, UV 15.2%,<br />
3W – 13%, LCV – 18.9%, M&HCV –<br />
9.4% and Tractor – 10.8%<br />
AMARA RAJA BATTERIES LIMITED<br />
ANNUAL REPORT 2010-11<br />
- not only in the numbers but also in<br />
sentiments, primarily driven by global<br />
cues and policy responses addressing<br />
inflation.<br />
Headline inflation witnessed a relentless<br />
rise during the first half of 2010 and<br />
remained in double digits for almost five<br />
months in 2010. An uneven monsoon in<br />
2009, domestic supply-side constraints,<br />
coupled with rising food grain and oil<br />
prices, fuelled inflation in the<br />
manufacturing goods and services<br />
sectors.<br />
Economic growth estimates<br />
Given the underlying momentum, the<br />
Indian economic outlook became<br />
conducive for a sustained increase in<br />
services sector growth, normalisation in<br />
agricultural output and strengthening<br />
private consumption. Substantial<br />
government thrust on infrastructure<br />
development will propel industrial sector<br />
growth. As a result, India’s GDP is<br />
expected to grow 8-8.5% in 2011 as<br />
private demand gathers momentum and<br />
supports the overall growth process.<br />
However, the two perceived road blocks<br />
are inflation and rising global oil prices.<br />
In view of this, the International<br />
Monetary Fund scaled down India’s<br />
growth projection for 2011 to 8.2%.<br />
How the user sectors<br />
performed<br />
Automotive: The Indian automotive<br />
segment registered a 26.7% growth in<br />
vehicle sales in 2010-11, owing to robust<br />
economic growth, increased rural focus<br />
and launch of new models. A total of 24<br />
new launches were recorded in the<br />
passenger vehicle segment and 16 in the<br />
2-wheeler segment.<br />
Production in the automobile industry<br />
grew consistently in the last five years as<br />
shown below, which augurs well for the<br />
automobile battery replacement market.<br />
Telecom: Indian telecom sector emerged<br />
as an economic success story, registering<br />
a consistent growth of about 35% over<br />
the past decade in terms of subscribers.<br />
According to a World Bank study, a 10%<br />
increase in teledensity is known to<br />
improve GDP growth by 0.6%. In other<br />
words, a 1% increase in mobile<br />
subscribers is estimated to increase per<br />
capita GDP by about USD 200. According<br />
to a study by the Indian Council for<br />
Research on International Economic<br />
Relations (ICRIER), higher tele-density<br />
regions have grown faster than those<br />
with lower teledensity.<br />
The total wireless and broadband<br />
subscriber base was at 811.59 million<br />
and 11.87 million respectively by March<br />
2011. The overall telecom penetration,<br />
including wireline connectivity, reached<br />
157.32% in urban markets, and 33.79%<br />
in rural markets. Indian telecom sector<br />
witnessed the much-awaited 3G & BWA<br />
spectrum auction for which the<br />
Government of India received `1,062<br />
billion as license fee.<br />
However, the subscriber base growth did<br />
not translate into network expansion, as<br />
service providers and tower infrastructure<br />
companies focused on maximising the<br />
asset utilisation efficiency of existing<br />
networks through tower-sharing model.<br />
Consequently, capital expenditure<br />
declined, impacting the revenues of<br />
telecom equipment manufacturers.<br />
IT and ITeS: The Indian IT-BPO industry<br />
witnessed robust recovery in 2010-11.<br />
The IT-BPO industry’s revenues are<br />
expected to grow by 19.2% to USD 88.1<br />
billion in 2010-11 compared with USD<br />
73.9 billion in 2009-10.<br />
The Indian software and services exports<br />
(including ITeS-BPO) are estimated at<br />
USD 59 billion in 2010-11, compared<br />
with USD 50 billion in 2009-10, an<br />
increase of 18%. The emerging market<br />
share in total exports increased from<br />
9.4% in 2009-10 to 9.7% in 2010-11.<br />
The IT-BPO industry played a key role in<br />
putting India on the world map. The<br />
industry attracted more than 10% of the<br />
total FDI flowing into India.<br />
Indian battery market<br />
The size of the Indian lead acid storage<br />
battery industry (including inverter and<br />
motive power batteries) as on March<br />
2011, at a lead base of USD 2,500/MT, is<br />
estimated to be about `130 billion,<br />
comprising the industrial batteries<br />
(`48 billion) and automotive batteries<br />
(`82 billion). The overall size of the<br />
unorganised sector is estimated at about<br />
`35 billion. The automotive battery<br />
business accounts for nearly 63%, while<br />
the industrial segment accounts for the<br />
rest.<br />
The automotive SLI (Starting, Lighting<br />
and Ignition) battery segment can be<br />
divided into the OEM (~25%) and<br />
aftermarket segments (~75%). Demand<br />
for automotive batteries is divided among<br />
different segments, with cars and utility<br />
vehicles constituting the largest share of<br />
36%, followed by commercial vehicles at<br />
about 28%, 2-wheelers at about 21%<br />
and tractors at 15%. Demand for<br />
automotive batteries largely relies on the<br />
growth of the automobile OEMs and the<br />
aftermarket. Growth in the industrial<br />
batteries segment is driven by<br />
infrastructure and technology-related<br />
industries such as power, UPS and<br />
telecommunications.<br />
Automotive batteries: Growth in the<br />
automotive battery segment is driven by<br />
vehicle rollout and replacement demand.<br />
The OEM business is driven by fresh<br />
vehicle (4-wheelers and 2-wheelers)<br />
demand. Aftermarket sales are influenced<br />
by the number of vehicles in use, average<br />
battery life, average vehicle age and<br />
population growth. In the aftermarket,<br />
Production in million units<br />
Moped<br />
Scooter<br />
Motor cycle<br />
0.70<br />
2.14<br />
0.67<br />
1.4910.63<br />
0.39<br />
0.38 0.43 0.44<br />
0.98 1.08 1.16 8.44<br />
0.99 7.10 6.66 6.80<br />
6.20<br />
2005-06<br />
2006-07<br />
2007-08<br />
2008-09<br />
2009-10<br />
2010-11<br />
Two-wheelers CAGR for the last five<br />
years (2005-06 to 2010-11): 12 %<br />
<strong>GOTTA</strong> <strong>BE</strong> A<br />
<strong>BE</strong>TTER <strong>WAY</strong> 25