PARABOLIC DISH FEEDS — PERFORMANCE ANALYSIS - QSL.net
PARABOLIC DISH FEEDS — PERFORMANCE ANALYSIS - QSL.net
PARABOLIC DISH FEEDS — PERFORMANCE ANALYSIS - QSL.net

Create successful ePaper yourself
Turn your PDF publications into a flip-book with our unique Google optimized e-Paper software.
atio of focal length to diameter, have the same geometry regardless of reflector diameter.<br />
Thus, all dishes with the same f/D can use the same feed design, and good feed designs are<br />
available for several common values of f/D.<br />
Efficiency calculation<br />
The aperture efficiency of a dish antenna is the amount energy concentrated into the beam<br />
divided by the total energy radiated by the feed. The efficiency can calculated by<br />
integrating (remember calculus?) the feed pattern radiated over the area of the reflector<br />
and dividing the result by the total integrated feed pattern. When this calculation was<br />
done by hand, it was usually done by approximating the feed pattern with an idealized cos n<br />
feed pattern (n = 3 in this example) as shown in Figure 11-3, making the integration much<br />
easier. With a computer, we can do numerical integration of actual feed patterns,<br />
performing the tedious calculations for many data points.<br />
The numerical integration routine I used is borrowed from a BASIC program by W7PUA 1<br />
which is based on a 1947 paper by Cutler 2 . I translated the routine to C++, then added<br />
some enhancements:<br />
• the data interpolation is more flexible to use whatever feed pattern data is<br />
available,<br />
• feed blockage loss is calculated,<br />
• and the output is graphical for visual comprehension.<br />
I find that a simple curve is easier to understand than tables of numbers or long<br />
descriptions. The output format is PostScript, which can be displayed or printed using<br />
the free Ghostscript software 3 .<br />
The bottom half of Figure 11-3 is an example of the graphical output, a plot of efficiency<br />
vs. f/D for the cos n feed pattern shown as a polar plot in the top half of Figure 11-3. It is<br />
obvious at a glance that this feed pattern is best suited for a reflector with an f/D of 0.4 to<br />
0.5. The calculated efficiency of 80% for this idealized feed pattern provides a benchmark<br />
against which real feed antennas may be compared.<br />
The efficiency curve in Figure 11-3 shows decreasing efficiency for f/D less than 0.4.<br />
These are deep dishes, requiring the feed to provide illumination over a very wide angle.<br />
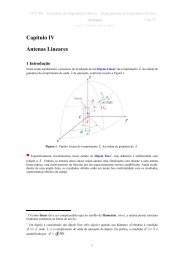
For a dish with an f/D = 0.25, the focus is level with the rim of the dish, so that the feed<br />
must provide illumination over 180 degrees, as shown in Figure 11-4a. The polar plot of<br />
feed radiation in Figure 11-3 shows almost no energy radiated straight up and down,<br />
toward the edges of this dish. So it is not surprising that the illumination loss increases for<br />
small values of f/D.<br />
The other end of the efficiency curve, for f/D greater than 0.5, also shows a decreasing<br />
efficiency. These shallower dishes, like the one illustrated in Figure 11-4b, require a<br />
narrower angle of illumination, so more of the energy from the feed in Figure 11-3 misses<br />
the dish, and spillover loss increases as the f/D increases.