PARABOLIC DISH FEEDS — PERFORMANCE ANALYSIS - QSL.net
PARABOLIC DISH FEEDS — PERFORMANCE ANALYSIS - QSL.net
PARABOLIC DISH FEEDS — PERFORMANCE ANALYSIS - QSL.net

Create successful ePaper yourself
Turn your PDF publications into a flip-book with our unique Google optimized e-Paper software.
Chapter 11<br />
<strong>PARABOLIC</strong> <strong>DISH</strong> <strong>FEEDS</strong> <strong>—</strong><br />
<strong>PERFORMANCE</strong> <strong>ANALYSIS</strong><br />
Paul Wade N1BWT © 1997,1998<br />
Achieving optimum performance from a microwave dish antenna requires that the feed<br />
antenna be matched to the parabolic reflector. Traditionally, we have relied on “rules of<br />
thumb” to choose a feed for the dish. Alternatively, a computer program can be used to<br />
analyze performance of a feed antenna based on measured or calculated radiation patterns<br />
and, more importantly, present the data in a graphical format for easy comprehension.<br />
This tool is used to explore a number of published feed designs in an effort to enhance<br />
understanding of the performance of dish antennas and feeds.<br />
Parabolic antenna overview<br />
Parabolic dish antenna fundamentals were covered in detail in Chapter 4, but a short<br />
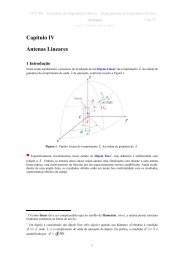
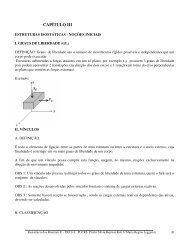
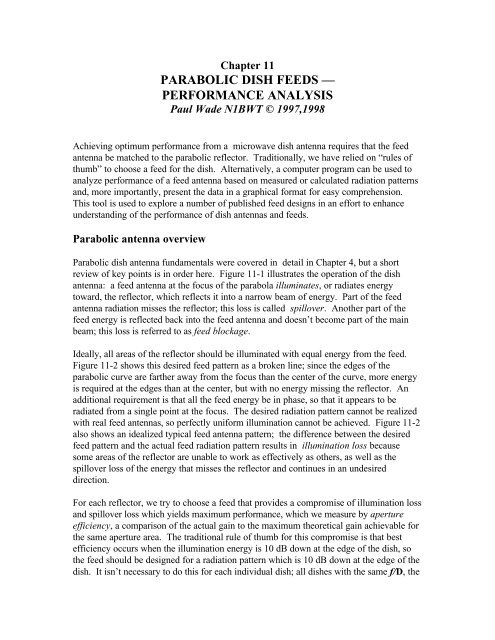
review of key points is in order here. Figure 11-1 illustrates the operation of the dish<br />
antenna: a feed antenna at the focus of the parabola illuminates, or radiates energy<br />
toward, the reflector, which reflects it into a narrow beam of energy. Part of the feed<br />
antenna radiation misses the reflector; this loss is called spillover. Another part of the<br />
feed energy is reflected back into the feed antenna and doesn’t become part of the main<br />
beam; this loss is referred to as feed blockage.<br />
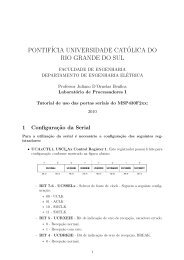
Ideally, all areas of the reflector should be illuminated with equal energy from the feed.<br />
Figure 11-2 shows this desired feed pattern as a broken line; since the edges of the<br />
parabolic curve are farther away from the focus than the center of the curve, more energy<br />
is required at the edges than at the center, but with no energy missing the reflector. An<br />
additional requirement is that all the feed energy be in phase, so that it appears to be<br />
radiated from a single point at the focus. The desired radiation pattern cannot be realized<br />
with real feed antennas, so perfectly uniform illumination cannot be achieved. Figure 11-2<br />
also shows an idealized typical feed antenna pattern; the difference between the desired<br />
feed pattern and the actual feed radiation pattern results in illumination loss because<br />
some areas of the reflector are unable to work as effectively as others, as well as the<br />
spillover loss of the energy that misses the reflector and continues in an undesired<br />
direction.<br />
For each reflector, we try to choose a feed that provides a compromise of illumination loss<br />
and spillover loss which yields maximum performance, which we measure by aperture<br />
efficiency, a comparison of the actual gain to the maximum theoretical gain achievable for<br />
the same aperture area. The traditional rule of thumb for this compromise is that best<br />
efficiency occurs when the illumination energy is 10 dB down at the edge of the dish, so<br />
the feed should be designed for a radiation pattern which is 10 dB down at the edge of the<br />
dish. It isn’t necessary to do this for each individual dish; all dishes with the same f/D, the
Feed<br />
Blockage<br />
Focus<br />
Geometry of Parabolic Dish Antenna<br />
Figure 11-1<br />
Spillover
Illumination loss<br />
Spillover loss<br />
0 dB -10 dB -20 dB<br />
f/D = 0.4<br />
Illumination taper = 10 dB<br />
Figure 11-2. Typical vs. Desired Dish Illumination
atio of focal length to diameter, have the same geometry regardless of reflector diameter.<br />
Thus, all dishes with the same f/D can use the same feed design, and good feed designs are<br />
available for several common values of f/D.<br />
Efficiency calculation<br />
The aperture efficiency of a dish antenna is the amount energy concentrated into the beam<br />
divided by the total energy radiated by the feed. The efficiency can calculated by<br />
integrating (remember calculus?) the feed pattern radiated over the area of the reflector<br />
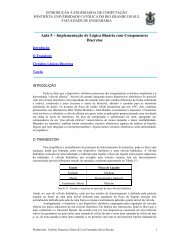
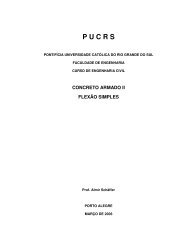
and dividing the result by the total integrated feed pattern. When this calculation was<br />
done by hand, it was usually done by approximating the feed pattern with an idealized cos n<br />
feed pattern (n = 3 in this example) as shown in Figure 11-3, making the integration much<br />
easier. With a computer, we can do numerical integration of actual feed patterns,<br />
performing the tedious calculations for many data points.<br />
The numerical integration routine I used is borrowed from a BASIC program by W7PUA 1<br />
which is based on a 1947 paper by Cutler 2 . I translated the routine to C++, then added<br />
some enhancements:<br />
• the data interpolation is more flexible to use whatever feed pattern data is<br />
available,<br />
• feed blockage loss is calculated,<br />
• and the output is graphical for visual comprehension.<br />
I find that a simple curve is easier to understand than tables of numbers or long<br />
descriptions. The output format is PostScript, which can be displayed or printed using<br />
the free Ghostscript software 3 .<br />
The bottom half of Figure 11-3 is an example of the graphical output, a plot of efficiency<br />
vs. f/D for the cos n feed pattern shown as a polar plot in the top half of Figure 11-3. It is<br />
obvious at a glance that this feed pattern is best suited for a reflector with an f/D of 0.4 to<br />
0.5. The calculated efficiency of 80% for this idealized feed pattern provides a benchmark<br />
against which real feed antennas may be compared.<br />
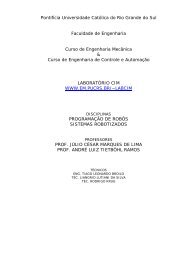
The efficiency curve in Figure 11-3 shows decreasing efficiency for f/D less than 0.4.<br />
These are deep dishes, requiring the feed to provide illumination over a very wide angle.<br />
For a dish with an f/D = 0.25, the focus is level with the rim of the dish, so that the feed<br />
must provide illumination over 180 degrees, as shown in Figure 11-4a. The polar plot of<br />
feed radiation in Figure 11-3 shows almost no energy radiated straight up and down,<br />
toward the edges of this dish. So it is not surprising that the illumination loss increases for<br />
small values of f/D.<br />
The other end of the efficiency curve, for f/D greater than 0.5, also shows a decreasing<br />
efficiency. These shallower dishes, like the one illustrated in Figure 11-4b, require a<br />
narrower angle of illumination, so more of the energy from the feed in Figure 11-3 misses<br />
the dish, and spillover loss increases as the f/D increases.
Efficiency %<br />
N1BWT 1997<br />
90<br />
80<br />
70<br />
60<br />
50<br />
40<br />
30<br />
20<br />
10<br />
0.25<br />
Cosine n Feed Pattern<br />
Figure 11-3<br />
0 dB -10 -20 -30<br />
E-plane<br />
H-plane<br />
Dish diameter = 10 λ<br />
Feed diameter = 1 λ<br />
MAX Possible Efficiency AFTER LOSSES:<br />
0.3 0.4 0.5 0.6 0.7 0.8 0.9<br />
Parabolic Dish f/D<br />
Illumination<br />
Spillover<br />
Feed Blockage<br />
1 dB<br />
2 dB<br />
3 dB<br />
4 dB<br />
5 dB<br />
6 dB<br />
7 dB<br />
8 dB
Illumination loss<br />
Spillover loss<br />
0 dB -10 -20<br />
Dish Illumination f/D = 0.25<br />
Figure 11-4a
Illumination loss<br />
Spillover loss<br />
0 dB -10 -20<br />
Illumination taper = 10 dB<br />
Figure 11-4b: Dish Illumination f/D = 0.75
Real feed antenna example<br />
Now let’s look at an example of a real antenna. There are many big TVRO dishes around<br />
which are being replaced by the small DSS systems and becoming available. A 12-foot<br />
TVRO dish might be usable for EME operation on 1296 MHz. The dishes typically have<br />
an f/D around 0.35 to 0.45, so we would like to find a suitable feedhorn. Popular<br />
feedhorn designs for 1296 MHz have been described by W2IMU 4 and VE4MA 5 , so let’s<br />
look at graphs of the published patterns for these two feeds. The W2IMU dual-mode<br />
feedhorn in Figure 11-5 provides good efficiency at an f/D around 0.6, but is not very<br />
good around our target of 0.35 to 0.45. On the other hand, the VE4MA feedhorn in<br />
Figure 11-6 provides its best efficiency at an f/D around 0.4, so it is a much better choice<br />
for a TVRO dish. The maximum calculated efficiency is just a bit lower than the 80% for<br />
the idealized feed in Figure 11-3. Later we will compare it with other real feeds.<br />
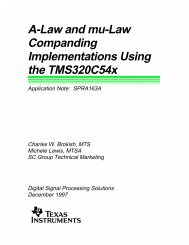
Feed blockage loss<br />
The feed blockage loss shown in Figure 11-6 is under 10% for a twelve foot dish, where<br />
the dish diameter is 8.6 times larger than the feedhorn diameter. Since the feed diameter<br />
does not change when it is used on larger or smaller dishes, let’s look at a few more<br />
examples and see what happens. Figure 11-7 shows efficiency curves for the VE4MA<br />
feed on a range of dish sizes. At the top is the curve for a 28 foot dish; since the reflector<br />
diameter is 20 times as large as the feed diameter, feed blockage is small and efficiency is<br />
high. The next curve, for an 8 foot dish, 5.7 times larger than the reflector, shows<br />
efficiency a bit lower than the 12 and 28 foot dishes. Going to smaller dishes makes the<br />
efficiency much lower: the 4 foot dish, 2.9 times larger than the feed, has significantly<br />
reduced efficiency, while the 2 foot dish, only 1.4 times larger than the feed, hardly works<br />
at all. Of course, a 2 foot dish at 1296 MHz is a pretty small antenna, but with efficiency<br />
this low the gain would be perhaps 11 dB, not much higher than the feedhorn alone. A<br />
more important point is that any blockage, whether by the feed or by the structure<br />
supporting it, reduces the efficiency of the dish.<br />
Feed blockage is more significant on small dishes, but small is a relative term; any dish<br />
with a diameter less than 10 λ can be considered small. Thus, a 2 foot dish at 10 GHz,<br />
about 20 λ in diameter, is a moderately large dish, while a 20 foot dish at 432 MHz, less<br />
than 10 λ, is a small dish.<br />
Bad feed example<br />
Occasionally a surplus dish is found with the original feed attached. One example I have<br />
seen is a dish fed with WR-90 waveguide, which covers X-band (8-12 GHz). This dish is<br />
fed by from the open end of the waveguide pointing at the dish; an open waveguide is<br />
known to act as a moderate gain antenna. I located a published radiation pattern for open<br />
WR-90 waveguide 6 and graphed it in Figure 11-8. Clearly the efficiency this simple feed<br />
provides is far lower than the previous ones. The moral of this story is that just because a
Efficiency %<br />
12 foot TVRO dish at 1296 MHz with W2IMU feed<br />
Figure 11-5<br />
N1BWT 1997<br />
90<br />
80<br />
70<br />
60<br />
50<br />
40<br />
30<br />
20<br />
10<br />
0.25<br />
0 dB -10 -20 -30<br />
E-plane<br />
E-plane<br />
Dish diameter = 15.8 λ<br />
Feed diameter = 1.31 λ<br />
MAX Possible Efficiency AFTER LOSSES:<br />
REAL WORLD at least 15% lower Illumination<br />
Spillover<br />
Feed Blockage<br />
0.3 0.4 0.5 0.6 0.7 0.8 0.9<br />
Parabolic Dish f/D<br />
1 dB<br />
2 dB<br />
3 dB<br />
4 dB<br />
5 dB<br />
6 dB<br />
7 dB<br />
8 dB
Efficiency %<br />
12 foot TVRO dish at 1296 MHz with VE4MA feed<br />
Figure 11-6<br />
N1BWT 1997<br />
90<br />
80<br />
70<br />
60<br />
50<br />
40<br />
30<br />
20<br />
10<br />
0.25<br />
0 dB -10 -20 -30<br />
E-plane<br />
H-plane<br />
Dish diameter = 15.8 λ<br />
Feed diameter = 1.84 λ<br />
MAX Possible Efficiency AFTER LOSSES:<br />
REAL WORLD at least 15% lower Illumination<br />
Spillover<br />
Feed Blockage<br />
0.3 0.4 0.5 0.6 0.7 0.8 0.9<br />
Parabolic Dish f/D<br />
1 dB<br />
2 dB<br />
3 dB<br />
4 dB<br />
5 dB<br />
6 dB<br />
7 dB<br />
8 dB
Efficiency %<br />
VE4MA Feed at 1296 MHz vs. Dish diameter<br />
Figure 11-7<br />
N1BWT 1997<br />
90<br />
80<br />
70<br />
60<br />
50<br />
40<br />
30<br />
20<br />
10<br />
0.25<br />
0 dB -10 -20 -30<br />
E-plane<br />
H-plane<br />
MAX Possible Efficiency AFTER LOSSES:<br />
REAL WORLD at least 15% lower<br />
28 feet<br />
8 feet<br />
4 feet<br />
2 feet<br />
Dish diameter as shown<br />
Feed diameter = 1.84 λ<br />
0.3 0.4 0.5 0.6 0.7 0.8 0.9<br />
Parabolic Dish f/D<br />
Illumination<br />
Spillover<br />
1 dB<br />
2 dB<br />
3 dB<br />
4 dB<br />
5 dB<br />
6 dB<br />
7 dB<br />
8 dB
dish already has a feed does not mean it is a good feed <strong>—</strong> the original design goal may not<br />
have been maximum gain.<br />
Understanding the graphs<br />
The purpose of these graphs is to help in visualizing the performance of various dish feeds<br />
and comparing them so that the best feed available may be chosen for each application.<br />
The underlying assumption is that we wish to obtain the maximum efficiency from a given<br />
dish, and thus the maximum gain. After all, a dish doesn’t get any lighter or have any less<br />
wind resistance if we get less than maximum gain from it. On the right side of each graph<br />
is a dB scale, relating the efficiency to a loss in dB from the theoretical gain for that<br />
aperture. The ripple in some of the curves is an artifact of the discrete points used in the<br />
numerical integration process, and could be removed by integrating at smaller intervals.<br />
The program only accounts for the losses that are unavoidable: illumination loss, spillover<br />
loss, and feed blockage loss. There are several other losses found in a real dish:<br />
• phase error<br />
• feed not at focus<br />
• diffraction from the edge of the dish<br />
• polarization shift due to reflector geometry<br />
• blockage by feed supports<br />
• surface error in the parabolic reflector<br />
• feedline loss<br />
• feed VSWR<br />
These losses occur in greater or lesser amounts in a given antenna, so that the real<br />
efficiency is lower than the maximum possible efficiency shown in the curves. The best<br />
antennas I have measured have efficiencies perhaps 15% lower than the curves, while<br />
others are significantly worse. A typical efficiency for a moderate-sized dish is about<br />
50%, for a gain 3 dB below the theoretical gain for a given aperture size. A really good<br />
dish has an efficiency of 60% or so, about 1 dB better than a typical dish, while a poorly<br />
chosen feed or a poor installation can make the gain several dB worse. One dB difference<br />
may not seem like much, but it is a huge difference for an EME station that can’t squeeze<br />
another dB from the preamp or power amplifier.<br />
Another limitation of these curves is the accuracy of the data available for each feed<br />
pattern. Many of the published articles only give data for the major part of the pattern,<br />
but not the backlobes. This is sufficient to calculate the shape of the efficiency curve, but<br />
the whole pattern is required to calculate the maximum efficiency, so I have estimated the<br />
rest of the pattern based on similar feeds where data for the whole pattern is available.<br />
Since some of the feeds are physically larger than others and would have more feed<br />
blockage loss on a given dish, comparisons on any fixed dish size would make smaller<br />
feeds look better. Therefore, most of the graphs for the various feeds described in<br />
Chapter 6 use a reflector diameter about ten times larger than the feed diameter. If you
Efficiency %<br />
N1BWT 1997<br />
90<br />
80<br />
70<br />
60<br />
50<br />
40<br />
30<br />
20<br />
10<br />
0.25<br />
Open WR-90 Waveguide as Dish Feed<br />
Figure 11-8<br />
0 dB -10 -20 -30<br />
E-plane<br />
H-plane<br />
Dish diameter = 10 λ<br />
Feed diameter = 1 λ<br />
MAX Possible Efficiency AFTER LOSSES:<br />
REAL WORLD at least 15% lower Illumination<br />
Spillover<br />
Feed Blockage<br />
0.3 0.4 0.5 0.6 0.7 0.8 0.9<br />
Parabolic Dish f/D<br />
1 dB<br />
2 dB<br />
3 dB<br />
4 dB<br />
5 dB<br />
6 dB<br />
7 dB<br />
8 dB
are comparing these feeds for use on your dish, you can run the program for the actual<br />
reflector diameter of your dish.<br />
Phase errors<br />
All of these graphs are based on amplitude patterns only for the feeds, because phase data<br />
is much more difficult to measure and is rarely available. If the phase of the radiated<br />
energy is not uniform over all areas of the reflector, then different parts may reflect energy<br />
into the main beam which is not in phase and reduces the total energy in the main beam,<br />
lowering the gain. Another common problem is feeds that do not have the same phase<br />
center in the E-plane and the H-plane, which has the same effect as not having the phase<br />
center at the focal point: reduced gain and pattern distortion.<br />
Phase errors are probably the largest cause for low efficiency, so you should not expect to<br />
get efficiencies near the calculated values unless the feed has good phase performance. A<br />
feed with small phase error still suffers from all the other losses listed above, so the<br />
expected performance of a real dish might be only 15% lower than the calculated<br />
efficiency curve.<br />
The only feeds which have published phase data are the Kumar (VE4MA), Chaparral,<br />
Chaparral with slots, and the Koch Multi-ring feed discussed, all described in Chapter 6.<br />
All of these have excellent phase performance over a wide illumination angle, so the<br />
efficiency curves for these feeds are good for any f/D greater than 0.3. None of these<br />
feeds can adequately illuminate an f/D of 0.25, but the bent-dipole “Handlebar” feeds of<br />
W7PUA 1 show promise at the lower frequencies.<br />
Spillover and sidelobes<br />
Perhaps we should take a lesson from the radio astronomers. The radiotelescope feeds<br />
described in Chapter 6 all operate at a point on the efficiency curve to the left of the peak,<br />
or lower f/D, for reduced spillover. W7PUA suggests that since spillover increases<br />
sidelobes and sidelobes are always bad, we should make any compromise to the left side of<br />
the peak.<br />
Computer program<br />
The FEEDPATT program does all the calculations and plots graphs like the ones above.<br />
For those with access to the Inter<strong>net</strong>, the FEEDPATT program and all the data files for<br />
feed patterns are available on my 10 GHz Web page:<br />
www.tiac.<strong>net</strong>/users/wade/feedpatt.zip or www.qsl.<strong>net</strong>/~n1bwt<br />
See the README.TXT file for details of program operation.
The output graphs from the program are files in PostScript format, ready for printing on<br />
a laser printer or for viewing and printing on a PC using the free Ghostscript 3 software.<br />
On my PC running Windows95 or WindowsNT, I run the FEEDPATT program in<br />
one window and Ghostscript gsview in another to view the output as I work.<br />
With the data files for the feeds described in Chapter 6, it should be possible to graph the<br />
potential performance of any of them on your dish for any frequency of interest. For other<br />
feeds, if you can find, calculate, or measure a radiation pattern, you can calculate a graph<br />
of estimated efficiency. Please send me a copy of any new feed data.<br />
Summary<br />
Using the FEEDPATT computer program, we can accurately analyze the pattern data for<br />
various feed antennas. The output is in graphical format for easy visual comparison. We<br />
used this tool in Chapter 6 to analyze a wide range of feed designs and followed the<br />
evolution from early WWII-vintage designs to modern high-performance feeds. The<br />
program and feed pattern data files are available to help further understanding of dish<br />
performance.<br />
Notes<br />
1. B. Larkin, W7PUA, “Dipole-Reflector Parabolic Dish Feeds for f/D of 0.2-0.4,” QEX,<br />
February 1996, pp. 3-11.<br />
2. C.C. Cutler, "Parabolic-Antenna Design for Microwaves, Proceedings of the IRE,<br />
Nov. 1947, pp. 1284-1294. (reprinted in A.W. Love, Reflector Antennas, IEEE,<br />
1978, pp. 16-26.)<br />
3. Ghostscript by Aladdin is available from http://www.cs.wisc.edu/~ghost/index.html<br />
hints for using Ghostscript successfully: http://www.tiac.<strong>net</strong>/users/wade/gs_hints.htm<br />
4. D. Turrin, W2IMU, “A Paraboloidal Reflector Antenna for 1296 mc/s,” Crawford Hill<br />
Technical Report #5, 1971.<br />
5. B.W. Malowanchuk, VE4MA, "Selection of an Optimum Dish Feed," Proceedings of<br />
the 23rd Conference of the Central States VHF Society, ARRL, 1989, pp. 35-43.<br />
6. H. Jasik, Antenna Engineering Handbook, First Edition, Mcgraw-Hill, 1961. Fig.<br />
10-14, p. 10-16.