Enhanced T cell responsiveness to citrulline-containing ... - Asamnet
Enhanced T cell responsiveness to citrulline-containing ... - Asamnet
Enhanced T cell responsiveness to citrulline-containing ... - Asamnet

Create successful ePaper yourself
Turn your PDF publications into a flip-book with our unique Google optimized e-Paper software.
esponse between the MS patient and the normal<br />
donor. Sets 1 through 4 demonstrated a higher<br />
percentage of MBP-C8-reactive lines in the MS patients<br />
compared <strong>to</strong> the normal controls. In one normal donor,<br />
number 5 (ND5), one more MBP-C8 only-reactive line<br />
was established compared <strong>to</strong> the patient MS5. However,<br />
the stimulation indices for the patient's MBP-C8<br />
lines (both the MBP-C8/MBP-C1 and the MBP-C8 only<br />
lines) had a mean value of 32.8 while the mean value<br />
for the normal control was only 4.8. Thus, although<br />
one more TCL had been generated from donor ND5,<br />
their reactivities were not as strong as those from the<br />
MS patient. Sets 1, 3 and 4 demonstrated a higher<br />
percentage of MBP-C8/MBP-C1-reactive lines in the<br />
MS patients than in the normal controls. However, in<br />
sets 2 and 4, the lines that responded <strong>to</strong> both MBP-C1<br />
and MBP-C8/MBP-C1 were more numerous in the<br />
controls than in the patients.<br />
Statistical analysis (t-test) was performed between<br />
the TCL derived from MS patients and controls at each<br />
cut-off value (SI greater than or equal <strong>to</strong> 3 and 5) for<br />
the <strong>to</strong>tal number and the mean SI value of the three<br />
groups of TCL: TCL responding <strong>to</strong> MBP-C8/MBP-C1, <strong>to</strong><br />
MBP-C8 only, or <strong>to</strong> MBP-C1 only. Further analysis was<br />
performed <strong>to</strong> analyze the differences in the <strong>to</strong>tal<br />
number of MBP-C8-reactive lines between MS patients<br />
and controls. In each group, the mean number of MBP-<br />
C8-responding lines in the MS patients was higher (in<br />
many cases as much as three times higher) than the<br />
mean for the controls both with respect <strong>to</strong> mean SI and<br />
number of responding lines. However, due <strong>to</strong> the<br />
limited number of data sets, our sample size was <strong>to</strong>o<br />
small <strong>to</strong> reach statistical signi®cance, but remained a<br />
trend.<br />
In order <strong>to</strong> test whether the trend <strong>to</strong>wards a stronger<br />
MBP-C8-speci®c response was also re¯ected in the<br />
magnitude of the proliferative response of individual<br />
lines, we analyzed the data from these 10 individuals<br />
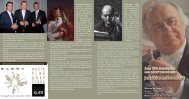
Figure 1 Con®rma<strong>to</strong>ry testing for antigen-speci®c response<br />
of MBP-C8-elicited T <strong>cell</strong> lines. The MBP-C8-responsive T<br />
<strong>cell</strong> lines were generated as described in Materials and<br />
methods section. The proliferative responses <strong>to</strong> MBP-C8 of<br />
these T <strong>cell</strong> lines at short term (after three cycles of antigen<br />
stimulation) and long term (after more than ®ve cycles of<br />
antigen stimulation) were compared<br />
T <strong>cell</strong> response <strong>to</strong> MBP-C8 in MS<br />
LR Tranquill et al<br />
with respect <strong>to</strong> the stimulation indices for the positive<br />
lines. The number of positive lines for each individual<br />
was determined using more stringent criteria, i.e. cu<strong>to</strong>ff<br />
values for the SI of greater or equal <strong>to</strong> 3 and then<br />
again with a value of greater or equal <strong>to</strong> 5. In sets 1, 2,<br />
3 and 5, the numbers of MBP-C8 only-reactive lines<br />
were higher in the MS patients than in controls at both<br />
cut-off levels. Set 4 (both patient and control) failed <strong>to</strong><br />
show any MBP-C8 only-reactive lines at the 43 or45<br />
SI cut-off values. Using these criteria for the MBP-C8/<br />
MBP-C1 lines, sets 1, 3 and 4 demonstrated a higher<br />
number of positive lines at both SI values in the<br />
patients as compared <strong>to</strong> the controls. In contrast, sets 2<br />
and 5 had higher numbers of positive lines at both SI<br />
cut-off values in the normal individuals as compared<br />
<strong>to</strong> the MS patients. There is not only a trend <strong>to</strong>wards<br />
higher numbers of MBP-C8-responding lines in MS<br />
patients versus controls, but these also exhibited<br />
higher SIs than those of the control individuals.<br />
A large proportion of the highly MBP-C8-responsive<br />
lines remained antigen-speci®c upon con®rma<strong>to</strong>ry<br />
testing (Figure 1) using the original MBP-C8 antigen.<br />
In an attempt <strong>to</strong> map the epi<strong>to</strong>pe speci®city of MBP-<br />
C8-speci®c TCL <strong>to</strong> individual <strong>citrulline</strong> residues, the<br />
MBP-C8-positive lines were tested against a panel of<br />
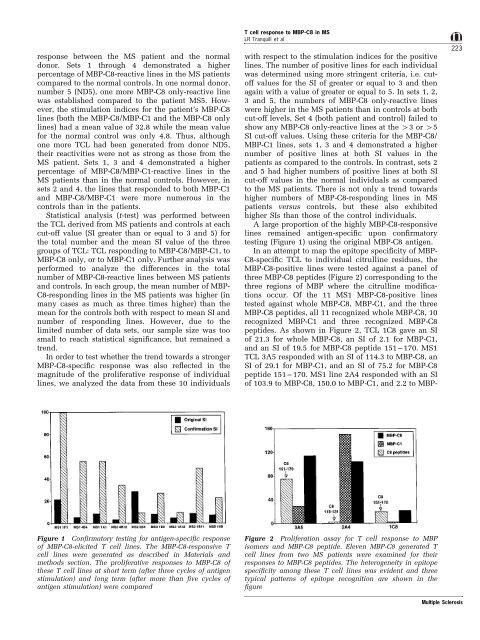
three MBP-C8 peptides (Figure 2) corresponding <strong>to</strong> the<br />
three regions of MBP where the <strong>citrulline</strong> modi®cations<br />
occur. Of the 11 MS1 MBP-C8-positive lines<br />
tested against whole MBP-C8, MBP-C1, and the three<br />
MBP-C8 peptides, all 11 recognized whole MBP-C8, 10<br />
recognized MBP-C1 and three recognized MBP-C8<br />
peptides. As shown in Figure 2, TCL 1C8 gave an SI<br />
of 21.3 for whole MBP-C8, an SI of 2.1 for MBP-C1,<br />
and an SI of 19.5 for MBP-C8 peptide 151 ± 170. MS1<br />
TCL 3A5 responded with an SI of 114.3 <strong>to</strong> MBP-C8, an<br />
SI of 29.1 for MBP-C1, and an SI of 75.2 for MBP-C8<br />
peptide 151 ± 170. MS1 line 2A4 responded with an SI<br />
of 103.9 <strong>to</strong> MBP-C8, 150.0 <strong>to</strong> MBP-C1, and 2.2 <strong>to</strong> MBP-<br />
Figure 2 Proliferation assay for T <strong>cell</strong> response <strong>to</strong> MBP<br />
isomers and MBP-C8 peptide. Eleven MBP-C8 generated T<br />
<strong>cell</strong> lines from two MS patients were examined for their<br />
responses <strong>to</strong> MBP-C8 peptides. The heterogeneity in epi<strong>to</strong>pe<br />
speci®city among these T <strong>cell</strong> lines was evident and three<br />
typical patterns of epi<strong>to</strong>pe recognition are shown in the<br />
®gure<br />
223<br />
Multiple Sclerosis