Evaluation of Douglas-fir site index curves for the north coastal ...
Evaluation of Douglas-fir site index curves for the north coastal ...
Evaluation of Douglas-fir site index curves for the north coastal ...
Create successful ePaper yourself
Turn your PDF publications into a flip-book with our unique Google optimized e-Paper software.
-8-<br />
Literature Cited (continued)<br />
King, James. E.<br />
1966. Site <strong>index</strong> <strong>curves</strong> <strong>for</strong> <strong>Douglas</strong> <strong>fir</strong> in <strong>the</strong> Pacific Northwest.<br />
Weyerhaeuser Forestry Paper No.8. Weyerhaeuser Forestry Research<br />
Center, Centralia, Washington. 49p.<br />
McArdle, Richard., Walter H. Meyer, Donald Bruce.<br />
1961. The yield <strong>of</strong> <strong>Douglas</strong> <strong>fir</strong> in <strong>the</strong> Pacific Northwest. USDA Tech.<br />
Schumacher, Francis X.<br />
Bull. 201 (Rev). 74p.<br />
1930. Yield, stand, and volume tables <strong>for</strong> <strong>Douglas</strong> <strong>fir</strong> in Cali<strong>for</strong>nia.<br />
U.C. ColI. <strong>of</strong> Ag., Agric. Exp Sta Bull 491. Berkeley, CA. 41p.<br />
Footnotes<br />
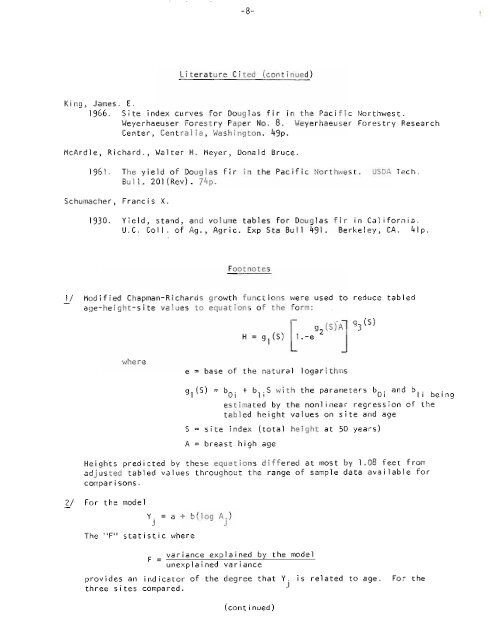
1/ Modified Chapman-Richards growth functions were used to reduce tabled<br />
age-height-<strong>site</strong> values to equations <strong>of</strong> <strong>the</strong> <strong>for</strong>m:<br />
where<br />
r g2 (SfAl g3 (S)<br />
H=gl(S)L.-e J<br />
e = base <strong>of</strong> <strong>the</strong> natural logarithms<br />
g (S) = b O o + b 'S with <strong>the</strong> parameters b O o and b . b .<br />
l I l I I l I el ng<br />
estimated by <strong>the</strong> nonlinear regression <strong>of</strong> <strong>the</strong><br />
tabled height values on <strong>site</strong> and age<br />
S = <strong>site</strong> <strong>index</strong> (total height at 50 years)<br />
A = breast high age<br />
Heights predi~ted by <strong>the</strong>se equations differed at most by 1.08 feet from<br />
adjusted tabled values throughout <strong>the</strong> range <strong>of</strong> sample data available <strong>for</strong><br />
comparisons.<br />
2/ For <strong>the</strong> model<br />
Y. = a + b ( log A.)<br />
J J<br />
The IIFIIstatistic where<br />
F = variance explained by <strong>the</strong> model<br />
unexplained variance<br />
provides an indicator <strong>of</strong> <strong>the</strong> degree that Y. is related to age.<br />
three <strong>site</strong>s compared. J<br />
(continued)<br />
For <strong>the</strong>


