Evaluation of Douglas-fir site index curves for the north coastal ...
Evaluation of Douglas-fir site index curves for the north coastal ...
Evaluation of Douglas-fir site index curves for the north coastal ...

You also want an ePaper? Increase the reach of your titles
YUMPU automatically turns print PDFs into web optimized ePapers that Google loves.
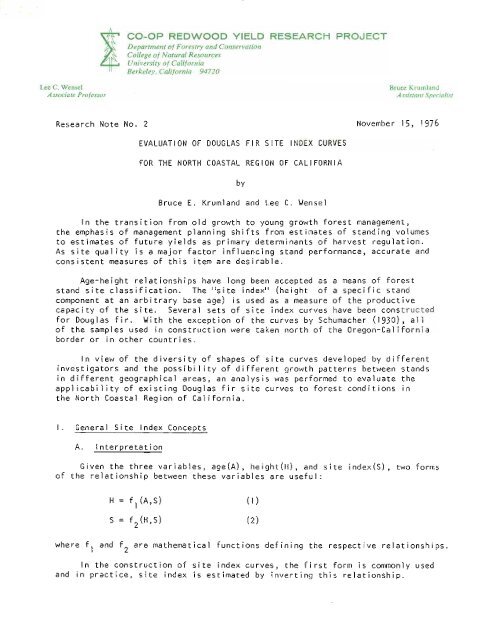
tCO-OP REDWOOD YIELD RESEARCH PROJECT<br />
Department <strong>of</strong> Forestry and Conservation<br />
College <strong>of</strong> Natural Resources<br />
University <strong>of</strong> Cali<strong>for</strong>nia<br />
Berkeley, Cali<strong>for</strong>nia 94720<br />
Lee C. Wensel Bruce Krumland<br />
Associate Pr<strong>of</strong>essor Assistant Specialist<br />
Research Note No.2 November 15, 1976<br />
EVALUATION OF DOUGLAS FIR SITE INDEX CURVES<br />
FOR THE NORTH COASTAL REGION OF CALIFORNIA<br />
by<br />
Bruce E. Krumland and Lee C. Wensel<br />
In <strong>the</strong> transition from old growth to young growth <strong>for</strong>est management,<br />
<strong>the</strong> emphasis <strong>of</strong> management planning shifts from estimates <strong>of</strong> standing volumes<br />
to estimates <strong>of</strong> future yields as primary determinants <strong>of</strong> harvest regulation.<br />
As <strong>site</strong> quality is a major factor influencing stand per<strong>for</strong>mance, accurate and<br />
consistent measures <strong>of</strong> this item are desirable.<br />
Age-height relationships have long been accepted as a means <strong>of</strong> <strong>for</strong>est<br />
stand <strong>site</strong> classification. The "<strong>site</strong> <strong>index</strong>" (height <strong>of</strong> a specific stand<br />
component at an arbitrary base age) is used as a measure <strong>of</strong> <strong>the</strong> productive<br />
capacity <strong>of</strong> <strong>the</strong> <strong>site</strong>. Several sets <strong>of</strong> <strong>site</strong> <strong>index</strong> <strong>curves</strong> have been constructed<br />
<strong>for</strong> <strong>Douglas</strong> <strong>fir</strong>. With <strong>the</strong> exception <strong>of</strong> <strong>the</strong> <strong>curves</strong> by Schumacher (1930), all<br />
<strong>of</strong> <strong>the</strong> samples used in construction were taken <strong>north</strong> <strong>of</strong> <strong>the</strong> Oregon-Cali<strong>for</strong>nia<br />
border or in o<strong>the</strong>r countries.<br />
In view <strong>of</strong> <strong>the</strong> diversity <strong>of</strong> shapes <strong>of</strong> <strong>site</strong> <strong>curves</strong> developed by different<br />
investigators and <strong>the</strong> possibility <strong>of</strong> different growth patterns between stands<br />
in different geographical areas, an analysis was per<strong>for</strong>med to evaluate <strong>the</strong><br />
applicqbility <strong>of</strong> existing <strong>Douglas</strong> <strong>fir</strong> <strong>site</strong> <strong>curves</strong> to <strong>for</strong>est conditions in<br />
<strong>the</strong> North Coastal Region <strong>of</strong> Cali<strong>for</strong>nia.<br />
I. General Site Index Concepts<br />
A. Interpretation<br />
Given <strong>the</strong> three variables, age(A), height(H), and <strong>site</strong> <strong>index</strong>(S), two <strong>for</strong>ms<br />
<strong>of</strong> <strong>the</strong> relationship between <strong>the</strong>se variables are useful:<br />
H=fl(A,S)<br />
S = f2(H,S)<br />
(1)<br />
(2)<br />
where fl and f2 are ma<strong>the</strong>matical functions defining <strong>the</strong> respective relationships.<br />
In <strong>the</strong> construction <strong>of</strong> <strong>site</strong> <strong>index</strong> <strong>curves</strong>, <strong>the</strong> <strong>fir</strong>st <strong>for</strong>m is commonly used<br />
and in practice, <strong>site</strong> <strong>index</strong> is estimated by inverting this relationship.
This <strong>for</strong>m may be more correctly noted as a height growth relationship.<br />
second <strong>for</strong>m leads to direct estimation <strong>of</strong> <strong>site</strong> <strong>index</strong>.<br />
-2-<br />
It should be noted that constructing age-height-<strong>site</strong> relationships in<br />
<strong>the</strong>se two <strong>for</strong>ms from <strong>the</strong> same sample basis will not lead to <strong>the</strong> same estimates<br />
<strong>of</strong> <strong>site</strong> <strong>index</strong> unless <strong>the</strong>re is perfect correlation between variables. Curtis<br />
et.al. (1974) have provided a study and discussion <strong>of</strong> <strong>the</strong> differences and<br />
possible implications arising out <strong>of</strong> <strong>the</strong> use <strong>of</strong> <strong>the</strong>se two different relationships.<br />
Of practical importance, estimates <strong>of</strong> <strong>site</strong> <strong>index</strong> by both <strong>of</strong> <strong>the</strong>se methods<br />
will coincide at <strong>the</strong> <strong>site</strong> <strong>index</strong> base age. Divergence in <strong>site</strong> <strong>index</strong> estimates<br />
increase with <strong>the</strong> age difference between <strong>the</strong> <strong>site</strong> <strong>index</strong> base age and <strong>the</strong> actual<br />
age <strong>of</strong> <strong>the</strong> stand <strong>for</strong> which <strong>site</strong> <strong>index</strong> is being estimated. Consequently, selection<br />
<strong>of</strong> a <strong>site</strong> <strong>index</strong> base age somewhere around <strong>the</strong> probable rotation age <strong>for</strong> <strong>the</strong><br />
region (50-70 years) seems desirable.<br />
B. Construction Methods<br />
1. Proportional Guide Curve Method<br />
This method is <strong>the</strong> traditional method <strong>of</strong> constructing <strong>site</strong> <strong>index</strong><br />
<strong>curves</strong>. Essentially, <strong>the</strong> sample consists <strong>of</strong> single age-height measurements<br />
on trees and/or stands. A single curve <strong>of</strong> H = f(A) is derived <strong>for</strong> <strong>the</strong> whole<br />
sample giving a guide curve with a <strong>site</strong> <strong>index</strong> value where this curve intercepts<br />
<strong>the</strong> base age. Curves <strong>for</strong> o<strong>the</strong>r <strong>site</strong>s are derived by a proportional adjustment<br />
<strong>of</strong> this curve. Principal shortcomings <strong>of</strong> this method are:<br />
a) Sampl ing is done without knowledge <strong>of</strong> <strong>site</strong> <strong>index</strong>. Consequently,<br />
if <strong>the</strong> <strong>site</strong> sample is not evenly distributed within age classes, <strong>the</strong> shape <strong>of</strong><br />
<strong>the</strong> guide curve may be distorted.<br />
b) Proportional shifting <strong>of</strong> <strong>the</strong> guide curve precludes <strong>the</strong> possibility<br />
that <strong>the</strong> shape <strong>of</strong> <strong>the</strong> age-height curve <strong>for</strong> different <strong>site</strong>s may change.<br />
2. Polymorphic Stem Analysis Methods<br />
In this method, trees older than <strong>the</strong> <strong>site</strong> <strong>index</strong> base age are<br />
sampled and heights at various ages including <strong>the</strong> base age are determined by<br />
stem analysis. Thus, <strong>the</strong> <strong>site</strong> <strong>index</strong> <strong>of</strong> <strong>the</strong> tree is known be<strong>for</strong>e curve construction<br />
takes place ra<strong>the</strong>r than being a product <strong>of</strong> fitting method as with<br />
guide <strong>curves</strong>. Usually, relationships <strong>of</strong> <strong>the</strong> impl icit <strong>for</strong>m; H = f(S,A) are<br />
subsequently fitted by regression techniques. The <strong>for</strong>m <strong>of</strong> <strong>the</strong> <strong>site</strong> model<br />
equation selected is usually general enough to allow <strong>the</strong> shape <strong>of</strong> height-age<br />
relationship to vary with <strong>site</strong> (e.g., polymorphic <strong>curves</strong>). This method is<br />
generally considered to be superior, though more costly.<br />
The
II. <strong>Evaluation</strong><br />
A. Site Index Curves Compared<br />
-3-<br />
Three sets <strong>of</strong> <strong>site</strong> <strong>index</strong> <strong>curves</strong> were chosen <strong>for</strong> evaluation. All are<br />
<strong>of</strong> <strong>the</strong> <strong>for</strong>m H = f(A,S)<br />
1. McArdle et.a1. (1961)<br />
geographical basis; samples collected in Oregon and Washington<br />
construction method; proportional guide curve<br />
base age; one hundred years total age<br />
stand component; average height <strong>of</strong> dominant and codominant tr~es<br />
remarks; commonly used <strong>for</strong> <strong>Douglas</strong> <strong>fir</strong> <strong>site</strong> classification<br />
in <strong>the</strong> North Coast Region<br />
2. Schumacher -(1930)<br />
geographical basis; samples collected in Cali<strong>for</strong>nia. Eighty-seven<br />
percent <strong>of</strong> <strong>the</strong> sample plots were located in<br />
<strong>the</strong> North Coast Region.<br />
construction method; proportional guide curve<br />
base age; fifty years total age<br />
stand component; average height <strong>of</strong> dominants<br />
remarks; only <strong>Douglas</strong> <strong>fir</strong> <strong>site</strong> <strong>curves</strong> constructed<br />
from samples collected in Cali<strong>for</strong>nia.<br />
Little used in practice.<br />
3. King (1966)<br />
geographical basis; samples collected in Washington<br />
construction method; polymorphic stem analysis<br />
base age; fifty years breast high age<br />
stand component; ten trees with <strong>the</strong> largest breast high<br />
diameters in fifty.<br />
remarks; generally accepted as being most accurate<br />
<strong>for</strong> <strong>Douglas</strong> <strong>fir</strong> in <strong>the</strong> Pacific Northwest
-4-<br />
To facilitate evaluation, <strong>the</strong> tabled total age values <strong>of</strong> Schumacher's<br />
and McArdle's <strong>site</strong> <strong>curves</strong> were adjusted to breast high ages by <strong>the</strong> following<br />
factors (King, 1966).<br />
Site Index (100 yrs) Adjustment<br />
(feet) (feet)<br />
190-210<br />
-6<br />
160-180 -7<br />
130-150 -8<br />
100-120 -9<br />
-10<br />
80-90<br />
Site <strong>index</strong> values were subsequently expressed as height at a breast high<br />
age <strong>of</strong> fifty years. To simplify numerical analysis <strong>the</strong> adjusted age-height-<strong>site</strong><br />
tabulations <strong>for</strong> both curve sets were reduced to exponential equations.l/ King's<br />
<strong>site</strong> <strong>index</strong> study was accompanied by equations which were used directly~<br />
Table 1. shows <strong>the</strong> difference in <strong>the</strong> shape <strong>of</strong> <strong>the</strong>se <strong>curves</strong> <strong>for</strong> a <strong>site</strong><br />
<strong>index</strong> <strong>of</strong> 120, roughly comparable to what is commonly known as <strong>site</strong> II in <strong>the</strong><br />
region. Note that McArdle's and Schumacher's <strong>curves</strong> are almost coincident<br />
with King's curve starting lower and ending higher than <strong>the</strong> o<strong>the</strong>r two.<br />
Curtis (1966) compared McArdle's and King's <strong>site</strong> <strong>curves</strong> with successive<br />
<strong>site</strong> estimates on permanent growth plots in <strong>the</strong> Pacific Northwest. Although<br />
height growth patterns <strong>for</strong> specific plots differed significantly from ei<strong>the</strong>r<br />
curve set, he found that King's <strong>curves</strong> fit <strong>the</strong> sample data best. His sample<br />
was largely from stands over <strong>for</strong>ty-five years <strong>of</strong> age. From Table 1., this<br />
would indicate that <strong>the</strong> <strong>curves</strong> <strong>of</strong> Schumacherand McArdle would underestimate<br />
<strong>site</strong> <strong>index</strong> at ages less than base age and produce overestimates <strong>for</strong> older age<br />
classes.<br />
Table 1. Total tree heights in feet by breast high<br />
age <strong>for</strong> <strong>site</strong> <strong>index</strong> <strong>of</strong> 120. Site <strong>index</strong> base<br />
is flfty years breast high age.<br />
Age King McArdle Schumacher<br />
15 46 56 56<br />
20 59 68 69<br />
30 83 89 89<br />
40 103 106 106<br />
50 120 120 120<br />
60 134 132 132<br />
70 146 142 142<br />
80 156 150 151<br />
90 164 157 158<br />
100 172 163 164
B. Sample Basis <strong>for</strong> Comparison<br />
-5-<br />
The sample consisted <strong>of</strong> 92 dominant and 26 codominant <strong>Douglas</strong> <strong>fir</strong> trees<br />
with two or more breast high age-total height measurements taken over an interval<br />
<strong>of</strong> 10-25 years. The samples were extracted from records <strong>of</strong> growth plots maintained<br />
by members <strong>of</strong> <strong>the</strong> Redwood Yield Research Cooperative and supplemented with field<br />
work during <strong>the</strong> Spring and Summer <strong>of</strong> 1976. The plots were located in Del Norte,<br />
Humboldt, and Mendocino Counties. Tree ages ranged between ten and seventy years<br />
at <strong>the</strong> time <strong>of</strong> sampl ing with <strong>the</strong> average age being approximately <strong>for</strong>ty years.<br />
Crown classification and height measurements were made by a variety <strong>of</strong> personnel<br />
over <strong>the</strong> years. In some cases, obvious errors on field measurements were evident<br />
(e.g., 'Inegative" height growth). All data points however were used as recorded<br />
and errors in field measurements were assumed to be random.<br />
C. Analysis<br />
If a given set <strong>of</strong> <strong>site</strong> <strong>index</strong> <strong>curves</strong> accurately portrayed <strong>the</strong> height<br />
growth patterns <strong>of</strong> <strong>for</strong>est trees (stands), it would be expected that successive<br />
<strong>site</strong> estimates made from measured height growth would be <strong>the</strong> same. No <strong>for</strong>mal<br />
hypo<strong>the</strong>sis however was developed to accept or reject any <strong>of</strong> <strong>the</strong> <strong>site</strong> <strong>curves</strong>.<br />
Ra<strong>the</strong>r, a framework was adopted to provide a basis <strong>for</strong> comparing <strong>the</strong> three<br />
<strong>site</strong> <strong>curves</strong> and provide some indication <strong>of</strong> where differences, if any, between<br />
sample data and individual <strong>site</strong> <strong>curves</strong> lie.<br />
Several regressions <strong>of</strong> successive estimates <strong>of</strong> <strong>site</strong> <strong>index</strong> on age <strong>for</strong><br />
single trees over intervals <strong>of</strong> 15-20 years indicated strong linear trends.<br />
As <strong>the</strong>re was no common time interval <strong>for</strong> which deviations from average <strong>site</strong><br />
values could be compared and <strong>the</strong> probability that <strong>the</strong> use <strong>of</strong> more than One<br />
observation from a single tree would lead to serial correlation <strong>of</strong> residuals,<br />
an average <strong>site</strong> <strong>index</strong> value was computed <strong>for</strong> all measurements on a single tree.<br />
One <strong>of</strong> <strong>the</strong>se measurements was chosen at random <strong>for</strong> fur<strong>the</strong>r consideration.<br />
For <strong>the</strong> purpose <strong>of</strong> this analysis, let:<br />
Y. = estimated average annual change in <strong>site</strong> <strong>index</strong> <strong>for</strong> <strong>the</strong> jth<br />
J tree.<br />
A. = estimate <strong>of</strong> <strong>the</strong> average age <strong>of</strong> <strong>the</strong> jth tree <strong>for</strong> which Y.<br />
J was computed. J<br />
Initial plotting <strong>of</strong> Y. against <strong>site</strong> class revealed no significant trends largely<br />
because <strong>the</strong> dispersioA <strong>of</strong> <strong>site</strong> values was small relative to Y'. Plots against<br />
age however indicated significant trends. The following mOde1 was chosen <strong>for</strong><br />
comparative purposes after examining <strong>the</strong> residuals <strong>of</strong> several functional <strong>for</strong>ms.<br />
Y. = a + b(log A.) + error term<br />
J J<br />
This is similar to <strong>the</strong> model used by Curtis (1966) in his comparison. Statistical<br />
tests show a significant relationship between age and annual change in<br />
<strong>site</strong> <strong>index</strong> <strong>for</strong> both <strong>the</strong> McArdle and Schumacher <strong>curves</strong>, but not <strong>for</strong> King's.£!
.........<br />
.jj<br />
C])<br />
C])<br />
4<br />
........<br />
-<br />
.<br />
(/)<br />
c:<br />
.<br />
C])<br />
I'D<br />
.£:.<br />
U<br />
- I'D<br />
::J<br />
c:<br />
c:<br />
3<br />
2<br />
1<br />
0<br />
-1<br />
3<br />
I'D<br />
C]) 2<br />
C'I<br />
I'D<br />
L-<br />
C])<br />
><br />
I'D 1<br />
;-.<br />
0<br />
-1<br />
T<br />
..<br />
...<br />
I<br />
.,.<br />
...<br />
..<br />
T<br />
+ .<br />
-6<br />
T<br />
T<br />
~<br />
King<br />
T<br />
t<br />
McArdle<br />
20 30 40 50 60 70<br />
Breast High Age (years)<br />
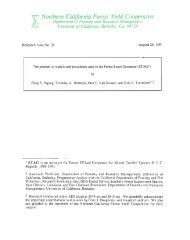
Figure 1. Predicted annual change in <strong>site</strong> <strong>index</strong> (Y.) at different ages<br />
<strong>for</strong> different <strong>site</strong> <strong>curves</strong>. Vertical dasfted lines denote one<br />
standard error above and below <strong>the</strong> regression line.<br />
T<br />
t<br />
I<br />
...
-7-<br />
These results are comparable with those <strong>of</strong> Curtis (1966). As an indication<br />
<strong>of</strong> <strong>the</strong> differences by age, Figure 2. shows predicted values <strong>of</strong> y. at different<br />
ages along with standard errors <strong>of</strong> estimate. There was no signiticant difference<br />
between <strong>the</strong> estimated "a" and Ilb" coefficients <strong>for</strong> McArdle's and Schumacher's<br />
<strong>site</strong> <strong>curves</strong> so only Yj predictions <strong>for</strong> <strong>the</strong> McArdle comparison are shown.<br />
III. Discussion and Conclusions<br />
While <strong>the</strong> comparisons made here do not provide conclusive grounds <strong>for</strong><br />
accepting or rejecting any <strong>of</strong> <strong>the</strong> <strong>site</strong> <strong>curves</strong>, <strong>the</strong>y do indicate that <strong>the</strong> <strong>site</strong><br />
<strong>curves</strong> <strong>of</strong> King fit <strong>the</strong> sample data best.<br />
It is noteworthy that all three sets <strong>of</strong> <strong>site</strong> <strong>curves</strong> call <strong>for</strong> an estimate<br />
<strong>of</strong> <strong>site</strong> <strong>index</strong> to be made as an average <strong>for</strong> some stand component. The comparisons<br />
here were made on <strong>the</strong> basis <strong>of</strong> <strong>site</strong> values <strong>for</strong> individual trees largely because<br />
sufficient in<strong>for</strong>mation was unavailable to provide consistent successive <strong>site</strong><br />
samples on growth plots by <strong>the</strong> methods recommended by individual investigators.<br />
The samples used were largely dominants, located in <strong>the</strong> upper tenth percentile<br />
<strong>of</strong> <strong>the</strong> diameter and usually taller in height than <strong>the</strong> average stand component<br />
basis recommended by all investigators <strong>for</strong> <strong>site</strong> determination. As <strong>the</strong> differentiation<br />
<strong>of</strong> trees into different crown classes becomes more pronounced with<br />
advancing age, <strong>the</strong> predicted deviations shown in Figure 2 may be overestimated.<br />
This possibility would tend to support King's <strong>curves</strong> although those <strong>of</strong> Schumacher<br />
and McArdle would still -probably underestimate <strong>site</strong> <strong>index</strong> at ages less than<br />
<strong>the</strong> base age and overestimate <strong>the</strong>m at older ages.<br />
Site <strong>index</strong> is <strong>of</strong>ten used as a predictor variable in growth and yield<br />
analysis. Bias in <strong>site</strong> <strong>curves</strong> may subsequently result in biased growth models.<br />
As an example, if King's <strong>curves</strong> are assumed to accurately portray height growth,<br />
<strong>site</strong> estimation <strong>of</strong> a twenty year old stand with McArdle's <strong>curves</strong> would result<br />
in a 14 percent underestimate <strong>of</strong> <strong>site</strong> <strong>index</strong> with a 50 year base age. This<br />
difference would increase to 20 percent if <strong>the</strong> base age were 100 years.<br />
In terms <strong>of</strong> future comparisons, <strong>the</strong> most desirable study would be <strong>the</strong><br />
construction <strong>of</strong> new <strong>site</strong> <strong>curves</strong> by stem analysis techniques. Until that time,<br />
King's <strong>curves</strong> appear to be a reasonable substitute.<br />
Literature Cited<br />
Curtis, Robert o.<br />
1966. A comparison <strong>of</strong> <strong>site</strong> <strong>curves</strong> <strong>for</strong> <strong>Douglas</strong> <strong>fir</strong>. USDA Forest Servo<br />
Res. Paper PNW-37. Pacific Northwest For. and Rng. Exp. Sta.,<br />
Portland, Ore. 7p.<br />
Curtis, Robert 0., Donald J. DeMars, Francis R. Herman.<br />
1974. Which dependent variable in <strong>site</strong> <strong>index</strong>-height-age regressions?<br />
Forest Sci. 20:74-87.
-8-<br />
Literature Cited (continued)<br />
King, James. E.<br />
1966. Site <strong>index</strong> <strong>curves</strong> <strong>for</strong> <strong>Douglas</strong> <strong>fir</strong> in <strong>the</strong> Pacific Northwest.<br />
Weyerhaeuser Forestry Paper No.8. Weyerhaeuser Forestry Research<br />
Center, Centralia, Washington. 49p.<br />
McArdle, Richard., Walter H. Meyer, Donald Bruce.<br />
1961. The yield <strong>of</strong> <strong>Douglas</strong> <strong>fir</strong> in <strong>the</strong> Pacific Northwest. USDA Tech.<br />
Schumacher, Francis X.<br />
Bull. 201 (Rev). 74p.<br />
1930. Yield, stand, and volume tables <strong>for</strong> <strong>Douglas</strong> <strong>fir</strong> in Cali<strong>for</strong>nia.<br />
U.C. ColI. <strong>of</strong> Ag., Agric. Exp Sta Bull 491. Berkeley, CA. 41p.<br />
Footnotes<br />
1/ Modified Chapman-Richards growth functions were used to reduce tabled<br />
age-height-<strong>site</strong> values to equations <strong>of</strong> <strong>the</strong> <strong>for</strong>m:<br />
where<br />
r g2 (SfAl g3 (S)<br />
H=gl(S)L.-e J<br />
e = base <strong>of</strong> <strong>the</strong> natural logarithms<br />
g (S) = b O o + b 'S with <strong>the</strong> parameters b O o and b . b .<br />
l I l I I l I el ng<br />
estimated by <strong>the</strong> nonlinear regression <strong>of</strong> <strong>the</strong><br />
tabled height values on <strong>site</strong> and age<br />
S = <strong>site</strong> <strong>index</strong> (total height at 50 years)<br />
A = breast high age<br />
Heights predi~ted by <strong>the</strong>se equations differed at most by 1.08 feet from<br />
adjusted tabled values throughout <strong>the</strong> range <strong>of</strong> sample data available <strong>for</strong><br />
comparisons.<br />
2/ For <strong>the</strong> model<br />
Y. = a + b ( log A.)<br />
J J<br />
The IIFIIstatistic where<br />
F = variance explained by <strong>the</strong> model<br />
unexplained variance<br />
provides an indicator <strong>of</strong> <strong>the</strong> degree that Y. is related to age.<br />
three <strong>site</strong>s compared. J<br />
(continued)<br />
For <strong>the</strong>
2/ (cont i nued)<br />
-9<br />
F F-probab i Ii ty<br />
McArd1e 36. 1 .001-<br />
Schumacher 32.3 .001- 5t"<br />
King .2 .69 N7<br />
degrees <strong>of</strong> freedom = 1,116<br />
The F-probabi1ity va1ues wou1d indicate critica1 1eve1s required to reject <strong>the</strong><br />
overa11 mode1 as being non-significant if hypo<strong>the</strong>ses were being tested<br />
(i.e., Y. is not related to A~e). Values <strong>of</strong> .05 and .01 are common1y used in<br />
pract ice~