Study 1 - Foothill College
Study 1 - Foothill College
Study 1 - Foothill College

Create successful ePaper yourself
Turn your PDF publications into a flip-book with our unique Google optimized e-Paper software.
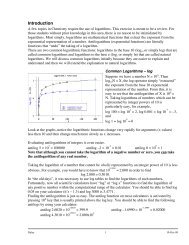
Research Method<br />
Data Interpretation Exercise<br />
Up to 15pts Extra Credit<br />
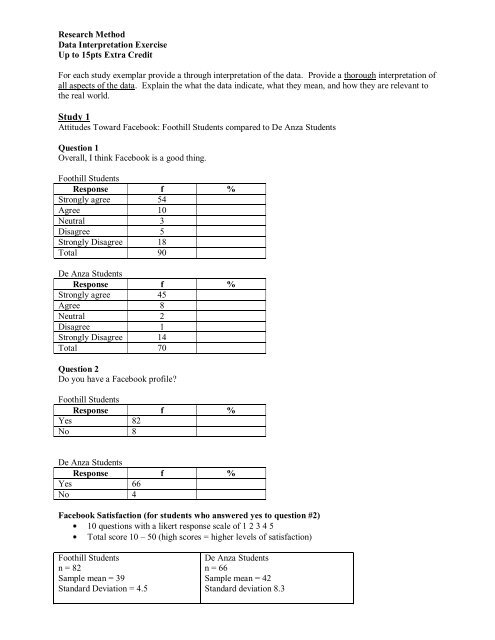
For each study exemplar provide a through interpretation of the data. Provide a thorough interpretation of<br />
all aspects of the data. Explain the what the data indicate, what they mean, and how they are relevant to<br />
the real world.<br />
<strong>Study</strong> 1<br />
Attitudes Toward Facebook: <strong>Foothill</strong> Students compared to De Anza Students<br />
Question 1<br />
Overall, I think Facebook is a good thing.<br />
<strong>Foothill</strong> Students<br />
Response f %<br />
Strongly agree 54<br />
Agree 10<br />
Neutral 3<br />
Disagree 5<br />
Strongly Disagree 18<br />
Total 90<br />
De Anza Students<br />
Response f %<br />
Strongly agree 45<br />
Agree 8<br />
Neutral 2<br />
Disagree 1<br />
Strongly Disagree 14<br />
Total 70<br />
Question 2<br />
Do you have a Facebook profile?<br />
<strong>Foothill</strong> Students<br />
Response f %<br />
Yes 82<br />
No 8<br />
De Anza Students<br />
Response f %<br />
Yes 66<br />
No 4<br />
Facebook Satisfaction (for students who answered yes to question #2)<br />
10 questions with a likert response scale of 1 2 3 4 5<br />
Total score 10 – 50 (high scores = higher levels of satisfaction)<br />
<strong>Foothill</strong> Students<br />
n = 82<br />
Sample mean = 39<br />
Standard Deviation = 4.5<br />
De Anza Students<br />
n = 66<br />
Sample mean = 42<br />
Standard deviation 8.3
<strong>Study</strong> 2<br />
Does the style of studying influence performance for students at different educational levels on a<br />
psychology test?<br />
Factor A: <strong>Study</strong> style<br />
Level1: Elaboration Style – participants are instructed to make connections between their life and the<br />
course material<br />
Level 2: Memorization Style – participants are instructed to memorize the material word for word<br />
Factor B: Education Level<br />
Level 1: High School Juniors<br />
Level 2: <strong>College</strong> Freshman<br />
Dependent Variable: Percentage correct on a psychology test<br />
Determine the row means and column means. Determine if there are any main effects and interactions.<br />
Graph the results using a line graph. Provide an interpretation of the results.<br />
High School <strong>College</strong><br />
Elaboration 65 85<br />
Memorization 67 70<br />
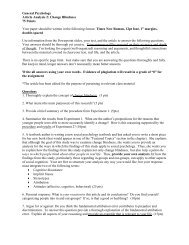
<strong>Study</strong> 3<br />
A researcher is interested in studying different disciplinary techniques on children in kindergarten. The<br />
researcher uses a within-subjects with an observational component and a survey component. The<br />
research first observed children in their classrooms, then surveyed the children’s parents.<br />
The researcher uses a classroom with 20 children. The researcher sits in the class for one week for a<br />
period of habituation.<br />
Dependent variable = number of times each child misbehaves<br />
Observations<br />
Week 1<br />
The researcher observes the class for a week and records the number of times each child misbehaves.<br />
Week 2<br />
The next week, the instructor uses a new disciplinary technique in which every time a child misbehaves,<br />
she the children write a few sentences about what they did wrong and why it is wrong.<br />
Results<br />
Week 1 Week 2<br />
Mean misbehaviors = 8.5 Mean misbehaviors = 5.4<br />
SD = 4.2 SD = 1.3<br />
A survey was given to the parents of the children following Week 2 (after the special discipline technique<br />
had been utilized).<br />
Question: Over the past week, have your children been more well-behaved or less-well behaved at home?<br />
Results<br />
More well-behaved = 4<br />
Less well-behaved = 16