Marketing Opportunities for Potatoes in Rwanda - Foodnet
Marketing Opportunities for Potatoes in Rwanda - Foodnet
Marketing Opportunities for Potatoes in Rwanda - Foodnet

Create successful ePaper yourself
Turn your PDF publications into a flip-book with our unique Google optimized e-Paper software.
The market<strong>in</strong>g potential of <strong>Potatoes</strong> <strong>in</strong> Uganda and<br />
market opportunities <strong>for</strong> <strong>Rwanda</strong>.<br />
Okoboi Geofrey<br />
International Institute of Tropical Agriculture<br />
October 2001
Table of contents<br />
REPORT SUMMARY......................................................................................................................4<br />
POTATO PRODUCTION IN UGANDA ..................................................................................5<br />
POTATO PRODUCTION AREAS..................................................................................................5<br />
POTATO PRODUCTION STATISTICS ........................................................................................6<br />
SEASONALITY OF POTATO PRODUCTION. ............................................................................9<br />
POTATO VARIETIES...................................................................................................................10<br />
POTATO PRODUCTION COSTS ................................................................................................11<br />
WARE POTATO MARKETING IN UGANDA ....................................................................14<br />
DESCRIPTION OF TRADING AND THE MARKETING CHAIN ............................................14<br />
CONSUMPTION AND PRICES....................................................................................................17<br />
SPATIAL ANALYSIS OF WARE POTATO MARKET ..............................................................21<br />
MARKETING COSTS AND MARGINS ......................................................................................22<br />
WARE POTATO IMPORTS/EXPORTS. .....................................................................................24<br />
SEED POTATO MARKETING IN UGANDA..............................................................................26<br />
COMMENTARY ON UNSPPA SEED POTATO PRODUCTION MARKETING REPORTS...30<br />
CONCLUSIONS AND RECOMMENDATIONS ....................................................................0<br />
List of tables<br />
Table 1: Output, Area planted and Yield of <strong>Potatoes</strong> from Major production Districts <strong>in</strong> Year 2000.......... 7<br />
Table 2a: Potato Production Calendar <strong>for</strong> Kabale District......................................................... 9<br />
Table 2b: Potato Production Calendar <strong>for</strong> Kisoro, Mbarara, Mbale and Kapchorwa Districts........... 10<br />
Table 3: Characteristics of Potato Varieties Released/Grown <strong>in</strong> Uganda .................................... 10<br />
Table 4: Ware Potato Production Costs <strong>in</strong> Kapchorwa District, Uganda <strong>for</strong> Year 2001. ................. 11<br />
Table 5: Sensitivity Analysis of the effects of Changes <strong>in</strong> Costs and Revenues on farmers’ Marg<strong>in</strong>s. 12<br />
Table 6: Average monthly household consumption expenditure on <strong>Potatoes</strong> by region <strong>in</strong> 1995........ 18<br />
Table 7: Average monthly household consumption expenditure on Matooke by region <strong>in</strong> 1995 ....... 18<br />
Table 8: Average monthly Household consumption expenditure on major food staples <strong>in</strong> Uganda <strong>in</strong> 1995 18<br />
Table 9: Correlation Coefficients (r) <strong>for</strong> Potato between four towns us<strong>in</strong>g nom<strong>in</strong>al prices .............. 22<br />
Table 10: Correlation Coefficients (r) <strong>for</strong> Potato between four towns us<strong>in</strong>g real prices .................. 22<br />
Table 11: Potato <strong>Market<strong>in</strong>g</strong> Cost and Marg<strong>in</strong>s..................................................................... 23<br />
Table 12: Assumptions used to derive costs <strong>in</strong> table 5 ........................................................... 24<br />
Appendix 2: Grand Seasonal Index <strong>for</strong> Potato <strong>in</strong> Kampala Calculated from Real Retail prices ........ 32<br />
Annex 1: PRODUCTION REPORTS FOR UGANDA NATIONAL SEED POTATO PRODUCERS’<br />
ASSOCIATION (UNSPPA) FOR 2000A SEASON..................................................... 33<br />
List of figures<br />
Map 1: Major districts produc<strong>in</strong>g Potato <strong>in</strong> Uganda ................................................................ 5<br />
Figure 2: Percentage share of Area planted with Potato <strong>in</strong> 2000 by major districts.......................... 6<br />
Figure 3: Potato production (‘000 Mt) <strong>in</strong> Uganda, 1980-2000 ................................................... 7<br />
Figure 4: Potato production (‘000 Mt) <strong>in</strong> Uganda, 1980-2000 ................................................... 8<br />
Figure 5: The Ware Potato trad<strong>in</strong>g cha<strong>in</strong>. ........................................................................... 15<br />
Figure 6: Trend of monthly nom<strong>in</strong>al retail price of <strong>Potatoes</strong> <strong>in</strong> select district urban markets ........... 19<br />
Figure 7: Trend of monthly nom<strong>in</strong>al retail price of <strong>Potatoes</strong> <strong>in</strong> select district urban markets ........... 19<br />
Figure 8: GSI <strong>for</strong> potatoes <strong>in</strong> Kampala, 1989-2000............................................................... 20
Report Summary<br />
This report is the result of a rapid national Potato market survey designed to analyse the<br />
market<strong>in</strong>g potential of the Potato sub-sector <strong>in</strong> Uganda. The survey <strong>in</strong>volved <strong>for</strong>mal and <strong>in</strong><strong>for</strong>mal<br />
<strong>in</strong>terviews to a cross-section of participants <strong>in</strong> the Potato sector.<br />
Key F<strong>in</strong>d<strong>in</strong>gs<br />
• Production figures <strong>in</strong>dicate that output of <strong>Potatoes</strong> <strong>in</strong> Uganda is stagnat<strong>in</strong>g, this suggests that<br />
more technical and farm<strong>in</strong>g systems <strong>in</strong>vestments is required to raise both production<br />
efficiency and levels of output.<br />
• Potato yields are low <strong>in</strong> Uganda due to very low rates of quality <strong>in</strong>puts (clean seed, fertilizers,<br />
and chemicals) utilisation. In Kabale 1% of farmers are reported to use fertilisers (Low,<br />
2000).<br />
• While <strong>Potatoes</strong> are a major food staple and cash crop <strong>in</strong> the highland areas where they are<br />
cultivated, they are considered a cash crop <strong>in</strong> the lowland areas, where they have been<br />
promoted.<br />
• The high level of perishability and lack of appropriate long-term storage facilities has<br />
significantly <strong>in</strong>fluenced the degree of price uncerta<strong>in</strong>ty <strong>in</strong> the Potato market.<br />
• Brokers are a key l<strong>in</strong>k <strong>in</strong> the Potato market<strong>in</strong>g cha<strong>in</strong> and this group appears to charge<br />
excessive fees <strong>for</strong> their services.<br />
• With<strong>in</strong> the supply cha<strong>in</strong>, travell<strong>in</strong>g traders atta<strong>in</strong> the highest net marg<strong>in</strong>s.<br />
• There is no significant cross border trade <strong>in</strong> ware potatoes between Uganda and the<br />
neighbour<strong>in</strong>g countries. However, limited <strong>for</strong>mal and <strong>in</strong><strong>for</strong>mal trade takes place along the<br />
Uganda-<strong>Rwanda</strong> border dur<strong>in</strong>g the months of September to November when there is Potato<br />
supply shortage <strong>in</strong> Uganda. This is the most ideal time <strong>for</strong> <strong>Rwanda</strong> <strong>Potatoes</strong> to sell profitably<br />
<strong>in</strong> Uganda.<br />
• Seed potato production and market<strong>in</strong>g <strong>in</strong> Uganda is least developed. Monopolised by the 25<br />
members of Uganda National Seed Potato Producers’ Association, a 100kg bag of seed potato<br />
is sold at 5 times that of ware potato!<br />
• Potato chips is the most popular potato product <strong>in</strong> urban areas as evidenced the <strong>in</strong>creas<strong>in</strong>g<br />
number of fast food outlets. The potential of potato crisps is encourag<strong>in</strong>g though currently not<br />
very popular.<br />
4
Potato Production <strong>in</strong> Uganda<br />
POTATO PRODUCTION<br />
Potato production areas<br />
Potato production is concentrated <strong>in</strong> two areas <strong>in</strong> Uganda, the highlands of Kabale, Kisoro and Mwizi<br />
(Mbarara) <strong>in</strong> south-western Uganda and the mount Elgon districts of Mbale and Kapchorwa <strong>in</strong> eastern<br />
Uganda.<br />
Kabale district is very hilly and <strong>in</strong>terlaced with narrow and broad valleys. Altitudes range from 1,400-<br />
2,500m, the annual ra<strong>in</strong>fall range is 1,000- 1,500mm occurr<strong>in</strong>g <strong>in</strong> two peaks and the mean annual<br />
maximum temperature is below 22.5 o C with annual m<strong>in</strong>imum below 10.0 o C, mak<strong>in</strong>g Kabale one of the<br />
coldest districts <strong>in</strong> Uganda (Low, 2000). Low (2000) further states that the soil moisture and temperature<br />
regime make Kabale suitable <strong>for</strong> temperate crops. The physical and climatic conditions of the mounta<strong>in</strong>ous<br />
districts of Kisoro, Mbale and Kapchorwa closely relate to those <strong>in</strong> Kabale. Although the hills of Mwizi <strong>in</strong><br />
Mbarara have relatively lower altitude (1,200-1,600m) and ra<strong>in</strong>fall (800-1100mm) ranges than Kabale, they<br />
are <strong>in</strong>habited by migrants from Kabale who have came along with their tradition of Potato cultivation.<br />
Ware potatoes are produced <strong>in</strong> both highland and lowland areas. This was made possible through the<br />
<strong>in</strong>troduction Potato varieties (e.g. Victoria), which is adapted to high and low altitudes. Seed potato is<br />
exclusively produced <strong>in</strong> highland areas. Due to the wide adaptation of Victoria, many new districts have<br />
taken to ware potato production, See Map 1.<br />
Irish potato<br />
grow<strong>in</strong>g districts<br />
Lakes<br />
and<br />
Rivers<br />
Map 1: Major districts produc<strong>in</strong>g Potato <strong>in</strong> Uganda<br />
5
In the highlands where <strong>Potatoes</strong> are grown, the crop is both a major food staple and cash crop. In her study,<br />
Low (2000) noted that Potato and sorghum are by far the most important cash crops <strong>for</strong> both women and<br />
men <strong>in</strong> Kabale district. In the low and mid altitudes zones that have adopted Potato cultivation, the crop is<br />
not a major food staple but a cash crop.<br />
Potato production statistics<br />
Potato production <strong>in</strong> Uganda has spread over the years from the highlands of Kigezi (Kabale and Kisoro)<br />
districts to many other districts of Uganda. (See production by district table –Appendix 1). Data source <strong>for</strong><br />
the production figures is M<strong>in</strong>istry of Agriculture, Animal Industry and Fisheries, though the reliability of<br />
these is questionable. Accord<strong>in</strong>g to the figures <strong>in</strong> Appendix 1, it is unlikely that <strong>in</strong> the year 2000, Lira<br />
district, a major buyer of <strong>Potatoes</strong> from Mbale produced 13,194 Metric tonnes more than Mbarara, which<br />
produced 10,791 Metric tonnes. Similarly, it is not possible that Soroti district, a dry and warm area where<br />
<strong>Potatoes</strong> are rare produced 11,509 Metric tonnes more than Kapchorwa district (11,058 Metric tonnes) <strong>in</strong><br />
the year 2000.<br />
The figures <strong>in</strong> Appendix 1 also show that Kabale district is consistently the lead<strong>in</strong>g producer of <strong>Potatoes</strong> <strong>in</strong><br />
Uganda and followed by Kisoro district. This is reasonably realistic. Thus even if the data is questionable<br />
nevertheless it is the only important reference source.<br />
Figure 1: Percentage share of Potato<br />
Production <strong>in</strong> 2000 by major districts Figure 2: Percentage share of Area planted<br />
with Potato <strong>in</strong> 2000 by major districts<br />
5%<br />
3%<br />
7%<br />
5%<br />
15%<br />
5% 3%<br />
57%<br />
Kabale<br />
Kisoro<br />
Mbarara<br />
Luwero<br />
Masaka<br />
Mbale<br />
Rukungiri<br />
Kapchorwa<br />
Figures 1 and 2 show the percentage share of production and area planted by the major Potato produc<strong>in</strong>g<br />
districts <strong>in</strong> Uganda <strong>for</strong> the year 2000. These charts were derived from M<strong>in</strong>istry of Agriculture, Animal<br />
Industry and Fisheries statistics <strong>in</strong> Appendix 1. With the exclusion of m<strong>in</strong>or Potato produc<strong>in</strong>g districts <strong>in</strong><br />
Uganda, Figure 1 shows that Kabale district produced 57% of the overall output of <strong>Potatoes</strong> on 33% land<br />
(Hectare) utilisation. Due to poorer soils, Kisoro district produced 15% us<strong>in</strong>g about 30% of the land area.<br />
Table 1 shows that Potato yield <strong>in</strong> Kabale was approximately 16 Metric tonnes per hectare while <strong>in</strong> Kisoro<br />
the yield was only 5 Mt/Ha. In<strong>for</strong>mation on yield is important <strong>in</strong> underp<strong>in</strong>n<strong>in</strong>g the agro-ecological<br />
conditions and farm<strong>in</strong>g practices of different communities <strong>in</strong> various districts. Furthermore, <strong>in</strong><strong>for</strong>mation on<br />
yield <strong>in</strong>directly relates to:<br />
- Intensity of land use. Number of seasons <strong>Potatoes</strong> planted <strong>in</strong> year<br />
- Level of soil conservation and use of fertilizer to improve soil nutrients<br />
- Use pesticides and fungicides aga<strong>in</strong>st a host of Potato verm<strong>in</strong> and diseases.<br />
6<br />
7%<br />
6%<br />
9%<br />
4% 6%<br />
5%<br />
30%<br />
33%<br />
Kabale<br />
Kisoro<br />
Kapchorwa<br />
Luwero<br />
Masaka<br />
Mbale<br />
Mbarara<br />
Rukungiri
Table 1: Output, Area planted and Yield of <strong>Potatoes</strong> from Major production Districts <strong>in</strong> Year<br />
2000<br />
District Kabale Kapchorwa Kisoro Masaka Mbale Mbarara Rakai Rukungiri<br />
Output<br />
(Mt)<br />
179,571 11,058 49,125 15,767 21,627 10,791 6,172 15,084<br />
Area<br />
planted<br />
(Ha)<br />
11,332 1,559 10,285 2,433 3,050 1,522 871 2,127<br />
Yield<br />
(Mt/Ha)<br />
15.85 7.1 4.78 6.5 7.1 7.1 7.1 7.1<br />
In a work<strong>in</strong>g paper No. 2000-1 <strong>for</strong> the International Potato Centre, Jan Low, noted that potato yields are<br />
high <strong>in</strong> Kabale due high plant densities per hectare and good soils. Low found out that farmers <strong>in</strong><br />
Kalengyere who had high plant densities (50,000) per hectare also had better yields per hectare (29Mt) than<br />
those <strong>in</strong> Buk<strong>in</strong>da with low plant densities (40,000) per hectare whose yield was 20 Metric tonnes. In the<br />
study, Low also analysed other factors that affect yield such as the quality of seed, soil type and fertility<br />
and management of potato diseases.<br />
Figure 3 shows the trend of Potato production (‘000 Mt) <strong>in</strong> Uganda <strong>for</strong> the period 1980-2000. The<br />
trend l<strong>in</strong>e <strong>in</strong>dicates a stead <strong>in</strong>crease <strong>in</strong> output <strong>for</strong> the period albeit the fluctuat<strong>in</strong>g production<br />
graph.<br />
Figure 4 is a production growth rate graph, a derivative of Figure 3. Although Potato production<br />
and growth rates varied considerably <strong>in</strong> the earlier years (1980-1989), the growth rate is has<br />
stabilised <strong>in</strong> the past 10 years to about 2% per annum. Thus, there is critical need to <strong>in</strong>crease<br />
farmers’ yields through <strong>in</strong>creased use of high yield<strong>in</strong>g certified seed, fertilizers to supplement on<br />
soil nutrients and pesticides to control the destructive bacteria wilt and late blight.<br />
Figure 3: Potato production (‘000 Mt) <strong>in</strong> Uganda, 1980-2000<br />
7
Prodn ('000 mt)<br />
600<br />
500<br />
400<br />
300<br />
200<br />
100<br />
-<br />
1980<br />
1982<br />
y = 10.645x + 166<br />
1984<br />
1986<br />
1988<br />
1990<br />
1992<br />
Figure 4: Potato production (‘000 Mt) <strong>in</strong> Uganda, 1980-2000<br />
output growth rate<br />
100<br />
80<br />
60<br />
40<br />
20<br />
0<br />
-20<br />
-40<br />
-60<br />
1980<br />
1982<br />
1984<br />
prodn<br />
L<strong>in</strong>ear (prodn)<br />
1986<br />
1988<br />
1990<br />
Years<br />
Years<br />
8<br />
1994<br />
1996<br />
y = 0.0176x - 0.0287<br />
1992<br />
growth rate<br />
L<strong>in</strong>ear (growth rate)<br />
1994<br />
1996<br />
1998<br />
1998<br />
2000<br />
2000
Seasonality of Potato Production.<br />
In Kabale, there are no clear-cut dist<strong>in</strong>ctive seasons <strong>for</strong> production of <strong>Potatoes</strong>. There appears to be a<br />
seasonal overlap depend<strong>in</strong>g on weather conditions, hence <strong>Potatoes</strong> are <strong>in</strong> production almost all year round.<br />
The ma<strong>in</strong> reason why <strong>Potatoes</strong> are produced all year <strong>in</strong> Kabale is due to the <strong>in</strong>tensive use of all available<br />
hills slopes, swamps and valley bottoms (non-swampy) <strong>for</strong> cultivation. Farmers <strong>in</strong>terviewed, said there are<br />
three Potato cultivation seasons <strong>in</strong> the year.<br />
Table 2a shows the Potato cultivation calendar <strong>in</strong> Kabale <strong>in</strong> which the plant<strong>in</strong>g and harvest<strong>in</strong>g times are<br />
presented. The first season starts from mid February dur<strong>in</strong>g the short ra<strong>in</strong>s with plant<strong>in</strong>g on the hills slopes<br />
and ends June when most farmers have harvested. Harvests from this season are relatively small and the<br />
farmers consume a big proportion. With<strong>in</strong> this period of low ra<strong>in</strong>fall, some farmers utilize non-swampy<br />
valley bottoms to plant <strong>Potatoes</strong> between December and January and harvest <strong>in</strong> March and April. This<br />
means that <strong>in</strong> the first season, <strong>Potatoes</strong> are harvested from non-swampy valley bottoms and hills slopes<br />
hence a reasonable market supply from March to June.<br />
Table 2a: Potato Production Calendar <strong>for</strong> Kabale District.<br />
Area of<br />
cultivation<br />
Hill<br />
slopes<br />
Jan Feb Mar Apr May Jun Jul Aug Sept Oct Nov Dec<br />
Potato<br />
Harvest<strong>in</strong>g<br />
Swamp<br />
land<br />
Valley Potato<br />
bottom Plant<strong>in</strong>g<br />
Mean monthly<br />
Ra<strong>in</strong>fall 1990 72.3<br />
2000 (mm)<br />
73.1<br />
Potato<br />
plant<strong>in</strong>g<br />
Potato<br />
harvest<strong>in</strong>g<br />
136.5<br />
114.9<br />
9<br />
Potato<br />
harvest<strong>in</strong>g<br />
Potato<br />
plant<strong>in</strong>g<br />
98.4<br />
43.0<br />
13.7<br />
Harvesti<br />
ng<br />
56.4<br />
Potato plant<strong>in</strong>g Har<br />
vest<br />
88.8<br />
131.4<br />
The second season is the most important commercial season <strong>in</strong> the potato cultivation calendar of Kabale.<br />
This season has a long ra<strong>in</strong> period from September to December when most farmers aga<strong>in</strong> plant <strong>Potatoes</strong> on<br />
the hills slopes and harvest ma<strong>in</strong>ly <strong>in</strong> January. In December to January is the period when Potato<br />
production <strong>in</strong> Kabale is highest and there is over supply on the market lead<strong>in</strong>g to the lowest seasonal prices.<br />
(See Figure 8 <strong>for</strong> Kampala Grand Seasonal Index).<br />
Third season Potato cultivation is done <strong>in</strong> the swamps us<strong>in</strong>g irrigation canals dur<strong>in</strong>g the dry period.<br />
Commercially oriented farmers who often time plant<strong>in</strong>g so as to harvest when Potato price is high mostly<br />
exploit this season. Swampland plant<strong>in</strong>g is between May and July and a short harvest<strong>in</strong>g season starts from<br />
August end<strong>in</strong>g mid September.<br />
Dur<strong>in</strong>g the second season plant<strong>in</strong>g (September to November), there is very little supply of <strong>Potatoes</strong> from<br />
western and southern Uganda (Kabale, Kisoro, Mbarara, Rukungiri and Rakai) to Kampala markets. Dur<strong>in</strong>g<br />
this period, a relatively high price of <strong>Potatoes</strong> is also recorded <strong>in</strong> Kampala, Figure 8.<br />
Interviews with the traders at the Uganda-<strong>Rwanda</strong> borders of Katuna and Kyanika also <strong>in</strong>dicated that July<br />
to October is the w<strong>in</strong>dow period when traders import <strong>Potatoes</strong> from <strong>Rwanda</strong>, repack them locally and sell<br />
as Kabale <strong>Potatoes</strong>.<br />
In Kisoro and Mwizi (Mbarara) Potato production closely follows that of Kabale except that these districts<br />
do not have significant swampland to warrant production of swamp irrigated Potato. There<strong>for</strong>e these<br />
districts only have two major Potato seasons with the first season (m<strong>in</strong>or) start<strong>in</strong>g from February end<strong>in</strong>g <strong>in</strong><br />
May and the second season (major) start<strong>in</strong>g September end<strong>in</strong>g <strong>in</strong> January.<br />
Mbale and Kapchorwa districts also have two Potato production seasons <strong>in</strong> a year. The first season is<br />
between March (plant<strong>in</strong>g) and June (harvest<strong>in</strong>g), while the second season starts from August and ends <strong>in</strong><br />
December, Table 2b.<br />
98.4<br />
<strong>in</strong>g<br />
Potato<br />
Plant<strong>in</strong>g<br />
90.0
Common name<br />
Yr 1 st release<br />
Uganda 11<br />
(1973)<br />
(Rutuku)<br />
Victoria<br />
(1992)<br />
Look<strong>in</strong>g at the Potato productions <strong>in</strong> Tables 2a and 1b, the greatest w<strong>in</strong>dow of opportunity <strong>for</strong> <strong>Rwanda</strong> to<br />
sell <strong>Potatoes</strong> to Uganda is between late August and early November. Dur<strong>in</strong>g this, there is virtually no<br />
supply from western and southern as it is the major plant<strong>in</strong>g period while this time also co<strong>in</strong>cides the<br />
second plant<strong>in</strong>g season <strong>in</strong> eastern Uganda. Furthermore, due to low supply dur<strong>in</strong>g this period Potato offlorry<br />
prices (28,000/=) are relatively high <strong>in</strong> Ow<strong>in</strong>o market, hence mak<strong>in</strong>g it possible to sell <strong>Rwanda</strong>n<br />
potatoes profitably.<br />
Table 2b: Potato Production Calendar <strong>for</strong> Kisoro, Mbarara, Mbale and Kapchorwa Districts.<br />
District(s)<br />
Kisoro and<br />
Mbarara<br />
Mbale and<br />
Kapchorwa<br />
Ra<strong>in</strong>fall<br />
(mm) 1994<br />
Mbarara<br />
Jan Feb Mar Apr May Jun Jul Aug Sept Oct Nov Dec<br />
Harvest<strong>in</strong>g Plant<strong>in</strong>g Harvest<strong>in</strong>g Plant<strong>in</strong>g Harvest<strong>in</strong>g<br />
100.2<br />
30.8<br />
Plant<strong>in</strong>g Harvest<strong>in</strong>g Plant<strong>in</strong>g Harvest<strong>in</strong>g<br />
85.9<br />
68.7<br />
164.9<br />
10<br />
6.1<br />
6.0<br />
31.6<br />
29.1<br />
128.8<br />
156.2<br />
Potato varieties<br />
The range Potato varieties that have been released and are be<strong>in</strong>g grown <strong>in</strong> Uganda are shown <strong>in</strong> Table 3<br />
(PRAPACE, 2001). The survey revealed that many farmers <strong>in</strong> south-western Uganda were grow<strong>in</strong>g<br />
different varieties identified <strong>in</strong> the table except NAKPOT 1,2, &3, which seems to be unknown. Despite<br />
their good commercial characteristics, NAKPOT 1, 2 and 3 have not been adopted quickly s<strong>in</strong>ce their<br />
release <strong>in</strong> 1999. Farmers <strong>in</strong>terviewed said that they are cautious at adopt<strong>in</strong>g other potato varieties they are<br />
not familiar with. Some peasant farmers still grow old non-commercial local varieties such as Matare<br />
because it is tasty. Overall, the rate of variety adoption depended on the marketability of the variety,<br />
maturity rate, yield and tolerance to bacterial wilt and late blight and even the <strong>in</strong>come level of households<br />
necessary <strong>for</strong> buy<strong>in</strong>g new seed.<br />
Table 3: Characteristics of Potato Varieties Released/Grown <strong>in</strong> Uganda<br />
Tuber<br />
size<br />
Sk<strong>in</strong><br />
colour<br />
Large Light<br />
red<br />
Flesh Tuber shape Vegetative Seed<br />
Resistance/ Storability<br />
colour<br />
cycle dormancy Tolerance<br />
(days) (weeks) LB BW<br />
Cream Oval round 110-130 11-13 Toler Suscep Good<br />
Large Red Light Round 90-110 8-10 Mod Toler Good<br />
yellow<br />
resist<br />
Kisoro (1992) Medium<br />
large<br />
White Cream Oval long 110-120 10-12 Resist Toler Good<br />
Kabale (1992) Large Purple White Round 110-125 11-13 Mod Suscep Excellent<br />
NAKPOT 1 Large<br />
white<br />
White White Oval long 80-90 9-12<br />
resist<br />
Resist Toler Good<br />
(1999)<br />
NAKPOT 2<br />
(1999)<br />
NAKPOT 3<br />
(1999)<br />
Cruza 148<br />
Medium Rose Cream<br />
large red<br />
Medium White White<br />
Large Light Cream<br />
Round<br />
Round<br />
Oval round<br />
85-100<br />
85-100<br />
110-130<br />
9-11<br />
9-12<br />
4-6<br />
Resist<br />
Resist<br />
Toler<br />
Toler<br />
Toler<br />
Toler<br />
Good<br />
Good<br />
Fair<br />
(1982)<br />
red<br />
Nd<strong>in</strong>amagara<br />
Sangema Medium P<strong>in</strong>k Yellow Oval oblong 90-110 10-12 Toler Suscep Good<br />
104.4
(1980) large<br />
Victoria is the most common commercial variety that is high yield<strong>in</strong>g, early matur<strong>in</strong>g, tolerant to bacteria<br />
wilt (BW), but susceptible to late blight (LB). The farmers <strong>in</strong> Mbarara, Kabale and Kisoro easily adopted<br />
this variety because South Western Uganda Agricultural Rehabilitation Project (SWARP) and African<br />
Highland Initiative (AHI) promoted it<br />
Uganda Rutuku <strong>in</strong>troduced <strong>in</strong> Uganda <strong>in</strong> 1972, also one of the most successful varieties <strong>in</strong> Kabale. Uganda<br />
Rutuku is highly sought after by traders because it the best <strong>for</strong> mak<strong>in</strong>g chips. Ma<strong>in</strong>ly grown <strong>in</strong> Kabale at<br />
high elevations (+1,800 metres), this variety sells at a premium price. The survey also revealed that the<br />
wholesale price of 100kg bag of Uganda Rutuku was 33,000/= while that of Victoria and other varieties<br />
was at 28,000/= <strong>in</strong> Ow<strong>in</strong>o market. Because Victoria has almost similar characteristics as Uganda Rutuku<br />
(large tuber size, red/light red sk<strong>in</strong> colour and yellow/cream flesh) unscrupulous traders <strong>in</strong> Ow<strong>in</strong>o are said<br />
to be sell<strong>in</strong>g Victoria as Uganda Rutuku to unsuspect<strong>in</strong>g buyers<br />
In Mbale a variety locally called Wanale with all the characteristics of Uganda Rutuku is also highly<br />
demanded by chips makers <strong>in</strong> eastern Uganda.<br />
Potato Production Costs<br />
Production of ware and seed potato effectively requires the same <strong>in</strong>puts and labour. However, <strong>for</strong><br />
a farmer to produce clean seed (certified seed) he must purchase to use basic seed from a<br />
recognised source. To produce ware <strong>Potatoes</strong>, the farmer can use any Potato tuber that can sprout<br />
be it certified seed or disease <strong>in</strong>fected local seed. Seed quality significantly determ<strong>in</strong>es the yield.<br />
From our field survey it was found that most respondents (farmers) compla<strong>in</strong> experienc<strong>in</strong>g decl<strong>in</strong><strong>in</strong>g yields<br />
because they do not use certified seed. Farmers said they use local seed reta<strong>in</strong>ed from their harvests or buy<br />
from neighbours. The costs <strong>in</strong>curred and marg<strong>in</strong>s received by an average farmer <strong>in</strong> Mbale or Kapchorwa<br />
<strong>for</strong> cultivation of one acre of <strong>Potatoes</strong> us<strong>in</strong>g m<strong>in</strong>imum <strong>in</strong>puts is shown <strong>in</strong> Table 4.<br />
Table 4: Ware Potato Production Costs <strong>in</strong> Kapchorwa District, Uganda <strong>for</strong> Year 2001.<br />
Item<br />
Inputs<br />
Unit price (U shs) Total (U shs) % of sales<br />
Land Rent/Hire 1 Acre 25,000 25,000<br />
Seeds 15 bags (1 bag ~100kg) 10,000 150,000<br />
Chemicals (Ambush & Diathane)<br />
Fertilizers (NPK) 1 bag<br />
30,000<br />
(optional) 35,000<br />
35,000<br />
Labour<br />
Plough<strong>in</strong>g 2 Times 15,000 30,000<br />
Mak<strong>in</strong>g Ridges and Plant<strong>in</strong>g 15,000 15,000<br />
Add<strong>in</strong>g more soil on the ridges 15,000 15,000<br />
Weed<strong>in</strong>g 2 Times 15,000 30,000<br />
Fertilizer application (optional) 10,000 10,000<br />
Spray<strong>in</strong>g 5,000 5,000<br />
Harvest<strong>in</strong>g 20,000 20,000<br />
Total costs 365,000<br />
11
Revenue return<br />
1 acre = Yield = 100 bags<br />
Farm-gate price per bag =<br />
4,000/=<br />
Gross Revenue 400,000<br />
Net<br />
Marg<strong>in</strong><br />
12<br />
35,000<br />
8.75%<br />
Table 5: Sensitivity Analysis of the effects of Changes <strong>in</strong> Costs and Revenues on farmers’<br />
Marg<strong>in</strong>s<br />
Variable<br />
option<br />
No fertilizer use<br />
No fertilizer &<br />
pesticide use<br />
No fertilizer use<br />
& land hire<br />
No fertilizer use<br />
& land hire<br />
Total costs<br />
(U shs)<br />
325,000<br />
Yield (bags)<br />
1 bag ~100kg<br />
80<br />
Price per bag<br />
(U shs)<br />
4,000<br />
Revenue<br />
(U shs)<br />
320,000<br />
Profit/loss<br />
(U shs)<br />
-5,000<br />
Remarks<br />
Common with<br />
peasant<br />
farmers<br />
285,000 70<br />
4,000 320,000 35,000<br />
Common with<br />
subsistence<br />
farmers<br />
300,000 80 4,000 320,000 20,000 Most common<br />
300,000<br />
80<br />
5,000<br />
400,000<br />
100,000<br />
situation<br />
In<strong>for</strong>mal <strong>in</strong>terviews with farmers <strong>in</strong> Mbale and Kapchorwa revealed that most farmers do<br />
not use fertilizers and pesticides <strong>in</strong> the production of <strong>Potatoes</strong>. Non-use of fertilizers,<br />
pesticides, certified seed and land hir<strong>in</strong>g is the most common agricultural practice of<br />
peasant farmers <strong>in</strong> Uganda. However, data <strong>in</strong> Table 4 illustrates the probable costs of<br />
cultivat<strong>in</strong>g 1 acre of <strong>Potatoes</strong>, the yield and returns as given to us by a number of farmers<br />
<strong>in</strong>terviewed. The table shows that with a total <strong>in</strong>vestment (cost) of 365,000/=, the likely<br />
yield given favourable weather conditions is 100-120 bags. Table 4 further shows that the<br />
farmer earns 35,000/=, which is only 8.75% of the total sales.<br />
Table 5 illustrates the various cost options that the farmers may <strong>in</strong>cur <strong>in</strong> cultivat<strong>in</strong>g 1 acre of<br />
<strong>Potatoes</strong> and the resultant revenue given the price. Given the most common situation is that<br />
farmers do not use fertilizers and do not hire land, the farmer <strong>in</strong>curs about 300,000/= <strong>in</strong><br />
production costs and earns 20,000/= only from a gross revenue of 320,000/=. The analysis further<br />
demonstrates that the most profitable (100,000/=) situation is when the farmer produces offseason<br />
when the farm-gate price improves to 5,000/= per bag.<br />
Most common<br />
situation with<br />
off season<br />
production
Ware Potato <strong>Market<strong>in</strong>g</strong> <strong>in</strong> Uganda<br />
POTATO MARKETING<br />
Description of trad<strong>in</strong>g and the market<strong>in</strong>g cha<strong>in</strong><br />
Constra<strong>in</strong>ed by high product perishability and limited storage facilities, farmers do not<br />
harvest <strong>Potatoes</strong> until they identify a buyer. Travell<strong>in</strong>g traders/brokers also rarely buy<br />
from farmers be<strong>for</strong>e contact<strong>in</strong>g their buyers <strong>in</strong> Kampala. There<strong>for</strong>e, Potato trad<strong>in</strong>g is a<br />
demand-led bus<strong>in</strong>ess; that is, there has to be demand be<strong>for</strong>e supplies come to the market.<br />
This caution aims to reduce post-harvest loses that are associated with fresh produce.<br />
For the production areas of central, western and southern Uganda, the focal dest<strong>in</strong>ations<br />
of the <strong>Potatoes</strong> are the Kampala markets (Ow<strong>in</strong>o, Nakawa, Kalerwe, Natete and others).<br />
<strong>Potatoes</strong> from Mbale and Kapchorwa generally go to Mbale ma<strong>in</strong> market first. Although<br />
there are travell<strong>in</strong>g traders who may directly supply other towns and urban centres,<br />
Kampala is the ma<strong>in</strong> wholesale market <strong>for</strong> Potato traders from other towns such as<br />
Entebbe, Mukono, Kayunga, etc. Mbale market is the ma<strong>in</strong> distribution centre <strong>for</strong> Tororo,<br />
Iganga, Pallisa, Kumi and Soroti urban markets. A small number of restaurant operators<br />
and retailers <strong>in</strong> Gulu and Lira occasionally used to get their supplies from Kampala, but<br />
are now shift<strong>in</strong>g their focus on Nebbi district that has become a dom<strong>in</strong>ant producer of<br />
<strong>Potatoes</strong> <strong>in</strong> Northern Uganda.<br />
For goods to move from their orig<strong>in</strong> (production) to their f<strong>in</strong>al dest<strong>in</strong>ation (consumption), there are various<br />
people who per<strong>for</strong>m the physical functions (e.g. sort<strong>in</strong>g, pack<strong>in</strong>g, transport<strong>in</strong>g, load<strong>in</strong>g and unload<strong>in</strong>g) and<br />
others who undertake the economic activities of sell<strong>in</strong>g and buy<strong>in</strong>g. The stages through which <strong>Potatoes</strong><br />
move from the farmer to the consumer is described below.<br />
Farmers<br />
Farmers are the first l<strong>in</strong>k <strong>in</strong> the Potato market cha<strong>in</strong> due to the high level of people depend<strong>in</strong>g on<br />
agriculture <strong>in</strong> Uganda (over 80%). Farmers are both producers and consumers. A sizeable portion of output<br />
is consumed by farmers from own production and by buy<strong>in</strong>g from neighbours and village markets.<br />
Farmers harvest their <strong>Potatoes</strong> only when they have a buyer. At the time of sale farmers either seek the<br />
local village trader/broker or the trader/broker approaches the farmers. After strik<strong>in</strong>g a price deal, the<br />
farmer and village trader/broker agree on activities such as harvest date, sort<strong>in</strong>g and pack<strong>in</strong>g. In most cases<br />
it is the farmer who harvests the <strong>Potatoes</strong> from the soil while village trader/broker provides the pack<strong>in</strong>g<br />
bags and does the pack<strong>in</strong>g. It is rare that <strong>in</strong>dividuals or farmers groups harvest their <strong>Potatoes</strong>, transport and<br />
wholesale them at urban markets. Most often, produce is sold at farm-gate and on a cash basis.<br />
Other than sell<strong>in</strong>g to village assemblers and brokers, farmers also sell their <strong>Potatoes</strong> by the roadside and<br />
take them to the weekly village markets or sell them to the village retailer.<br />
Village traders/assemblers<br />
Village traders from the product areas o and know the farmers <strong>in</strong> their village and surround<strong>in</strong>g areas. They<br />
know what farmers have planted and when it is likely to be harvested. The village traders are <strong>in</strong> contact<br />
with transporters, wholesale buyers and f<strong>in</strong>ancial service providers. After identify<strong>in</strong>g farmers will<strong>in</strong>g to sell<br />
and a price is agreed between the local farmer and wholesale buyers, village traders contact their buyers<br />
us<strong>in</strong>g mobile telephones. Once an agreement is struck, the deal is concluded on a trust basis. Trade can also<br />
be <strong>in</strong>itiated by the wholesaler who requires urgent supplies. When wholesaler requires <strong>Potatoes</strong>, he will call<br />
his contact (village trader) agree on a price and other market<strong>in</strong>g arrangements and <strong>in</strong> turn the village trader<br />
will assemble to fulfil the amount required by the wholesaler. To accelerate the process, village traders are<br />
given cash advances from wholesalers, <strong>in</strong> which case they at times regard themselves as brokers.<br />
Village traders/assemblers also sell to travell<strong>in</strong>g traders from Kampala and to contacts <strong>in</strong> other towns. See<br />
Figure 5 a schematic representation of the Potato trad<strong>in</strong>g cha<strong>in</strong>.<br />
14
Figure 5: The Ware Potato trad<strong>in</strong>g cha<strong>in</strong>.<br />
Rural broker<br />
Travell<strong>in</strong>g traders<br />
Village traders/<br />
Framers<br />
Urban Brokers<br />
Wholesalers<br />
Urban retailers<br />
Consumers<br />
/processors<br />
Brokers<br />
Brokers are one of the prom<strong>in</strong>ent market participants <strong>in</strong> Potato trad<strong>in</strong>g. In rural areas, brokers are the<br />
contact <strong>for</strong> travell<strong>in</strong>g traders and wholesale buyers to farmers and the key l<strong>in</strong>k of farmers to traders.<br />
Broker<strong>in</strong>g is a lucrative activity and some successful village traders and wholesalers switched roles to<br />
brokers. Brokers get <strong>in</strong>stant pay (commission) per Potato bag <strong>for</strong> their services. The amount ranges from<br />
500-1,000/= per bag depend<strong>in</strong>g on the quantity required and the urgency with which the consignment is<br />
required.<br />
Apart from rural brokers who l<strong>in</strong>k farmers with the travell<strong>in</strong>g traders, there are also brokers <strong>in</strong> most urban<br />
centres who l<strong>in</strong>k travell<strong>in</strong>g traders to wholesalers and urban retailers. For example, <strong>in</strong> Kampala or Mbale<br />
travell<strong>in</strong>g traders or village traders who have brought a lorry load of <strong>Potatoes</strong>, surrender it to the broker.<br />
Be<strong>for</strong>e the broker accepts the responsibility, a number of issues are agreed, i.e,<br />
- The number of bags that are on the lorry<br />
- The price per bag that the travell<strong>in</strong>g trader is go<strong>in</strong>g to receive<br />
- The m<strong>in</strong>imum price per bag at which the broker will sell, hence commission per bag.<br />
15<br />
Rural<br />
retailers<br />
Key<br />
Rural consumers<br />
Major Flow<br />
M<strong>in</strong>or Flow
- Who pays the market fees and off load<strong>in</strong>g costs<br />
In Kampala markets, we found out that after agree<strong>in</strong>g on the price that the travell<strong>in</strong>g trader is to receive per<br />
bag, brokers were free to sell at whatever price they could negotiate with the buyers. Thus the commission<br />
that the brokers receive, varied from 500-2,000/= per bag depend<strong>in</strong>g on demand and supply conditions <strong>in</strong><br />
the market. Brokers are an organised and <strong>in</strong>fluential group <strong>in</strong> the market (especially Ow<strong>in</strong>o market) and<br />
few travell<strong>in</strong>g and village traders can directly sell to wholesalers and urban retailers as shown <strong>in</strong> Figure 1,<br />
by dashed l<strong>in</strong>es (m<strong>in</strong>or flow).<br />
Mbale brokers are not different from their k<strong>in</strong>folk <strong>in</strong> Kampala. They also takeover the<br />
transaction activities of <strong>Potatoes</strong> as soon as the lorry load enters the market. While<br />
Kampala brokers usually accept to over the responsibility of pay<strong>in</strong>g <strong>for</strong> off loaders as a<br />
fraction of their gross commission, Mbale brokers negotiate to pay even <strong>for</strong> markets fees<br />
as shown below.<br />
Market<br />
fees<br />
Gross<br />
commission<br />
Offloadi<br />
ng fees<br />
Sometimes brokers make w<strong>in</strong>dfall ga<strong>in</strong>s. Urban brokers negotiate a fixed price with the travell<strong>in</strong>g traders<br />
and sell at a higher price to the wholesalers while the rural brokers may negotiate a different price (higher<br />
price) with the buyers and pay a different price (lower price) to the farmers.<br />
For example, suppose a broker buys from the farmer is will<strong>in</strong>g to sell 100 bags of <strong>Potatoes</strong> at 8,000/= per<br />
bag while the trader is will<strong>in</strong>g to pay 10,000/= per bag. The broker will ga<strong>in</strong> (10,000-8,000)x100 =<br />
200,000/= <strong>for</strong> a s<strong>in</strong>gle transaction. Given the production costs, a farmer can hardly make such a profit<br />
marg<strong>in</strong> from a production of hundred bags of <strong>Potatoes</strong>. Like wise few traders (travell<strong>in</strong>g traders) can make<br />
such profit given the high market<strong>in</strong>g costs <strong>in</strong>volved <strong>in</strong> Potato trad<strong>in</strong>g.<br />
Brokers do not <strong>in</strong>cur losses. At worst, they sell at the travell<strong>in</strong>g traders’ reserve price otherwise a price<br />
above the reserve price guarantees them of a m<strong>in</strong>imum commission.<br />
On the whole, the market has now accepted brokers (urban and rural) as a necessary <strong>in</strong>iquity. They are a<br />
key l<strong>in</strong>k <strong>in</strong> the market<strong>in</strong>g cha<strong>in</strong>. They are the most <strong>in</strong><strong>for</strong>med about the market (demand and supply)<br />
conditions.<br />
Travell<strong>in</strong>g traders<br />
These are traders who either own trucks or hire them <strong>for</strong> buy<strong>in</strong>g <strong>Potatoes</strong> from farmers or village traders<br />
and then transport and sell to wholesalers and urban retailers <strong>in</strong> other district markets. These traders supply<br />
most of the <strong>Potatoes</strong> to wholesalers and retailers through brokers. In Kampala, travell<strong>in</strong>g traders can station<br />
and sell their Potato truckload <strong>in</strong> one market or move from one market to another until the consignment is<br />
sold.<br />
Travell<strong>in</strong>g traders with fresh <strong>Potatoes</strong> (high quality) typically hike their prices relative to those prevail<strong>in</strong>g<br />
the market. However, when their stocks do not sell quickly as they anticipated and the quality starts to<br />
degenerate, these traders reduce the price accord<strong>in</strong>gly. Travell<strong>in</strong>g traders will sell at clearance prices to<br />
avoid further overhead costs such as accommodation costs, overnight park<strong>in</strong>g fees, product loss and<br />
transport surcharge from truck owners.<br />
16<br />
Net<br />
commission
Wholesalers<br />
Major Potato wholesalers are largely found <strong>in</strong> Kampala (Ow<strong>in</strong>o and Nakawa) Mbale markets. In other<br />
towns, traders double as wholesale and retail traders because of the lower volumes. More often,<br />
wholesalers get their supplies from travell<strong>in</strong>g traders. Rarely do wholesalers venture out to buy directly<br />
from the farmers.<br />
Most traders do not know the names of different varieties but can dist<strong>in</strong>guish them accord<strong>in</strong>g to the sk<strong>in</strong><br />
and flesh colours. As experienced traders they soon know which varieties that are most highly sought by<br />
restaurants (good <strong>for</strong> chips and crisps). Accord<strong>in</strong>gly, wholesale traders sell different varieties at vary<strong>in</strong>g<br />
prices. A popular variety, Uganda 11 (Rutuku) most preferred <strong>for</strong> chips and crisps is sold at a premium<br />
price of 7-13% over that of other varieties.<br />
Retailers<br />
Potato retailers are many and range from supermarkets to village roadside sellers.<br />
In urban areas retailers <strong>in</strong> markets buy 1-5 bags from the wholesalers and then sell it <strong>in</strong> various heaps sizes<br />
<strong>for</strong> amounts rang<strong>in</strong>g from 100-2,000/= A heap sold at 1,000/= weighs an average of 3kgs. Retailers sort and<br />
grade <strong>Potatoes</strong> accord<strong>in</strong>g to variety and degree of freshness. Recently, some supermarkets such as Shoprite<br />
have started sell<strong>in</strong>g <strong>Potatoes</strong> <strong>in</strong> 5kg packages.<br />
In rural areas <strong>Potatoes</strong> are sold on the road sides heaps or t<strong>in</strong>s. A heap which has an average weight of<br />
10kgs, sells <strong>for</strong> approximately 2,000/=.<br />
Processors<br />
Hotels, restaurants and Take-Aways (Fast Food outlets) are the ma<strong>in</strong> bus<strong>in</strong>ess enterprises that process<br />
<strong>Potatoes</strong> <strong>in</strong>to chips. In urban areas, over 50% of <strong>Potatoes</strong> are consumed as chips. M<strong>in</strong>imum <strong>in</strong>puts needed<br />
to process chips <strong>in</strong>clude fresh <strong>Potatoes</strong>, cook<strong>in</strong>g oil, fuel energy and a pan. These <strong>in</strong>puts are locally<br />
available. The team was shocked to discover that despite the abundance of good quality <strong>Potatoes</strong> available<br />
<strong>in</strong> Uganda, the South African based fast food restaurants such as Nandos and Steers get their <strong>Potatoes</strong> from<br />
South Africa. This would appear to be a valuable niche market if Ugandan growers could produce the<br />
varieties grown <strong>in</strong> the Republic of South Africa to supply these outlets.<br />
There are some small-scale food processors that make crisps from <strong>Potatoes</strong>. Crisps be<strong>in</strong>g not a very popular<br />
product that is ma<strong>in</strong>ly eaten by students and young people <strong>in</strong> urban areas means that its market is limited<br />
thereby limit<strong>in</strong>g its production.<br />
Consumption and prices<br />
In Uganda, <strong>Potatoes</strong> are consumed <strong>in</strong> areas where they are produced and surplus is sold <strong>in</strong> urban areas.<br />
Market patterns <strong>in</strong>dicated that almost no <strong>Potatoes</strong> moved to non-produc<strong>in</strong>g areas where <strong>Potatoes</strong> are not<br />
regarded as a staple food.<br />
<strong>Potatoes</strong> are consumed <strong>in</strong> a number of ways. Potato farm<strong>in</strong>g communities and rural dwellers, where<br />
<strong>Potatoes</strong> are consumed as a major food staple, ma<strong>in</strong>ly eat Potato boiled or mashed. At times they also eat<br />
<strong>Potatoes</strong> mixed <strong>in</strong> beans, beef, or other vegetable stew. In these communities, <strong>Potatoes</strong> are eaten by all ages<br />
of people.<br />
In the urban areas of Uganda, <strong>Potatoes</strong> are ma<strong>in</strong>ly consumed as chips, snacks (crisps) and occasionally <strong>in</strong> a<br />
boiled or mashed <strong>for</strong>m. The major consumers of <strong>Potatoes</strong> <strong>in</strong> towns are young people of work<strong>in</strong>g class and<br />
students of higher <strong>in</strong>stitutions of learn<strong>in</strong>g who eat <strong>Potatoes</strong> ma<strong>in</strong>ly as chips. Particularly, it is <strong>in</strong>terest<strong>in</strong>g to<br />
note that on average, more women eat chips than men. The rapid rate at which fast food outlets (Take-<br />
Aways) are becom<strong>in</strong>g popular <strong>in</strong> urban centres is evidence to the high level of Potato (chips) consumption.<br />
The pr<strong>in</strong>ciple product of the take-ways is chips and chicken. Young people we <strong>in</strong>terviewed said they<br />
prefered chips to other foods because it is tasty, cheap easy to prepare, and considered a status food.<br />
Estimates from the 1994/95 Uganda National Household Survey <strong>in</strong>dicated that the region with<br />
highest average monthly household consumption expenditure on <strong>Potatoes</strong> was western Uganda<br />
followed central and eastern and lastly northern Uganda, Table 6. Tables 6, 7 and 8 <strong>in</strong>dicate the<br />
average monthly household consumption expenditure on major food staples <strong>in</strong> Uganda. They<br />
were complied from the Uganda National Household survey (1994-95) statistics report<br />
17
Table 6: Average monthly household consumption expenditure on <strong>Potatoes</strong> by region <strong>in</strong><br />
1995<br />
Region Per H/H<br />
Monthly Exp<br />
<strong>in</strong> U.shs.<br />
Rural Urban Total<br />
% of total<br />
Exp on<br />
major<br />
food<br />
Per H/H<br />
Monthly Exp<br />
<strong>in</strong> U.shs .<br />
18<br />
% of total<br />
Exp on<br />
major<br />
food<br />
Per H/H<br />
Monthly<br />
Exp <strong>in</strong><br />
U.shs .<br />
Northern 20 0.04 450 0.45 48 0.1<br />
Eastern 83 0.16 563 0.59 124 0.23<br />
Central 513 0.6 946 0.55 633 0.58<br />
Western 1,250 2.16 858 0.84 1,222 2.00<br />
% of total<br />
Exp on<br />
major food<br />
Table 7: Average monthly household consumption expenditure on Matooke by region <strong>in</strong><br />
1995<br />
Region Per H/H<br />
Monthly Exp<br />
<strong>in</strong> U.shs .<br />
Rural Urban Total<br />
% of total<br />
Exp on<br />
major<br />
food<br />
Per H/H<br />
Monthly Exp<br />
<strong>in</strong> U.shs .<br />
% of total<br />
Exp on<br />
major<br />
food<br />
Per H/H<br />
Monthly<br />
Exp <strong>in</strong><br />
U.shs .<br />
% of total<br />
Exp on<br />
major food<br />
Northern 332 0.73 1,442 1.43 403 0.82<br />
Eastern 1,309 2.59 3,477 3.65 1,492 2.74<br />
Central 8,092 9.48 11,224 6.53 8,965 8.19<br />
Western 7,986 13.78 8,612 8.39 8,031 13.11<br />
Table 8: Average monthly Household consumption expenditure on major food staples <strong>in</strong><br />
Uganda <strong>in</strong> 1995<br />
Food staple Per H/H<br />
Monthly Exp<br />
<strong>in</strong> U.shs .<br />
Rural Urban Total<br />
% of total<br />
Exp on<br />
major<br />
food<br />
Per H/H<br />
Monthly Exp<br />
<strong>in</strong> U.shs .<br />
% of total<br />
Exp on<br />
major<br />
food<br />
Per H/H<br />
Monthly<br />
Exp <strong>in</strong><br />
U.shs .<br />
% of total<br />
Exp on<br />
major food<br />
Matooke 4,866 7.92 9,020 6.17 5,458 7.42<br />
Sweet Potato 4,385 7.13 2,779 1.9 4,156 5.65<br />
Potato 512 0.83 841 0.58 559 0.76<br />
Cassava<br />
(fresh, flour)<br />
3,030 4.93 1,850 1.27 2,862 3.89<br />
Source: Uganda National Household Survey (1994-95), M<strong>in</strong>. Plann<strong>in</strong>g and Econ. Dev’t.<br />
Although the estimates <strong>in</strong> the tables above may not portray an accurate status of the current levels of staple<br />
food consumption, it provides a guide to the magnitude and direction of expenditure flow by households on<br />
major food staples <strong>in</strong> various regions of the country.<br />
Table 6 highlights the comparative household monthly expenditures on <strong>Potatoes</strong> between regions and<br />
between rural and urban areas. Noticeably, the rural part of western Uganda has a higher monthly<br />
expenditure (1,250/= per month) on <strong>Potatoes</strong> than the urban areas of western Uganda (858/= per month).<br />
This f<strong>in</strong>d<strong>in</strong>g is reasonable as potatoes are the ma<strong>in</strong> food staple <strong>for</strong> rural people <strong>in</strong> Kabale, Kisoro and<br />
Rukungiri. People <strong>in</strong> urban areas have a greater choice of buy<strong>in</strong>g other food staples such as matooke and<br />
rice brought from other districts. In the regions of central, eastern and Northern Uganda, urban dwellers<br />
spend more on <strong>Potatoes</strong> than rural.
Comparatively, both rural and urban households <strong>in</strong> all the regions of Uganda, spend over 5 times their<br />
monthly consumption budget on cook<strong>in</strong>g/bananas matooke than <strong>Potatoes</strong>. (See Tables 6 and 7). Matooke is<br />
a very close substitute to <strong>Potatoes</strong> and it is ranked number one food staple <strong>in</strong> central and <strong>in</strong> some parts of<br />
eastern and western districts of Uganda.<br />
Table 8 shows that of all the 4 major food staples consumed <strong>in</strong> Uganda, the highest monthly household<br />
expenditure goes to matooke, closely followed by sweet <strong>Potatoes</strong>, and then cassava and lastly the least<br />
expenditure goes <strong>Potatoes</strong>. The data <strong>in</strong> Table 8 reveals that the urban community spends about twice as<br />
much on matooke and <strong>Potatoes</strong> than the rural populace while on the other hand the rural populace is<br />
observed to spend about two times more on sweet <strong>Potatoes</strong> and cassava.<br />
Figure 6 shows the nom<strong>in</strong>al retail price of <strong>Potatoes</strong> <strong>in</strong> selected markets <strong>in</strong> Uganda. This graph shows how<br />
unstable Potato prices can be. The l<strong>in</strong>ear trend shows that over time Potato prices have more than doubled<br />
<strong>in</strong> the last 10 years (see l<strong>in</strong>ear equation) <strong>in</strong> direct relation to the macroeconomic conditions (<strong>in</strong>flation,<br />
exchange rate <strong>in</strong>stability, supply shocks, etc.) prevail<strong>in</strong>g <strong>in</strong> the country.<br />
Figure 6: Trend of monthly nom<strong>in</strong>al retail price of <strong>Potatoes</strong> <strong>in</strong> select district urban markets<br />
Price <strong>in</strong> Uga. Shs.<br />
800<br />
700<br />
600<br />
500<br />
400<br />
300<br />
200<br />
100<br />
0<br />
Mbale cpi K'la/Ebb cpi Mbarara cpi L<strong>in</strong>ear (K'la/Ebb cpi)<br />
y = 2.1933x - 2219.9<br />
Sep-88<br />
Mar-89<br />
Sep-89<br />
Mar-90<br />
Sep-90<br />
Mar-91<br />
Sep-91<br />
Mar-92<br />
Sep-92<br />
Mar-93<br />
Sep-93<br />
Mar-94<br />
Sep-94<br />
Source: Uganda Bureau of Statistics; M<strong>in</strong>. of F<strong>in</strong>ance and Econ Dev’t.<br />
Figure 7: Trend of monthly nom<strong>in</strong>al retail price of <strong>Potatoes</strong> <strong>in</strong> select district urban markets<br />
19<br />
Mar-95<br />
Years<br />
Sep-95<br />
Mar-96<br />
Sep-96<br />
Mar-97<br />
Sep-97<br />
Mar-98<br />
Sep-98<br />
Mar-99<br />
Sep-99<br />
Mar-00<br />
Sep-00
Real price per Kg.<br />
250<br />
200<br />
150<br />
100<br />
50<br />
0<br />
Sep-89<br />
Mar-90<br />
Mbale K'la/Ebb<br />
Mbarara L<strong>in</strong>ear (K'la/Ebb )<br />
y = 0.0859x + 15.164<br />
Sep-90<br />
Mar-91<br />
Sep-91<br />
Mar-92<br />
Sep-92<br />
Mar-93<br />
Sep-93<br />
Mar-94<br />
Sep-94<br />
Mar-95<br />
Figure 7 shows real (adjusted <strong>for</strong> <strong>in</strong>flation) retail price of <strong>Potatoes</strong> <strong>in</strong> Kampala, Mbale,<br />
Masaka and Mbarara <strong>for</strong> the period September 1989 to June 2000. While the graphs <strong>in</strong><br />
Figure 7 clearly shows that Potato prices are highly unstable, the trend l<strong>in</strong>e <strong>for</strong> the<br />
Kampala real price series <strong>in</strong>dicate that over this period, real prices have been stable. A<br />
likely reason why Potato real prices have rema<strong>in</strong>ed almost constant over the long run is<br />
because whilst demand <strong>for</strong> <strong>Potatoes</strong> has <strong>in</strong>creased, supply has matched this growth.<br />
In Uganda, ware Potato production is no longer a monopoly of the highland regions of<br />
the old Kigezi districts. Victoria, a versatile Potato variety with a short maturity period<br />
can be grown <strong>in</strong> virtually all parts of Uganda which have adequate ra<strong>in</strong>fall.<br />
Exam<strong>in</strong>ation of the graphs <strong>in</strong> figure 6 and 7 <strong>in</strong>dicates that the seasonal fluctuation of Potato prices have<br />
existed over the entire period. However, a closer scrut<strong>in</strong>y shows that price fluctuations have worsened s<strong>in</strong>ce<br />
1997. In 1998 Uganda experienced the famous El N<strong>in</strong>o phenomenon. These adverse weather conditions led<br />
to supply shocks of most agricultural output that exacerbated price volatilities. Another possible reason <strong>for</strong><br />
the high level of Potato price <strong>in</strong>stability is its high degree of perishability due to lack of appropriate<br />
pack<strong>in</strong>g, handl<strong>in</strong>g and storage facilities. The mode of production that depends on ra<strong>in</strong>-fed agriculture also<br />
affects supply, and a change <strong>in</strong> transaction costs directly affects the price stability.<br />
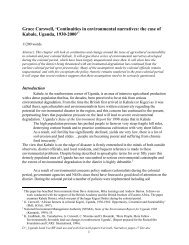
Figure 8 shows the seasonal real retail price movements <strong>for</strong> <strong>Potatoes</strong> <strong>in</strong> Kampala <strong>for</strong> the period 1989-2000.<br />
The grand seasonal <strong>in</strong>dex (GSI) is a statistic that calculates the monthly average price from a price series<br />
<strong>for</strong> a given period of time. (For more on calculation see Appendix 2)<br />
Figure 8: GSI <strong>for</strong> potatoes <strong>in</strong> Kampala, 1989-2000<br />
20<br />
Sep-95<br />
Years<br />
Mar-96<br />
Sep-96<br />
Mar-97<br />
Sep-97<br />
Mar-98<br />
Sep-98<br />
Mar-99<br />
Sep-99<br />
Mar-00
GSI<br />
200<br />
150<br />
100<br />
50<br />
0<br />
GSI<br />
GSI +1s.d<br />
GSI -1s.d<br />
annual mean<br />
Jan Feb Mar Apr May Jun Jul Aug Sep Oct Nov Dec<br />
Months<br />
Our calculations, Appendix 2, <strong>in</strong>dicate that the annual mean real retail price of Irish<br />
<strong>Potatoes</strong> is 113.19/= per kilogram. Figure 8 shows that the trend <strong>in</strong> seasonal prices is<br />
more or less stable and shifts above and below the annual mean. The graph further<br />
<strong>in</strong>dicates that the seasonal price <strong>in</strong>dex does not exceed the annual mean by 9%, and at its<br />
m<strong>in</strong>imum the seasonal <strong>in</strong>dex does not go below 12.5% of the annual mean.<br />
In Figure 8, there are two more graphs that deserve an explanation. GSI +1s.d and GSI -1s.d are graphs that<br />
were derived by add<strong>in</strong>g to and subtract<strong>in</strong>g from GSI a standard deviation of every month’s seasonal <strong>in</strong>dex.<br />
Standard deviations measure the magnitude of variation of the series from their mean. The above graphs are<br />
thus <strong>in</strong>troduced as a measure of the level of uncerta<strong>in</strong>ty <strong>in</strong> the seasonal price fluctuations. These graphs<br />
show a significant pattern. The standard deviations are lowest <strong>in</strong> August and December to February, when<br />
the market’s uncerta<strong>in</strong>ty is at its lowest level. Major Potato harvests come to the market late <strong>in</strong> December<br />
and cont<strong>in</strong>ue to early March. Second season harvests register their presence <strong>in</strong> the market <strong>in</strong> August but<br />
because production volumes are low <strong>in</strong> this season, speculation is common and price volatility <strong>in</strong>creases.<br />
Standard deviations are at their peak just be<strong>for</strong>e harvests <strong>in</strong> May to July and November. Lack of reliable<br />
<strong>in</strong><strong>for</strong>mation on supply and demand conditions tends to exacerbate the level of uncerta<strong>in</strong>ty, however, dur<strong>in</strong>g<br />
these periods; off-season production from swamplands and some imports from <strong>Rwanda</strong> usually filter <strong>in</strong>to<br />
the market to ameliorate the erratic situation. September to November is the opportune period <strong>for</strong> <strong>Rwanda</strong><br />
to export potatoes to Uganda.<br />
Despite these erratic price movements, we did not obta<strong>in</strong> any <strong>in</strong><strong>for</strong>mation suggest<strong>in</strong>g that farmers or traders<br />
store ware potatoes <strong>for</strong> speculative purposes.<br />
In Uganda, the rate of population growth and urbanisation is well correlated with the level of Potato<br />
consumption, especially <strong>in</strong> the <strong>for</strong>m of chips and crisps. There<strong>for</strong>e, demand <strong>for</strong> <strong>Potatoes</strong> is likely to<br />
<strong>in</strong>crease <strong>in</strong> the future and it is expected that supply from low and mid altitude zones where Potato<br />
cultivation is a cash crop will <strong>in</strong>crease. There<strong>for</strong>e, the long-term future trends of Potato demand and supply<br />
are certa<strong>in</strong> but changes are more difficult to judge, as this will depend on competition.<br />
Spatial Analysis of ware potato market<br />
In an <strong>in</strong>tegrated market system scarcity <strong>in</strong> one location creates demand of products from other locations.<br />
Consequently, local prices <strong>in</strong> an <strong>in</strong>tegrated market system would be more stable and only differ due to<br />
transaction costs between locations. Correlation coefficients (r) between pairs of markets are the<br />
quantitative estimation used to measure the level of the market’s spatial <strong>in</strong>tegration.<br />
Tables 9 and 10 conta<strong>in</strong> results of correlation coefficients between four towns <strong>for</strong> Potato prices calculated<br />
us<strong>in</strong>g nom<strong>in</strong>al and real prices respectively. From Tables 9 and 10, the follow<strong>in</strong>g observation worth not<strong>in</strong>g.<br />
21
• All coefficients <strong>in</strong> Table 9 exhibit moderate (0.6
(rural broker). To ensure quality and m<strong>in</strong>imum post harvest losses, travell<strong>in</strong>g traders provide pack<strong>in</strong>g bags,<br />
pay labour to sort and pack and <strong>in</strong>curs a host of other costs as <strong>in</strong>dicated <strong>in</strong> Table 11.<br />
Travell<strong>in</strong>g traders are exposed to a multitude of risks to move food from rural areas to urban centres. In<br />
Uganda <strong>Potatoes</strong> are grown <strong>in</strong> highlands that have the worst road network. While <strong>in</strong> transit, traders may<br />
f<strong>in</strong>d that a section of the road was washed away or their truck may breakdown. In such case travell<strong>in</strong>g<br />
traders are faced with 50-100% loss of the consignment. In bus<strong>in</strong>ess, the higher the risk, the higher the<br />
return to attract <strong>in</strong>vestment. This is also true <strong>in</strong> Potato trad<strong>in</strong>g where the travell<strong>in</strong>g trader gets more than<br />
35% net marg<strong>in</strong>.<br />
While wholesalers seem to earn a lower net marg<strong>in</strong> of 2,393/= (9.5%) per bag of <strong>Potatoes</strong>, retailers get an<br />
average net marg<strong>in</strong> of 3,700/= (12.3%). It is important to note that wholesalers usually have a higher<br />
turnover than retailers. For example a wholesaler may sell between 200-400 Potato bags per month giv<strong>in</strong>g<br />
him a net <strong>in</strong>come rang<strong>in</strong>g from 400,000-800,000/= per month while the retailer may sell between 20-40<br />
bags giv<strong>in</strong>g him a monthly net <strong>in</strong>come range between 70,000-150,000/= only. Brokers who have an<br />
opportunity to handle 5 10-tonne lorries <strong>in</strong> a month can also get a monthly <strong>in</strong>come of between 250,000-<br />
500,000/=<br />
Table 11: Potato <strong>Market<strong>in</strong>g</strong> Cost and Marg<strong>in</strong>s<br />
U Shs./100kg bag % of sell<strong>in</strong>g price<br />
Farmer<br />
Farm-gate price 8,000<br />
Travell<strong>in</strong>g trader<br />
Purchase price 8,000<br />
Sell<strong>in</strong>g price 22,000<br />
Gross marg<strong>in</strong> 14,000 63.64<br />
Costs<br />
Commission (Rural broker) 1,000 4.5<br />
Pack<strong>in</strong>g bags 500<br />
Sisal rope <strong>for</strong> sow<strong>in</strong>g top 83<br />
Grass <strong>for</strong> pack<strong>in</strong>g 33<br />
Sort<strong>in</strong>g, pack<strong>in</strong>g & sow<strong>in</strong>g labour cost 300<br />
Load<strong>in</strong>g 200<br />
Sub-county tax levy 200<br />
Transport 5,000<br />
Total cost be<strong>for</strong>e Kampala market 7,316<br />
In Kampala markets<br />
Market fee 500<br />
Offload<strong>in</strong>g fee 200<br />
Commission (Urban broker) 1,000 4.5<br />
Costs <strong>in</strong> Kampala market 1,700<br />
Total costs 9,016<br />
Net<br />
Marg<strong>in</strong> 4,984 35.60<br />
Wholesaler<br />
Purchase price 22,000<br />
Sell<strong>in</strong>g price 25,000<br />
Gross marg<strong>in</strong> 3,000 12.00<br />
Costs<br />
23
Market stall rent 14<br />
Miscellaneous Overhead costs 100<br />
Post harvest loss 500<br />
Total costs 614<br />
Net<br />
marg<strong>in</strong> 2386 9.50<br />
Retailer (Ow<strong>in</strong>o market)<br />
Purchase price 25,000<br />
Sell<strong>in</strong>g price 30,000<br />
Gross marg<strong>in</strong> 5,000 16.67<br />
Costs<br />
Market stall rent 200<br />
Miscellaneous labour 300<br />
Miscellaneous Overhead costs 100<br />
Post harvest loss 700<br />
Total costs 1,300<br />
Net<br />
Marg<strong>in</strong> 3,700 12.33<br />
Table 12: Assumptions used to derive costs <strong>in</strong> table 5<br />
Item Unit cost Capacity Cost per bag<br />
1 Sisal bundle 2,500/= Sow<strong>in</strong>g 30 bags 83.3/=<br />
1 Bundle of pack<strong>in</strong>g<br />
grass<br />
1,000/= Pack<strong>in</strong>g 30 bags 33.3/=<br />
Wholesaler sells 500 bags per 14/=<br />
Market stall rent per 7,000/= month<br />
month<br />
Retailer sell 35 bags per month 200/=<br />
Post harvest loss 250/= Wholesaler loss = 2kg per bag 500/=<br />
350/= Retailer loss = 2kg per bag 700/=<br />
1 Potato Heap Retail =<br />
1,000/=<br />
1 bag = 30 heaps 30,000/=<br />
Ware Potato Imports/Exports.<br />
Interviews held with traders and government revenue officials along the Uganda-<strong>Rwanda</strong> and Uganda-<br />
Kenya borders did not give the impression of a brisk bus<strong>in</strong>ess <strong>in</strong> <strong>Potatoes</strong> between Uganda and her<br />
neighbours.<br />
At Katuna border (Uganda-<strong>Rwanda</strong>), a prom<strong>in</strong>ent Potato trader we <strong>in</strong>terviewed showed us<br />
Uganda Revenue Authority Customs Department receipts <strong>in</strong>dicat<strong>in</strong>g the custom taxes he paid <strong>for</strong><br />
import<strong>in</strong>g <strong>Potatoes</strong> from <strong>Rwanda</strong>. When there is a w<strong>in</strong>dow of scarcity <strong>in</strong> Kabale (September-<br />
November) amidst high demand from Kampala, traders from Kabale and Kisoro exploit the<br />
situation by import<strong>in</strong>g <strong>Potatoes</strong> from <strong>Rwanda</strong>, repack them <strong>in</strong> Kabale and sell as Kabale <strong>Potatoes</strong>.<br />
The traders say they repack the <strong>Potatoes</strong> by mix<strong>in</strong>g a large percentage of <strong>Rwanda</strong> <strong>Potatoes</strong> with a<br />
smaller amount from Kabale. This is done to hoodw<strong>in</strong>k travell<strong>in</strong>g traders from Kampala that the<br />
whole consignment is from Kabale. Sometimes the adulteration of Kabale <strong>Potatoes</strong> with that from<br />
<strong>Rwanda</strong> is done by the Kabale brokers who are advanced credit by their trad<strong>in</strong>g patterns <strong>in</strong><br />
Kampala. This phenomenon of Potato repack<strong>in</strong>g is <strong>in</strong>fluenced the fame (quality) of Kabale<br />
<strong>Potatoes</strong>.<br />
24
Other than at Katuna border, the traders revealed that Potato trade between Uganda and <strong>Rwanda</strong> exists<br />
<strong>in</strong><strong>for</strong>mally along other smaller border cross<strong>in</strong>gs <strong>in</strong> Kabale and Kisoro such as kyanika border . Some<br />
traders occasionally br<strong>in</strong>g <strong>Potatoes</strong> from Eastern Congo.<br />
No cross border Potato trade has reported along the Uganda-Kenya border. Even the<br />
TechnoServe/University Technical reports on Unrecorded Cross-Border Trade between Uganda and Kenya<br />
have no mention of Potato trade. Traders from Kapchorwa who normally sell maize gra<strong>in</strong> <strong>in</strong> Kenya said<br />
they have never attempted to sell <strong>Potatoes</strong> from Kapchorwa to Kenya. Also no traders from Mbale, Tororo,<br />
Busia and Malaba districts that border Kenya claimed to have imported or exported <strong>Potatoes</strong> between<br />
Uganda and Kenya. Potato production map of Kenya shows a major Potato production belt at the slopes of<br />
mount Elgon on the Kenya side. This means that all the Kenyan districts border<strong>in</strong>g Uganda have adequate<br />
and cheap Potato supplies from with<strong>in</strong> Kenya.<br />
25
Seed potato <strong>Market<strong>in</strong>g</strong> <strong>in</strong> Uganda<br />
Other than the National Agricultural Research Organisation (NARO) potato research <strong>in</strong>stitutes, <strong>in</strong> Uganda,<br />
there is only one recognised farmers group (UNSPPA) that produces high quality seed potatoes. S<strong>in</strong>ce the<br />
<strong>in</strong>ception of Uganda National Seed potato Producers Association (UNSPPA), the leaders of the association<br />
have been compil<strong>in</strong>g detailed bi-annual reports on production and market<strong>in</strong>g of seed potatoes by the<br />
members of the association – See UNSPPA 2000A report by R. Kakuhenzire and S. T<strong>in</strong>dimubona below<br />
and others <strong>in</strong> Annex 2-3. These reports give detailed cost-benefit analysis of seed potato production by the<br />
members, rate of seed potato utilisation and yield. A detailed breakdown of how many bags each member<br />
plants, all <strong>in</strong>puts used with costs and the total harvests. Thus these reports give a first hand analysis of the<br />
costs <strong>in</strong>curred, gross revenues and net returns received by each member of the association.<br />
PRODUCTION REPORT FOR UGANDA NATIONAL SEED POTATO PRODUCERS<br />
ASSOCIATION (UNSPPA) FOR 2000B SEASON<br />
R. Kakuhenzire and S. T<strong>in</strong>dimubona<br />
Introduction.<br />
The Uganda National Seed potato Producers Association (UNSPPA) is a group of<br />
farmers whose ma<strong>in</strong> aim is to produce, store and distribute quality seed potato to other<br />
Potato growers preferably at the community level. The association was started <strong>in</strong> 1996<br />
with ten members. Current membership stands at 25 people, 15 men and 10 women. In<br />
the second season of 2000, (2000B), the membership stood at 25 people however, only<br />
15 farmers collected 120 bags seed potato. Among the fifteen three did not submit<br />
production reports <strong>for</strong> 2000B. The farmers are Kiiza, Gareeba, Kanyima who took three,<br />
six and ten bags of seed potato respectively. Thus 101 bags of seed were accounted <strong>for</strong><br />
while 19 were not.<br />
Seed potato Procurement <strong>in</strong> 2000B.<br />
Fifteen (15) members among 25 procured 120 bags equivalent to 9.6 Mt. However, only 12 farmers<br />
returned production reports equivalent to 101 bags (8.08MT) of seed (Table 1 and appendix1). The total<br />
capital <strong>in</strong>vestment was Sh. 8,872,000 produc<strong>in</strong>g a gross return of Sh. 17,442,000 (Table 1). The farmers as<br />
a group made a net profit Sh.8,534,000 equivalent to 96.2% of the <strong>in</strong>vestment (Table 1). The farmers<br />
together produced 785 bags 160.6 MT) of potato. Two farmers, Mr. Sentaro and Mrs. Rubereti had their<br />
plot downgraded to ware potatoes and made net losses (Table 1).<br />
Table 1: Cost benefit analysis <strong>for</strong> seed potato producers <strong>in</strong> 2000B season<br />
Name<br />
1 Bags<br />
planted<br />
Bags<br />
harvested<br />
Multiplica<br />
tion rate<br />
26<br />
Capital<br />
<strong>in</strong>put<br />
(Shs)<br />
Gross<br />
return<br />
(Shs)<br />
Net return<br />
(Shs)<br />
Net<br />
return<br />
(%)<br />
Be<strong>in</strong>amary<br />
o<br />
10 70 7.0 87 1788000 982000 121.8 1*<br />
Bitarabeho<br />
F.<br />
10 66 6.6 82.6 1064000 285800 36.7 4*<br />
Karibushe 10 82 8.2 100.2 2150000 1188000 128.3 4<br />
Kemani E. 3 18 6.0 27 630000 414200 191.9 2<br />
Kihumuro<br />
A<br />
10 66 6.6 82.6 1400000 734000 110.2 4<br />
Kikafunda 5 19 2.7 26.7 445000 97500 28.1 1<br />
Kisiizi 8 48 6.0 62 1170000 547500 88.0 1*<br />
Mwongyer<br />
a<br />
12 100 8.3 120.3 2860000 1808000 171.9 2*<br />
Rubereti 6 29 3.2 38.2 255000 -221000 -46.6 0<br />
Sentaro 10 68 6.8 84.8 560000 -355000 -38.8 0<br />
T<strong>in</strong>dimubo<br />
na<br />
14 115 8.2 137.2 4520000 2772500 158.7 5*<br />
Direct<br />
beneficiaries
Twesigye 3 24 8.0 35 600000 280500 87.8 3<br />
V<br />
Total 102 705 7.8 883.6 17442000 8534000 96.2 27<br />
1<br />
One bag weighs 80 kg<br />
The level of tuber damage at harvest was m<strong>in</strong>imal (Table 2) compared with previous seasons. For every<br />
bag that was planted, 7.8 bags were harvested (Table 2). There was a marked <strong>in</strong>crease to this ratio, which<br />
could be probably attributed to better crop management. The mean production per bag was Sh. 11,302 with<br />
a m<strong>in</strong>imum and maximum break-even po<strong>in</strong>ts at Sh. 10,091 respectively. For farmers whose crops were not<br />
degraded to ware <strong>Potatoes</strong>, the average marg<strong>in</strong>al net rate ranged between 28.1% and 191.9% (Table 2).<br />
Average marg<strong>in</strong>al net return <strong>for</strong> all the members was 96.2%. Farmers with low multiplication rates and<br />
high production costs per bag made less marg<strong>in</strong>al net returns (Table 2).<br />
Table 2: Analysis of production cost <strong>for</strong> UNSPPA members <strong>in</strong> 2000B season<br />
Name Bags *<br />
planted<br />
Bags *<br />
Harve<br />
sted<br />
Dama<br />
ged<br />
Bags<br />
Net<br />
harvest<br />
Multipli<br />
cation<br />
rate<br />
27<br />
Capital<br />
<strong>in</strong>put<br />
(Shs)<br />
Production<br />
cost per bag<br />
(Shs)<br />
Net<br />
return<br />
(%)<br />
Be<strong>in</strong>amaryo 10 70 1.5 68.5 7.0 157 1,1514 121.8<br />
Bitarabeho<br />
F.<br />
10 66 3 63 6.6 148.6 11,791 36.7<br />
Karibushe 10 82 4.5 77.5 8.2 182.2 11,293 128.3<br />
Kemani E. 3 18 .5 17.5 6.0 45 11,988 191.9<br />
Kihumuro A 10 66 3 63 6.6 148.6 10,091 110.2<br />
Kikafunda 5 19 1.5 17.5 2.7 45.7 18,289 28.1<br />
Kisiizi 8 48 3 45 6.0 110 12,969 88.0<br />
Mwongyera 12 100 6 94 8.3 220.3 10,520 171.9<br />
Rubereti 6 29 3 26 3.2 67.2 16,414 -46.6<br />
Sentaro 10 68 0 0 6.8 84.8 13,456 -38.8<br />
T<strong>in</strong>dimubon<br />
a<br />
14 115 3 112 8.2 252.2 15,196 158.7<br />
Twesigye V 3 24 1 23 8.0 59 13,313 87.8<br />
Sub-Total 101 705 30.0 755 7.8 1520.6 11,302 96.2<br />
*Each bags weighs 80 kg<br />
Consider<strong>in</strong>g resource allocation by UNSPPA members, the greatest proportion of resources was spent on<br />
seed (Table 3). Farm labour took 18.2%, fertilizers, 8.5%, transport, 7.3% pesticides 6.4% and empty bags<br />
took 2.7%. Among the pesticides, the expenditure on <strong>in</strong>secticides was low. The bulk of this item was used<br />
to procure fungicides (90%).
Table 3: Resource allocation (UShs) <strong>in</strong> seed potato production by members of Uganda<br />
National Seed potato Producers Association (UNSPPA) <strong>in</strong> 2000 B<br />
Name Cost of Farm labour Fertiliser Pesticides Empty Transport Total cost<br />
seed (Shs) (Shs) (Shs) (Shs) bags (Shs) (Shs) (Shs)<br />
Be<strong>in</strong>amaryo J. 500000 500000 40000 50000 20000 40000 1150000<br />
Bitarabeho F. 500000 500000 90000 33000 21600 5600 1150200<br />
Karibushe G. 500000 500000 42000 50000 36000 140000 1268000<br />
Kemani E. 150000 150000 5000 7800 2000 2000 316800<br />
Kihumuro A. 500000 500000 0 22000 15000 20000 1057000<br />
Kikafunda B. 250000 250000 0 35000 3500 5000 543500<br />
Kisiizi K. 400000 400000 42000 58000 12500 0 912500<br />
Mwongyera A. 600000 600000 86000 45000 53000 87000 1471000<br />
Rubereti E. 300000 300000 0 40000 10000 7000 657000<br />
Sentaro P. 500000 500000 106500 91500 10000 5000 1213000<br />
T<strong>in</strong>dimubona 700000 700000 340000 88000 50000 310500 2188500<br />
Twesigye V. 150000 150000 0 50000 8500 24000 382500<br />
Total 5050000 5050000 751500 570300 242100 646100 12310000<br />
Percent 56.9 18.2 8.5 6.4 2.7 7.3 100.0<br />
Conclusion.<br />
It is evident that the highest cost goes towards seed. Consider<strong>in</strong>g average price of ware potatoes <strong>for</strong> 2000,<br />
it is clear that the go<strong>in</strong>g price <strong>for</strong> seed <strong>in</strong> artificial and is cushioned by monopoly and subsidies from the<br />
NGO's and decentralized districts. Resource allocation <strong>in</strong>dicated that more money that previously has been<br />
allocated to purchase of fertilizer, which could have improved productivity dur<strong>in</strong>g the season. Farmers<br />
who fail to send seasonal returns and those who do not participate <strong>in</strong> production led to the reduced<br />
per<strong>for</strong>mance of the association. It can be argued that only half of the members were active <strong>in</strong> 2000B<br />
season.<br />
28
Name Bags *<br />
plted<br />
Cost of<br />
seed<br />
Land<br />
prep<br />
Plant<strong>in</strong><br />
g<br />
Weed<strong>in</strong>g Spray<strong>in</strong>g Fertilis<br />
er<br />
Pesticide<br />
s<br />
29<br />
Deha<br />
ualmi<br />
ng<br />
Guardi<br />
ng<br />
Harvest<br />
<strong>in</strong>g<br />
Empty<br />
bags<br />
Transport Total<br />
cost<br />
Be<strong>in</strong>amaryo 10 500000 60000 35000 25000 10000 40000 50000 6000 0 20000 20000 40000 806010 178800<br />
itarabeho 10 500000 60000 20000 10000 5000 90000 33000 3000 15000 15000 21600 5600 778210 106400<br />
Karibushe 10 500000 30000 10000 25000 30000 42000 50000 2000 25000 36000 36000 140000 926010 215000<br />
ani 3 150000 17000 3000 4000 3000 5000 7800 2000 15000 5000 2000 2000 215803 630000<br />
Kihumuro A. 10 500000 50000 20000 10000 6000 0 22000 3000 0 20000 15000 20000 666010 140000<br />
Kikafunda 5 250000 14000 10000 10000 6000 0 35000 2000 0 12000 3500 5000 347505 445000<br />
Kisiizi K. 8 400000 45000 13000 18000 6000 42000 58000 2000 0 26000 12500 0 622508 117000<br />
Mwongyera 12 600000 51000 28000 35000 16000 86000 45000 6000 10000 35000 53000 87000 1052012 286000<br />
Rubereti 6 300000 65000 7000 15000 3000 0 40000 4000 0 25000 10000 7000 476006 255000<br />
Sentaro P. 10 500000 100000 40000 20000 8000 106500 91500 4000 0 30000 10000 5000 915010 560000<br />
T<strong>in</strong>dimubona 14 700000 110000 30000 17000 27000 340000 88000 10000 40000 25000 50000 310500 1747514 452000<br />
Twesigye 3 150000 54000 6000 9000 8000 0 50000 1000 0 9000 8500 24000 319503 60000<br />
total 101 5050000 656000 222000 198000 128000 751500 570300 45000 105000 258000 242100 646100 8872101 169020<br />
Gareeba<br />
Kanyima 3<br />
Kiiza R. 6<br />
10<br />
120<br />
Gross<br />
return
Commentary on UNSPPA Seed potato Production <strong>Market<strong>in</strong>g</strong> Reports<br />
1. UNSPPA be<strong>in</strong>g the only organisation that is engaged <strong>in</strong> commercial seed potato production and<br />
market<strong>in</strong>g means that it is a monopoly <strong>in</strong> produc<strong>in</strong>g and sell<strong>in</strong>g high quality seed. Clearly there is<br />
need <strong>for</strong> other Potato farmers to jo<strong>in</strong> this association to learn techniques of better quality seed<br />
production and sell of surplus certified seed.<br />
2. The reports <strong>in</strong>dicate that the average production costs per bag of seed potatoes ranges from<br />
10,000-20,000/= while an 80kg bag of seed potato is sold at 50,000/=. Because of the natural<br />
monopoly (seed potato is best produced <strong>in</strong> highlands of altitude range 2,000-2,500m) that<br />
UNSPPA enjoys, it has unreasonably overpriced an 80kg bag of seed potato to the extent that<br />
apart from UNSPPA members and Non-government Organisations (NGOs) <strong>in</strong>deed very few<br />
Potato farmers can af<strong>for</strong>d such a price (50,000/= per 80 kg bag), which compares unfavourably<br />
with that of uncertified local potato seed that goes <strong>for</strong> 10,000-15,000/= per 100kg bag. A farmer<br />
with a meagre <strong>in</strong>come has no time to th<strong>in</strong>k of an expensive <strong>in</strong>put (seed potato) when there is a<br />
cheaper alternative.<br />
3. In market<strong>in</strong>g of seed potato, there is no <strong>in</strong>termediary. There are no brokers, village/travell<strong>in</strong>g<br />
traders or wholesalers. It is a one to one mapp<strong>in</strong>g. That is the seed producer (farmer) sells directly<br />
to the <strong>in</strong>put buyer (farmer). Occasionally some NGOs or groups buy on behalf of their farmers.<br />
Figure 5: One to One mapp<strong>in</strong>g of the Seed potato <strong>Market<strong>in</strong>g</strong> Cha<strong>in</strong><br />
Seed potato<br />
producer (Farmer)<br />
Certified seed potato be<strong>in</strong>g such an expensive <strong>in</strong>put, it is ma<strong>in</strong>ly the NGOs and District agricultural offices<br />
that have been buy<strong>in</strong>g seed potato from UNSPPA <strong>for</strong> onward distribution to the farmers. For example, to<br />
encourage Potato cultivation <strong>in</strong> Nebbi district, the district agriculture office bought over 150 bags of seed.<br />
African Highlands Initiative (AHI) a food security NGO that is support<strong>in</strong>g farmers groups <strong>in</strong> Kabale with<br />
the provision of clean potato seed. NGOs support<strong>in</strong>g Potato farmers <strong>in</strong> <strong>Rwanda</strong> also once bought seed from<br />
UNSPPA. In Figure 5, the thick arrow shows the ma<strong>in</strong> way seed potatoes reach farmers is through NGOs.<br />
The dashed l<strong>in</strong>e illustrates the few farmers who can af<strong>for</strong>d us<strong>in</strong>g their own resources to purchase seed<br />
potatoes, particularly members of UNSPPA.<br />
30<br />
NGOs<br />
Seed potato<br />
buyer (Farmer)
APPENDICES<br />
Appendix 1: production of <strong>Potatoes</strong> (‘000 tonnes) by district<br />
Appendix 1: PRODUCTION OF IRISH POTATOES ('000 TONNES) BY DISTRICT<br />
District 1992 1993 1994 1995 1996 1997 1998 1999 2000<br />
Apac 652<br />
Arua 3,061<br />
Bundibugyo 2,703<br />
Bushenyi 1,289<br />
779<br />
3,655<br />
3,227<br />
1,539<br />
896<br />
4,203<br />
3,711<br />
1,770<br />
979<br />
4,591<br />
4,054<br />
1,934<br />
31<br />
774<br />
3,632<br />
3,207<br />
1,530<br />
877<br />
4,112<br />
3,630<br />
1,732<br />
935<br />
4,386<br />
3,872<br />
1,847<br />
1,094<br />
5,129<br />
4,527<br />
2,160<br />
Gulu - - - - - - - - -<br />
Hoima 2,683<br />
Iganga 5,712<br />
J<strong>in</strong>ja 5,610<br />
Kabale 100,681<br />
Kabarole 5,238<br />
Kalangala 122<br />
3,204<br />
6,820<br />
6,698<br />
120,216<br />
6,254<br />
146<br />
3,685<br />
7,843<br />
7,703<br />
138,248<br />
7,192<br />
168<br />
4,025<br />
8,568<br />
8,415<br />
151,020<br />
7,856<br />
184<br />
3,184<br />
6,777<br />
6,656<br />
119,464<br />
6,215<br />
3,605<br />
7,672<br />
7,536<br />
135,242<br />
7,036<br />
3,845<br />
8,183<br />
8,038<br />
144,258<br />
7,505<br />
4,496<br />
9,569<br />
9,399<br />
168,677<br />
8,775<br />
Kampala - - - - - - - - -<br />
Kamuli 6,816<br />
Kapchorwa 6,200<br />
Kasese 5,694<br />
Kibaale 2,273<br />
Kiboga 1,637<br />
Kisoro 27,543<br />
Kitgum 96<br />
8,138<br />
7,403<br />
6,799<br />
2,714<br />
1,955<br />
32,887<br />
115<br />
9,359<br />
8,513<br />
7,819<br />
3,121<br />
2,248<br />
37,820<br />
132<br />
10,224<br />
9,299<br />
8,541<br />
3,409<br />
2,456<br />
41,314<br />
144<br />
145<br />
8,087<br />
7,356<br />
6,757<br />
2,697<br />
1,943<br />
32,681<br />
164<br />
9,155<br />
8,328<br />
7,649<br />
3,053<br />
2,199<br />
36,998<br />
175<br />
9,765<br />
8,883<br />
8,159<br />
3,257<br />
2,346<br />
39,465<br />
205<br />
11,418<br />
10,387<br />
9,540<br />
3,808<br />
2,743<br />
46,145<br />
Kotido - - - - - - - - -<br />
Kumi 5,785<br />
Lira 7,398<br />
Luw ero 9,675<br />
Masaka 8,841<br />
Mas<strong>in</strong>di 2,675<br />
Mbale 12,125<br />
Mbarara 6,050<br />
6,907<br />
8,833<br />
11,552<br />
10,556<br />
3,194<br />
14,478<br />
7,224<br />
7,943<br />
10,158<br />
13,285<br />
12,139<br />
3,673<br />
16,650<br />
8,308<br />
8,677<br />
11,096<br />
14,512<br />
13,260<br />
4,012<br />
18,188<br />
9,076<br />
114<br />
6,864<br />
8,778<br />
11,480<br />
10,490<br />
3,174<br />
14,388<br />
7,179<br />
129<br />
7,770<br />
9,937<br />
12,996<br />
11,875<br />
3,593<br />
16,288<br />
8,127<br />
138<br />
8,288<br />
10,599<br />
13,862<br />
12,667<br />
3,833<br />
17,374<br />
8,669<br />
161<br />
9,691<br />
12,394<br />
16,209<br />
14,811<br />
4,481<br />
20,315<br />
10,136<br />
Moroto - - - - - - - - -<br />
Moyo 211<br />
Mpigi 2,539<br />
Mubende 2,455<br />
Mukono 1,478<br />
Nebbi 3,037<br />
252<br />
3,032<br />
2,931<br />
1,765<br />
3,626<br />
290<br />
3,487<br />
3,371<br />
2,030<br />
4,170<br />
317<br />
3,809<br />
3,682<br />
2,218<br />
4,555<br />
251<br />
3,013<br />
2,913<br />
1,754<br />
3,603<br />
284<br />
3,411<br />
3,298<br />
1,986<br />
4,079<br />
303<br />
3,638<br />
3,518<br />
2,118<br />
4,351<br />
354<br />
4,254<br />
4,113<br />
2,477<br />
5,087<br />
Ntungamo - - - - - - - - -<br />
Pallisa 2,191<br />
Rakai 3,460<br />
Rukungiri 8,457<br />
Soroti 6,453<br />
Tororo 7,161<br />
TOTAL 268,001<br />
2,613<br />
4,131<br />
10,098<br />
7,705<br />
8,554<br />
320,000<br />
3,005<br />
4,751<br />
11,613<br />
8,861<br />
9,837<br />
368,002<br />
3,283<br />
5,190<br />
12,686<br />
9,680<br />
10,746<br />
402,000<br />
2,597<br />
4,105<br />
10,035<br />
7,657<br />
8,500<br />
318,000<br />
Production ('000 Mt) of potatoes <strong>in</strong> Uganda 1980-1992<br />
2,940<br />
4,648<br />
11,360<br />
8,668<br />
9,623<br />
360,000<br />
3,136<br />
4,958<br />
12,117<br />
9,246<br />
10,265<br />
384,000<br />
3,667<br />
5,797<br />
14,168<br />
10,811<br />
12,002<br />
449,000<br />
Year 1980 1981 1983 1984 1985 1986 1987 1988 1989 1990 1991 1992<br />
Prodn ('000 166 mt)<br />
175<br />
209<br />
132<br />
168<br />
98<br />
185<br />
190<br />
248<br />
224<br />
254<br />
1,164<br />
5,460<br />
4,820<br />
2,300<br />
4,787<br />
10,187<br />
10,006<br />
179,571<br />
9,342<br />
218<br />
12,156<br />
11,058<br />
10,156<br />
4,054<br />
2,920<br />
49,125<br />
171<br />
10,317<br />
13,194<br />
17,256<br />
15,767<br />
4,771<br />
21,627<br />
10,791<br />
377<br />
4,529<br />
4,379<br />
2,637<br />
5,416<br />
3,904<br />
6,172<br />
15,084<br />
11,509<br />
12,777<br />
478,000<br />
268
Appendix 2: Grand Seasonal Index <strong>for</strong> Potato <strong>in</strong> Kampala Calculated from Real Retail prices<br />
Jan Feb Mar Apr May Jun Jul Aug Sep Oct Nov Dec<br />
1989 154.440 156.152 138.409 103.808<br />
1990 99.635 99.833 123.524 122.992 116.360 117.998 127.772 126.203 140.827 116.328 117.086 98.111<br />
1991 99.096 84.056 91.586 93.268 107.307 88.654 97.305 103.339 106.860 108.067 94.741 88.789<br />
1992 97.275 111.215 112.520 112.076 110.847 116.171 109.123 108.546 128.059 128.361 118.953 106.696<br />
1993 96.767 100.132 89.196 106.793 100.899 104.665 96.902 113.980 97.700 100.076 103.401 83.152<br />
1994 79.296 86.837 92.517 106.732 97.384 97.553 101.481 102.589 108.173 109.827 99.350 114.106<br />
1995 112.693 114.020 121.002 102.681 111.689 122.484 115.143 113.014 125.783 123.750 134.289 114.641<br />
1996 111.685 110.010 115.476 112.930 115.826 123.873 109.805 119.056 112.986 107.609 105.335 97.359<br />
1997 102.319 106.791 115.417 120.629 123.973 119.013 112.061 108.302 110.922 118.353 118.364 95.977<br />
1998 98.753 117.422 126.798 158.626 185.235 173.584 166.745 151.508 155.409 154.956 164.826 124.555<br />
1999 121.793 118.845 136.212 137.796 132.303 205.319 82.145 104.470 105.128 97.344 90.849 75.669<br />
2000 70.757 82.941 92.981 107.338 106.481 90.522<br />
N 11 11 11 11 11 10 10 10 11 11 11 11<br />
Maximum 122 119 136 159 185 205 167 152 155 156 165 125<br />
M<strong>in</strong>imum 71 83 89 93 97 89 82 103 98 97 91 76<br />
Mean 99.10 102.92 110.66 116.53 118.94 123.62 111.85 115.10 122.39 120.07 116.87 100.26<br />
S.D 14.398 13.237 16.435 18.231 24.112 35.549 22.887 14.784 20.179 19.846 22.050 14.502<br />
Variance 207.316 175.218 270.125 332.384 581.400 1263.758 523.817 218.563 326.882 278.554 483.530 232.148<br />
t value -0.979 -0.776 -0.154 0.183 0.238 0.293 -0.059 0.129 0.456 0.347 0.167 -0.892<br />
GSI 99.10 102.92 110.66 116.53 118.94 123.62 111.85 115.10 122.39 120.07 116.87 100.26<br />
GSI +1s.d 113.496 116.156 127.093 134.764 143.049 159.171 134.735 129.885 142.569 139.921 138.923 114.763<br />
GSI -1s.d 84.699 89.682 94.222 98.301 94.824 88.072 88.961 100.317 102.211 100.229 94.823 85.758<br />
annual mean 113.190 113.190 113.190 113.190 113.190 113.190 113.190 113.190 113.190 113.190 113.190 113.190<br />
32
Annex 1: PRODUCTION REPORTS FOR UGANDA NATIONAL SEED POTATO<br />
PRODUCERS’ ASSOCIATION (UNSPPA) FOR 2000A SEASON<br />
R. Kakuhenzire and S. T<strong>in</strong>dimubona<br />
A grow<strong>in</strong>g potato crop cannot be properly managed from a desk, home or pickup truck. An effective<br />
manager is <strong>in</strong> the field often throughout the season (Randal C. Rowe, 1993).<br />
Introduction<br />
The Uganda National Seed potato Producers’ Association (UNSPPA) is a group of farmers based <strong>in</strong> Kabale<br />
and Kisoro districts with the sole aim of produc<strong>in</strong>g and distribut<strong>in</strong>g seed potato to other potato farmers <strong>in</strong><br />
the country. Dur<strong>in</strong>g this season, the association had a membership of 19 farmers, seven women and 12<br />
men. Four farmers are from Kisoro while the rest come from Kabale. There is need there<strong>for</strong>e to deliberately<br />
<strong>in</strong>crease the number of farmers <strong>in</strong> UNSPPA from Kisoro district.<br />
Seed Potato procurement and production reports<br />
Among the 19 members <strong>in</strong> UNSPPA, only 11 farmers together collected 117.5 bags (9.4Mt) of seed <strong>in</strong> this<br />
season. Eight farmers did not get seed because either they did not request <strong>for</strong> seed or they had unsettled<br />
debts with the association. These farmers are: B. Kikafunda, Fokushaba V, Rubereti E., Mwongyera A.<br />
Bifakubaho Y., Byarugaba F., Tibaijuka and G. Karibushe. Two of these farmers happen to come from<br />
Kisoro district. For the 11 members who collected seed, 10 members submitted production reports<br />
equivalent to 110.5 bags (8.84 Mt) (Table 1) while one member, Mrs R. Barisigara who collected 7 bags<br />
(0.56 Mt) did not return the production report <strong>for</strong> unexpla<strong>in</strong>ed reasons. The seed potato that is not<br />
accounted <strong>for</strong> is there<strong>for</strong>e 0.56 Mt or 7 bags. Two production reports were unsatisfactory because they did<br />
not reflect real facts on the ground; however, they were reviewed and <strong>in</strong>cluded <strong>in</strong> the analysis. Some costs<br />
were either unrealistically low or high compared to the seed procured. This could be attributed to failure<br />
either to keep proper farm records or use or quantify family labour where one uses it. These reports were<br />
from Mr. B. Gareeba and Mrs. K. Kisiizi. The rest of the farmers’ reports were adequate with Mr. S.<br />
T<strong>in</strong>dimubona submitt<strong>in</strong>g the most comprehensive production report, Mrs Kihumuro a good report while the<br />
rema<strong>in</strong><strong>in</strong>g farmers gave just satisfactory reports. The production analysis will there<strong>for</strong>e be <strong>for</strong> ten farmers<br />
who submitted reports. These members are, Be<strong>in</strong>amaryo J., Bigirimana E., Bitarabeho F., Gareeba B.,<br />
Hanyurwa F., Kanyima J., Kihumuro A., Kisiizi K., Sentaro P. and S. T<strong>in</strong>dimubona on whom analyses will<br />
be based.<br />
Seed potato Production analysis <strong>for</strong> UNSPPA <strong>in</strong> 2000A season<br />
Ten out of the 11 farmers who collected seed submitted production returns account<strong>in</strong>g <strong>for</strong> 110.5 bags or<br />
8.84Mt, 94.04% of the 117.5 bags (9.4 Mt) of seed (Table 1). The ten members produced 401 bags of<br />
which 24 were damaged <strong>in</strong> the harvest<strong>in</strong>g process (Table 1). The average multiplication rate was 3.6 per<br />
bag planted. The total capital <strong>in</strong>put <strong>for</strong> the whole group was Sh. 9,024,900/= while the production cost per<br />
bag produced was Sh. 22,506/=. The rate of produce utilization as seed was 92.5 percent (Table 1).<br />
Cost-benefit analysis <strong>for</strong> seed Potato producers <strong>in</strong> 2000A<br />
The total production capita <strong>in</strong>put cover<strong>in</strong>g seed, agro-chemicals labour and services was Sh. 9,024,900/=<br />
(Table 2). The farmers as a group made a gross profit of Sh. 12,775,000/= and a net profit of Sh.!The<br />
Formula Not In Table/= which was 41.6% of the <strong>in</strong>vested capital. Individual net returns were all below<br />
100% compared to the previous seasons. Two farmers, Bigirimana E, and Hanyurwa F. made losses and<br />
were unable to recover their capital (Table 2). In a period of six moths, the group earned Sh. 62,5016/=<br />
per month, exclud<strong>in</strong>g members who made losses (Table 2) because profits are made on <strong>in</strong>dividual level and<br />
are not shared. This was low compared to the previous seasons. This was partly due to the fall <strong>in</strong> the price<br />
of seed Potato and the low productivity per bag planted. To offset the low seed potato prices, average yields<br />
per unit planted should be improved. This can be achieved by <strong>in</strong>creas<strong>in</strong>g <strong>in</strong>put <strong>in</strong> agrochemicals and<br />
improv<strong>in</strong>g the management practices. One of the members (Hanyurwa F.) who made a loss was a result of<br />
late plant<strong>in</strong>g despite early seed delivery.<br />
33
Table 1: Production analysis <strong>for</strong> seed potato producers <strong>in</strong> the first season of 2000 A<br />
Name Bags<br />
planted<br />
Bags<br />
harvested<br />
Bags<br />
damaged<br />
34<br />
Bags kept as<br />
seed<br />
Multiplica<br />
tion rate<br />
Capital<br />
<strong>in</strong>put<br />
Production cost<br />
per bag<br />
Be<strong>in</strong>amaryo J. 14 40 2 37 2.9 95.9 23675 92.5<br />
Bigirimana E. 5 15 0 11 3.0 34 29440 73.3<br />
Bitarabeho F. 15 50 1 49 3.3 118.3 20508 98.0<br />
Gareeba B. 6 18 4 14 3.0 45 20555 77.0<br />
Hanyurwa F. 10 20 1 19 2.0 52 18500 95.0<br />
Kanyima J 15 77 3 74 5.1 174.1 15820 96.1<br />
Kihumuro A. 9 30 4 26 3.3 72.3 22767 86.7<br />
Kisiizi K. 8 42 2 39 5.3 96.3 13905 79.6<br />
Sentaro P. 14 45 5 40 3.2 107.2 29178 88.9<br />
T<strong>in</strong>dimubona 14.5 64 2 62 4.4 146.9 27573 96.9<br />
Total 110.5 401 24 371 3.6 942 22506 92.5<br />
The s<strong>in</strong>gle most expensive <strong>in</strong>put <strong>in</strong> the production process was seed compris<strong>in</strong>g 54.24% of the <strong>in</strong>vested<br />
capital (Table 3). Labour took 26.04% while the pesticides, fertilizers, and transport each took less than 7%<br />
of the capital <strong>in</strong>vestment (Table 3). The cost of seed is unproportionately high and should be reviewed <strong>in</strong><br />
the present circumstances.<br />
Seed potato distribution by seed producers <strong>in</strong> 2000A<br />
The members who produced seed <strong>in</strong> 2000A season supplied seed to 43 entities cover<strong>in</strong>g 30 locations. These<br />
appear low figures but there were bulk supplies to local governments <strong>in</strong> Kabale, Mbarara, Mubende and<br />
Kapchorwa districts. Thus, on <strong>in</strong>dividual level, there was more spread distributions done by the district<br />
extension services which <strong>in</strong><strong>for</strong>mation cannot be accessed by UNSPPA.<br />
Table 2: Cost-benefit analysis <strong>for</strong> seed potato producers <strong>in</strong> the first of 2000 (2000A)<br />
Name Bags<br />
planted<br />
Gross return<br />
(Shs)<br />
Capital <strong>in</strong>put<br />
(Shs)<br />
Net Profit<br />
(Shs)<br />
Profit per<br />
month over 6<br />
months (Shs)<br />
Percent net<br />
profit (%)<br />
Be<strong>in</strong>amaryo J 14 1480000 1480014 533000 88833 56.3<br />
Bigirimana E. 5 440000 440005 -1600 0 -0.36<br />
Bitarabeho F. 15 1470000 1470015 444600 74100 16.7<br />
Gareeba B. 6 490000 490006 120000 20000 32.4<br />
Hanyurwa F. 10 490000 490010 -188000 0 -27.7<br />
Kanyima J 15 2220000 2220015 1001800 166966 82.2<br />
Kihumuro A. 9 1040000 1040009 357000 59500 52.3<br />
Kisiizi K. 8 1065000 1065008 481000 80166 82.4<br />
Sentaro P. 14 1600000 1600014 287000 47833 21.9<br />
T<strong>in</strong>dimubona 14.5 2480000 2480014.5 715300 119216 40.5<br />
Total 110.5 12775000 12775110.<br />
5<br />
3750100 625016 41.6<br />
Table 3: Itemised production <strong>in</strong>put <strong>for</strong> seed producers (UNSPPA) <strong>in</strong> 2000A season.<br />
Item Total<br />
(Shs)<br />
cost Percent (%)<br />
Labour 2349800 26.04<br />
Seed 4895000 54.24<br />
Pesticides 602000 6.67<br />
Fertilizers 617000 6.84<br />
Percent<br />
utilization as<br />
seed
Transport 394700 4.37<br />
Empty bags 166400 1.84<br />
Total 9024900 100.0<br />
Table 4: Seed potato distribution by UNSPPA <strong>in</strong> 2000A season<br />
Seed producer Number of Number<br />
beneficiaries of villages<br />
Be<strong>in</strong>amaryo J. 5 4<br />
Bigirimana E. 3 2<br />
Bitarabeho F. 0 0<br />
Gareeba B. 1 1<br />
Hanyurwa F. 0 0<br />
Kanyima J 7 3<br />
Kihumuro A. 9 6<br />
Kisiizi K. 9 5<br />
Sentaro P. 2 2<br />
T<strong>in</strong>dimubona 7 7<br />
Total 43 30<br />
Conclusion and recommendations<br />
The average net return (41.6%) was low compared to the previous season. This was attributed to the low<br />
seed Potato prices and the low productivity per unit planted. Low productivity was caused by drought <strong>in</strong><br />
few cases as sited by some farmers while <strong>in</strong> some cases, there was heavy ra<strong>in</strong> and the farmers had not taken<br />
measures to effectively control late blight. Farmers who were affected by drought delayed to plant <strong>in</strong><br />
comparison to when seed was delivered. The low return on <strong>in</strong>vestment was also caused by the high cost of<br />
seed, which comprised more than 50% of the production <strong>in</strong>put. To improve average returns, there is need to<br />
<strong>in</strong>crease productivity and have the price the seed potato reviewed. There was more national coverage than<br />
previously because of publicity and bulk purchases by district local governments and non-governmental<br />
organisations. Members who fail to submit production reports negatively affected the per<strong>for</strong>mance of the<br />
association. It is important that the chairman of the group should ensure that all members hand-<strong>in</strong> reports as<br />
agreed <strong>in</strong> the by-laws otherwise this practice spoils the production level and the image of the group.<br />
35
Appendix 1: Ware potato growers who benefited from the <strong>in</strong><strong>for</strong>mal seed system run by UNSPPA<br />
members.<br />
Seed producer Number of Names of Village/sub- Number of<br />
beneficiaries beneficiaries county villages<br />
Be<strong>in</strong>amaryo J 5 LCV Kabale Various Various<br />
H.Land Hotel Rukungiri<br />
Kaguta D. Kabale M.C. Makanga<br />
Kweyamba H. Kaharo Kaharo<br />
Self Kaharo Kaharo<br />
Bigirimana (Mrs) 3 Buchana (Mrs) Kisoro Town KTC<br />
Mr. Bigirimana Karumena T.C Nyakabande<br />
Self Kibaya Nyakabande<br />
Bitarabeho F. 0 0 0 0<br />
Gareeba B. 1 LC3 Buhara Buhara Buhara<br />
Hanyurwa F. 0 0 0 0<br />
Kanyima J. 7 Byabagambi W. Kakumiro Mubende<br />
T<strong>in</strong>dimubona Kashambya Kitunga<br />
Mugisha S Ndorwa Ndorwa<br />
Kataryeba Ndorwa Ndorwa<br />
Byaba (Mrs) Kamuganguzi Ndorwa<br />
T<strong>in</strong>dimwebwa Kamuganguzi Ndorwa<br />
Kihumuro A. 9 Ibumba W.G. Rwamucucu Ibumba<br />
Kazahura (Mrs) Buk<strong>in</strong>da Wacebe<br />
John Rwamucucu Nozi<br />
Maheru Cell Rwamucucu Maheru<br />
Mbabazi P. Kaharo Kaharo<br />
Bamanya Kabale M.C. Central<br />
Amos Rwamucucu Rwamucucu<br />
Rukashanga Rwamucucu Rwamucucu<br />
(Rev)<br />
Kihumuro (Mr) Rwamucucu Maheru<br />
Kisiizi K. 9 T<strong>in</strong>dimubona Kashambya Kitunga<br />
Muyebe man Muyebe Muyebe<br />
Kasimbazi J. Kabale MC Central<br />
Kwesiga Buk<strong>in</strong>da Buk<strong>in</strong>da<br />
Kashaija Mrs. Buk<strong>in</strong>da Buk<strong>in</strong>da<br />
Kabahima Mrs Buk<strong>in</strong>da Buk<strong>in</strong>da<br />
Tibikumbya Mrs. Kamwezi Kamwezi<br />
Kissizi K. Buk<strong>in</strong>da Buk<strong>in</strong>da<br />
Sentaro P. 2 Mbarara LC V Mbarara Mbarara<br />
Ntungamo LCV Ntungamo Ntungamo<br />
T<strong>in</strong>dimubona S. 7 Bandaganire G. Kashambya Kitunga<br />
Betonde Kashambya Kashambya<br />
NARO - TTP Bubale Nyamiyaga<br />
LCV Kabale Kabale Kabale<br />
Kanzikwera Mpigi Namulonge<br />
Mateeka B. Muko Kalengyere<br />
T<strong>in</strong>dimubona S. Kashambya Kitunga<br />
36
Name Bags<br />
plted<br />
Appendix 2: Seed potato production costs by members of Uganda National Seed Potato Producers<br />
Association (UNSPPA) <strong>in</strong> 2000A<br />
Cost of<br />
seed<br />
Land<br />
prep<br />
Plant<strong>in</strong><br />
g<br />
Weed<strong>in</strong>g Spray<strong>in</strong>g Dehaua<br />
lm<strong>in</strong>g<br />
37<br />
Fertiliser Pesticides Guard<strong>in</strong>g Harvest<br />
<strong>in</strong>g<br />
Be<strong>in</strong>amaryo 14 700000 40000 12000 12000 27000 0 40000 36000 0 60000 20000 0<br />
Bigirimana 5 250000 79000 22600 25000 5000 0 0 20000 15000 20000 5000 0<br />
Bitarabeho 15 750000 67000 14000 12000 10000 3000 60000 57000 5000 10000 21400 16000<br />
Gareeba B. 6 300000 30000 5000 10000 3000 1000 0 13000 0 3000 0 5000<br />
Hanyurwa F. 10 500000 50000 9000 3000 2500 1000 35000 34000 0 12000 0 31500<br />
Kanyima J 15 750000 65000 20000 10000 24000 10000 120000 122000 30000 8000 37000 22200<br />
Kihumuro A. 9 450000 75000 20000 8000 5000 5000 32000 18000 20000 20000 15000 15000<br />
Kisiizi K. 8 400000 45000 15000 1300 0 10000 3000 40000 20000 0 20000 18000 0<br />
Sentaro P. 14 700000 165000 66000 40000 20000 5000 110000 72000 30000 56000 25000 24000<br />
T<strong>in</strong>dimubona 14.5 725000 179000 54000 25000 56700 10000 180000 210000 3000 16000 25000 281000<br />
Sub-total 110.5 5525000 795000 237600 66300 163200 38000 617000 602000 103000 225000 166400 394700<br />
Empty<br />
bags<br />
Transp<br />
ort
Conclusions and Recommendations<br />
There is grow<strong>in</strong>g commercial orientation of potato production <strong>in</strong> highland areas (Kabale, Kisoro,<br />
Mbale and Kapchorwa) that were predom<strong>in</strong>antly grow<strong>in</strong>g the crop <strong>for</strong> home consumption. But variable<br />
climatic conditions, small plots of land and high costs of <strong>in</strong>puts have limited potato yields, thereby<br />
limit<strong>in</strong>g the profits of small-scale producers.<br />
A comb<strong>in</strong>ation of a new, high yield<strong>in</strong>g and adaptable variety (Victoria) and rapidly expand<strong>in</strong>g demand<br />
<strong>in</strong> Kampala has attracted a number of districts <strong>for</strong>merly not cultivat<strong>in</strong>g potatoes to undertake potato<br />
farm<strong>in</strong>g as a cash crop hence an <strong>in</strong>crease <strong>in</strong> supply.<br />
Increas<strong>in</strong>g demand matched by <strong>in</strong>creas<strong>in</strong>g supply from new areas of production has led to a near<br />
constant real price of potatoes <strong>in</strong> Uganda. Farmers receive 26.7% as farm-gate price of the f<strong>in</strong>al retail<br />
price, travell<strong>in</strong>g traders get a net marg<strong>in</strong> of 16.7%, wholesalers get 8% and retailers get about 12.3% of<br />
the f<strong>in</strong>al price. Over 36% of the price goes <strong>in</strong>to the market<strong>in</strong>g transaction costs. Brokers charge high<br />
commissions <strong>for</strong> their services while the travell<strong>in</strong>g traders appear to earn high marg<strong>in</strong>s from trad<strong>in</strong>g to<br />
compensate <strong>for</strong> the risks <strong>in</strong> the potato bus<strong>in</strong>ess. Elim<strong>in</strong>at<strong>in</strong>g brokers reduces transaction costs by more<br />
than 6% and improves earn<strong>in</strong>gs of the ma<strong>in</strong> market participants.<br />
The demand <strong>for</strong> chips and fries is <strong>in</strong>creas<strong>in</strong>g <strong>in</strong> Uganda. Efficient production of quality chips and fries<br />
require use specific potato varieties as evidenced by Nandos and Steers fast food outlets that are<br />
import<strong>in</strong>g potatoes from South Africa. There<strong>for</strong>e there is need <strong>for</strong> local companies that require specific<br />
varieties of potatoes to encourage local farmers by giv<strong>in</strong>g them the basic seed to cultivate such varieties<br />
under contractual farm<strong>in</strong>g arrangement.<br />
Traders from Uganda only buy potatoes from <strong>Rwanda</strong> when there is scarcity of supply locally. The<br />
traders sell <strong>Rwanda</strong>n potatoes disguised as a local variety from Kabale. There<strong>for</strong>e <strong>for</strong> <strong>Rwanda</strong> to<br />
efficiently break <strong>in</strong> Uganda’s potato market, it is imperative that an agent be established <strong>in</strong> Uganda<br />
who will import and sell potatoes exclusively from <strong>Rwanda</strong>.<br />
If <strong>Rwanda</strong> is <strong>in</strong>terested to get a niche of the Uganda potato market, it is important <strong>for</strong> <strong>Rwanda</strong> to<br />
identify and produce quality varieties that are highly demanded <strong>in</strong> Uganda such as Uganda Rutuku 11<br />
and Victoria. S<strong>in</strong>ce these varieties per<strong>for</strong>m well <strong>in</strong> Kabale and Kisoro, it is certa<strong>in</strong> they do well <strong>in</strong> the<br />
<strong>Rwanda</strong>.
The Potato production and market<strong>in</strong>g <strong>in</strong> Kenya and the<br />
market<strong>in</strong>g Potential <strong>for</strong> <strong>Rwanda</strong><br />
Draft Report<br />
Okoboi Geofrey<br />
International Institute of Tropical Agriculture<br />
October 2001<br />
1
Table of contents<br />
REPORT SUMMARY ..................................................................................................................... 3<br />
POTATO PRODUCTION IN KENYA............................................................................................ 4<br />
FIGURE 1: TREND OF PRODUCTION (‘000 MT), 1961-2000 .................................................... 4<br />
FIGURE 2: TREND OF POTATO YIELDS IN KENYA: 1961-2000............................................. 5<br />
POTATO VARIETIES .................................................................................................................... 5<br />
TABLE 1: MAJOR POTATO VARIETIES GROWN IN KENYA ................................................ 5<br />
TABLE 2: OTHER IMPORTANT VARIETIES BY LOCATION................................................. 6<br />
POTATO MARKETING IN KENYA ............................................................................................. 1<br />
FIGURE 2: KENYA IRISH POTATO SUB SECTOR MARKET CHAIN.................................... 1<br />
POTATO WHOLESALE MARKET IN NAIROBI........................................................................ 3<br />
POTATO PRICES AND TRANSACTION COSTS. ....................................................................... 3<br />
TABLE 3: PRICE AND ASSOCIATED MARKETING COSTS FOR POTATOES IN NAIROBI<br />
MARKETS ....................................................................................................................................... 4<br />
IMPORTS AND EXPORTS............................................................................................................. 4<br />
2
Report summary<br />
• Potato production <strong>in</strong> Kenya that deteriorated due to drought is now <strong>in</strong>creas<strong>in</strong>g but<br />
has not atta<strong>in</strong>ed the pre-drought production levels<br />
• Potato production yields have also cont<strong>in</strong>uously decreased over time from<br />
7.6Mt/Ha <strong>in</strong> 1975 to 4Mt/Ha <strong>in</strong> 2000.<br />
• Potato market<strong>in</strong>g <strong>in</strong> Kenya is dom<strong>in</strong>ated by well organised travell<strong>in</strong>g traders.<br />
• Potato market <strong>in</strong> Nairobi is competitive where prices are determ<strong>in</strong>ed by demand<br />
and supply, and quality difference while <strong>in</strong> the production areas, travell<strong>in</strong>g traders<br />
fix prices.<br />
• Chips and crisps are the pr<strong>in</strong>cipal products from potatoes that are highly<br />
consumed <strong>in</strong> Kenya’s urban areas.<br />
• A number of small-scale <strong>in</strong>dustries process potatoes <strong>in</strong>to snacks<br />
• Kenya imports potatoes from Tanzania to supplement local production<br />
3
Potato production <strong>in</strong> Kenya<br />
Most of the potato production <strong>in</strong> Kenya occurs <strong>in</strong> the highlands of central, eastern and<br />
rift valley districts <strong>in</strong> the Mau Range, Aberdare Range and the slopes of Mt. Kenya,<br />
Maps 1a & b. Other highlands such as Mt. Elgon <strong>in</strong> the western prov<strong>in</strong>ce and Taita<br />
Tabeta <strong>in</strong> the southern border region with Tanzania have also started grow<strong>in</strong>g potatoes<br />
on commercial basis. There<strong>for</strong>e the ma<strong>in</strong> districts grow<strong>in</strong>g potatoes <strong>in</strong>clude; Meru,<br />
Kiambu, Nakuru, Kiisi, Nyandarua, Transi-Nzoia, Laikipia and Uas<strong>in</strong> Gishu.<br />
Over 70% of potato output is said to come from highlands <strong>in</strong> Map 1a of altitude of<br />
2,100m and above. It is <strong>in</strong> areas above 2,100m that Research stations and NGOs have<br />
also encouraged grow<strong>in</strong>g of potatoes <strong>for</strong> seed.<br />
FAO statistics <strong>in</strong>dicate that from 1961, production had steadily <strong>in</strong>creased till 1980<br />
when it fell back to levels of 1961, Figure 1. The output rose aga<strong>in</strong> sharply reach<strong>in</strong>g<br />
500,000 metric tonnes be<strong>for</strong>e plung<strong>in</strong>g back to 200,000 Mt <strong>in</strong> 1984. After various<br />
years of unstable production, output has aga<strong>in</strong> steadily <strong>in</strong>creased s<strong>in</strong>ce 1995; however,<br />
it is yet reach the volume atta<strong>in</strong>ed <strong>in</strong> 1996 (499,000 Mt).<br />
Figure 1: Trend of production (‘000 Mt), 1961-2000<br />
output (Mt)<br />
600<br />
500<br />
400<br />
300<br />
200<br />
100<br />
0<br />
1961<br />
1964<br />
prodn (mt)<br />
L<strong>in</strong>ear (prodn (mt))<br />
1967<br />
1970<br />
Source: FAO 1990-1998<br />
1973<br />
1976<br />
1979<br />
It should be noted that FAO statistics are estimates that may differ from other<br />
statistical sources such as country governments’ publications.<br />
J.N. Kabira, the director of National Potato Research Centre-Tigoni (Kenya) whom<br />
we <strong>in</strong>terviewed contended that the dramatic drop <strong>in</strong> output <strong>in</strong> 1980 and 984 and was<br />
caused by drought that greatly devastated the output of potatoes <strong>in</strong> Kenya and s<strong>in</strong>ce<br />
then production has never recovered to the level of 1986 (~0.5 million Mt).<br />
4<br />
1982<br />
Years<br />
1985<br />
1988<br />
1991<br />
y = 3.3082x + 200<br />
1994<br />
1997<br />
2000
Figure 2: Trend of Potato Yields <strong>in</strong> Kenya: 1961-2000<br />
Mt/Ha<br />
10<br />
8<br />
6<br />
4<br />
2<br />
0<br />
Source: FAO 1990-1998<br />
Despite the <strong>in</strong>creased area (hectares) of cultivation under potatoes, potato production<br />
yields <strong>in</strong> Kenya cont<strong>in</strong>uously deteriorated s<strong>in</strong>ce 1980 when the country experienced<br />
prolonged drought. Kenya atta<strong>in</strong>ed the highest yields (7.6 Mt/Ha) of potato<br />
production <strong>in</strong> 1979 when it produced 0.36 million Mt under 48,000 Ha of cultivation.<br />
However, <strong>in</strong> 1984, the yields were below 3 Mt/Ha, and s<strong>in</strong>ce then till year 2000 yields<br />
have averaged to 4 Mt/Ha.<br />
This trend <strong>in</strong>dicates that potato yields <strong>in</strong> Kenya have been fall<strong>in</strong>g at rate of 11% per<br />
year. Apart from the adverse weather conditions that have affected yields, J.N Kabira<br />
blamed the poor yields on low soil fertility due bad soil management practices hence<br />
the urgent need <strong>for</strong> farmers to use fertilizers and clean potato seed to improve their<br />
yields aga<strong>in</strong><br />
Potato varieties<br />
yield<br />
L<strong>in</strong>ear (yield)<br />
Potato varieties of major economic importance <strong>in</strong> Kenya are listed <strong>in</strong> the table 1.<br />
There are also many other varieties that are location specific because of the qualities<br />
that the natives <strong>in</strong> such localities identify <strong>in</strong> the variety, table 2.<br />
Table 1: Major potato varieties grown <strong>in</strong> Kenya<br />
Name Strength Weakness Trend of prodn<br />
Nyayo Early maturity<br />
excellent <strong>for</strong> chips<br />
Suscep. LB, BW Down<br />
Kerr’s P<strong>in</strong>k Excellent <strong>for</strong> crisps<br />
Premium price<br />
Suscep. LB, virus Down<br />
Desiree Good taste Low demand Down<br />
Mukori LB tolerant Late maturity Up<br />
Ngure LB tolerant No seed Up<br />
Tigoni LB tolerant Green<strong>in</strong>g, BW suscep Up<br />
Tana Kimande High yield Late maturity Up<br />
5<br />
y = -0.1121x + 8.1026<br />
1961<br />
1964<br />
1967<br />
1970<br />
1973<br />
1976<br />
1979<br />
1982<br />
1985<br />
1988<br />
1991<br />
1994<br />
1997<br />
2000<br />
years
Table 2: Other important varieties by Location<br />
Name Major prod zone Strength Weakness Trend<br />
Roslyn Tana S K<strong>in</strong>angop Chips, LB Resist Decl<strong>in</strong><strong>in</strong>g yield Down<br />
Kihoro S K<strong>in</strong>angop LB Resist Late maturity Flat<br />
New Desiree S K<strong>in</strong>angop Home use LB Suscep Down<br />
Asante Laikipia LB Resist No seed Up<br />
Furaha Laikipia LB Resist Poor cook quality Up<br />
Anett Laikipia Early mature Poor cook quality Down<br />
Tiga-niwe Mau Narok LB Resist Virus suscep Up<br />
Munyaka Mau Narok High yield Hollow heart Up<br />
Comesha Oll Kalou High yield Poor storage Up<br />
Dutch Robyjn Molo Market, crisps LB Suscep Flat<br />
Romano Central Storability Low demand Flat<br />
Source: NPRC-Tigoni, 2001<br />
Farmers we <strong>in</strong>terviewed <strong>in</strong> Tigoni, near Tigoni National potato Research Centre<br />
(NPRC) were of the view that Nyayo and Asante are currently the most popular high<br />
yield<strong>in</strong>g varieties grown by farmers <strong>in</strong> their prov<strong>in</strong>ce. However J.N. Kabira, the<br />
director of NPRC-Tigoni revealed that these varieties popular because the are high<br />
yield<strong>in</strong>g (100-130 bags/Ha), early matur<strong>in</strong>g especially Nyayo, somewhat tolerant to<br />
late blight (LB) and the market potential is good. Asante is a variety similar to<br />
Victoria <strong>in</strong> Uganda good <strong>for</strong> mak<strong>in</strong>g chips but Nyayo and Rosl<strong>in</strong> Tana are considered<br />
excellent <strong>for</strong> chips because of their oblong tubers.<br />
Kerr’s p<strong>in</strong>k and Dutch Robyjn varieties are a highly recognised <strong>for</strong> mak<strong>in</strong>g of crisps<br />
and as such farmers of these varieties receive a premium price from processors <strong>for</strong> the<br />
rapidly grow<strong>in</strong>g crisps market.<br />
6
Potato market<strong>in</strong>g <strong>in</strong> Kenya<br />
Although women dom<strong>in</strong>ate potato cultivation <strong>in</strong> Kenya, men ma<strong>in</strong>ly handle the<br />
market<strong>in</strong>g beyond the farm-gate. Potato market<strong>in</strong>g <strong>in</strong> Kenya is also follows the<br />
seasonal supply pattern brought about by varied weather patterns <strong>in</strong> the prov<strong>in</strong>ces.<br />
The cha<strong>in</strong> of potato trade is illustrated <strong>in</strong> figure 2. The pr<strong>in</strong>ciple player <strong>in</strong> Kenya<br />
potato trade is the travell<strong>in</strong>g trader who moves supplies from the production area to<br />
the market <strong>in</strong> Nairobi.<br />
Figure 2: Kenya Irish potato sub sector market cha<strong>in</strong><br />
Rural brokers<br />
(Pack, sew, load)<br />
Framers (producers)<br />
(Producers)<br />
Village traders<br />
(Assemblers)<br />
Urban Brokers<br />
Wholesalers<br />
Urban retailers<br />
Key<br />
Fresh potatoes<br />
Chips<br />
Consumers<br />
Rural<br />
retailers<br />
Rural consumers<br />
Processors (hotels, Rest,<br />
Schools)<br />
Retail shops,<br />
supermarkets
Producers: Farmers from the highlands (Map 1) are the major producers of potatoes<br />
both <strong>for</strong> food and sell. Farmers <strong>in</strong> the eastern (Meru, Embu, Machakos) and Rift<br />
valley (Nakuru, Narok, Laikipia, Kajiado etc.) prov<strong>in</strong>ces that are near Nairobi have<br />
gone commercial as over 60% of their potato output is sold. In Nairobi wholesale<br />
markets, potatoes from Meru are dist<strong>in</strong>ct and sell fast. Farmers ma<strong>in</strong>ly sell their<br />
potatoes directly to travell<strong>in</strong>g traders through village brokers. However, a few farmers<br />
do sell to rural assemblers or directly supply <strong>in</strong>stitutions such as hotels, schools and of<br />
recent, process<strong>in</strong>g plants that require potatoes of a specific quality.<br />
Rural brokers: rural brokers are commission agents who mostly work <strong>for</strong> travell<strong>in</strong>g<br />
traders to identify sources of supply. S<strong>in</strong>ce they contact the farmers to get them<br />
buyers, the brokers also sometimes get a commission from the farmers or from the<br />
transaction difference betweens the farmers and traders offer prices. Brokers are<br />
common market participants <strong>in</strong> the potato market<strong>in</strong>g cha<strong>in</strong> unlike <strong>in</strong> cereal trade. The<br />
reason relates to the perishability and storability of potatoes compared to gra<strong>in</strong>s.<br />
Travell<strong>in</strong>g traders/transporters: Travell<strong>in</strong>g traders are highly organised <strong>in</strong> Kenya<br />
especially those from Nairobi. Dur<strong>in</strong>g the fieldwork <strong>for</strong> this study, farmers<br />
<strong>in</strong>terviewed said that traders from Nairobi are so <strong>in</strong>fluential to the extent that they<br />
impose the buy<strong>in</strong>g price with little barga<strong>in</strong> from the farmers. Joseph Muranga, a<br />
member of Nairobi Irish potato traders and transporters, an <strong>in</strong><strong>for</strong>mal but highly<br />
organised group <strong>in</strong> Wakulima market <strong>in</strong><strong>for</strong>med this study group that their group meets<br />
every day after close of the day’s bus<strong>in</strong>ess to review the day’s activities and to plan<br />
their course of action <strong>for</strong> the next day. In their meet<strong>in</strong>gs, among other issues, they<br />
agree on the price they are to pay the farmers <strong>for</strong> a given variety of potatoes and<br />
allocate the Location or Sub-location 1 member will go to buy from.<br />
In Nairobi potato markets, <strong>in</strong>tra-regional/travell<strong>in</strong>g traders sell potatoes to well<br />
established permanent wholesalers through brokers. By Midday all the tonnes of<br />
potatoes are sold out. Travell<strong>in</strong>g traders br<strong>in</strong>g<strong>in</strong>g supplies from any given district<br />
with<strong>in</strong> Kenya to Nairobi are conveniently referred to as <strong>in</strong>tra-regional traders <strong>in</strong> this<br />
study because there is another category of travell<strong>in</strong>g traders whom we have called<br />
<strong>in</strong>ter-regional traders who supply potatoes from Tanzania to Nairobi market. <strong>in</strong>terregional<br />
traders use 40 feet trailer truck to br<strong>in</strong>g potatoes from Arusha to Nairobi. The<br />
traders normally hire trucks from the drivers return<strong>in</strong>g after deliver<strong>in</strong>g merchandise<br />
from Nairobi to Tanzania.<br />
Wholesalers: Wholesalers <strong>in</strong> Kenya operate at two levels. There are resident market<br />
wholesalers who get stock directly from travell<strong>in</strong>g traders and sell it <strong>in</strong> the same <strong>for</strong>m<br />
(no sort<strong>in</strong>g, repack<strong>in</strong>g) to secondary wholesalers who may come from other markets.<br />
Secondary wholesalers add value to the product by sort<strong>in</strong>g, grad<strong>in</strong>g and repack<strong>in</strong>g<br />
<strong>in</strong>to appropriate units of 50 kg bags. Travell<strong>in</strong>g traders br<strong>in</strong>g potatoes from farmers <strong>in</strong><br />
any size of bags rang<strong>in</strong>g from 100-150kgs. Wholesalers generally sell retailers and<br />
processors but secondary wholesalers can also sell to consumers.<br />
1 A Location is equivalent to a County and a Sub-location to Sub-county.<br />
2
Processors: Kenya’s fast expand<strong>in</strong>g cities have greatly <strong>in</strong>creased the demand <strong>for</strong><br />
chips and crisps. All streets <strong>in</strong> Nairobi are l<strong>in</strong>ed with all k<strong>in</strong>ds of fast food restaurants<br />
serv<strong>in</strong>g chips as a pr<strong>in</strong>cipal product. Small-scale food process<strong>in</strong>g <strong>in</strong>dustries have<br />
sprung up from all corners of Nairobi to process potatoes <strong>in</strong>to crisps. An <strong>in</strong>terview<br />
with Jerry a small-scale food processor <strong>in</strong> East Lands, a suburb of Nairobi declared<br />
that the market <strong>for</strong> French fries (chips) and crisps is there, the raw materials are<br />
abundant and <strong>in</strong>dustry is boom<strong>in</strong>g. A visitor of Nairobi, the researcher also found<br />
chips and fries as the most convenient k<strong>in</strong>d of food available <strong>for</strong> average <strong>in</strong>come<br />
tourists and urban dwellers. Processors of crisps sell their products through<br />
supermarkets that are now common <strong>in</strong> all towns of Kenya. Surveys on the shelves of<br />
various supermarkets revealed more than ten different companies process<strong>in</strong>g crisps.<br />
Dur<strong>in</strong>g the fieldwork, Nandos and Steers, South African based fast food giants were<br />
found <strong>in</strong> Nairobi, Nakuru and Eldoret. This further attests to <strong>in</strong>creased demand <strong>for</strong><br />
chips by the urban population <strong>in</strong> Kenya. This study group was <strong>in</strong><strong>for</strong>med that <strong>in</strong> the rift<br />
valley prov<strong>in</strong>ce <strong>in</strong> Narok district, an entrepreneur had set up a factory to process<br />
potatoes <strong>in</strong>to frozen French fries to supply the <strong>in</strong>creas<strong>in</strong>g demand <strong>in</strong> Nairobi and <strong>for</strong><br />
export.<br />
To compete favourably <strong>in</strong> saturated market, crisps processors have to be steady on<br />
quality. Good quality chips and crisps require specific potato varieties. Most of these<br />
varieties (Nyayo, Kerr’s p<strong>in</strong>k and Dutch Robyj<strong>in</strong>) are susceptible to Late Blight (LB)<br />
hence their output is low and sell at premium price.<br />
Consumers: our <strong>in</strong><strong>for</strong>mal survey <strong>in</strong> Nairobi found out that young work<strong>in</strong>g people<br />
ranked chips over all other types of food. Dur<strong>in</strong>g lunchtime consumers practically<br />
queue <strong>in</strong> most restaurants to get services. The reason is that chips are the cheapest and<br />
most convenient food <strong>in</strong> Nairobi.<br />
Potato crisps also popular <strong>in</strong> Kenya and attract a sizeable demand from the young<br />
population.<br />
Potato wholesale market <strong>in</strong> Nairobi<br />
There are three major wholesale markets <strong>in</strong> Nairobi. These are Wakulima market,<br />
Agakhan market and Karenget market.<br />
Of the three, Wakulima (Farmers) market that lies with<strong>in</strong> the bus<strong>in</strong>ess centre is the<br />
busiest of all. It attracts suppliers from almost potato production prov<strong>in</strong>ces <strong>in</strong> the<br />
country. Wakulima market is a specialised food market open<strong>in</strong>g as early 5AM and<br />
closes midday. All potato imports from Tanzania are sold <strong>in</strong> this market. This market<br />
also serves as a distribution centre to other wholesale markets and distant towns <strong>in</strong> the<br />
coastal prov<strong>in</strong>ce such as Mombasa and Mal<strong>in</strong>di.<br />
Potato prices and transaction costs.<br />
Our survey of potato market<strong>in</strong>g <strong>in</strong> Kenya was not exhaustive due to the time factor.<br />
There<strong>for</strong>e it was not possible to gather all the prices and transaction costs along the<br />
trad<strong>in</strong>g cha<strong>in</strong>. Potato prices <strong>in</strong> Kenya also vary significantly accord<strong>in</strong>g to season<br />
(supply and demand). In the market, potato prices also varied accord<strong>in</strong>g to the quality<br />
(sort<strong>in</strong>g, grad<strong>in</strong>g, repack<strong>in</strong>g) and variety. In Wakulima and Aga-khan markets,<br />
3
varieties known <strong>for</strong> mak<strong>in</strong>g quality crisps (Dutch Robyj<strong>in</strong> and Kerr’s p<strong>in</strong>k) sold at a<br />
higher (premium) price than those <strong>for</strong> chips (Nyayo, Asante,Tigoni).<br />
Table 3: Price and associated market<strong>in</strong>g costs <strong>for</strong> potatoes <strong>in</strong> Nairobi markets<br />
Variety Wholesale price Kshs. Unit<br />
Dutch Robyj<strong>in</strong> and Kerr’s 1,400/= when plenty 1 bag ~ 130-150kg<br />
p<strong>in</strong>k<br />
1,600/= when scarce<br />
Nyayo, Asante,Tigon 1,200/= when plenty<br />
1,300/= when scarce<br />
1 bag ~ 130-150kg<br />
Retail price Kshs<br />
Dutch Robyj<strong>in</strong> and Kerr’s<br />
p<strong>in</strong>k<br />
250/= 15-17kg packs<br />
Nyayo, Asante,Tigon 200/= 15-17kg packs<br />
<strong>Market<strong>in</strong>g</strong> costs K shs<br />
300-400/= per bag Molo/meru-Nairobi<br />
Transport costs<br />
markets<br />
600/= per bag Nairobi-Mombasa<br />
Market fees 100/= 1 bag ~ 130-150kg<br />
Off-load<strong>in</strong>g and carry 40-50/= 1 bag ~ 130-150kg<br />
Imports and Exports<br />
Through out our study, we did not get any <strong>in</strong><strong>for</strong>mation <strong>in</strong>dicat<strong>in</strong>g potato exports from<br />
Kenya to other countries <strong>in</strong> the region. Dur<strong>in</strong>g fieldwork <strong>in</strong> Wakulima market, we got<br />
a trailer offload<strong>in</strong>g potatoes from Tanzania. The traders <strong>in</strong> the market estimated that<br />
about 10 trucks offload 40 feet trailer loads of potatoes weekly from Tanzania.<br />
Traders from Nairobi travel to Arusha by bus, buy potatoes through their contacts<br />
then hire trailers return<strong>in</strong>g to Nairobi after deliver<strong>in</strong>g merchandise to transport<br />
potatoes at subsidized fares.<br />
This <strong>in</strong>dicates that either there is a potato deficit <strong>in</strong> Nairobi market from local supply<br />
due to high demand and can only be supplemented <strong>for</strong> imports or the cost of<br />
production and transportation of potatoes from Tanzania is low and the quality is<br />
good to allow <strong>for</strong> favourable competition <strong>in</strong> the market.<br />
Kenya’s population is estimated at 30 million people with 30% resid<strong>in</strong>g <strong>in</strong> urban areas<br />
compared to Uganda with a population estimated at 22 million with less than 20%<br />
resid<strong>in</strong>g <strong>in</strong> urban areas. FAO 2000 estimates <strong>in</strong>dicate that Kenya produced only<br />
360,000 Mt <strong>in</strong> year 2000 compared to 478,000 Mt produced by Uganda. Further it is a<br />
recognised fact that Kenya has a higher per capita consumption of potato products <strong>in</strong><br />
urban areas than Uganda. All these statistics positively illustrate that local potato<br />
production <strong>in</strong> Kenya cannot adequately support its <strong>in</strong>creas<strong>in</strong>g demand.<br />
4
There<strong>for</strong>e there is need <strong>for</strong> further <strong>in</strong>vestigation to quantify the market potential <strong>for</strong><br />
other countries (Uganda and <strong>Rwanda</strong>) with<strong>in</strong> the region to supply the lucrative potato<br />
market of Kenya <strong>in</strong> general and Nairobi <strong>in</strong> particular.<br />
The Potato production and market<strong>in</strong>g <strong>in</strong> Tanzania and the<br />
market opportunities <strong>for</strong> <strong>Rwanda</strong><br />
Report highlights<br />
• Agro-ecological conditions do not permit potato cultivation <strong>in</strong> most parts of Northern<br />
Tanzania.<br />
• Tanzania produces a lower tonnage of potatoes compared to its E. African neighbours,<br />
Uganda and Kenya.<br />
• Maize gra<strong>in</strong>, cassava, sorghum and millet are the major staple foods <strong>for</strong> much of the<br />
population. <strong>Potatoes</strong> are ma<strong>in</strong>ly consumed <strong>in</strong> urban areas <strong>in</strong> the <strong>for</strong>m of chips.<br />
• Mwanza, the commercial city of northern Tanzania gets most of its potato requirements<br />
from Kenya. Bad road network does not permit the traders to get supplies locally.<br />
• Social <strong>in</strong>security along the ma<strong>in</strong> road to <strong>Rwanda</strong>, transport costs and potato quality are<br />
the reasons given by traders <strong>in</strong> Mwanza <strong>for</strong> not sourc<strong>in</strong>g potato supplies from <strong>Rwanda</strong>.<br />
• Dar es Salaam city gets most of its potatoes from southern Tanzania.<br />
• Potato market both <strong>in</strong> Mwanza and Dar es Salaam is grow<strong>in</strong>g rapidly.<br />
• Ma<strong>in</strong> <strong>for</strong>m of potato consumption is as chips. Other <strong>for</strong>ms are marg<strong>in</strong>al.<br />
• Comparative analysis of <strong>Rwanda</strong>’s potato competitiveness on Tanzanian market <strong>in</strong>dicates<br />
that it may not be competitive.<br />
5
POTATO PRODUCTION AND MARKETING IN TANZANIA<br />
General overview<br />
The pr<strong>in</strong>cipal food crop of Tanzania is maize; cover<strong>in</strong>g 58% of the farmers’ land cultivation<br />
of major food crops <strong>in</strong> 1998/99, table, figure 1. Households <strong>in</strong> all regions of the country (Map<br />
1) generally cultivate maize. Another important food staple particularly <strong>in</strong> lake regions<br />
(Mwanza, Kagera and Mara) of northern Tanzania is cassava, Table 2. Together, the three<br />
lake regions accounted <strong>for</strong> over 43% hectares under cassava cultivation <strong>in</strong> 1995/96. Rice is<br />
also another important food crop <strong>in</strong> the diet of Tanzanians, followed by sweet potatoes, millet<br />
and sorghum, tak<strong>in</strong>g 10%, 5%, 5% and 4% of the farmers’ land resource respectively.<br />
Map of Tanzania show<strong>in</strong>g political regions of the country<br />
6
Table, Figure 1: Planted area <strong>for</strong> major Food crops <strong>in</strong> Tanzania,<br />
1998/99<br />
Crop Planted area (Ha)<br />
Maize 3,010,631<br />
Rice 503,533<br />
Sorghum 207,671<br />
Millet 256,800<br />
Wheat 35,812<br />
Cassava 848,126<br />
S/ <strong>Potatoes</strong> 266,884<br />
Irish <strong>Potatoes</strong> 28,421<br />
Total 5,157,878<br />
Data source: National Bureau of statistics,<br />
Dar es Salaam, Tanzania<br />
Table 2 <strong>in</strong>dicates that <strong>in</strong> 1995/96 over 73% of potato cultivation was done <strong>in</strong> southern<br />
Tanzania (Ir<strong>in</strong>ga and Mbeya regions), 14% <strong>in</strong> Meru - Kilimanjaro (Arusha, Kilimanjaro and<br />
Tanga) belt and less than 8% <strong>in</strong> the lake regions.<br />
Table 2: Planted area <strong>for</strong> Roots and Tubers by region <strong>in</strong> Tanzania,<br />
1995/96<br />
Crop<br />
Region Cassava S/potatoes Irish potatoes<br />
Area (Ha) % of total Area (Ha) % of total Area (Ha) % of total<br />
Dodoma 783.72 0.22 25.36 0.03 86.89 1.38<br />
Arusha 969.21 0.27 73.03 0.10 262.71 4.18<br />
Kilimanjaro 1,206.84 0.34 36.97 0.05 - 0.00<br />
Tanga 6,785.55 1.92 110.96 0.15 639.88 10.18<br />
Morogoro 883.74 0.25 82.87 0.11 43.12 0.69<br />
Pwani/D'Salaam 34,527.73 9.77 496.30 0.66 - 0.00<br />
L<strong>in</strong>di 17,198.48 4.86 - 0.00 - 0.00<br />
Mtwara 39,857.32 11.27 49.87 0.07 - 0.00<br />
Ruvuma 33,103.98 9.36 1,279.05 1.71 - 0.00<br />
Ir<strong>in</strong>ga 2,514.94 0.71 45.94 0.06 3,459.96 55.05<br />
Mbeya 2,216.29 0.63 1,207.60 1.61 1,165.57 18.55<br />
S<strong>in</strong>gida 967.21 0.27 2,571.60 3.43 - 0.00<br />
Tabora 6,529.85 1.85 5,665.35 7.56 54.82 0.87<br />
7<br />
1%<br />
5%<br />
4%<br />
16%<br />
10%<br />
5% 1%<br />
58%<br />
Maize<br />
Rice<br />
Sorghum<br />
Millet<br />
Wheat<br />
Cassava<br />
S/ <strong>Potatoes</strong><br />
Irish <strong>Potatoes</strong>
Rukwa 12,989.44 3.67 - 0.00 - 0.00<br />
Kigoma 34,431.44 9.74 1,689.85 2.25 14.16 0.23<br />
Sh<strong>in</strong>yanga 3,783.46 1.07 22,378.29 29.85 103.88 1.65<br />
Kagera 45,535.71 12.88 9,839.31 13.12 402.76 6.41<br />
Mwanza 43,319.85 12.25 22,143.02 29.54 - 0.00<br />
Mara 65,918.02 18.65 7,273.57 9.70 51.02 0.81<br />
Total 353,522.76 100 74,968.93 100 6,284.78 100.0<br />
Although planted area have <strong>in</strong>creased 4-fold between 1995 and 1999 with production<br />
estimated at 0.2 million metric tonnes as <strong>in</strong>dicated <strong>in</strong> Table 3, there appear to be structural<br />
changes <strong>in</strong> potato cultivation. Southern Tanzania (Ir<strong>in</strong>ga and Mbeya regions) that dom<strong>in</strong>ated<br />
potato cultivation has reduced acreage to 58% while Meru - Kilimanjaro (Arusha,<br />
Kilimanjaro and Tanga) belt has <strong>in</strong>creased to over 35% and other areas such as the lake<br />
regions have shown modest <strong>in</strong>terest <strong>in</strong> potato cultivation.<br />
Table 3: Area planted, estimated production and percentage of production by Region,<br />
1998/99<br />
Region Area (Ha) Yield (Mt/Ha) Production (Mt) %age of Total prod<br />
Dodoma 284.49 7.00 1,991.43 1.00<br />
Arusha 605.33 7.00 4,237.31 2.13<br />
Kilimanjaro 1,136.28 7.00 7,953.96 4.00<br />
Tanga 8,317.69 7.00 58,223.83 29.27<br />
Morogoro 106.14 7.00 742.98 0.37<br />
Pwani/D'Salaam - 7.00 - 0.00<br />
L<strong>in</strong>di - 7.00 - 0.00<br />
Mtwara - 7.00 - 0.00<br />
Ruvuma 2,698.96 7.00 18,892.72 9.50<br />
Ir<strong>in</strong>ga 11,204.45 7.00 78,431.15 39.42<br />
Mbeya 2,558.45 7.00 17,909.15 9.00<br />
S<strong>in</strong>gida 22.58 7.00 158.06 0.08<br />
Tabora 43.12 7.00 301.84 0.15<br />
Rukwa 149.37 7.00 1,045.59 0.53<br />
Kigoma 108.96 7.00 762.72 0.38<br />
Sh<strong>in</strong>yanga 37.95 7.00 265.65 0.13<br />
Kagera 403.14 7.00 2,821.98 1.42<br />
Mwanza 15.35 7.00 107.45 0.05<br />
Mara 728.48 7.00 5,099.36 2.56<br />
Total 28,420.74 7.00 198,945.18 100<br />
Data source: National Bureau of statistics & M<strong>in</strong>. of Agric. & Co-op, Dar es Salaam, Tanzania<br />
Although potatoes do not feature as an important food staple <strong>in</strong> the diet rural dwellers they are<br />
prom<strong>in</strong>ent on the menu <strong>in</strong> hotels and restaurants <strong>in</strong> most urban areas <strong>in</strong> Tanzania. The food<br />
balance sheet <strong>for</strong> Tanzania, Table 4 <strong>in</strong>dicates that the food requirements of the country greatly<br />
depend on gra<strong>in</strong>s (maize, sorghum, millet) and cassava. The table further <strong>in</strong>dicates that<br />
though Tanzania produced less than 0.8 million tonnes of potatoes (Irish and sweet potatoes),<br />
the country required only 619,000 Mt. On the row of imports the table shows that Tanzania is<br />
a net importer of gra<strong>in</strong>s but not roots and tubers.<br />
8
Table 4: Tanzania Food Balance Sheet, June 2000-May 2001 (‘000<br />
tonnes)<br />
Maize Sorghum Rice Wheat Total Pulses Cassava Banana <strong>Potatoes</strong> Non- Total Food<br />
Millets<br />
Cereals<br />
cereal<br />
A. Total Domestic 2,240 817 595 118 3,771 1,781 703 798<br />
7,725<br />
food availability<br />
674<br />
3,955<br />
B.Total Annual 3,033 1,199 542 164 4,938 1,452 581 619<br />
8,027<br />
food requirements<br />
437<br />
3,089<br />
C. Domestic food<br />
Balance (A-B)<br />
-793 -382 54 -46 -1167 237 329 121 179 866 -302<br />
D. Commodity<br />
Cross Substitution<br />
491 382 -54 46 866 -237 -329 -121 -179 -866 0<br />
E. Shortfall [-]<br />
/Surplus[+] (C+D)<br />
-302 -302 -302<br />
F. Imports 48 139 299 486 486<br />
F.1 Received 48 126 291 464 464<br />
F. 1.1 Commercial 39 109 291 439 439<br />
F.1.2 Aid 9 17 26 26<br />
F.2 Expected 14 8 22 22<br />
F.2.1 Commercial<br />
F.2.2 Aid<br />
14 8 22 22<br />
G. Exports 3 1 3 8 2 2 10<br />
H. Import gap<br />
Source: Tanzania food security Bullet<strong>in</strong> No. 6.2001<br />
Figure 2 shows production and yield trends of potatoes <strong>in</strong> Tanzania. While the l<strong>in</strong>ear<br />
production trend illustrates a remarkable <strong>in</strong>crease <strong>in</strong> output, the yield has nearly rema<strong>in</strong>ed<br />
constant imply<strong>in</strong>g that output <strong>in</strong>creased ma<strong>in</strong>ly due to <strong>in</strong>creased acreage under cultivation.<br />
Figure 2: Potato production and yield <strong>in</strong> Tanzania, 1961 - 2000<br />
Prod ( '0000 Mt )<br />
28<br />
24<br />
20<br />
16<br />
12<br />
8<br />
4<br />
0<br />
1961<br />
1964<br />
1967<br />
prod<br />
yield<br />
L<strong>in</strong>ear (prod)<br />
L<strong>in</strong>ear (yield)<br />
1970<br />
Data source: FAO country statistics<br />
1973<br />
1976<br />
1979<br />
1982<br />
years<br />
Country comparison of production trend illustrated <strong>in</strong> Figure 3 <strong>in</strong>dicates that Tanzania has<br />
perpetually lagged beh<strong>in</strong>d Uganda and Kenya <strong>in</strong> potato production <strong>in</strong> East Africa.<br />
9<br />
1985<br />
y = 0.72x + 0.10<br />
y = 0.12x + 3.05<br />
1988<br />
1991<br />
1994<br />
1997<br />
2000
Figure 3: Trend of potato production <strong>in</strong> Uganda, Kenya and Tanzania: 1961-<br />
2000<br />
Prod ( '0000 Mt )<br />
55<br />
50<br />
45<br />
40<br />
35<br />
30<br />
25<br />
20<br />
15<br />
10<br />
5<br />
0<br />
1961<br />
1964<br />
1967<br />
uganda<br />
Kenya<br />
Tanzania<br />
1970<br />
Data source: FAO country statistics<br />
1973<br />
1976<br />
1979<br />
1982<br />
years<br />
In summary, limited agro-ecological conditions favourable <strong>for</strong> potato cultivation <strong>in</strong> Tanzania<br />
have greatly hampered production <strong>in</strong> many regions thereby <strong>in</strong>fluenc<strong>in</strong>g the food diet of the<br />
population. Very high demand <strong>for</strong> maize meal by natives both <strong>in</strong> rural and urban areas<br />
proportionately affects per capita <strong>in</strong>come allocation to other foodstuffs <strong>in</strong>clud<strong>in</strong>g potatoes.<br />
10<br />
1985<br />
1988<br />
1991<br />
1994<br />
1997<br />
2000
Potato market<strong>in</strong>g <strong>in</strong> Mwanza<br />
Introduction<br />
Mwanza is the regional political and commercial city of the Lake/Mwanza region <strong>in</strong> Northern<br />
Tanzania. It also serves a commercial centre <strong>for</strong> surround<strong>in</strong>g regions such as Sh<strong>in</strong>yanga, Kagera<br />
and Mara. The city’s population is estimated to be more than 0.2 million people.<br />
Much of Mwanza and the surround<strong>in</strong>g lake regions of Kagera, Mara and Sh<strong>in</strong>yanga lie between<br />
1000-1500 metres of altitude. Most of these regions have one season (unimodal) of ra<strong>in</strong> fall<strong>in</strong>g<br />
between November and May. However, the eastern section of Kagera region border<strong>in</strong>g <strong>Rwanda</strong><br />
and the Bukoba area next to lake Victoria, have two ra<strong>in</strong>fall seasons. The mean annual ra<strong>in</strong>fall <strong>in</strong><br />
Mwanza is below 800 mm while the mean annual temperature is above 24 o C. There<strong>for</strong>e, climatic<br />
conditions of northern Tanzania <strong>in</strong> general and Mwanza <strong>in</strong> particular are unfavourable <strong>for</strong> Irish<br />
potato production.<br />
The major economic activity of the local population <strong>in</strong> Mwanza is fish<strong>in</strong>g and farm<strong>in</strong>g. There are<br />
five factories <strong>in</strong> the town, located along the shores of lake Victoria, process<strong>in</strong>g fish <strong>for</strong> export.<br />
The major food crops cultivated <strong>in</strong> this region are maize, cassava and sweet potatoes. In the rural<br />
areas, food staple consumption pattern closely follows the production trend; i.e. maize meal is<br />
number one food staple. Cassava and sweet potatoes are also highly consumed <strong>in</strong> the rural areas<br />
of northern Tanzania. In the urban areas, particularly Mwanza, maize meal ranks first on the food<br />
list, closely followed by rice and then Irish potatoes. Cook<strong>in</strong>g bananas brought from Bukoba<br />
district are also eaten but as a snack.<br />
Potato production<br />
There is very little potato cultivation <strong>in</strong> Mwanza region, Tables 2 &3. Low ra<strong>in</strong>fall, high<br />
temperatures, poor sandy soils and relatively low altitude, Mwanza region is clearly unfavourable<br />
<strong>for</strong> potato production. Magdalena William, an agronomist head<strong>in</strong>g the legumes crop section, and<br />
also assigned to handle potato activities <strong>in</strong> Maruku agricultural research <strong>in</strong>stitute <strong>in</strong> Bukoba<br />
revealed that scanty production <strong>for</strong> home consumption occurs <strong>in</strong> some areas of Kagera region<br />
particularly <strong>in</strong> Karagwe and Bukoba districts with bi-modal ra<strong>in</strong>fall patterns and higher altitudes<br />
of over1500m. In Mara region, Tarime district is also known to produce limited quantities <strong>for</strong><br />
home consumption. Magdalena further said that due to its commercial <strong>in</strong>significancy, the<br />
government of Tanzania does not fund potato research activities <strong>in</strong> the agricultural research<br />
<strong>in</strong>stitutes of Northern Tanzania.<br />
Potato supply to Mwanza and neighbour<strong>in</strong>g towns.<br />
Be<strong>for</strong>e discover<strong>in</strong>g alternative good quality and cheaper potatoes from Kenya, traders from<br />
Mwanza were sourc<strong>in</strong>g their supplies from Arusha, Mbeya and occasionally from <strong>Rwanda</strong>.<br />
Traders from Mwanza now buy potatoes directly from Kenyan farmers <strong>in</strong> Nakuru district through<br />
a broker. The traders travel by bus from Mwanza to the Sirali, a border township between<br />
Tanzania and Kenya. After immigration clearance <strong>in</strong> Kenya, traders board another vehicle that<br />
takes them to Molo location <strong>in</strong> Nakuru district. Molo and Meru areas are well known <strong>for</strong> grow<strong>in</strong>g<br />
high quality red potatoes <strong>in</strong> Kenya just like Kabale and Kisoro is <strong>for</strong> Uganda.<br />
The major reasons cited by Mwanza traders <strong>for</strong> not buy<strong>in</strong>g potatoes from Arusha and Mbeya are<br />
high transport costs and quality of potatoes. Similar reasons are given <strong>for</strong> not buy<strong>in</strong>g from<br />
<strong>Rwanda</strong>. It takes only one day to travel from Mwanza to Molo location <strong>in</strong> Kenya, three days from<br />
Mwanza to Mbeya and two-three days from Mwanza to Arusha-Moshi depend<strong>in</strong>g on the route<br />
11
used. If traders use a Kenya route that goes through Nairobi then Moshi be<strong>for</strong>e enter<strong>in</strong>g Arusha,<br />
they take less time – two days, but if they use an <strong>in</strong>ternal route pass<strong>in</strong>g through Sh<strong>in</strong>yanga-<br />
Nzega-S<strong>in</strong>gida-Babati-Arusha, they take three days. This highlights the pathetic the roads and the<br />
general road transport system <strong>in</strong> Tanzania. Traders <strong>in</strong> Mwanza f<strong>in</strong>d it cheaper both <strong>in</strong> f<strong>in</strong>ancial<br />
outlay and time to travel through a neighbour<strong>in</strong>g country, Kenya <strong>in</strong> order to source potato<br />
supplies <strong>in</strong> Arusha.<br />
Traders <strong>in</strong> Mwanza are particular about quality (dry matter content of potatoes) because it directly<br />
affects the storage period and quality of chips. Not only is the road transport system awful, the<br />
quality of potatoes from Mbeya and Arusha is not comparable to those from Molo, Kenya. The<br />
traders said that potatoes from Sanya Juu, a location on the slopes of Mt. Kilimanjaro <strong>in</strong> Moshi<br />
district is the only variety they have come across that is similar to that <strong>in</strong> Molo, Kenya. The<br />
traders <strong>in</strong> Mwanza further lleged that potatoes from <strong>Rwanda</strong> of poor quality (rot and wither<br />
easily) due to heavy use of fertilizers by farmers. Apparently the traders’ revelation suggests that<br />
there is a relation between the level of fertilizer use and dry matter content of potatoes. An area<br />
that needs further research.<br />
Increas<strong>in</strong>g <strong>in</strong>security on the road section between Nyakanazi <strong>in</strong> Kigoma region and Nyakahura <strong>in</strong><br />
Kagera region caused by the Hutu refugees <strong>in</strong> camps has adversely retarded trade between<br />
northern Tanzania and <strong>Rwanda</strong>. To cross that road section, all vehicles to and from <strong>Rwanda</strong>,<br />
Burundi and Democratic Republic of Congo move <strong>in</strong> a convoy escorted by the armed <strong>for</strong>ces.<br />
There<strong>for</strong>e, not only is the potato quality from <strong>Rwanda</strong> unappeal<strong>in</strong>g to traders from Mwanza,<br />
<strong>in</strong>creased thuggery along the Isaka - Rusumo road has dim<strong>in</strong>ished any major prospect <strong>in</strong> potato<br />
trad<strong>in</strong>g between Tanzania and <strong>Rwanda</strong>.<br />
Mwanza is the commercial hub of northern Tanzania and as far as potatoes are concerned,<br />
Mwanza town is the distribution po<strong>in</strong>t to other urban centres <strong>in</strong> Mwanza and Sh<strong>in</strong>yanga regions.<br />
Some of the centres that buy potatoes from Mwanza market <strong>in</strong>clude Sh<strong>in</strong>yanga, Geita, Ukerewe,<br />
Sengerema, Nzega, etc. It is Isaka trad<strong>in</strong>g centre, that known to get its supply of potatoes from<br />
<strong>Rwanda</strong> brought by truck drivers ply<strong>in</strong>g Kigali - Isaka route.<br />
Potato wholesale market<br />
Mwanza town has one central market called Soko Kuu (Ma<strong>in</strong> Market) <strong>in</strong> the midst of the town.<br />
99% of potato wholesalers have stalls and sell potatoes through this market. Some of the<br />
wholesalers are travell<strong>in</strong>g traders who source potatoes from Nakuru, Kenya or Arusha while<br />
others are sedentary traders who buy from travell<strong>in</strong>g traders. Prom<strong>in</strong>ent travell<strong>in</strong>g traders br<strong>in</strong>g<br />
between 100-200 bags of potatoes from Kenya to distribute to sedentary wholesalers and a<br />
multitude of retailers <strong>in</strong> urban centres both <strong>in</strong> Mwanza and Sh<strong>in</strong>yanga regions. An average potato<br />
bag from Kenya weighs 280kg.<br />
Potato retailers are found ma<strong>in</strong>ly <strong>in</strong> Soko Kuu market and out ly<strong>in</strong>g retail market outlets. Food<br />
retail shops and supermarkets do not sell potatoes. An <strong>in</strong>novative attempt by a supermarket to<br />
retail potatoes <strong>in</strong> Mwanza town only led to a f<strong>in</strong>ancial loss to the proprietor as buyers preferred<br />
open air markets.<br />
The level of potato out put <strong>in</strong> Nakuru, Kenya, directly affects supply <strong>in</strong> Mwnaza region. I.e. when<br />
production is high and the price is low (~ T shs.12,000/ 280kg) <strong>in</strong> Nakuru between November and<br />
June then the supply is also high <strong>in</strong> Mwanza and the retail price is T shs.100/kg. The reverse is<br />
also true, when output is low and price is high (~ T shs.22,000/ 280kg) <strong>in</strong> Nakuru, supply is low<br />
and the retail price is high (~ T shs.250/kg) <strong>in</strong> Mwanza. Apparently, potato traders and consumers<br />
<strong>in</strong> northern Tanzania have little/no option other than gett<strong>in</strong>g potatoes from Kenya. Internal<br />
12
sources of Mbeya, Arusha and Moshi are h<strong>in</strong>dered by a bad road transport system while a<br />
possible supply from <strong>Rwanda</strong> has also been disrupted by <strong>in</strong>security along the Isaka-Rusumo road.<br />
The potato market of northern Tanzania is rapidly grow<strong>in</strong>g with a major concentration <strong>in</strong> urban<br />
areas, requir<strong>in</strong>g high quality potatoes <strong>for</strong> chips. The market structure has the characteristics of a<br />
monopolistically competitive market (few sellers, many buyers, limited <strong>in</strong><strong>for</strong>mation) and can best<br />
be expla<strong>in</strong>ed as that.<br />
Potato consumption<br />
Potato consumption <strong>in</strong> Mwanza and other urban centres <strong>in</strong> northern Tanzania is rapidly pick<strong>in</strong>g<br />
up as evidenced by the mushroom<strong>in</strong>g chips’ kiosks even <strong>in</strong> bus parks. In bus parks, potato chips<br />
with roast meat are a popular snack <strong>for</strong> travellers.<br />
Potato chips are the pr<strong>in</strong>cipal product of potatoes that is universally consumed <strong>in</strong> all urban areas<br />
of northern Tanzania. S<strong>in</strong>ce potatoes are not a native staple food, very few people know and<br />
appreciate other <strong>for</strong>ms <strong>in</strong> which potatoes can be prepared such as mashed or mixed with beans.<br />
However, a few people do consume potatoes <strong>in</strong> beef stew while others specially Indians make<br />
crisps <strong>for</strong> a very limited (Indians) market with no quick prospect of expansion. There<strong>for</strong>e the<br />
major buyers of potatoes <strong>in</strong> Mwanza are hotel, restaurant and take-away operators. Other buyers<br />
particularly <strong>for</strong> household consumption are marg<strong>in</strong>al.<br />
<strong>Market<strong>in</strong>g</strong> costs and marg<strong>in</strong>s<br />
Travell<strong>in</strong>g and sedentary wholesalers of potatoes are few <strong>in</strong> Mwanza but it is rather surpris<strong>in</strong>g<br />
that these traders do not make excessive profits from their relatively monopolistic situation, table<br />
5. While a net profit of T.shs. 2,400 per 280kg bag may seem low but given that the turn over is<br />
high, a wholesaler sell<strong>in</strong>g<br />
50 bags a week X 4 weeks X 2,400 = T.shs. 480,000, ~US $ 545 net return per month.<br />
Table 5 also show that from a gross marg<strong>in</strong> of 56%, over 51% goes to wholesale market<strong>in</strong>g costs<br />
particularly on transport.<br />
Table 5: Potato market<strong>in</strong>g costs and marg<strong>in</strong>s <strong>for</strong> Mwanza<br />
T Shs./280kg bag % of sell<strong>in</strong>g price<br />
Farmer (Molo-Kenya)<br />
Farm-gate price 22,000<br />
Wholesale travell<strong>in</strong>g trader<br />
Purchase price (Molo-Kenya) 22,000 44<br />
Sell<strong>in</strong>g price (Soko Kuu-Mz.) 50,000<br />
Gross marg<strong>in</strong> 28,000 56<br />
Costs<br />
Transport (Bus)-Mwanza -Sirali Border 3,000 6<br />
Transport Sirali to Molo (Kenya) 2,200 4.4<br />
Accomodation & meals - 2 days 5,000 10<br />
Commission (Rural broker) 1,000 2<br />
Pack<strong>in</strong>g bags 300 0.6<br />
Sort<strong>in</strong>g, pack<strong>in</strong>g & load<strong>in</strong>gs 1,000 2<br />
Transport (Lorry) Molo-Sirali 4,500 9<br />
TZ Gov,t. Tax 2,600 5.2<br />
Transport (Lorry) Sirali - Mwanza 4,500 9<br />
Off-load – Mwanza (Soko Kuu) 800 1.6<br />
13
Market fee 600 1.2<br />
Over heads (stall rent, others) 100 0.2<br />
Total costs 25,600 51.2<br />
Net Marg<strong>in</strong> 2,400 4.8<br />
Retailer (Soko Kuu-Mz)<br />
Purchase price 50,000 89.3<br />
Sell<strong>in</strong>g price 56,000<br />
Gross marg<strong>in</strong> 6,000 10.7<br />
Costs<br />
Miscellaneous costs (stall rent, other) 200 0.4<br />
Total costs 200 0.4<br />
Net Marg<strong>in</strong> 5,800 10.4<br />
Basic facts<br />
• 1 bag of potatoes weighs 280kgs<br />
• Retail price of potatoes <strong>in</strong> Mwanza is Tshs. 200-250/=<br />
• Current exchange rate: K. shs.1 = T. shs.2, US $1 = T. shs.875<br />
• Traders may take 1-5 days to get required tonnage of potatoes <strong>in</strong> Molo location of Nakuru<br />
district <strong>in</strong> Kenya. A broker plays a major role <strong>in</strong> assembl<strong>in</strong>g required supply<br />
• Traders may take 1-2 days to get lorry <strong>for</strong> Sirali-Mwanza journey.<br />
• <strong>Potatoes</strong> from Molo, Kenya are considered to be of best quality by traders both <strong>in</strong> Kenya and<br />
Tanzania.<br />
• Traders reportedly <strong>in</strong>cur negligible post harvest loss (rott<strong>in</strong>g, wither<strong>in</strong>g) from potatoes<br />
brought from Molo compared to those brought from Arusha or <strong>Rwanda</strong>.<br />
Although the retailers seem to get high net marg<strong>in</strong> per 280kg bag sold, their turnover is low (10<br />
bags a month) hence limit<strong>in</strong>g their net turnover.<br />
Isaka rail term<strong>in</strong>al<br />
Isaka rail term<strong>in</strong>al is the gateway <strong>for</strong> the land locked countries of <strong>Rwanda</strong>, Burundi and eastern<br />
Congo prov<strong>in</strong>ces to the Tanzanian seaport of Dar es salam. The term<strong>in</strong>al has a recently built and<br />
modern <strong>in</strong>land dry port operated by Tanzania Railways Corporation. Rashid Juma is the term<strong>in</strong>al<br />
manager.<br />
Isaka rail term<strong>in</strong>al is located <strong>in</strong> Sh<strong>in</strong>yanga region, about 360 km east of Rusumo, Tanzania-<br />
<strong>Rwanda</strong> border po<strong>in</strong>t and 230 km south of Mwanza town. The port has attracted a number of<br />
local and <strong>in</strong>ternational freight clear<strong>in</strong>g and <strong>for</strong>ward<strong>in</strong>g companies such as Transmi SDV and<br />
Wal<strong>for</strong>d Meadows. Two mobile companies (Mobitel and Vodacom) and Tanzania<br />
Telecommunications Corporation Ltd connect Isaka to the rest of the world and also the road out<br />
of Isaka to the Tanzania-<strong>Rwanda</strong> and Tanzania-Burundi borders is bitum<strong>in</strong>ised. Thus, Isaka rail<br />
term<strong>in</strong>al is well serviced with the necessary <strong>in</strong>frastructure <strong>for</strong> a modern <strong>in</strong>land port.<br />
Rashid Juma, Isaka rail term<strong>in</strong>al manager claimed that no imports/exports of potatoes from<br />
<strong>Rwanda</strong> have ever passed through the term<strong>in</strong>al. However, he said that the term<strong>in</strong>al receives coffee<br />
exports from <strong>Rwanda</strong> and imports of petrol, gra<strong>in</strong>s (rice, wheat flour, maize etc.) and other<br />
manufactured goods.<br />
14
Freight and handl<strong>in</strong>g costs<br />
The freight and handl<strong>in</strong>g charges sheet of Tanzania Railways Corporation classify potatoes<br />
as general goods. Freight and handl<strong>in</strong>g costs are charged per wagon <strong>for</strong> any dest<strong>in</strong>ation <strong>in</strong><br />
Tanzania. One wagon is equivalent to 1-40 feet or 2-20 feet conta<strong>in</strong>er(s) and 1-40 feet<br />
conta<strong>in</strong>er can hold between 38-40 metric tonnes of cargo, equivalence table below.<br />
Table 6: Approximate equivalent units <strong>in</strong> one wagon<br />
Item Equivalent Equivalent<br />
1 wagon One 40 feet conta<strong>in</strong>er 38-40 Metric tonnes<br />
Two 20 feet conta<strong>in</strong>er 1-20ft equals 18-20 metric tonnes.<br />
Table 7: Freight and handl<strong>in</strong>g costs of potatoes per metric tonne.<br />
Rail transport charges per wagon by Total per tonne US $ per<br />
From - To TRC, (T.Shs.).<br />
1wagon ~ 38 Mt. Mt<br />
Freight Handl<strong>in</strong>g Total T. Shs.<br />
Isaka-Dar 1,535,520 70 1,535,590 40,410 US $ 46<br />
Isaka-Mwanza 783,480 70 783,550 20,620 US $ 24<br />
Charges <strong>for</strong> Kigali-Isaka below is by private transport companies and is <strong>in</strong> US dollars<br />
Kigali-Isaka US $ 30-<br />
40<br />
Exchange rate: US $ 1 = T Shs. 875.<br />
The freight charges <strong>in</strong>clude government taxes such as Value Added Tax that are charged on<br />
services provided. 70 shill<strong>in</strong>gs charged <strong>for</strong> handl<strong>in</strong>g is a token fee <strong>for</strong> us<strong>in</strong>g a crane to transfer the<br />
conta<strong>in</strong>ers from a truck to the rail eng<strong>in</strong>e. The term<strong>in</strong>al manager said that Isaka term<strong>in</strong>al does not<br />
charge customers <strong>for</strong> storage of conta<strong>in</strong>ers <strong>in</strong> the <strong>in</strong>land port because it is the corporation’s<br />
responsibility to transport the customers cargo soon after all due freight and handl<strong>in</strong>g charges<br />
have been settled.<br />
Dar es Salaam Potato market<br />
Dar es Salaam, the commercial city of Tanzania with a population estimated at over 2 million is<br />
the major market of potatoes <strong>in</strong> the country. Consumption of potato products particularly chips<br />
competes favourably with gra<strong>in</strong> staples such as rice and maize meal <strong>in</strong> city hotels and restaurants.<br />
<strong>Potatoes</strong> are also <strong>in</strong>creas<strong>in</strong>gly used <strong>in</strong> preparation of soups. There<strong>for</strong>e the demand <strong>for</strong> potatoes <strong>in</strong><br />
Dar es Salaam is high and <strong>in</strong>creas<strong>in</strong>g.<br />
In Kariako market (major food market <strong>in</strong> Dar es Salaam), James Mgeni, a prom<strong>in</strong>ent wholesaler<br />
estimated that daily, the market receives more than 130 Mt (1,000 bags of 130kg) of potatoes.<br />
Ir<strong>in</strong>ga and Mbeya are the major supply regions.<br />
All the traders <strong>in</strong>terviewed <strong>in</strong> Kariako market said the have never brought (imported) out<br />
Tanzania to sell <strong>in</strong> the market. Most of the traders were of view that what they get from Ir<strong>in</strong>ga<br />
and Mbeya was sufficient.<br />
15
Most wholesalers <strong>in</strong> Kariako market are sedentary traders who buy their potato stock off-lorry at<br />
T. shs.15,000 from travell<strong>in</strong>g traders and organised farmers. The average weight potato bags<br />
bought off-lorry is 130kg. These traders sell their potato stocks <strong>in</strong> the same <strong>for</strong>m they received<br />
from the lorry, there<strong>for</strong>e very limited value is added (sort<strong>in</strong>g, grad<strong>in</strong>g and repack<strong>in</strong>g). Between<br />
December and June when production is high <strong>in</strong> southern Tanzania, the average wholesale price<br />
<strong>for</strong> 130kg bag is T.shs.15,000 while between July and October when there is low output the<br />
average price is T. shs.18,000. Retailers and processors (Hotels and restaurants) are the ma<strong>in</strong><br />
buyers.<br />
Wholesale Price trend of <strong>Potatoes</strong> <strong>in</strong> Tanzania<br />
Figure 4 illustrates the pattern of potato wholesale price movement <strong>for</strong> the selected regions <strong>in</strong><br />
Tanzania. Mbeya and Ir<strong>in</strong>ga are selected to show the price trend <strong>in</strong> the major production areas,<br />
Dar es Salaam and Mwanza to illustrate the situation <strong>for</strong> a non-production but consumption centre<br />
while Arusha illustrates price movements <strong>in</strong> production and consumption region. The wholesale<br />
price is <strong>for</strong> 100kg bags.<br />
Important to note is that potato prices <strong>in</strong> Mbeya and Ir<strong>in</strong>ga the lowest followed by Dar es Salaam.<br />
Dar es Salaam prices are relatively lower because it gets supplies from the cheap from areas of<br />
Mbeya and Ir<strong>in</strong>ga; and road connection is good hence reduc<strong>in</strong>g the transport costs. The figure<br />
shows that Mwanza prices are the highest because of high transaction cost that are <strong>in</strong>volved get<br />
potatoes from the production areas (Kenya) to the market.<br />
Figure 4: Trend of Wholesale price of potatoes <strong>in</strong> select Regions <strong>in</strong> Tanzania:<br />
1998-2001.<br />
Tz. Shs.<br />
35,000<br />
30,000<br />
25,000<br />
20,000<br />
15,000<br />
10,000<br />
5,000<br />
-<br />
Jan-98<br />
Apr-98<br />
Jul-98<br />
Oct-98<br />
Jan-99<br />
ARUSHA D.S.M IRINGA<br />
MBEYA MWANZA<br />
Apr-99<br />
Jul-99<br />
Oct-99<br />
16<br />
Jan-00<br />
Years<br />
Apr-00<br />
Jul-00<br />
Oct-00<br />
Jan-01<br />
Apr-01<br />
Jul-01<br />
Oct-01
Analysis of the competitiveness of <strong>Rwanda</strong> potatoes on Tanzania market.<br />
Table 8 show estimates of the expected off-lorry price (column F) of potatoes from <strong>Rwanda</strong> on<br />
Mwanza and Dar es Salaam markets compared to the current prices (column G) <strong>in</strong> those markets.<br />
Table 8 illustrates that, sett<strong>in</strong>g other factors (e.g. quality) constant; <strong>Rwanda</strong> potatoes may not be<br />
very competitive on Mwanza market compared to those from Kenya particularly between<br />
November and June when it is harvest season <strong>in</strong> Kenya.<br />
Between July to October, there is low potato output <strong>in</strong> Kenya especially <strong>in</strong> Nakuru and as a result,<br />
wholesale prices rise directly affect<strong>in</strong>g the supply and price trend <strong>in</strong> Mwanza wholesale market.<br />
Dur<strong>in</strong>g this period, potato wholesale prices <strong>in</strong> Soko Kuu range from T. shs.150 – 170/kg while<br />
the retail price range is T. shs.200 – 250/kg. This is the prospective period <strong>in</strong> which <strong>Rwanda</strong><br />
potatoes can sell <strong>in</strong> this market if the variety/quality problem is fixed and the off-lorry price of<br />
<strong>Rwanda</strong> potatoes on Mwanza market does not exceed T. shs.140/kg.<br />
Table 8: Competition of <strong>Rwanda</strong> potatoes on Mwanza and Dar-es-<br />
Salaam markets.<br />
Mwanza<br />
(Tz. Shs).<br />
Dar<br />
(Tz. Shs)<br />
A B C D E F G<br />
Purchase<br />
price per<br />
Mt.-<br />
Kigali<br />
Taxes<br />
at<br />
border<br />
Transp.<br />
KGL-MZ,<br />
KGL-DAR<br />
Misc. cost<br />
(mkt fees<br />
etc)<br />
17<br />
Total<br />
A+B+C+D<br />
Off-lorry<br />
Price per<br />
kg Mz<br />
market<br />
70,000 9,285 56,620 22,145 158,050 158 158<br />
70,000 9,285 76,410 22,145 178,050 178 150<br />
Current<br />
W/S Price<br />
per kg<br />
Assumptions<br />
• Wholesale/assembly price of potatoes <strong>in</strong> Kigali = RFr. 30,000/Mt, RFr. 30/kg<br />
• Exchange rate: RFr. 1 = T. shs.2.3.<br />
• Commodity taxes at all borders similar i.e. 280kg = T shs.2,600 at Sirali Tz-Kenya border<br />
• Transport costs <strong>in</strong> table 3 used<br />
• Miscellaneous costs <strong>in</strong>clude Soko Kuu market fee of 280kg = T shs.600 (T.shs 2,145/mt) and<br />
transport cost from Mwanza rail term<strong>in</strong>al 1Mt = T. shs.20,000<br />
The prospect of sell<strong>in</strong>g <strong>Rwanda</strong> potatoes <strong>in</strong> Dar es Salaam is very m<strong>in</strong>imal given the high<br />
transaction costs <strong>in</strong>volved <strong>in</strong> mov<strong>in</strong>g a consignment from Kigali to Dar es Salaam, table 8. The<br />
framers from southern Tanzania have a high comparative advantage produc<strong>in</strong>g good quality<br />
potatoes <strong>for</strong> Dar es Salaam market than any other region <strong>in</strong> Tanzania.