An Introduction to Climate Change - A Canadian Perspective
An Introduction to Climate Change - A Canadian Perspective
An Introduction to Climate Change - A Canadian Perspective

Create successful ePaper yourself
Turn your PDF publications into a flip-book with our unique Google optimized e-Paper software.
<strong>An</strong> <strong>Introduction</strong> <strong>to</strong><br />
<strong>Climate</strong> <strong>Change</strong><br />
A CANADIAN PERSPECTIVE
This report is available electronically at:<br />
www.msc.ec.gc.ca/education/scienceofclimatechange<br />
Additional hard copies may also be obtained, free of charge, by writing <strong>to</strong>:<br />
Science Assessment and Integration Branch<br />
Environment Canada<br />
4905 Dufferin Street<br />
Downsview, Ontario<br />
M3H 5T4<br />
(416) 739-4432<br />
Published by authority of the Minister of the Environment<br />
©Minister of Public Works and Government Services<br />
Canada 2005<br />
Graphic design, artwork and technical production were provided by BTT Communications (Toron<strong>to</strong>)<br />
ISBN #: 0-662-41247-8<br />
Catalogue No. En56-205/2005-1E<br />
Oc<strong>to</strong>ber 2005<br />
Ce document est aussi disponible en français<br />
Printed on recyclable paper
<strong>An</strong> <strong>Introduction</strong> <strong>to</strong><br />
<strong>Climate</strong> <strong>Change</strong><br />
A CANADIAN PERSPECTIVE<br />
HENRY HENGEVELD<br />
BOB WHITEWOOD<br />
ANGUS FERGUSSON<br />
ENVIRONMENT CANADA
Acknowledgements<br />
AN INTRODUCTION TO CLIMATE CHANGE was prepared in Environment<br />
Canada by Henry Hengeveld (Emeritus Associate, Science Assessment<br />
and Integration Branch), Bob Whitewood (<strong>Climate</strong> Research Branch)<br />
and <strong>An</strong>gus Fergusson (Science Assessment and Integration Branch).<br />
Input was also provided by Morrie Paul (<strong>Climate</strong> <strong>Change</strong> Bureau) and<br />
Mark Berman (Global <strong>Climate</strong> Affairs).<br />
Much of the contents of this report was originally published in<br />
1990 (updated in 1995) as a State of the Environment Report under<br />
the title “Understanding Atmospheric <strong>Change</strong>”. The contents of<br />
“<strong>An</strong> <strong>Introduction</strong> <strong>to</strong> <strong>Climate</strong> <strong>Change</strong>” were reviewed for accuracy<br />
by the following experts: Elizabeth Bush, Rob Cross, Kaz Higuchi,<br />
Lucy Vincent, Bin Yu, Xuebin Zhang and Francis Zwiers (all with<br />
Environment Canada); Dominique Blain (Environmental Protection<br />
Service, Environment Canada); Pam Kertland (Natural Resources<br />
Canada); and Allyn Clarke (Bedford Institute of Oceanography,<br />
Fisheries and Oceans Canada). The authors wish <strong>to</strong> acknowledge with<br />
appreciation their valuable comments.
Table of contents<br />
INTRODUCTION ________________________________________________________________________ iii<br />
CHAPTER 1 EARTH’S NATURAL CLIMATE __________________________________________ 1<br />
The natural global climate system ____________________________________________1<br />
The global heat engine ________________________________________________1<br />
Incoming solar radiation ______________________________________________2<br />
Outgoing heat radiation ______________________________________________3<br />
Climatic balance __________________________________________________________4<br />
<strong>Climate</strong> of the past ________________________________________________________5<br />
Reconstructing climate ________________________________________________5<br />
The past million years ________________________________________________7<br />
The last 2000 years __________________________________________________9<br />
The last hundred years ________________________________________________9<br />
CHAPTER 2 ENHANCING THE GREENHOUSE EFFECT ______________________________13<br />
Carbon dioxide __________________________________________________________13<br />
Methane ______________________________________________________________17<br />
Other greenhouse gases __________________________________________________18<br />
Other human influences __________________________________________________19<br />
CHAPTER 3 PREDICTING CLIMATES ________________________________________________21<br />
Mathematical climate models ______________________________________________21<br />
Model projections for the future ____________________________________________23<br />
Are humans already causing the Earth <strong>to</strong> warm?________________________________26<br />
CHAPTER 4 A WARMER WORLD __________________________________________________29<br />
Natural terrestrial ecosystems ______________________________________________29<br />
Agricultural ecosystems __________________________________________________30<br />
Coastal regions __________________________________________________________31<br />
Other impacts __________________________________________________________33<br />
Implications for global security ____________________________________________33<br />
i
<strong>An</strong> <strong>Introduction</strong> <strong>to</strong> <strong>Climate</strong> <strong>Change</strong><br />
CHAPTER 5 A WARMER CANADA__________________________________________________35<br />
Canada’s forests__________________________________________________________35<br />
Agriculture ____________________________________________________________37<br />
Water resources__________________________________________________________38<br />
Fisheries ______________________________________________________________39<br />
Coastal zones __________________________________________________________40<br />
Transportation __________________________________________________________41<br />
Human health and well being ______________________________________________42<br />
Energy production and use ________________________________________________42<br />
Global security __________________________________________________________43<br />
CHAPTER 6 HOW DO WE RESPOND? ______________________________________________45<br />
Enhancing our understanding of climate change________________________________45<br />
The global research effort ____________________________________________45<br />
Assessing and communicating climate change science ______________________46<br />
Exploring linkages <strong>to</strong> other atmospheric issues ____________________________47<br />
Moving <strong>to</strong>wards consensus on the need for action ______________________________48<br />
Global political response __________________________________________________48<br />
The <strong>Canadian</strong> response____________________________________________________49<br />
The role of the citizen ____________________________________________________51<br />
ii
<strong>Introduction</strong><br />
TO THE BEST OF OUR KNOWLEDGE, Earth’s atmosphere is unique in its ability<br />
<strong>to</strong> support life. It provides the oxygen, water vapour, and carbon dioxide needed <strong>to</strong><br />
sustain the biological processes within the Earth’s surface ecosystem. It contains a<br />
protective high-level ozone layer that acts as a screen against harmful ultraviolet radiation<br />
from the sun. Moreover, its constituents include gases that serve as an insulating blanket<br />
around the planet, keeping surface temperatures within the range necessary for the<br />
presence of liquid water and, hence, life as we know it. Each of these fac<strong>to</strong>rs is<br />
essential <strong>to</strong> the presence of living things, and all have persisted for millions of years.<br />
Scientists have long recognized the importance of the<br />
earth’s atmosphere. However, it was not until the late<br />
1960s that we were presented with the first stunning<br />
images of Earth from space. These showed a remarkable<br />
oasis of blue and white within the broad expanses of a<br />
lifeless cosmos – an oasis protected by a thin, fragile<br />
mantle of gases. It was a gripping reminder that Earth<br />
may indeed be unique and irreplaceable. Various<br />
astronauts in the Apollo flights have noted that, from<br />
the lunar distance, the Earth’s atmosphere appears so thin<br />
that it is virtually unobservable – a resource that humans<br />
need <strong>to</strong> learn <strong>to</strong> conserve and use wisely.<br />
If these observations about the Earth’s atmosphere were<br />
timely forty years ago, they are even more relevant now.<br />
The scientific evidence is increasingly clear that the<br />
Earth’s atmosphere is undergoing major changes. These<br />
changes have in some respects already exceeded the<br />
limits of the natural atmospheric fluctuations of at least<br />
the past 100 000 years, and they are projected <strong>to</strong> become<br />
significantly larger with time. They appear <strong>to</strong> be directly<br />
linked, not <strong>to</strong> some external changing force at work upon<br />
the planet but <strong>to</strong> a global-scale geophysical experiment<br />
unwittingly commenced from within by humankind, an<br />
uncontrolled experiment that could change the global<br />
ecosystem beyond anything the Earth has experienced for<br />
the last several hundred thousand years.<br />
This experiment is a by-product of two fac<strong>to</strong>rs – rapid<br />
technological development and an unprecedented<br />
expansion of human population – both of which began in<br />
the eighteenth century. Technological development, by<br />
utilizing new forms of energy and multiplying productive<br />
capacity, has greatly increased the human impact on the<br />
environment, not only through greater consumption of<br />
resources but also through the creation of vast quantities of<br />
environmentally harmful products and by-products. The<br />
growth of the global population – from approximately<br />
600 million at the beginning of the eighteenth century <strong>to</strong><br />
about 6.5 billion <strong>to</strong>day – has compounded these effects,<br />
with the result that human activities are now on such a<br />
scale as <strong>to</strong> rival the forces of nature in their influence on<br />
the environment.<br />
Associated with these phenomena are rapid changes in<br />
land use, increased industrialization, and a voracious<br />
appetite for energy. Some of the consequences of these<br />
developments – smog, water pollution, and impoverished<br />
iii
<strong>An</strong> <strong>Introduction</strong> <strong>to</strong> <strong>Climate</strong> <strong>Change</strong><br />
and contaminated soils – are already painfully obvious on<br />
a local and regional scale and have been the object of<br />
strong anti-pollution legislation within many countries.<br />
On a global scale, however, the effects have been much<br />
more subtle, because the damage is being caused by the<br />
unnatural release in<strong>to</strong> the atmosphere of gases that are<br />
mostly odourless and invisible – seemingly innocent<br />
substances, whose effects are not immediately apparent.<br />
Only recently have we recognized that the release of<br />
these gases is capable of changing the composition of<br />
the atmosphere. Because the atmosphere is the Earth’s<br />
most vital life support system, such changes will inevitably<br />
have a major impact on the biosphere.<br />
The changes in the atmospheric composition that are now<br />
taking place raise two fundamental global concerns. One is<br />
the gradual depletion of the protective ozone layer in the<br />
upper atmosphere. The other is the warming of the Earth’s<br />
surface and lower atmosphere. The latter concern is the<br />
subject of this report, which is intended <strong>to</strong> summarize our<br />
iv<br />
current scientific understanding of the processes involved<br />
in a changing climate and of the related implications for<br />
the global ecosystem, the world community, and Canada.<br />
Chapters 1 <strong>to</strong> 4 of the report summarize our current<br />
scientific understanding of climate change and its global<br />
impact. The data in these chapters have been derived<br />
primarily from the reports of the Intergovernmental<br />
Panel on <strong>Climate</strong> <strong>Change</strong> (particularly the third<br />
assessment report released in 2001) and key scientific<br />
papers published in the international peer reviewed<br />
literature in recent years. The Panel’s reports represent<br />
the most recent and comprehensive assessments of the<br />
issue by the international scientific community.<br />
Chapter 5 examines the many possible impacts of a<br />
warmer climate on Canada. Much of the information in<br />
this chapter is derived from related national assessments.<br />
In conclusion, Chapter 6 examines what must be and is<br />
being done <strong>to</strong> respond <strong>to</strong> this important issue.
Earth’s natural climate<br />
Through its constituent gases the atmosphere provides<br />
the basic conditions for life on Earth. But it is through<br />
climate that it shapes the patterns and helps <strong>to</strong> set the<br />
limits of terrestrial existence. <strong>Climate</strong> regulates the life<br />
cycle of plants and animals, affects their growth and<br />
vitality, and is a principal fac<strong>to</strong>r in determining how they<br />
distribute themselves around the globe. Almost all<br />
complex life forms are adapted <strong>to</strong> live within a specific<br />
and often relatively narrow climatic niche.<br />
Thanks in part <strong>to</strong> technology, human beings have managed<br />
<strong>to</strong> expand their niche <strong>to</strong> include nearly every part of the<br />
globe. Yet even human life remains closely constrained by<br />
climatic fac<strong>to</strong>rs. Settlement patterns, shelters, clothing,<br />
agriculture, transportation, and even culture all reflect the<br />
deeply pervasive influence of climate.<br />
<strong>Climate</strong> is commonly defined as average weather. Thus,<br />
the climate of a place is the average over a number of years<br />
of the day-<strong>to</strong>-day variations in temperature, precipitation,<br />
cloud cover, wind and other atmospheric conditions that<br />
normally occur there. But climate is more than just the<br />
sum of these average values. It is also defined by the<br />
variability of individual climate elements such as<br />
temperature or precipitation and by the frequency with<br />
which various kinds of weather conditions occur. Indeed,<br />
any fac<strong>to</strong>r which is characteristic of a particular location’s<br />
weather pattern is part of its climate.<br />
Although the very notion of climate assumes a long-term<br />
consistency and stability in these patterns, climate is<br />
nevertheless a changeable phenomenon. The order of<br />
change may be small and relatively short – an abnormally<br />
cold winter here, a dry summer there. Or – like the great<br />
ice ages that have come and gone over thousands of years<br />
– it may be on a scale of geological immensity.<br />
Our focus here will be on changes that can be expected <strong>to</strong><br />
occur over the next few decades and centuries, since it is<br />
within this relatively short time span that the first major<br />
effects of human induced global warming are likely <strong>to</strong> be<br />
felt. But <strong>to</strong> understand how these changes are coming<br />
about, we must also extend our timeframe and look at the<br />
long record of climate change in the past. From this we<br />
can obtain a better understanding of the natural variability<br />
of Earth’s climate and the processes involved in its often<br />
spectacular oscillations. Before doing so, however, we<br />
need <strong>to</strong> examine the physical forces that govern the flow<br />
of energy through the atmosphere, for it is these that<br />
ultimately determine the principal characteristics of<br />
our planet’s climate.<br />
THE NATURAL GLOBAL CLIMATE SYSTEM<br />
The global heat engine<br />
1<br />
CHAPTER<br />
In a very simple way, the Earth’s climate system can be<br />
thought of as a giant heat engine, driven by incoming<br />
short wave energy from the sun. As the solar energy enters<br />
the engine, it warms the Earth and surrounding air, setting<br />
the atmospheric winds and the ocean currents in<strong>to</strong> motion<br />
and driving the evaporation-precipitation processes of the<br />
water cycle. The result of these motions and processes is<br />
weather and, hence, climate.<br />
All of the energy entering the climate system eventually<br />
leaves it, returning <strong>to</strong> space as long wave infrared<br />
radiation. As long as this energy leaves at the same rate<br />
as it enters, our atmospheric heat engine will be in balance<br />
and the Earth’s average temperature will remain relatively<br />
constant. However, if the rate at which energy enters or<br />
leaves the climate system changes, the balance will be<br />
upset and global temperatures will change until the<br />
system adjusts itself and reaches a new equilibrium.<br />
1
<strong>An</strong> <strong>Introduction</strong> <strong>to</strong> <strong>Climate</strong> <strong>Change</strong><br />
The flow of energy through the system is regulated by<br />
certain gases and particles within the atmosphere.<br />
Surprisingly, however, the largest constituents of the<br />
atmosphere play little or no part in this process. Although<br />
99% of the dry atmosphere is made up of molecules of<br />
nitrogen and oxygen (Table 1), these gases are<br />
comparatively transparent <strong>to</strong> radiation and have little effect<br />
on the energy passing through them. It is the remaining<br />
1% of the atmosphere, <strong>to</strong>gether with water vapour and<br />
clouds, that play the major part in regulating the crucial<br />
energy flows that drive climate processes. This 1% is made<br />
up of a variety of particles and gases that reflect, absorb,<br />
and re-emit significant amounts of both incoming solar<br />
radiation and outgoing heat energy.<br />
TABLE 1<br />
Concentration of various gases in dry air (% by volume)<br />
Nitrogen 78.08 Helium 0.0005<br />
Oxygen 20.95 Methane 0.00017<br />
Argon 0.93 Hydrogen 0.00005<br />
Carbon Dioxide 0.03 Nitrous Oxide 0.00003<br />
Neon 0.0018 Ozone Variable<br />
Source: CRC Handbook of Chemistry and Physics. *82nd Edition.<br />
FIGURE 1.1<br />
Energy flow<br />
in the global<br />
climate system<br />
2<br />
Source: Kiehl and Trenberth 1997.<br />
Incoming solar radiation<br />
Averaged around the world, the amount of sunlight<br />
entering the atmosphere is about 342 watts per square<br />
metre (W/m 2 ). However, about 107 W/m 2 (31%) of this<br />
incoming short wave energy is reflected back <strong>to</strong> space by<br />
the atmosphere and the Earth’s surface. The remaining<br />
235 W/m 2 (about 69%) is absorbed within the atmosphere<br />
and by the Earth’s surface as the fuel that drives the global<br />
climate system.<br />
The left side of Figure 1.1 shows how this incoming<br />
energy is reflected and absorbed by the atmosphere and<br />
surface. The processes are as follows:<br />
■ Reflection by the atmosphere and Earth’s surface –<br />
Clouds and aerosols within the atmosphere reflect and<br />
scatter a significant amount of incoming solar radiation<br />
back <strong>to</strong> space. Aerosols are fine particles and droplets<br />
suspended for an extended period of time within the<br />
atmosphere. Highly reflective aerosols include tiny droplets<br />
of sulphuric acid from volcanic eruptions, sulphates from<br />
surface fires and industrial processes, salt from sea spray<br />
and dust. The amount of shortwave radiation returned <strong>to</strong>
CHAPTER 1 | EARTH’ S NATURAL CLIMATE<br />
space by clouds and aerosols varies considerably with time<br />
and from one location <strong>to</strong> another. For example, major<br />
volcanic eruptions can abruptly produce large amounts of<br />
highly-reflecting sulphate aerosols in the stra<strong>to</strong>sphere that<br />
can remain there for several years before they settle out<br />
due <strong>to</strong> the forces of gravity. Alternatively, human emissions<br />
of sulphate aerosols in<strong>to</strong> the lower atmosphere can<br />
significantly increase the reflection of incoming sunshine<br />
in industrialized regions compared <strong>to</strong> less polluted areas<br />
of the world. However, observational data indicate that,<br />
on average, clouds and aerosols currently reflect about<br />
77 W/m 2 (22.5%) of incoming radiation back <strong>to</strong> space.<br />
The Earth’s surface also reflects a significant amount of<br />
incoming sunshine back <strong>to</strong> space. Like the atmosphere,<br />
the amount of reflection depends on the time of year and<br />
the location. That is because snow and ice, which cover<br />
much of the Earth’s surface in mid <strong>to</strong> high latitudes in<br />
winter, are highly reflective. On the other hand, ice-free<br />
oceans surfaces and bare soils are low reflec<strong>to</strong>rs. However,<br />
when averaged over time and space, the Earth’s surface<br />
reflects 30 W/m 2 (almost 9%) of the solar radiation<br />
entering the atmosphere back <strong>to</strong> space. Hence, in <strong>to</strong>tal, the<br />
atmosphere and Earth’s surface return about 31% of the<br />
incoming solar radiation back <strong>to</strong> space, unused by the<br />
climate system.<br />
■ Absorption in the atmosphere – In addition <strong>to</strong><br />
reflecting and scattering solar radiation, the atmosphere<br />
also absorbs 67 W/m 2 (almost 20%) of this energy. About<br />
two thirds of this absorption is caused by water vapour.<br />
A second significant absorber is the ozone layer in the<br />
stra<strong>to</strong>sphere, which absorbs much of the ultraviolet part<br />
of incoming solar energy. Thus, this layer not only protects<br />
the Earth’s ecosystem from the harmful effects of this<br />
radiation but also retains a portion of the sun’s energy in<br />
the upper atmosphere. About one-tenth of the absorption<br />
can be attributed <strong>to</strong> clouds. Finally, a small fraction of the<br />
absorption can be attributed <strong>to</strong> other gases and <strong>to</strong> aerosols<br />
(particularly dark aerosols such as soot).<br />
Outgoing heat radiation<br />
The Earth’s atmosphere and surface, heated by the sun’s<br />
rays, eventually release all of this energy back <strong>to</strong> space by<br />
giving off long-wave infrared radiation. When the climate<br />
system is in equilibrium, the <strong>to</strong>tal amount of energy<br />
released back <strong>to</strong> space by the climate system must, on<br />
average, be the same as that which it absorbs from the<br />
incoming sunlight – that is, 235 W/m 2 . However, as this<br />
infrared radiation travels <strong>to</strong>wards space, it encounters<br />
several major obstacles – primarily clouds and absorbing<br />
gases. The right side of Figure 1.1 illustrates the processes<br />
involved. These can be described as follows:<br />
■ Clouds – Besides reflecting incoming solar radiation,<br />
clouds also absorb large quantities of outgoing heat<br />
radiation. The energy absorbed by the clouds is reradiated,<br />
much of it back <strong>to</strong> the surface. That is why air near the<br />
Earth’s surface is usually much warmer on a cloudy night<br />
than on a clear one. The amount of radiation absorbed and<br />
returned depends on the amount, thickness and type of<br />
cloud involved.<br />
■ Absorbing gases – A number of naturally occurring<br />
minor gases within the atmosphere, most of which are<br />
relatively transparent <strong>to</strong> incoming sunlight, absorb most<br />
of the infrared heat energy being transmitted by the Earth<br />
<strong>to</strong>wards space. This absorbed energy is then radiated in<br />
all directions, some back <strong>to</strong> the surface and some upwards<br />
where other absorbing molecules at higher levels in the<br />
atmosphere are ready <strong>to</strong> absorb the energy again.<br />
Eventually the absorbing molecules in the upper part of<br />
the atmosphere emit the energy directly <strong>to</strong> space. Hence,<br />
these gases make the atmosphere opaque <strong>to</strong> outgoing heat<br />
radiation, much as opaque glass will affect the<br />
transmission of visible light. Together with clouds, they<br />
provide an insulating blanket around the Earth, keeping it<br />
warm. Because greenhouses retain heat in somewhat the<br />
same way, this phenomenon has been called the greenhouse<br />
effect, and the absorbing gases that cause it, greenhouse<br />
gases. Important naturally occurring greenhouse gases<br />
include water vapour, carbon dioxide, methane, ozone<br />
and nitrous oxide.<br />
The magnitude of the natural greenhouse effect can be<br />
estimated fairly easily. Theoretically, the average surface<br />
temperature required <strong>to</strong> release 235 W/m 2 <strong>to</strong> space<br />
is -19°C, but no more. Yet we know from actual<br />
measurements that the Earth’s average surface temperature<br />
3
<strong>An</strong> <strong>Introduction</strong> <strong>to</strong> <strong>Climate</strong> <strong>Change</strong><br />
is more like +14°C, some 33°C higher. This additional<br />
warming is a result of the greenhouse effect. It is enough<br />
<strong>to</strong> make the difference between a planet that can support<br />
life and one like the moon that cannot.<br />
CLIMATIC BALANCE<br />
<strong>Climate</strong> is ultimately a consequence of the way the<br />
atmosphere and the oceans redistribute heat energy that<br />
the Earth has absorbed from the sun. Because the intensity<br />
of the solar radiation changes with latitude, time of day<br />
and seasons, all parts of the planet are not heated equally.<br />
The heating effect is greatest in the tropics, where more<br />
energy is received from the sun then is re-radiated back <strong>to</strong><br />
space (Figure 1.2). Temperatures there are subsequently<br />
much warmer than the global average and remain<br />
consistently within a few degrees of 30°C. At the opposite<br />
extreme, the Earth’s polar regions experience a net loss of<br />
energy <strong>to</strong> space and temperatures can vary from highs of<br />
nearly 20°C in northern polar summers <strong>to</strong> a low of -60°C<br />
in southern polar winters.<br />
This large temperature difference between the tropics and<br />
the poles is the primary driving force for Earth’s<br />
atmospheric winds and ocean currents. Essentially, these<br />
carry warm air and ocean waters from the equa<strong>to</strong>r <strong>to</strong> the<br />
FIGURE 1.2<br />
Net annual heating imbalance by latitude<br />
Source:IPCC SAR WGI 1995.<br />
4<br />
poles while cold air and ocean waters move in the<br />
opposite direction. This flow is modified, however, by the<br />
Earth’s spin about its axis and the effects of land masses<br />
and <strong>to</strong>pography <strong>to</strong> produce a complex pattern of vertical<br />
and horizontal circulation of air masses and ocean waters.<br />
Much of the sun’s energy absorbed at the Earth’s surface is<br />
used <strong>to</strong> evaporate water from ocean and land surfaces and<br />
from vegetation. The more heat at the surface and the<br />
warmer the air temperature, the greater the amount of<br />
water vapour that can evaporate in<strong>to</strong> and be retained in<br />
the atmosphere. However, once air becomes saturated with<br />
water vapour, it condenses again in<strong>to</strong> tiny water droplets<br />
or ice crystals that form clouds. When the conditions are<br />
right, these droplets or crystals fall <strong>to</strong> the ground as<br />
precipitation. Where, when, how much and what type<br />
of precipitation falls will depend on the characteristics<br />
of a range of local atmospheric and surface fac<strong>to</strong>rs.<br />
Furthermore, since atmospheric moisture is also<br />
transported horizontally by air currents, the precipitation<br />
patterns that emerge around the Earth are also influenced<br />
by the global atmospheric circulation patterns. As a result,<br />
the distribution of precipitation around the globe presents<br />
an even more complex pattern than that for atmospheric<br />
temperature (Figure 1.3). Some areas receive large<br />
surpluses of rainfall which support very lush, rich<br />
ecosystems, while others do not receive enough <strong>to</strong><br />
nourish vegetation and so become deserts.<br />
Numerous other fac<strong>to</strong>rs also affect the Earth’s climate. In<br />
addition <strong>to</strong> the circulation of the air, the currents of the<br />
ocean and the surface properties that influence evaporation<br />
processes, we must also consider the effects of clouds and<br />
large masses of snow and ice, the influence of <strong>to</strong>pography<br />
and the impact of processes and activities within the<br />
biosphere. To these we must add the differences in solar<br />
heating, not only between regions, but between seasons<br />
and even between night and day.<br />
All of these elements are interconnected, interacting parts<br />
of the climate system (Figure 1.4). If a change in one of<br />
these parts upsets the balance of that system, it is likely <strong>to</strong><br />
initiate complex reactions in some or all of the other parts<br />
as the system adjusts <strong>to</strong> establish a new equilibrium. Some
CHAPTER 1 | EARTH’ S NATURAL CLIMATE<br />
FIGURE 1.3<br />
Estimated<br />
distribution of<br />
average rainfall<br />
over the Earth’s<br />
surface, in<br />
mm/day<br />
Source: NOAA Global Precipitation Clima<strong>to</strong>logy Project<br />
reactions occur very rapidly, while others occur very, very<br />
slowly. Furthermore, some may increase the initial change<br />
(a process known as a positive feedback), while others may<br />
oppose and partially offset it (a negative feedback). For<br />
example, anything that changes the amount of solar energy<br />
entering the atmosphere or the amount of this energy<br />
absorbed by the atmosphere will alter the amount of input<br />
energy that drives the climate system. Likewise, a change<br />
in the net amount of energy released by the climate system<br />
back <strong>to</strong> space will cause a change in the Earth’s cooling<br />
mechanism. These initial changes will cause reactions and<br />
feedbacks in the rest of the system until it adjusts <strong>to</strong> a new<br />
balance between the incoming and outgoing energy at the<br />
<strong>to</strong>p of the atmosphere.<br />
Possible causes for such primary changes in absorbed<br />
incoming sunlight or emitted heat energy (called climate<br />
forcings) include variations in the concentrations of<br />
aerosols and greenhouse gases in the atmosphere, changes<br />
in the reflective properties of the Earth’s surface, and<br />
alterations in the intensity of sunlight reaching the Earth’s<br />
1 2 3 4 5 6 7 8<br />
atmosphere. It is clear from studies of past climates that<br />
such changes are constantly taking place – on time scales<br />
varying from months <strong>to</strong> millions of years, and at spatial<br />
scales from local and regional <strong>to</strong> global. Yet, remarkably,<br />
reconstructions of past temperature patterns suggest that<br />
these natural fluctuations, though sufficient <strong>to</strong> cause<br />
tremendous shifts in global ecosystems, have for many<br />
millions of years remained within a relatively narrow<br />
margin needed <strong>to</strong> support terrestrial life.<br />
CLIMATE OF THE PAST<br />
Reconstructing climate<br />
Earth’s natural climate system is in fact in a constant state<br />
of change. It is a dynamic system. Forces, both internal<br />
and external, are continually altering the delicate balances<br />
that exist within and between each of its components.<br />
Evidence from the Earth’s soils, its ocean and lake bot<strong>to</strong>m<br />
sediments, its coral reefs, its ice caps, and even its<br />
vegetation provides a clear indication that major changes<br />
5
<strong>An</strong> <strong>Introduction</strong> <strong>to</strong> <strong>Climate</strong> <strong>Change</strong><br />
FIGURE 1.4<br />
Complex array<br />
of components<br />
and feedbacks<br />
within the global<br />
climate system<br />
in climate have occurred naturally in the past. This<br />
evidence also suggests that such changes are likely <strong>to</strong><br />
occur again in the future.<br />
Our most accurate information about past climates comes<br />
from the data collected over the past 100 <strong>to</strong> 150 years at<br />
climate and other observing stations. Recorded by trained<br />
observers using precision instruments, this information is<br />
not only reasonably reliable but also very comprehensive,<br />
covering daily and even hourly variations in conditions<br />
over almost all inhabited regions of the globe. Over the<br />
past few decades, these data have been complemented by<br />
measurements of surface and atmospheric conditions taken<br />
by advanced instruments on satellite platforms. Both types<br />
of records have become extremely useful databases for<br />
identifying and analyzing climate patterns of the past<br />
century or so, and even relatively small fluctuations in<br />
them.<br />
To study larger climate fluctuations over longer periods of<br />
time, science must turn <strong>to</strong> ‘proxy’ data sources – that is,<br />
indirect evidence from which the nature of previous<br />
6<br />
Source: IPCC TAR WGI 2001.<br />
climate conditions can be inferred or derived. For<br />
example, written accounts of weather conditions,<br />
especially in regions like Europe and Asia where extensive<br />
documentation exists, can provide a useful basis for the<br />
analysis of some aspects of climates over the past 1000<br />
years. Though they lack the reliable quantitative data of<br />
recent records, these documents can nevertheless yield<br />
considerable qualitative information about former climates.<br />
For areas lacking anecdotal records, and for times beyond<br />
the last millennium, however, the reconstruction of climate<br />
his<strong>to</strong>ry must rely primarily on the rich supply of<br />
paleoclimatic indica<strong>to</strong>rs that the Earth itself provides. Plant<br />
pollens deposited deep within old bogs, lake and ocean<br />
bot<strong>to</strong>m sediments, and even ice caps can bear witness <strong>to</strong><br />
the nature of growing seasons at the time of their<br />
deposition. Residues of aquatic life forms in lake sediments<br />
attest <strong>to</strong> past fresh water temperatures, quality and<br />
abundance, while ocean sediments and corals reveal<br />
information about ocean temperature and salinity. Old<br />
beaches indicate former shorelines and hence sea levels.<br />
Even the air pockets fossilized within the frozen ice sheets
CHAPTER 1 | EARTH’ S NATURAL CLIMATE<br />
of polar and alpine regions tell of the composition of<br />
ancient air masses, while the ice that surrounds them<br />
provides information about their temperatures and about<br />
the atmospheric transport mechanisms that influenced<br />
them. Tree rings, soil composition and structure and the<br />
vertical thermal profile of the Earth’s crust also tell their<br />
s<strong>to</strong>ries. From this varied and spotty assortment of clues,<br />
paleoscientists have given us enough information <strong>to</strong><br />
construct a relatively continuous, though admittedly<br />
fragmented picture of the world’s surface temperature<br />
patterns and trends over the past one million years<br />
and beyond.<br />
The past million years<br />
Some idea of the his<strong>to</strong>ry of Earth’s climate behaviour<br />
during the past one-half million years can be gleaned from<br />
temperature records for <strong>An</strong>tarctica reconstructed from ice<br />
core data (Figure 1.5). Temperatures during much of<br />
this period seem <strong>to</strong> have followed a cycle of long-term,<br />
quasi-periodic variations. Extreme minimum temperatures,<br />
corresponding <strong>to</strong> major global glaciations, appear <strong>to</strong><br />
FIGURE 1.5<br />
Trends in <strong>An</strong>tarctic<br />
temperature and<br />
greenhouse gas<br />
concentration<br />
over the past<br />
420 000 years<br />
Source: IPCC TAR WGI 2001<br />
have occurred at roughly 100 000-year intervals. Each of<br />
the glacial periods has then been followed by a dramatic<br />
4-6°C warming <strong>to</strong> an interglacial state. Within this<br />
100 000-year cycle, smaller anomalies have occurred<br />
at approximately 20 000 and 40 000-year intervals.<br />
Many theories have been advanced <strong>to</strong> explain these<br />
temperature variations. The most widely accepted<br />
hypothesis for explaining the variations that occur on<br />
time scales of about 20 000, 40 000 and 100 000 years<br />
is changes in the wobble (called precession) and tilt<br />
(obliquity) of the Earth’s rotation axis relative <strong>to</strong> Earth’s<br />
orbit around the sun, and the ovalness (eccentricity) of<br />
that orbit, respectively. These changes affect the seasonality<br />
and latitudinal distribution of incoming sunlight around<br />
the Earth. However, while the large glacial-interglacial<br />
cycles that occur at the 100 000 year time scale correlate<br />
well with changes in orbit eccentricity, the forcing caused<br />
by those changes is far <strong>to</strong>o weak <strong>to</strong> fully explain these<br />
cycles. Hence, various feedback processes appear <strong>to</strong><br />
significantly amplify this forcing.<br />
7
<strong>An</strong> <strong>Introduction</strong> <strong>to</strong> <strong>Climate</strong> <strong>Change</strong><br />
Recent analyses of <strong>An</strong>tarctic and Greenland ice cores also<br />
indicate a strong correlation between past long-term<br />
changes in climate and the natural atmospheric<br />
concentrations of carbon dioxide (CO2), methane (CH4)<br />
and nitrous oxide (N2O), all important greenhouse<br />
gases. As Figure 1.5 indicates, the correspondence<br />
between atmospheric carbon dioxide and methane<br />
concentrations and local <strong>An</strong>tarctic temperatures during the<br />
past 420 000 years has been remarkable. This relationship<br />
would suggest that one of the primary feedback<br />
mechanisms that amplify long-term external changes <strong>to</strong><br />
the atmosphere’s energy balance, like those caused by<br />
orbital cycles, may involve the greenhouse effect.<br />
The current interglacial period, often referred <strong>to</strong> as the<br />
Holocene, has now existed for more than 10 000 years.<br />
During this period, temperatures in at least some parts of<br />
the world, particularly during summers in mid <strong>to</strong> high<br />
latitudes of the Northern Hemisphere, peaked at about<br />
5000 <strong>to</strong> 6000 years before present (YBP) and have cooled<br />
FIGURE 1.6<br />
8<br />
slightly since then. This interglacial warm peak is<br />
commonly referred <strong>to</strong> as the Holocene maximum.<br />
However, it remains uncertain as <strong>to</strong> whether this warm peak<br />
also occurred in low latitudes. In fact, recent model studies<br />
suggest that changes in solar insolation during the mid-<br />
Holocene would have favored warmer summers but cooler<br />
winters, and that global annual mean temperatures at the<br />
time may have actually been slightly cooler than <strong>to</strong>day.<br />
These slow millennial scale changes in global climate have<br />
also imposed a number of vastly differing climates on what<br />
is now Canada. By examining these variations, we can also<br />
better put Canada’s present climate in context and find<br />
clues pointing <strong>to</strong> the kinds of changes it might undergo in<br />
the future. These suggest that the pattern of change can be<br />
complex, with some parts of Canada’s summer climate<br />
being significantly warmer, drier and windier 6000 years<br />
ago than that of <strong>to</strong>day, and other parts being cooler and<br />
wetter (Figure 1.6).<br />
Estimates of changes in North American July climate between 6000 years ago and <strong>to</strong>day, based on pollen data<br />
analyses<br />
(A) (B)<br />
Temperature (°C) Precipitation (%)<br />
Source: Gajewski et al. 2000.
CHAPTER 1 | EARTH’ S NATURAL CLIMATE<br />
The last 2000 years<br />
Figure 1.7 illustrates how average temperatures of the<br />
Northern Hemisphere have likely varied during the past<br />
2000 years. Based on several studies using multiple proxy<br />
data sources at many different locations around the world,<br />
it suggests that average temperatures <strong>to</strong>day are now<br />
warmer than at any previous time during the past two<br />
millennia. However, current temperatures are still perhaps<br />
1-2°C cooler than the peak of the last interglacial of<br />
135 000 YBP.<br />
FIGURE 1.7<br />
Reconstruction of Northern Hemispheric mean annual<br />
temperatures for the past 2000 years based on multiproxy<br />
data analyses<br />
Temperature <strong>Change</strong> ( o C)<br />
1.5<br />
1<br />
0.5<br />
0<br />
-0.5<br />
-1<br />
-1.5<br />
0<br />
Proxy Reconstruction Data<br />
200<br />
400<br />
600<br />
Source: Moberg et al. 2005<br />
800<br />
2000<br />
1800<br />
1600<br />
1400<br />
1200<br />
1000<br />
Years (AD)<br />
Instrumental Data<br />
For fluctuations on shorter century time scales, there have<br />
been encouraging results from efforts at correlating<br />
changes in solar irradiance cycles with temperature<br />
patterns. Such comparisons, for example, indicate that<br />
solar forcing may have been a key fac<strong>to</strong>r in triggering the<br />
‘little ice ages’ that have occurred during the current<br />
Holocene. Likewise, much of the variations in climate over<br />
the past three hundred years appear <strong>to</strong> be closely linked <strong>to</strong><br />
solar variability. However, the mechanisms by which<br />
relatively small change in solar irradiance can significantly<br />
affect climate are as yet not well unders<strong>to</strong>od.<br />
While Figure 1.7 indicates that Northern Hemispheric<br />
temperatures during the Medieval period of about 1000<br />
years ago were, on average, likely still cooler than <strong>to</strong>day,<br />
some regions may have been somewhat warmer than<br />
<strong>to</strong>day. Studies suggest these regions include western<br />
Europe, Greenland and eastern Canada. Since this<br />
‘Medieval Warm Period’ lasted several hundred years,<br />
treelines and other natural vegetation boundaries gradually<br />
moved northwards. Milder Arctic climates brought<br />
substantial decreases in sea ice cover. These conditions<br />
may have encouraged not only the migration of Inuit<br />
within the Arctic but also the survival and settlement of<br />
the European Vikings in Iceland and Greenland. Vikings<br />
appear <strong>to</strong> have navigated freely throughout much of the<br />
<strong>Canadian</strong> archipelago, and in Greenland they were able <strong>to</strong><br />
carry on a viable agriculture. Ironically, European attempts<br />
from the seventeenth <strong>to</strong> the nineteenth centuries <strong>to</strong> find a<br />
northwest passage <strong>to</strong> India failed. This was primarily<br />
because they began after the Medieval Warm Period gave<br />
way <strong>to</strong> the Little Ice Age, which lasted from 1400 <strong>to</strong> about<br />
1850 AD. If only Franklin had tried his passage six<br />
centuries earlier! Since regional temperatures have now<br />
returned <strong>to</strong> something similar <strong>to</strong> the Medieval Warm<br />
Period, it is likely that the vegetation and ice regimes that<br />
prevailed years ago will return, even if climates do not<br />
become any warmer than they are now.<br />
The last hundred years<br />
Climatic change during the past century can be studied<br />
with much greater precision than earlier periods, thanks <strong>to</strong><br />
the existence of a large body of scientifically collected<br />
climate records. These records make it possible <strong>to</strong> analyze<br />
both the spatial and temporal patterns of change in<br />
significantly finer detail and with a smaller margin of error.<br />
Studies of these records show that, even within the<br />
relatively short span of a century, global climate has<br />
experienced noticeable variations (Figure 1.8). Average<br />
temperatures over southern Canada for these years show<br />
much the same broad pattern as global temperatures —<br />
a warming until the early 1940s, then a moderate cooling<br />
until the mid-1970s, followed by a renewed and<br />
pronounced warming continuing through the 2000s<br />
(Figure 1.9). Temperatures in the 1990s were among<br />
the warmest on record, with 1998 being the warmest<br />
individual year on record for both Canada and the<br />
world. The variability in the warming also holds true<br />
for the temperature records that cover all of Canada<br />
since 1950.<br />
9
<strong>An</strong> <strong>Introduction</strong> <strong>to</strong> <strong>Climate</strong> <strong>Change</strong><br />
FIGURE 1.8<br />
Observed changes of average global surface temperatures<br />
since 1880.<br />
0.8<br />
0.6<br />
0.4<br />
0.2<br />
0<br />
-0.2<br />
-0.4<br />
-0.6<br />
1880 1900 1920 1940<br />
Year<br />
1960 1980 2000<br />
While Canada as a whole has experienced an increase in<br />
temperature of slightly more than 1°C over the last<br />
54 years, this temperature increase has not been evenly<br />
distributed across the country. Some regions, like the<br />
Yukon and Northwest Terri<strong>to</strong>ries, are experiencing greater<br />
warming, whereas over Baffin Island in the eastern<br />
Arctic there has actually been some moderate cooling<br />
(Figure 1.10).<br />
10<br />
Degrees C<br />
Data source: NOAA<br />
FIGURE 1.9<br />
Observed trends in temperatures across southern Canada<br />
since 1900 and all of Canada since 1948<br />
Temperature anomaly (°C)<br />
2.0<br />
1.0<br />
0<br />
-1.0<br />
1.0<br />
1.0<br />
0<br />
Southern Canada<br />
All of Canada<br />
1900 1920 1940 1960 1980 2000<br />
Year<br />
Source: Zhang et at. 2000 (updated 2005)<br />
FIGURE 1.10<br />
Regional distribution of linear temperature trends (°C)<br />
observed across Canada between 1948 and 2003<br />
The symbol X indicates areas where the trends are statistically significant.<br />
Source: Zhang et at. 2000 (updated 2005)<br />
Precipitation patterns have also changed. For the most<br />
part precipitation amounts have increased significantly<br />
over the Northwest Terri<strong>to</strong>ries and Nunavut, with increases<br />
over much of the rest of the country. The only exceptions<br />
are little <strong>to</strong> slight decreases in precipitation over the<br />
Prairies and over the eastern edge of Baffin Island.<br />
(Figure 1.11).<br />
FIGURE 1.11<br />
Regional distribution of linear precipitation trends (%)<br />
observed across Canada between 1948 and 2003<br />
The symbol X indicates areas where the trends are statistically significant.<br />
Source: Zhang et at. 2000 (updated 2005)
CHAPTER 1 | EARTH’ S NATURAL CLIMATE<br />
SEASONAL AND DAILY CHANGES IN CANADA’S CLIMATE<br />
<strong>Change</strong>s in seasonal temperatures show another aspect of the complex pattern of Canada’s temperature<br />
trends. When comparing the four seasons, winter and spring show the greatest changes in<br />
temperatures, whereas summer and autumn show much smaller changes (Figure 1.12). Regionally, the<br />
Prairies show the greatest warming in the spring and show some cooling in autumn. The eastern Arctic<br />
experiences the greater cooling in the winter, but conversely shows a warming trend in the summer.<br />
FIGURE 1.12<br />
Trends (in °C) in <strong>Canadian</strong> climates<br />
since 1950, shown by season<br />
These maps illustrate that, at a<br />
regional scale, the national trends<br />
<strong>to</strong> warmer climates have been<br />
modified by shifts in seasonal wind<br />
patterns. By altering the net flow<br />
of cold and warm air masses in<br />
different patterns of the country,<br />
these shifts have amplified<br />
warming in some areas and<br />
seasons and offset it in others.<br />
This provides an important<br />
reminder that future climate<br />
change will not be uniform in<br />
space or time.<br />
<strong>An</strong>other way <strong>to</strong> analyze the changes in temperature is <strong>to</strong> examine the changes in the maximum daytime<br />
temperatures and the nighttime minimum temperatures. When the changes in maximum temperatures are<br />
subtracted from the changes in minimum temperatures, the diurnal temperature range (DTR) is calculated<br />
(Figure 1.13) The DTR shows that for most of the areas over Canada since 1950, the maximum<br />
temperatures have been increasing slightly faster than the<br />
minimum temperatures. Only areas in the Arctic islands<br />
and southern Quebec have had minimum temperatures<br />
increasing faster.<br />
FIGURE 1.13<br />
<strong>Change</strong> (in °C) in the average annual DTR across<br />
Canada since 1950<br />
Winter<br />
Summer<br />
°C<br />
Spring<br />
Autumn<br />
11
<strong>An</strong> <strong>Introduction</strong> <strong>to</strong> <strong>Climate</strong> <strong>Change</strong><br />
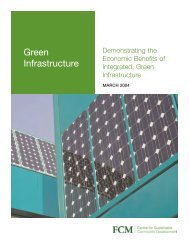
12<br />
▲ Observed sea ice in September 1979<br />
▲ Observed sea ice in September 2005<br />
Source: NASA/Goddard Space Flight Center Scientific Visualization Studio
Enhancing the<br />
greenhouse effect<br />
<strong>An</strong>alyses of ice cores extracted from the polar ice caps<br />
provide some important clues about the past<br />
relationship between the natural greenhouse effect and the<br />
Earth’s climate. The <strong>An</strong>tarctic and Greenland cores – the<br />
deepest which penetrated more than 2 km beneath the<br />
south polar ice – have been especially informative. From<br />
them, scientists have reconstructed local temperatures as<br />
well as records of carbon dioxide, methane and nitrous<br />
oxide concentrations in the polar regions for the past<br />
420 000 years.<br />
When compared, these reconstructed temperature and<br />
greenhouse gas records show a remarkable correlation,<br />
particularly during the transition from cold glacial periods<br />
<strong>to</strong> warm interglacials (see Figure 1.5 in Chapter 1). The<br />
processes that cause this relationship are as yet not well<br />
unders<strong>to</strong>od. However, most experts agree that changes in<br />
solar radiation due <strong>to</strong> variations in the Earth’s orbit around<br />
the Sun likely triggered the initial changes in climates.<br />
These changes in climate seem <strong>to</strong> have induced major<br />
changes in atmospheric and ocean circulations and in the<br />
flux of greenhouse gases in<strong>to</strong> and out of the atmosphere.<br />
Because of the role of greenhouse gases in insulating heat<br />
loss from the planet, the resultant changes in their<br />
atmospheric concentrations played an important part in<br />
enhancing the initial changing in climate and thus<br />
contributing substantially <strong>to</strong> the very large magnitude of<br />
differences in average global temperatures between glacial<br />
and interglacial conditions.<br />
While the ice cores confirm that the concentrations of<br />
greenhouse gases vary naturally with time, they also<br />
indicate that there are natural limits <strong>to</strong> these variations.<br />
During the past 420 000 years, carbon dioxide<br />
concentrations have never gone lower than approximately<br />
180 parts per million by volume (ppmv). Nor, until<br />
recently, had they ever gone higher than about 300 ppmv.<br />
Likewise, concentrations of methane have remained within<br />
a relatively narrow range of 0.3 <strong>to</strong> 0.7 ppmv.<br />
However, recent measurements of greenhouse gas<br />
concentrations over the past several centuries, again<br />
obtained from ice cores, reveal that a major departure from<br />
past patterns is emerging. This is supported by direct<br />
measurements of atmospheric composition trends of the<br />
past few decades, which show average carbon dioxide<br />
concentrations around the world in 2003 greater than<br />
375 ppmv. As figure 1.5 shows, such levels exceed the<br />
highest values of the past 420 000 years by more than<br />
20%. In fact, long term paleo records from ocean<br />
sediments suggest these levels may be without precedence<br />
in at least the past 20 million years. Meanwhile, methane<br />
concentrations appear <strong>to</strong> have more than doubled over<br />
pre-industrial values, while nitrous oxide levels have<br />
undergone a more modest increase of 17%. If, indeed,<br />
these gases are primary players in the natural greenhouse<br />
effect, their increasing concentrations portend a possible<br />
enhancement of that effect well beyond the level suggested<br />
by the ice core record.<br />
During recent years, intensive research has been devoted<br />
<strong>to</strong> measuring the concentrations of these gases more<br />
accurately. At the same time, scientists have been working<br />
hard <strong>to</strong> better understand the processes involved in their<br />
release and removal from the atmosphere and <strong>to</strong> estimate<br />
likely concentrations in the future.<br />
CARBON DIOXIDE<br />
2<br />
CHAPTER<br />
Understanding how the amount of carbon dioxide in the<br />
atmosphere changes is not a simple task. Carbon dioxide<br />
is constantly being removed from the air by its direct<br />
absorption in<strong>to</strong> water and by the transfer of the carbon<br />
13
<strong>An</strong> <strong>Introduction</strong> <strong>to</strong> <strong>Climate</strong> <strong>Change</strong><br />
a<strong>to</strong>m <strong>to</strong> biotic substances through pho<strong>to</strong>synthesis. In turn<br />
it is released in<strong>to</strong> the air by plant and animal respiration,<br />
decay of dead biomass and soil organic matter, outgassing<br />
from water surfaces, and combustion. Small amounts of<br />
carbon dioxide are also injected directly in<strong>to</strong> the<br />
atmosphere by volcanic emissions, and through slow<br />
geological processes such as the weathering of rock.<br />
The more active carbon s<strong>to</strong>rage areas within the Earth’s<br />
ecosystem are the living terrestrial biosphere, the<br />
atmosphere and the oceans. These contain about 600, 750<br />
and 39 000 billion <strong>to</strong>nnes of carbon, respectively. The<br />
atmosphere exchanges about 90 billion <strong>to</strong>nnes of carbon<br />
with the oceans each year and approximately 60 billion<br />
<strong>to</strong>nnes per year with the terrestrial biosphere.<br />
The Earth’s soils, rocks and carbon based fuels are also<br />
large reservoirs of carbon. Estimates suggest that soils may<br />
contain up <strong>to</strong> 1600 billion <strong>to</strong>nnes of carbon. Fossil carbon<br />
fuels contain about 5000 billion <strong>to</strong>nnes, while rocks s<strong>to</strong>re<br />
much more (an estimated 75 million billion <strong>to</strong>nnes).<br />
However, these reservoirs, unless unnaturally disturbed,<br />
only exchange carbon with the atmosphere very slowly<br />
and over thousands <strong>to</strong> millions of years.<br />
If, over time, more of the carbon in the terrestrial and<br />
ocean reservoirs is released in<strong>to</strong> the atmosphere than is<br />
removed, a net increase of carbon in the atmosphere (as<br />
carbon dioxide) results. Conversely, if more carbon is<br />
removed from the atmosphere than released in<strong>to</strong> it, its<br />
concentration in the atmosphere decreases. However, the<br />
evidence from ice cores indicates that the atmospheric<br />
concentration of carbon dioxide has remained relatively<br />
constant at 260 <strong>to</strong> 280 ppmv throughout the past 10 000<br />
years of the current interglacial - until several centuries<br />
ago. This means that the natural active flow of carbon<br />
between the atmosphere, the oceans and the atmosphere<br />
(often referred <strong>to</strong> as the global carbon budget) has been in<br />
remarkable balance. That is, on average, the amount<br />
released in<strong>to</strong> the atmosphere each year has been<br />
approximately equal <strong>to</strong> the amount removed again.<br />
Human activities now appear <strong>to</strong> be significantly affecting<br />
this natural balance within the global carbon cycle. This<br />
14<br />
anthropogenic contribution already began more than 8000<br />
years ago, when humans first began <strong>to</strong> clear lands and<br />
cultivate soils <strong>to</strong> support emerging civilizations. However,<br />
rapid human population growth during the past few<br />
centuries has resulted in large-scale conversions of forested<br />
landscapes <strong>to</strong> agricultural, urban or other uses. These<br />
conversions have released more than 100 billion <strong>to</strong>nnes of<br />
additional carbon in<strong>to</strong> the air over the past century, and<br />
have been accelerating in recent decades, primarily due <strong>to</strong><br />
extensive slash-and-burn activities in the tropical forests of<br />
South America, Africa and Southeast Asia. Although new<br />
growth from replanted forests in the mid-latitudes of the<br />
Northern Hemisphere may be partially offsetting this<br />
release, the net biospheric contribution of carbon in<strong>to</strong> the<br />
atmosphere directly due <strong>to</strong> human land use and land use<br />
change is estimated at between 0.6 and 2.5 billion <strong>to</strong>nnes<br />
per year.<br />
However, of much greater significance is the ever<br />
increasing extraction of fossil fuels (coal, oil and natural<br />
gas) from the Earth’s crust <strong>to</strong> meet the energy demands of<br />
an increasingly industrialized global society. During<br />
combustion, the carbon content of fossil fuels is oxidized<br />
and released as carbon dioxide. For every <strong>to</strong>nne of carbon<br />
burned, 3.7 <strong>to</strong>nnes of carbon dioxide are produced.<br />
Production of cement also adds a modest amount<br />
FIGURE 2.1<br />
Carbon content of annual carbon dioxide emissions from<br />
fossil fuel combustion and cement production, 1900-2000<br />
Billion <strong>to</strong>nnes of C per year<br />
8<br />
6<br />
4<br />
2<br />
0<br />
1900 1920 1940 1960 1980<br />
0<br />
2000<br />
Year<br />
7<br />
6<br />
5<br />
4<br />
3<br />
2<br />
1
CHAPTER 2 | ENHANCING THE GREENHOUSE EFFECT<br />
(approximately 2%) <strong>to</strong> these releases. During the 1990s,<br />
these sources on average added an estimated 6.4 billion<br />
metric <strong>to</strong>nnes of carbon, or about 23 billion <strong>to</strong>nnes of<br />
carbon dioxide, <strong>to</strong> the atmosphere each year. This is more<br />
than ten times the estimated rate of emissions one century<br />
ago (Figure 2.1).<br />
Not surprisingly, the release of carbon dioxide from fossil<br />
fuel burning is very unevenly distributed around the<br />
world, with the largest share being released by developed<br />
countries in the Northern Hemisphere. However,<br />
emissions are increasing more rapidly in many of the<br />
nations of the developing world (Figure 2.2), particularly<br />
in Southeast Asia.<br />
<strong>An</strong>thropogenic releases of carbon dioxide are actually<br />
relatively small compared <strong>to</strong> the truly enormous amounts<br />
that enter and leave the air each year through natural<br />
processes. In fact, human activities annually release about<br />
1/20 of the amount of carbon dioxide produced by nature.<br />
However, the human emissions provide a net addition <strong>to</strong><br />
FIGURE 2.2<br />
Regional distribution of CO 2 emissions from fossil fuel combustion, 1950 and 2000<br />
Other<br />
industrialized<br />
countries<br />
30%<br />
Eastern Europe<br />
& former USSR<br />
16%<br />
1950<br />
North America<br />
47%<br />
China<br />
1%<br />
Data source: CDIAC online.<br />
Other<br />
developing<br />
countries<br />
7%<br />
one side of a global carbon cycle that is already in<br />
approximate balance. Over time, this net addition can<br />
cause a significant accumulation of excess carbon dioxide<br />
in the atmosphere, much like a deficit in a financial<br />
budget, repeated year after year, can lead <strong>to</strong> the<br />
accumulation of a large debt.<br />
Over the past four decades, atmospheric carbon dioxide<br />
concentrations have been carefully measured at many<br />
locations around the world, and the consequences of<br />
human emissions are clearly evident in the results. The<br />
trends (Figure 2.3) show current rates of increase of about<br />
1.6 ppmv, or 0.4%, per year and a net rise over the past<br />
45 years of 19%. Current concentrations are now about<br />
375 ppmv, more than 30% higher than the pre-industrial<br />
concentrations of 280 ppmv observed in ice cores. The<br />
observed increase in recent decades is, in fact, significantly<br />
less that should have occurred if all carbon dioxide<br />
released due <strong>to</strong> human activities were <strong>to</strong> remain in the<br />
atmosphere. However, approximately 50-60% of more<br />
recent anthropogenic emissions appear <strong>to</strong> be finding their<br />
Other<br />
industrialized<br />
countries<br />
21%<br />
North America<br />
26%<br />
Eastern Europe<br />
& former USSR<br />
12%<br />
2000<br />
China<br />
12%<br />
Other<br />
developing<br />
countries<br />
28%<br />
15
<strong>An</strong> <strong>Introduction</strong> <strong>to</strong> <strong>Climate</strong> <strong>Change</strong><br />
FIGURE 2.3<br />
Atmospheric carbon dioxide concentrations since 1959<br />
CO2 Concentration<br />
(ppmv)<br />
300<br />
1950 1960 1970 1980 1990 2000<br />
Year<br />
way back in<strong>to</strong> the natural cycle. Although the net sink for<br />
this carbon is not well unders<strong>to</strong>od, both the oceans and<br />
the terrestrial ecosystems are believed <strong>to</strong> be important<br />
recipients. In other words, the natural uptake of carbon by<br />
these systems compensates for a part of the human<br />
interference, but only part.<br />
Predicting future concentrations of atmospheric carbon<br />
dioxide is very difficult. The largest uncertainty pertains <strong>to</strong><br />
future rates of emissions from human activities. These will<br />
depend on a number of variables. How fast, for example,<br />
will the world population grow? Will we use the same<br />
types of energy in the future that we do now? Will our<br />
energy use be more efficient? How far will developing<br />
countries improve their standard of living and hence<br />
increase their consumption of energy? Will land use<br />
change through deforestation and forest degradation<br />
continue <strong>to</strong> exceed efforts <strong>to</strong> increase forest productivity?<br />
The answers <strong>to</strong> such questions, in turn, will depend on<br />
human decisions, political action, and technological and<br />
socio-economic developments that themselves are largely<br />
unpredictable. Experts suggest that, when all these<br />
questions are considered, annual carbon dioxide emissions<br />
from human sources in 2100 could range from a low of<br />
70% (assuming significant improvements in energy<br />
16<br />
400<br />
380<br />
360<br />
340<br />
320<br />
Mauna Loa<br />
Alert<br />
efficiency and the extensive use of non- fossil fuel energy<br />
sources) <strong>to</strong> a high of 500% (assuming low improvements<br />
in energy efficiency and much expanded use of coal) of<br />
that in 1990.<br />
Lesser but still important uncertainties relate <strong>to</strong> how much<br />
of these carbon dioxide releases will be retained in the<br />
atmosphere. Will the natural system continue <strong>to</strong> absorb<br />
more than 50% of the human release of carbon dioxide<br />
in<strong>to</strong> the terrestrial biosphere and oceans? Or will the<br />
fraction remaining in the atmosphere increase with time?<br />
The answer is as yet unclear and must await the results of<br />
further intensive research and observation of the natural<br />
carbon cycle.<br />
Taking these uncertainties in<strong>to</strong> account, our best estimates<br />
of future atmospheric concentrations of carbon dioxide<br />
yield a range of scenarios. The most pessimistic suggests a<br />
possible doubling of concentrations over pre-industrial<br />
levels by mid-21st century and a tripling by 2100. <strong>An</strong><br />
optimistic scenario envisions concentrations slightly<br />
below a doubling of pre-industrial levels by 2100<br />
(Figure 2.4).<br />
FIGURE 2.4<br />
Projections for future atmospheric CO2 concentrations,<br />
relative <strong>to</strong> concentrations of the past millennium<br />
CO 2 Concentration (ppmv)<br />
1000<br />
900<br />
800<br />
700<br />
600<br />
500<br />
400<br />
300<br />
200<br />
Data from ice cores<br />
Directly measured<br />
Range of<br />
future<br />
projections<br />
1000 1200 1400 1600 1800 2000<br />
Year<br />
Data sources: CDIAC on line; IPCC WGI 2001.
CHAPTER 2 | ENHANCING THE GREENHOUSE EFFECT<br />
FIGURE 2.5<br />
Trends in methane concentrations over the past<br />
millennium<br />
1800<br />
Methane concentrations<br />
(ppbv)<br />
1600<br />
1400<br />
1200<br />
1000<br />
800<br />
METHANE<br />
Ice Core Data<br />
Atmospheric Measurements<br />
600 1000 1200 1400 1600 1800 2000<br />
Year<br />
Methane (CH4) is produced naturally by the decay of<br />
organic matter in the absence of oxygen. Methane<br />
concentrations in the atmosphere have been measured<br />
continuously since 1978. These measurements indicate<br />
that current concentrations are about 1750 parts per<br />
billion by volume (ppbv), which is an increase of about<br />
150% over the pre-industrial concentrations of 700 ppbv<br />
noted in ice core records (Figure 2.5). Between 1978 and<br />
the early 1990s, concentrations continued <strong>to</strong> increase at<br />
about 10 <strong>to</strong> 15 ppbv/year. However, they have increased<br />
very little in recent years. The reason for this variation is<br />
not yet clear. One possible fac<strong>to</strong>r may be changes in the<br />
rate of human emissions, but there are also indications that<br />
changes in natural emissions in high latitudes may be<br />
another important fac<strong>to</strong>r.<br />
Like carbon dioxide, methane is exchanged naturally<br />
between the Earth’s surface and atmosphere. Wetlands are<br />
a primary source – hence its popular name, “swamp gas.”<br />
It is also released through the digestive processes of certain<br />
insects and ruminant animals, such as termites, sheep and<br />
cattle. Although the global area of natural wetlands may<br />
actually be decreasing due <strong>to</strong> human interference, the <strong>to</strong>tal<br />
FIGURE 2.6<br />
Estimated contribution of various sources <strong>to</strong> <strong>to</strong>tal global<br />
emissions of methane<br />
Fossil Fuels<br />
17%<br />
<strong>An</strong>imals<br />
17%<br />
Data sources: CDIAC on line Data sources: CDIAC on line.<br />
Rice<br />
10%<br />
Natural sources<br />
38%<br />
Landfill<br />
8%<br />
Other human<br />
11%<br />
acreage of rice paddies appears <strong>to</strong> be increasing rapidly,<br />
while the global population of domestic cattle has<br />
quadrupled during the past century. Other sources include<br />
industrial processes, fossil fuel extraction, and garbage<br />
decomposition in landfill sites (Figure 2.6).<br />
Unlike carbon dioxide, however, methane is removed from<br />
the atmosphere primarily through chemical processes<br />
involving the chemical hydroxyl radical, OH. These<br />
chemical interactions finally produce water and carbon<br />
dioxide. A small amount of methane is also absorbed<br />
directly by soils.<br />
The increase in methane emissions has been primarily<br />
caused by the global growth in agricultural activities and<br />
fossil fuel use for energy, which are both linked <strong>to</strong> the<br />
rapid rise in global human population. Since the world’s<br />
population is unlikely <strong>to</strong> stabilize for at least the next<br />
century, a continuation of these changes and further<br />
increases in methane releases can be expected. At the same<br />
time, the rate of removal of methane from the atmosphere<br />
by natural processes could change, since the abundance of<br />
OH is sensitive <strong>to</strong> changes in air pollution around the<br />
world, particularly tropospheric ozone. Despite<br />
17
<strong>An</strong> <strong>Introduction</strong> <strong>to</strong> <strong>Climate</strong> <strong>Change</strong><br />
uncertainties about such changes, experts expect<br />
atmospheric methane concentrations <strong>to</strong> continue <strong>to</strong> rise<br />
for at least the next 50 years. They project that, by 2100,<br />
concentrations are likely <strong>to</strong> be somewhere between about<br />
1500 ppbv (about 15% less than <strong>to</strong>day) and 3700 ppbv<br />
(110% higher than <strong>to</strong>day).<br />
OTHER GREENHOUSE GASES<br />
Nitrous oxide (N2O) concentrations in the atmosphere are<br />
now increasing by 0.2 <strong>to</strong> 0.3% per year. Present levels are<br />
about 319 ppbv, or about 17% above pre-industrial values.<br />
Although both the natural cycle and the magnitude of<br />
human sources of nitrous oxide are poorly unders<strong>to</strong>od,<br />
emissions from agricultural soils and animal wastes are<br />
believed <strong>to</strong> be the largest contribu<strong>to</strong>rs <strong>to</strong> increases in the<br />
atmospheric concentrations of N2O. Other important<br />
contribu<strong>to</strong>rs include the industrial production of nylon<br />
and nitric acids, biomass burning, and the combustion of<br />
fossil fuels in cars equipped with catalytic converters.<br />
Ozone (O3) is found naturally in the lower 10-15 km of<br />
the atmosphere (known as the troposphere) in minute<br />
concentrations. Much of this background ozone is<br />
transported down from the upper atmosphere (the<br />
stra<strong>to</strong>sphere), where it is produced directly from a reaction<br />
between oxygen and solar radiation. However, during the<br />
past century or so it has also been produced in increasing<br />
quantities near the Earth’s surface through chemical<br />
processes involving nitrogen oxides, carbon monoxide,<br />
other air pollutants, and sunlight. These pollutants are<br />
largely produced by transportation and stationary<br />
combustion processes. Hence, since ozone decays very<br />
quickly, its concentrations in the troposphere are highest<br />
downwind of industrialized regions and lowest over areas<br />
far removed from such regions, particularly over Southern<br />
Hemisphere oceans. Average global concentrations within<br />
the troposphere are now believed <strong>to</strong> be about 35% higher<br />
than in pre-industrial times. The rates of growth in lowlevel<br />
ozone concentrations in the highly industrial regions<br />
of the Northern Hemisphere appear <strong>to</strong> have decreased<br />
significantly since the 1980s, while those in south and<br />
south-east Asia have increased.<br />
18<br />
Trends in ozone concentrations in the upper part of the<br />
troposphere, where it is most effective as a greenhouse<br />
gas, are as yet poorly observed or unders<strong>to</strong>od. Thinning<br />
of the ozone layer in the lower stra<strong>to</strong>sphere by<br />
chlorofluorocarbons (CFCs) and other ozone depleting<br />
substances (see below) may also significantly offset the<br />
warming effects of ozone increases in the troposphere.<br />
Consequently, the net impact of changing ozone<br />
concentrations on the greenhouse effect is still not clear.<br />
Halocarbons containing chlorine, fluorine, and bromine<br />
are, molecule for molecule, among the most potent<br />
greenhouse gases in the atmosphere (see “Greenhouse<br />
gases: a comparison”). In general, they do not occur<br />
naturally but are produced industrially in significant<br />
quantities. The best known of this group of chemicals<br />
are the CFCs, which have been widely used as solvents,<br />
refrigerants, spray can propellants, and foaming agents.<br />
Also significant are the halons, bromine-based compounds<br />
that are used as fire-extinguishing agents.<br />
Because these and many other halocarbons are very stable<br />
and do not readily react chemically with other gases, each<br />
molecule released in<strong>to</strong> the atmosphere can remain there<br />
for decades and even many centuries, until it is finally<br />
broken down in the upper atmosphere by intense<br />
ultraviolet radiation or escapes in<strong>to</strong> space. Many of these,<br />
when they break down, release chlorine, bromine and/or<br />
fluorine a<strong>to</strong>ms that then become responsible for depleting<br />
the stra<strong>to</strong>spheric ozone layer. Although atmospheric<br />
concentrations of the principal CFCs are very low, until<br />
recently some of these have been increasing at the rate of<br />
more than 4% per year and had come <strong>to</strong> be considered<br />
significant fac<strong>to</strong>rs in the enhancement of the greenhouse<br />
effect. However, CFC concentrations have recently begun<br />
<strong>to</strong> stabilize and, for some gases, even decline as a result of<br />
international action under the Montreal Pro<strong>to</strong>col.<br />
Furthermore, the direct greenhouse effects of these<br />
substances, like those of tropospheric ozone, may be offset<br />
indirectly by the depletion of the ozone layer and a<br />
consequent cooling of the lower stra<strong>to</strong>sphere. Hence, as<br />
with ozone, the net effect of ozone-depleting halocarbons<br />
on the climate system remains uncertain.
CHAPTER 2 | ENHANCING THE GREENHOUSE EFFECT<br />
Water vapour is actually the largest contribu<strong>to</strong>r <strong>to</strong> the<br />
natural greenhouse effect. In fact, studies suggest that, if<br />
water vapour was the only greenhouse gas in the<br />
atmosphere, the natural greenhouse effect would still be<br />
about 65% as strong as that with all greenhouse gases<br />
present. However, water vapour is not itself a primary<br />
cause of changes in the greenhouse effect. Rather, it is an<br />
important fac<strong>to</strong>r because it is involved in a number of<br />
important climate system feedbacks – both positive and<br />
negative - triggered by rising temperatures caused by other<br />
primary causes of change. The net effect of these feedbacks<br />
in response <strong>to</strong> an initial enhancement of the greenhouse<br />
effect is expected <strong>to</strong> be an increase in the water vapour<br />
content of the atmosphere, since warmer air can hold<br />
more moisture, and higher temperatures are likely <strong>to</strong> cause<br />
more water <strong>to</strong> evaporate from the Earth’s surface. Thus,<br />
water vapour feedbacks are believed <strong>to</strong> significantly add<br />
<strong>to</strong> any enhanced greenhouse effect caused by increased<br />
concentrations of other greenhouse gases. However,<br />
additional moisture in the atmosphere can also increase<br />
cloud formation which may significantly reduce the<br />
amount of solar energy warming the Earth’s climate<br />
system, thus at least partly offsetting the increased<br />
greenhouse warming caused by water vapour. Although<br />
these feedbacks are as yet not well unders<strong>to</strong>od and hence<br />
difficult <strong>to</strong> quantify with confidence, there is a general<br />
consensus amongst experts that they are significant and<br />
positive.<br />
OTHER HUMAN INFLUENCES<br />
The enhancement of the natural greenhouse effect will<br />
undoubtedly be humanity’s primary impact on global<br />
climate. However, human activities can also affect climate<br />
significantly in other ways on local and regional scales.<br />
The effects of some of these activities could ultimately<br />
become globally significant.<br />
■ Land use change – As humans replace forests and other<br />
natural vegetation with agricultural fields, asphalt or<br />
concrete, they substantially alter the way the Earth’s<br />
surface reflects sunlight and releases heat. In general,<br />
flooded lands and wet soils absorb more sunlight than a<br />
forest canopy, and paved parking lots more than<br />
grasslands. On the other hand, deserts created by<br />
deforestation and overgrazing reflect more sunlight than<br />
natural vegetation, and snow covered fields more than the<br />
forests that they replace. All these changes also affect<br />
regional evaporation, runoff and rainfall patterns. Although<br />
these land use changes can have a substantial local<br />
influence, in most cases the net impact on climate globally<br />
is likely <strong>to</strong> be small.<br />
■ Atmospheric aerosols – Humans are adding large<br />
quantities of fine particles (aerosols) <strong>to</strong> the atmosphere,<br />
both from agricultural and industrial activities. Although<br />
most of these aerosols are soon removed by gravity and<br />
rainfall, they still affect the radiation balance in the<br />
atmosphere. Whether this effect adds <strong>to</strong> or offsets any<br />
warming trend depends on the quantity and nature of the<br />
particles as well as the nature of the land or ocean surface<br />
below. The regional effects, however, can be significant.<br />
Scientists have suggested that high regional concentrations<br />
of sulphate and some of the other aerosols from fossil fuel<br />
and biomass burning may be significantly reducing solar<br />
heating in some parts of the world, particularly in the<br />
Northern Hemisphere. That is because these aerosols not<br />
only reflect more sunlight back <strong>to</strong> space directly but also<br />
increase condensation rates in low clouds, thus making<br />
them more reflective. These processes may have<br />
temporarily reduced the magnitude of any hemispheric<br />
warming that may be occurring due <strong>to</strong> enhanced<br />
greenhouse effect. However, other aerosols, particularly<br />
soot, may be having the opposite effect. Hence, although<br />
the net effect of sulphates and other cooling aerosols is<br />
likely significantly greater than that of soot, these effects<br />
are as yet not properly unders<strong>to</strong>od and hence difficult <strong>to</strong><br />
estimate with confidence.<br />
■ Arctic haze – Since the 1940s, observers in the Arctic<br />
have reported the increasing presence of layers of reddishbrown<br />
haze. The haze, which is observed primarily during<br />
winter and spring when the Arctic air is very cold and<br />
calm, consists of industrial aerosols, mostly from Europe<br />
and northern Asia, that have been transported long<br />
distances in<strong>to</strong> the Arctic by prevailing winds. These<br />
aerosols include sooty and acidic particles which increase<br />
the net absorption and diffusion of spring sunlight in the<br />
lower atmosphere. They also increase the surface<br />
19
<strong>An</strong> <strong>Introduction</strong> <strong>to</strong> <strong>Climate</strong> <strong>Change</strong><br />
absorption of sunlight as they settle out on snow and ice.<br />
Both roles can cause spring temperatures in the Arctic <strong>to</strong><br />
become slightly warmer and hemispheric wind patterns <strong>to</strong><br />
change.<br />
■ Urban heat islands – City environments are<br />
substantially different from the rural landscapes they<br />
replace. Buildings and vehicles release heat directly <strong>to</strong> the<br />
atmosphere, while air pollution and the dark surfaces of<br />
pavements and roof <strong>to</strong>ps add <strong>to</strong> the absorption of sunlight.<br />
Buildings also alter wind flow: wind speed increases<br />
between large buildings but may drop <strong>to</strong> zero in their lee.<br />
The net result is that large cities are, in general,<br />
significantly warmer than the surrounding countryside,<br />
20<br />
GREENHOUSE GASES: A COMPARISON<br />
particularly in the winter. Central Toron<strong>to</strong>, for example, is<br />
on average about 3°C warmer that surrounding regions.<br />
The effect is primarily local, however. All the urban heat<br />
islands around the world added <strong>to</strong>gether do not<br />
significantly affect global climate conditions.<br />
■ Water diversions and s<strong>to</strong>rage – Water, whether flowing<br />
in streams and rivers or s<strong>to</strong>red in lakes, is a source of<br />
moisture for the air above it, and an important means of<br />
s<strong>to</strong>ring heat. Bodies of water help <strong>to</strong> cool local climates in<br />
summer and warm them in winter. Large-scale projects <strong>to</strong><br />
dam or divert water flows can therefore have a significant<br />
influence on regional climates.<br />
Accurate comparisons of the net potency of different greenhouse gases as forces of climate change are<br />
difficult and dependent on how these comparisons are made. However, best estimates suggest that<br />
the net accumulated climatic effect over the next century of the release of a gram of nitrous oxide is almost<br />
300 times that of a gram of carbon dioxide. That for a gram of methane is about 23 times as great. Some<br />
gases, while still very low in concentration, are much, much more potent. One gram of sulphur hexafluoride<br />
released in<strong>to</strong> the atmosphere, for example, has about 22 000 times the effect of a gram of carbon dioxide.<br />
However, although the potency of carbon dioxide released in<strong>to</strong> the atmosphere through human activities<br />
may be significantly lower than many other greenhouse gases, the much greater volume of emissions still<br />
make it the most important influence in human enhancement of the natural greenhouse effect. For<br />
example, as shown in Figure 2.7, the projected climate forcing commitment for the next century due <strong>to</strong><br />
<strong>Canadian</strong> emissions of carbon dioxide from human activities during 2001 was about six times that for<br />
methane and about ten times that for nitrous oxide.<br />
FIGURE 2.7<br />
Relative contribution of <strong>Canadian</strong> greenhouse gas<br />
emissions in 2001 <strong>to</strong> future global warming<br />
Carbon dioxide<br />
78.9%<br />
Methane<br />
12.4%<br />
Nitrous oxide<br />
7.4%<br />
1.3%<br />
HFCs, PFCs & SF6
Predicting climates<br />
Major changes in climate inevitably create the<br />
likelihood of a radical and relatively rapid<br />
transformation of global ecosystems. Should that happen,<br />
human society would be faced with physical, social and<br />
economic disruptions and dislocations that could equal or<br />
even surpass any that humanity has yet experienced.<br />
Preparing and responding <strong>to</strong> such challenges would be a<br />
priority for all societies, and it is thus vitally important <strong>to</strong><br />
know what changes could occur and what their<br />
consequences would be. But, given the complexity of the<br />
Earth’s climate system, can we in fact predict with any<br />
degree of certainty what changes are likely <strong>to</strong> take place?<br />
Unfortunately, the complex processes and interactions that<br />
make up the global climate system are far <strong>to</strong>o large and<br />
intricate <strong>to</strong> reproduce in a labora<strong>to</strong>ry experiment. Studying<br />
the climate systems of other planets, such as Mars and<br />
Venus, does not help significantly either, since these<br />
systems do not include oceans or terrestrial biospheres.<br />
Studies in<strong>to</strong> the past behaviour of Earth’s climate can<br />
provide much information on how previous climates have<br />
evolved and can point <strong>to</strong> possible causes of change.<br />
However, while such observational studies can shed light<br />
on some aspects of the physical processes in climate<br />
change, they can only give us a very limited picture of how<br />
the climate system works. Nor can we simply extrapolate<br />
the trends and variations of past and recent climates <strong>to</strong><br />
predict the future, particularly when the forces involved<br />
in future changes may be uniquely different from those of<br />
the past.<br />
Fortunately, most of the detailed processes, interactions<br />
and changes that occur within the climate system can be<br />
described in terms of well-defined physical laws such as<br />
the laws of conservation of mass and energy or New<strong>to</strong>n’s<br />
laws of motion. These physical laws can be developed in<strong>to</strong><br />
mathematical expressions and, with the help of advanced<br />
computer facilities, can be used <strong>to</strong> calculate how the<br />
system will respond <strong>to</strong> forces of change.<br />
Such mathematical models are now being used extensively<br />
<strong>to</strong> study the climatic effects of current phenomena such as<br />
volcanic eruptions or ocean temperature anomalies. They<br />
are also being used <strong>to</strong> help explain past climate events and<br />
<strong>to</strong> simulate how the climate system might respond <strong>to</strong><br />
human interferences, including land use change and the<br />
emission of aerosols and greenhouse gases.<br />
MATHEMATICAL CLIMATE MODELS<br />
3<br />
CHAPTER<br />
Because of the limitations in mathematical techniques and<br />
computer capabilities, we cannot replicate every process of<br />
the climate system in full detail. Furthermore, many of<br />
these processes are as yet inadequately measured or<br />
unders<strong>to</strong>od. Modellers must therefore simplify and<br />
approximate these processes, making assumptions about<br />
which ones are most important and which are least<br />
affected by such adjustments. Many different kinds of<br />
models can be developed. The nature of each depends on<br />
the application for which it is intended, the simplifications<br />
required and the amount of spatial and chronological<br />
detail needed.<br />
<strong>An</strong> extremely simple climate model is a zero dimensional<br />
energy budget model that simplifies the temperature of the<br />
Earth <strong>to</strong> a global average at a single point. Such a model<br />
can, for example, be used <strong>to</strong> calculate the Earth’s average<br />
surface temperature as an energy balance arising from the<br />
reflective, absorptive and radiative properties of the Earth’s<br />
atmosphere and surface.<br />
At the opposite extreme are the very sophisticated climate<br />
system models (CSMs) that consider the dynamic and<br />
21
<strong>An</strong> <strong>Introduction</strong> <strong>to</strong> <strong>Climate</strong> <strong>Change</strong><br />
complex interactions within and between the atmosphere,<br />
the oceans, the cryosphere, land surfaces and the<br />
biosphere in three dimensional space and over time. At<br />
the heart of these models are coupled Atmosphere-Ocean<br />
General Circulation Models (AOGCMs), in which<br />
mathematical equations representing the physical laws of<br />
conservation of momentum, mass, moisture and energy are<br />
used <strong>to</strong> simulate the evolution of the dynamics and energy<br />
flows of the entire coupled ocean-atmosphere system.<br />
However, a few advanced versions of these climate system<br />
models now also include an interactive, dynamic<br />
vegetation system as well as responsive atmospheric<br />
chemistry. These models can explore in greater detail how<br />
different climate parameters – temperature, humidity, wind<br />
speed and direction, soil moisture, and a large range of<br />
others – may evolve over time as various conditions are<br />
altered and feedbacks come in<strong>to</strong> play.<br />
In between are a large variety of one and two dimensional<br />
models and more detailed regional climate models that are<br />
used <strong>to</strong> study various climate processes and interactions<br />
in varying degrees of complexity. These can be very<br />
effectively used <strong>to</strong> study many smaller-scale climatic<br />
relationships, and the results of these investigations can<br />
help <strong>to</strong> improve the equations used within coupled climate<br />
models or add further detail <strong>to</strong> CSM outputs at a regional<br />
scale.<br />
But even the most complex climate system model is, in<br />
fact, only a crude description of the real climate system.<br />
Despite the tens of thousands of spatial points within<br />
the atmosphere and oceans for which such a model<br />
makes calculations and the hundreds of thousands of<br />
lines of computer code used for these calculations,<br />
such simulations cannot fully describe the climate<br />
characteristics and processes of continuous space and time.<br />
A typical CSM divides the Earth’s surface in<strong>to</strong> a grid or<br />
series of boxes. Early low resolution General Circulation<br />
Models used boxes that were relatively large – with each<br />
one covering an area about the size of Mani<strong>to</strong>ba. Today,<br />
some high resolution models use atmospheric boxes of less<br />
than 60 000 square kilometres in area – roughly 20%<br />
smaller than New Brunswick – and ocean boxes that are<br />
even smaller. Vertically, the atmosphere is represented by<br />
22<br />
anywhere from nine <strong>to</strong> 30 layers, and the oceans by up <strong>to</strong><br />
40 layers.<br />
Many important climate processes, however, take place on<br />
scales much smaller than even the smallest of these grid<br />
boxes and must be dealt with collectively rather than<br />
individually. Values for these processes are established<br />
through a procedure known as parameterization. This<br />
involves the development of physical and statistical<br />
relationships between these processes and large-scale<br />
variables that can be calculated by the model. Cloud<br />
characteristics, evaporation, precipitation, and land<br />
surface characteristics are examples of processes that<br />
must be parameterized. Models must also include the<br />
complex feedback mechanisms that exist between the<br />
various processes.<br />
A simple time line for the development his<strong>to</strong>ry of climate<br />
system models is illustrated in Figure 3.1. Uncertainty<br />
about how processes within and between the various<br />
components are best described is a primary reason why<br />
different models can disagree significantly on the<br />
consequences of a change imposed upon the system and<br />
why the results of experiments with these models cannot<br />
as yet be used as reliable predic<strong>to</strong>rs of future climates.<br />
The ultimate test of a model’s ability <strong>to</strong> simulate the real<br />
world, of course, is its ability <strong>to</strong> replicate changes that<br />
have already happened. This can be done by using the<br />
model <strong>to</strong> simulate current and past climate conditions.<br />
If the simulation results agree well with observed data,<br />
the confidence in the model’s usefulness for simulating<br />
future climates is enhanced. Most of the climate system<br />
models in the use of climate change studies <strong>to</strong>day are able<br />
<strong>to</strong> simulate current and past climates reasonably well.<br />
However, although some perform better than others,<br />
none can be considered highly accurate, particularly<br />
with respect <strong>to</strong> regional climates.<br />
<strong>Climate</strong> system model experiments have added<br />
significantly <strong>to</strong> our understanding of how climates are<br />
likely <strong>to</strong> change. Even so, our knowledge remains far from<br />
complete, and many questions about the details of future<br />
climate change continue <strong>to</strong> go unanswered. Scientists<br />
believe that getting these answers will require the use of
CHAPTER 3 | PREDICTING CLIMATES<br />
FIGURE 3.1<br />
Evolution of climate model development over the past three decades<br />
Source: IPCC TAR WG1 2001<br />
much larger, yet <strong>to</strong> be developed computers and a much<br />
better understanding of some of the physical processes of<br />
the climate system. Such developments will take many<br />
more years of research.<br />
MODEL PROJECTIONS FOR THE FUTURE<br />
What do climate model experiments tell us about the kind<br />
of climate we can expect from an enhanced greenhouse<br />
effect?<br />
One common type of climate model experiment conducted<br />
during the past decade involves simulating how the global<br />
climate system responds with time <strong>to</strong> a gradual change in<br />
the composition of the atmosphere. Beginning with a preindustrial<br />
climate that is in a near-equilibrium, stable state,<br />
modellers undertaking these simulations first apply<br />
his<strong>to</strong>rical changes in greenhouse gas and aerosol<br />
concentrations <strong>to</strong> simulate how climates have changed over<br />
the past century or so. They then use one or more<br />
projections of how the composition of the atmosphere is<br />
likely <strong>to</strong> change due <strong>to</strong> future human emissions of<br />
greenhouse gases and aerosols <strong>to</strong> develop projections of<br />
future climates. This type of experiment has now been<br />
performed many times with a number of different coupled<br />
climate models. Since the results depend both on the type<br />
of model used and on the assumptions about future<br />
changes in natural and human fac<strong>to</strong>rs affecting climate,<br />
projections about how Earth’s future climate is likely <strong>to</strong><br />
change are not always consistent from one experiment <strong>to</strong><br />
the next. Nevertheless, these projections do agree on a<br />
number of points. Among the more reliable conclusions,<br />
the following stand out as the most important.<br />
■ Within the next century, average global surface<br />
temperatures are likely <strong>to</strong> rise by at least 1°C, relative <strong>to</strong><br />
23
<strong>An</strong> <strong>Introduction</strong> <strong>to</strong> <strong>Climate</strong> <strong>Change</strong><br />
current values. They could increase by more than 5°C.<br />
Even at the lower end of this range, the expected rate of<br />
warming is likely <strong>to</strong> be without precedence in human<br />
his<strong>to</strong>ry (Figure 3.2).<br />
■ Surface warming over land areas will, in general, be<br />
faster and greater than over oceans. In winter, polar<br />
regions will also warm much more significantly than low<br />
latitude regions.<br />
■ Night-time low temperatures are expected <strong>to</strong> increase<br />
more rapidly than day-time high temperatures, thus<br />
decreasing the diurnal range in temperature.<br />
■ <strong>An</strong> increase in mean temperatures leads <strong>to</strong> more<br />
frequent high temperatures and less frequent extreme<br />
low temperatures.<br />
<strong>Change</strong>s in these temperature patterns will also cause<br />
alterations in atmospheric wind patterns and in ocean<br />
currents. A likely slow-down of the cycling of surface and<br />
deep ocean waters is expected <strong>to</strong> reduce ocean advection<br />
of heat from equa<strong>to</strong>r <strong>to</strong> poles. This could cause a smaller<br />
warming in some ocean regions, such as the North Atlantic<br />
and the circumpolar Southern Ocean, and may even cause<br />
FIGURE 3.2<br />
Model projections<br />
of future<br />
temperature<br />
changes<br />
24<br />
Temperature <strong>Change</strong> (°C)<br />
6<br />
5<br />
4<br />
3<br />
2<br />
1<br />
0<br />
-1<br />
Observed<br />
A1FI<br />
A1B<br />
A1T<br />
A2<br />
B1<br />
B2<br />
IS92a<br />
Source: IPCC TAR Synthesis Report 2001<br />
some parts of these regions <strong>to</strong> actually cool relative <strong>to</strong><br />
current temperatures.<br />
■ Average global evaporation and precipitation will rise.<br />
■ As temperatures rise, the extent of snow and sea ice<br />
cover in the Northern Hemisphere will decrease.<br />
Certain other aspects of future climate, however, have<br />
been harder <strong>to</strong> predict. One of these is the distribution<br />
of precipitation where rain and snow fall is largely<br />
determined by the tracks taken by s<strong>to</strong>rms. However, the<br />
location of these depends on the complex pattern of<br />
atmospheric circulation, which climate models cannot yet<br />
simulate with sufficient accuracy. Consequently, model<br />
predictions about changes in s<strong>to</strong>rm tracks and hence in<br />
local precipitation patterns are not very reliable.<br />
Nevertheless, it is clear that there will be important<br />
changes in the distribution of rain and snow fall from<br />
place <strong>to</strong> place. <strong>An</strong>d, as temperatures warm and some<br />
regions become drier and others wetter, the climate<br />
conditions that determine the natural growth of vegetation<br />
around the world may shift significantly.<br />
1990<br />
Several Models<br />
All SRES Envelope<br />
1900 2000 2100<br />
Year
CHAPTER 3 | PREDICTING CLIMATES<br />
<strong>An</strong>other area of significant uncertainty relates <strong>to</strong> weather<br />
variability and many types of extreme weather events (see<br />
Table 3.1). Most studies indicate that, on average, extreme<br />
precipitation events will become more frequent. While<br />
some models show that there may be an increase in<br />
intense mid-latitude s<strong>to</strong>rms, there is no general agreement<br />
on these s<strong>to</strong>rm characteristics among various studies.<br />
Likewise, while there is some evidence <strong>to</strong> suggest that the<br />
upper limit of tropical s<strong>to</strong>rm intensity could rise, there is<br />
little agreement on how the average intensity and<br />
frequency of these events might change. Finally, while<br />
climate studies suggest that the frequency of lightning and<br />
hail could rise as temperatures increase, these events are<br />
<strong>to</strong>o small in scale <strong>to</strong> be as yet resolved within coupled<br />
climate models.<br />
TABLE 3.1<br />
Confidence levels in projected changes in extreme climate<br />
events<br />
<strong>Change</strong>s in <strong>Climate</strong> Confidence in<br />
Event Projections<br />
Higher maximum temperatures<br />
and more hot days over nearly<br />
all land areas Very likely<br />
Higher minimum temperatures,<br />
fewer cold days and frost days<br />
for nearly all land areas Very likely<br />
Reduced diurnal temperature<br />
range over most land areas Very likely<br />
Increase of discomfort due <strong>to</strong><br />
combined effects of heat and<br />
humidity Very likely, for most areas<br />
More intense precipitation<br />
events Very likely, for many areas<br />
Increased summer continental Likely, over most middrought<br />
latitude continental interiors<br />
Increased peak wind intensity<br />
of tropical cyclones Likely, over some areas<br />
Increased mean and peak<br />
precipitation intensity in<br />
tropical cyclones Likely, over some areas<br />
Source: IPCC TAR WG1 2001<br />
Although climate system models gives us significant<br />
insight in<strong>to</strong> the effects of changing atmospheric<br />
concentrations of some of the key greenhouse gases and<br />
aerosols, there are a number of other fac<strong>to</strong>rs that most do<br />
not as yet adequately take in<strong>to</strong> account.<br />
For example, most model projections of future climate<br />
change do not consider the natural climatic effects of<br />
changes in solar radiation or in the volcanic eruption<br />
aerosols released in<strong>to</strong> the atmosphere from time <strong>to</strong> time.<br />
These fac<strong>to</strong>rs have influenced climate throughout the<br />
his<strong>to</strong>ry of the Earth, and will continue <strong>to</strong> do so in the<br />
decades and centuries <strong>to</strong> come. During some periods<br />
these forces will add <strong>to</strong> the warming effects of rising<br />
greenhouse gas concentrations. In others, they could<br />
slow down or even temporarily reverse the expected<br />
greenhouse warming. However, these natural changes<br />
are difficult <strong>to</strong> predict. Furthermore, based on evidence of<br />
climate variability during the past two millennia, it appears<br />
likely that these natural forces will not significantly alter<br />
the long term trends <strong>to</strong>wards warmer climates expected<br />
from rising greenhouse gas concentrations.<br />
There are also other human induced climate change fac<strong>to</strong>rs<br />
that climate model studies have not yet adequately<br />
evaluated. <strong>Change</strong>s in land use, in addition <strong>to</strong> affecting<br />
carbon dioxide levels in the atmosphere, can change how<br />
much sunlight is reflected from the Earth’s surface. Some<br />
argue that may have been an important fac<strong>to</strong>r in the<br />
warming of the Earth’s climate <strong>to</strong> date. Likewise, very few<br />
model studies have considered the role of dark aerosols<br />
(like soot), which can add <strong>to</strong> the heating of the planet.<br />
The presence of air pollutants in the Arctic, and large scale<br />
water diversions may also have local climate effects that, in<br />
some cases can influence global climates. However, our<br />
best scientific estimates indicate that, over the next<br />
century, changes in the Earth’s climate will be dominated<br />
by the enhancement of the greenhouse effect.<br />
25
<strong>An</strong> <strong>Introduction</strong> <strong>to</strong> <strong>Climate</strong> <strong>Change</strong><br />
FIGURE 3.3<br />
Comparison of modelled global temperature trends since 1860 with that observed<br />
ARE HUMANS ALREADY CAUSING THE<br />
EARTH TO WARM?<br />
As illustrated in Chapter 1 (Figure 1.8), the Earth’s average<br />
surface temperature has increased by about 0.6°C over the<br />
past century. How unusual is this warming, and can we<br />
attribute the observed changes <strong>to</strong> specific causes?<br />
26<br />
(a) Natural (b) <strong>An</strong>thropogenic<br />
(c) All forcings<br />
Source: IPCC TAR WG1 2001<br />
Paleoclimate records (Figure 1.5) suggest that average<br />
global surface temperatures during the past few decades<br />
are unprecedented in at least the past 2000 years.<br />
Furthermore, climate model experiments also suggest that<br />
a warming of 0.6°C in one century is not likely <strong>to</strong> be due<br />
<strong>to</strong> internally generated variability of the climate system.<br />
These research results indicate that the warming over the
CHAPTER 3 | PREDICTING CLIMATES<br />
past century is very unusual and unlikely <strong>to</strong> be due <strong>to</strong><br />
natural causes only. Nevertheless, these data by themselves<br />
do not help us understand what may have caused recent<br />
trends in climate.<br />
To do so, experts turn <strong>to</strong> climate models and complex<br />
statistical studies. While such studies cannot hope <strong>to</strong><br />
address the role of all possible fac<strong>to</strong>rs, they can, one by<br />
one and in combination, consider how past changes in<br />
the key fac<strong>to</strong>rs should have affected the climate and<br />
compare the results with the observed changes. Related<br />
experiments use various combinations of forcings due<br />
<strong>to</strong> volcanic eruptions, changes in solar irradiance, increases<br />
in greenhouse gases, recent changes in stra<strong>to</strong>spheric<br />
ozone and/or variations in concentrations of sulphate<br />
aerosols <strong>to</strong> test which combinations best match the<br />
observed changes.<br />
Results from these studies indicate that the dominant<br />
fac<strong>to</strong>rs in the warming that <strong>to</strong>ok place in the early part of<br />
the 20th century was likely due <strong>to</strong> the combination of<br />
increased intensity of incoming solar energy, a gradual<br />
decline in the amount of volcanic material floating in the<br />
atmosphere, and a slow increase in atmospheric<br />
greenhouse gas concentrations. However, since 1950,<br />
the average load of volcanic material in the atmosphere<br />
has once again increased, while the solar intensity has<br />
modulated around a relatively constant mean value. These<br />
natural fac<strong>to</strong>rs should have caused a cooling, and hence<br />
cannot explain the recent warming trend (Figure 3.3a).<br />
In contrast, rapidly increasing human influences on the<br />
climate system, particularly that of rising atmospheric<br />
concentrations of greenhouse gases, caused a very strong<br />
warming influence (Figure 3.3b). Thus, experts conclude<br />
the most of the warming observed over the past 50 years<br />
is likely attributable <strong>to</strong> human activities.<br />
27
<strong>An</strong> <strong>Introduction</strong> <strong>to</strong> <strong>Climate</strong> <strong>Change</strong><br />
28<br />
▲ Arctic flowers<br />
Source: Brent Colpitts
A warmer world<br />
Each biological species has a unique set of climatic and<br />
other limits within which it flourishes and beyond<br />
which it stagnates or dies. Air and soil temperature, the<br />
type and amount of precipitation and its variability, the<br />
strength of the wind, the amount of sunshine, and other<br />
climatic fac<strong>to</strong>rs play a role in determining which species<br />
will occupy a given region. The influence of climate on<br />
biological survival is clearly seen in the distinctiveness<br />
and variety of the world’s many vegetation regions – from<br />
tundra and boreal forests <strong>to</strong> grasslands and tropical rain<br />
forests. Each of these regions can be seen as a distinct<br />
ecological entity – an ecozone – whose characteristics<br />
have been largely shaped by a corresponding ecoclimate<br />
which is unique <strong>to</strong> the region and essential <strong>to</strong> the life<br />
within it.<br />
When local and regional climates change, as has often<br />
happened in the past, the boundaries of the ecozones<br />
change, forcing the ecosystems <strong>to</strong> adjust. Species whose<br />
climatic requirements no longer match those of the region<br />
migrate or die out, while other species, once foreign <strong>to</strong> the<br />
region, begin <strong>to</strong> enter it. Climatic change is a stimulus <strong>to</strong><br />
the migration of both plants and animals. If the changes<br />
are gradual, the process usually occurs with minimal<br />
disruption. If rapid, the transformation can be dramatic<br />
and result in the extinction of species.<br />
Human societies, like natural ecosystems, are attuned <strong>to</strong><br />
the characteristics of regional climates. Our behaviour and<br />
<strong>to</strong>lerances, our cultures and economies, and, in particular,<br />
our sources of food are climatically influenced. In the past,<br />
as climates fluctuated over extended periods of time,<br />
people learned <strong>to</strong> respond and adapt. In some cases,<br />
such adaptation was a spur <strong>to</strong> social and technological<br />
development. In others, failure <strong>to</strong> cope brought adversity<br />
and even catastrophe.<br />
While we can learn much from studying how ecosystems<br />
and human societies have responded <strong>to</strong> climate variations<br />
in the past, his<strong>to</strong>ry may not be a reliable guide <strong>to</strong> the<br />
effects of future climate change. That is because both the<br />
magnitudes and rates of changes in average global<br />
temperatures may, within the next few decades, exceed any<br />
that we have experienced during the last 10 000 years.<br />
What indications do we have, then, of how such rapid and<br />
large changes may affect natural ecosystems and human<br />
societies?<br />
<strong>Climate</strong> model projections are as yet <strong>to</strong>o uncertain <strong>to</strong> help<br />
us accurately predict regional effects on vegetation or<br />
threats <strong>to</strong> human health and well-being. However, the<br />
models do provide a basis for constructing plausible<br />
scenarios that can be used <strong>to</strong> assess the sensitivities of<br />
nature and societies <strong>to</strong> the range of changes that can be<br />
anticipated. Furthermore, the development of improved<br />
dynamic vegetation models that can be coupled <strong>to</strong> these<br />
climate models allow researchers <strong>to</strong> explore the complex<br />
manner in which ecosystems may respond <strong>to</strong> climatic<br />
changes. Complemented by research in<strong>to</strong> the effects of past<br />
climate changes, scientists can now offer some important<br />
clues as <strong>to</strong> which ecosystems and which sec<strong>to</strong>rs of society<br />
are more resilient or less sensitive <strong>to</strong> these changes.<br />
Although the results must as yet be used with caution,<br />
they nevertheless provide us with a number of tentative<br />
but important general conclusions about both the human<br />
and ecological implications of climatic change.<br />
NATURAL TERRESTRIAL ECOSYSTEMS<br />
4<br />
CHAPTER<br />
On land, warmer climates will likely have the greatest<br />
impact on unmanaged ecosystems, particularly forests. By<br />
the time that ecosystems have fully adapted <strong>to</strong> the changes<br />
in climate projected for the next century, about one-third<br />
of the global forests will undergo major changes in<br />
29
<strong>An</strong> <strong>Introduction</strong> <strong>to</strong> <strong>Climate</strong> <strong>Change</strong><br />
FIGURE 4.1<br />
Projected percent changes in global extent of various<br />
forest ecosystem types under an equilibrium response<br />
<strong>to</strong> a typical 2xCO2 climate scenario<br />
Tropical Rain<br />
Tropical Dry<br />
Temperate<br />
vegetation types. The greatest ecosystem changes are likely<br />
<strong>to</strong> occur in high latitudes, and the least in the tropics<br />
(Figure 4.1). Many of the species involved would adapt<br />
through migration, but some could become extinct. In<br />
some regions these changes are likely <strong>to</strong> cause a decrease<br />
in ecosystem biomass. However, on a global average,<br />
biological productivity is likely <strong>to</strong> increase.<br />
However, full ecosystem adjustment <strong>to</strong> changed<br />
temperatures could be delayed by many centuries, and be<br />
very disruptive. That is because the migration rate of many<br />
plant species is an order of magnitude slower than that<br />
expected for future climate change. For example, in midlatitudes,<br />
a projected increase in temperatures on the order<br />
of 1-3.5°C over the 50 years or so would effectively shift<br />
climate regimes poleward by some 150-550 km (or, in<br />
alpine regions, upward by 150-550 m). By comparison,<br />
most trees migrate at a rate of 4 <strong>to</strong> 200 km/century,<br />
depending on the species. Hence, until ecosystems reach a<br />
new equilibrium with the changed climate, many parts of<br />
ecosystems (particularly along their warm margins) will<br />
become mismatched with the prevailing climate, thus<br />
stressed and more vulnerable <strong>to</strong> the ravages of diseases,<br />
insects and fire. Some species will stagnate and die, while<br />
others will benefit from the changes. Hence species<br />
30<br />
Boreal<br />
Forest Type<br />
-20<br />
-10<br />
Area in Transition<br />
Net Area <strong>Change</strong><br />
0 10 20 30 40 50<br />
%<br />
composition within ecosystems will also change. In<br />
general, warmer temperatures will be most stressful <strong>to</strong><br />
those species close <strong>to</strong> their warm <strong>to</strong>lerance limits and most<br />
beneficial <strong>to</strong> those near their cold limits. However, warmer<br />
climates will allow more frequent breakouts of damaging<br />
pestilence currently constrained by climate conditions and<br />
could dramatically affect soil moisture conditions. Hence<br />
the response of natural ecosystems will be complex and<br />
varied in both time and space.<br />
Increased warming and changing precipitation behaviour<br />
will also have major impacts on aquatic ecosystems. In<br />
northern latitudes, shorter ice cover seasons will lengthen<br />
the season for active biological production, but deep lake<br />
waters will have increased problems with anoxic<br />
conditions in summer. Fish distribution will change, with<br />
a significant loss in habitat for cold water species and a<br />
gain for warm water species. In many regions, reduced<br />
water supply and warmer temperatures will help<br />
exacerbate existing environmental concerns such as<br />
eutrophication, acidification and enhanced UV-B radiation.<br />
The distribution and characteristics of inland wetlands will<br />
also change in response <strong>to</strong> changes in local water tables<br />
and melting permafrost.<br />
Greater mobility allows most wildlife species <strong>to</strong> be<br />
physically better able <strong>to</strong> migrate in response <strong>to</strong> changing<br />
climates than plant species. Recent observations indicate,<br />
for example, that many wildlife species have already<br />
migrated due <strong>to</strong> the changes in climate that have occurred<br />
in recent decades. However, many of these species are also<br />
very dependent on habitat and food supply, which are<br />
likely <strong>to</strong> migrate at different rates. Such varied rates of<br />
migrations can effectively tear apart ecosystems, and be<br />
particularly harmful <strong>to</strong> species already under stress from<br />
climate and other fac<strong>to</strong>rs. Hence, the number of species<br />
threatened by extinction may rise significantly.<br />
AGRICULTURAL ECOSYSTEMS<br />
The combined effects of enhanced atmospheric carbon<br />
dioxide concentrations and climate change on regional<br />
food production will be variable. That is because<br />
agricultural crop yields depend on the complex
CHAPTER 4 | A WARMER WORLD<br />
interactions of different plant species with soil properties<br />
and available plant nutrients, pests and diseases, air quality<br />
and temperature and moisture conditions.<br />
Carbon dioxide is an important fac<strong>to</strong>r because it functions<br />
as an essential plant food source. Experimental studies in<br />
greenhouses indicate that, for many plants, the current<br />
atmospheric concentration of carbon dioxide is a limiting<br />
fac<strong>to</strong>r for growth. Hence, for these, rising CO2<br />
concentrations can stimulate crop growth and yield. This<br />
effect would have minimal influence on the growth rate<br />
and yield of crops such as maize and sugar cane, but could<br />
significantly benefit important cereal crops such as wheat<br />
and rice. However, insufficient soil nutrients, air pollution<br />
and increased UV-B exposure may limit or at least partially<br />
offset these benefits. Furthermore, many weeds may also<br />
grow faster under higher CO2 concentrations.<br />
On the other hand, the impacts of changes in climate on<br />
agricultural productivity depends both on the changes in<br />
temperatures and water availability, including their<br />
extremes.<br />
In higher latitude and altitude regions, where temperatures<br />
are relatively cold, crop yields can benefit significantly<br />
from milder winters and warmer, longer growing seasons.<br />
However, even in these regions, such benefits can be more<br />
than offset by other stresses, such as more frequent and<br />
sustained periods of extreme heat and drought or the<br />
effects of intense rainfall events and related floods.<br />
Likewise, lives<strong>to</strong>ck and poultry production can be<br />
susceptible <strong>to</strong> changing access <strong>to</strong> water resources and/or<br />
increased exposure <strong>to</strong> heat stress. Of all the world’s<br />
regions, however, it is the tropics that are likely <strong>to</strong> be most<br />
vulnerable <strong>to</strong> the disruptions of climate change. In the<br />
tropics, the distribution of rainfall is highly variable, both<br />
seasonally and spatially. Some areas are already marginal<br />
for agricultural production and highly sensitive even <strong>to</strong><br />
minor changes in the occurrence of precipitation. <strong>Climate</strong><br />
studies suggest that, even for regions that receive more<br />
rainfall, much of this increase will occur as more intense<br />
rainfall, increasing the risk of erosion and floods. This will<br />
add <strong>to</strong> other fac<strong>to</strong>rs that are slowly degrading agricultural<br />
soils and water quality. Furthermore, warmer temperatures<br />
are likely <strong>to</strong> increase both surface evaporation and heat<br />
stress on many plant species, lowering crop yields.<br />
Changing farm management practices – such as<br />
adjustments in planting dates, fertilization rates, irrigation<br />
and selection of plant and animal species – can help<br />
capitalize on some of the benefits and reduce the harmful<br />
effects that changes in climate may bring. Experts suggest<br />
that, as long as warming over the next century is less than<br />
a few degrees C, such adaptive measures are likely <strong>to</strong> help<br />
increase net food production in mid-latitudes. However,<br />
this region is also where most of the world’s wealthier<br />
countries happen <strong>to</strong> be. In contrast, even moderate rates of<br />
warming would likely cause significant reductions in food<br />
production in many tropical and dry regions. While the<br />
net global change in food production may be small, the<br />
inequities of global food distribution would likely be<br />
exacerbated. Should the average global rise in temperatures<br />
over the next century exceed 2-3°C, adaptation measures<br />
are unlikely <strong>to</strong> be adequate <strong>to</strong> deal with the consequences,<br />
and most regions of the world are likely <strong>to</strong> experience a<br />
decline in food production. The related increase in cost of<br />
food would likely significantly increase the number of<br />
people around the world at risk of hunger.<br />
COASTAL REGIONS<br />
The mean levels of the world’s seas have been rising slowly<br />
over the past 100 years at a rate of 1.5 cm each decade.<br />
Although there is no evidence that this rate has accelerated<br />
since 1900, that could soon change. During the next<br />
century, the rate of sea level rise is likely <strong>to</strong> be between<br />
1 <strong>to</strong> 9 cm/decade, depending on the future rate of global<br />
temperature rise and how quickly oceans and ice sheets<br />
respond <strong>to</strong> warmer climates (Figure 4.2). The primary<br />
reasons for the expected rise over the next 100 years are<br />
the expansion of sea water as it warms and the melting of<br />
glaciers around the world. However, because oceans warm<br />
very slowly, sea levels will continue <strong>to</strong> rise for centuries<br />
thereafter, even if temperatures at the Earth’s surface s<strong>to</strong>p<br />
rising.<br />
Furthermore, the large ice sheets that s<strong>to</strong>re vast quantities<br />
of water as ice covering Greenland and <strong>An</strong>tarctica are<br />
31
<strong>An</strong> <strong>Introduction</strong> <strong>to</strong> <strong>Climate</strong> <strong>Change</strong><br />
FIGURE 4.2<br />
Projected sea level rise for various greenhouse gas<br />
emission and model scenarios<br />
Source: IPCC TAR 2001.<br />
expected <strong>to</strong> slowly release this water in<strong>to</strong> the oceans if<br />
global temperatures rise significantly. While experts<br />
suggest that these ice sheets will not contribute<br />
significantly <strong>to</strong> sea level rise over the next century, the<br />
Greenland ice sheet alone could add as much as 3 m <strong>to</strong><br />
sea levels within the next 1000 years. A complete<br />
disintegration of the unstable West <strong>An</strong>tarctic Ice Sheet,<br />
although not likely within the next millennium, would<br />
add another 5 <strong>to</strong> 6 metres <strong>to</strong> sea levels.<br />
Warmer ocean temperatures, changes in s<strong>to</strong>rm frequency<br />
and intensity and shifts in ocean circulation would also<br />
seriously affect coastal ecosystems, including the health<br />
of coral reefs and the distribution of fish populations.<br />
Many coral reefs exist at or near temperature <strong>to</strong>lerance<br />
thresholds. Large rises in temperature along with<br />
decreased calcium carbonate formation rates due <strong>to</strong><br />
higher atmospheric CO2 could create a progressively<br />
more hostile environment for these reefs and the<br />
invaluable marine habitats they support.<br />
Human societies are highly vulnerable <strong>to</strong> such coastal<br />
changes. Approximately one quarter of humanity inhabits<br />
the Earth’s coastal regions. These regions are already under<br />
32<br />
great pressure from accelerating population growth,<br />
pollution, upland water diversions, flooding and coastal<br />
erosion. Approximately 70% of the world’s beaches are<br />
currently receding. Many of the world’s coral reefs have<br />
undergone extensive bleaching in recent years, likely as a<br />
result of intense warm events linked <strong>to</strong> El Ninos coupled<br />
with other local environmental stresses caused by humans.<br />
In many coastal areas, mangrove forests and tidal marshes<br />
may respond <strong>to</strong>o slowly <strong>to</strong> the effects of a rapid rise in sea<br />
level <strong>to</strong> survive. Since these ecosystems protect coastlines<br />
from s<strong>to</strong>rm damage, their collapse would further aggravate<br />
the vulnerability of coastal infrastructure and ecosystems<br />
<strong>to</strong> such damage. Deltaic regions, often heavily populated<br />
with humans, would be particularly vulnerable <strong>to</strong> flooding<br />
and erosion, resulting in significant loss of agricultural<br />
land.<br />
Many countries will be able <strong>to</strong> alleviate some of these<br />
impacts by building defence structures such as dykes and<br />
sea walls. But such actions would be costly. In Japan, for<br />
example, countermeasures <strong>to</strong> defend the country against<br />
the impacts of a 50 cm sea levels rise would be almost<br />
US$2 billion per year. Similar protection for American<br />
shorelines could have an accumulated cost over the next<br />
century of US$20 <strong>to</strong> 150 billion. The Dutch and British,<br />
already defending themselves against the sea with finely<br />
tuned coastal defence infrastructures, would also need <strong>to</strong><br />
invest additional billions of dollars <strong>to</strong> cope with the effects<br />
of similar increases in sea levels.<br />
However, the most significant effects of rising seas will be<br />
on those countries whose low-lying coasts are largely<br />
indefensible, or who lack the resources <strong>to</strong> defend<br />
themselves. As the seas advance and s<strong>to</strong>rm surges reach<br />
new heights, these countries are likely <strong>to</strong> experience great<br />
loss of land, property and life. Nations such as the<br />
Maldives, an island chain in the Indian Ocean whose<br />
highest point is about six meters above the current sea<br />
level, could virtually disappear, while countries such as<br />
Egypt, Bangladesh and Vietnam, with much of their<br />
population settled on low-lying deltas, could lose a major<br />
portion of their habitable lands.<br />
The cost of sea level rise in human terms would be<br />
immense. Even if defensive measures are taken <strong>to</strong> address
CHAPTER 4 | A WARMER WORLD<br />
some of these coastal threats, it is estimated that a sea level<br />
rise of 40 cm would increase the number of people around<br />
the world annually flooded out by coastal s<strong>to</strong>rms by 2080<br />
by about 80 million.<br />
OTHER IMPACTS<br />
While the impacts of climate change on natural and<br />
agricultural ecosystems and on coastal regions will<br />
undoubtedly have some of the largest direct effect on the<br />
biosphere and humanity, there will be other important<br />
consequences. These include:<br />
■ <strong>Change</strong>s in the quantity and quality of fresh water.<br />
Under most future climate change projections,<br />
streamflow and water supply are likely <strong>to</strong> decrease in<br />
many tropical <strong>to</strong> mid-latitude regions, and generally<br />
increase in most high latitude regions. By 2080, up <strong>to</strong><br />
3 billion of the people already living in water stressed<br />
regions could experience a further significant reduction<br />
in water supply. Higher temperatures will, in general,<br />
also reduce the quality of water unless offset by<br />
increased flows.<br />
■ Less hostile and more accessible high-latitude regions, as<br />
winters become warmer and sea ice recedes poleward<br />
■ Increased problems with tropical diseases and insects in<br />
mid-latitudes as these migrate with changing climates.<br />
These will affect the health of both humans and plant<br />
species.<br />
■ Intensification or, in some cases, moderation of<br />
ecological and human stress from other sources of<br />
pollution<br />
■ Increased heat stress on humans<br />
■ Increased land instability and infrastructure damage in<br />
high latitude regions as permafrost decays<br />
IMPLICATIONS FOR GLOBAL SECURITY<br />
Shifts in agricultural productivity, increased fresh water<br />
scarcity, impacts of sea level rise and other direct<br />
consequences of climate change may also trigger a number<br />
of disturbing secondary impacts. Perhaps most unsettling<br />
are the implications for the world’s economic and political<br />
security.<br />
Access <strong>to</strong> shelter, food and water is the most fundamental<br />
of all human concerns. We do not as yet know for sure<br />
what the net effect of future climate change on global food<br />
and water supplies will be. It could be negligible. It could<br />
even be positive. But it is almost certain that the regional<br />
distribution of these essentials will change dramatically,<br />
aggravating existing uncertainties in food and health<br />
security. Furthermore, the ravages of increased coastal<br />
inundation due <strong>to</strong> sea level rise, floods from more intense<br />
precipitation events and droughts from longer periods of<br />
inadequate rainfall could displace many people from their<br />
homes. These effects will be most acute for the world’s<br />
poorer regions, which are least able <strong>to</strong> cope with the costs<br />
of supplementing deficiencies in food and water supplies<br />
or accommodating displaced peoples.<br />
Furthermore, significant changes in the environment,<br />
particularly if they bring major human disasters in their<br />
wake, will present grave obstacles <strong>to</strong> sustained economic<br />
and social development in the affected regions.<br />
In the past, such scarcities and effects have led <strong>to</strong> armed<br />
conflicts and massive human migration. They could do so<br />
again. Furthermore, recent experience has shown that, at<br />
the very least, famine, floods and other environmentally<br />
related crises necessitate large transfers of relief funds <strong>to</strong><br />
the countries that have been affected.<br />
In an increasingly interconnected global society, one<br />
nation’s problem inevitably becomes every nation’s<br />
concern.<br />
33
<strong>An</strong> <strong>Introduction</strong> <strong>to</strong> <strong>Climate</strong> <strong>Change</strong><br />
Many argue that we should not allow future climate change <strong>to</strong> exceed levels or rates that are ‘dangerous’ <strong>to</strong><br />
humans or ecosystems. However, danger is a function of both how harmful the impacts of climate change<br />
may be and of the acceptability of such harm. Thus the decision as <strong>to</strong> what is or is not dangerous is a value<br />
judgement that cannot be determined by science alone. Rather, scientists have focused on identifying a<br />
number of ‘reasons for concern’ and determining how these might escalate as the magnitude and/or rate of<br />
climate change increases. In global terms, there are five common reasons for concern that have been<br />
noted, as follows:<br />
■ The irreparable loss of unique and threatened ecosystems. Such ecosystems include tropical glaciers,<br />
coral reefs, mangroves and biodiversity hotspots. These ecosystems are generally confined <strong>to</strong> narrow<br />
geographical ranges and are very sensitive <strong>to</strong> climate change. Many of these will be adversely affected<br />
by even a small temperature increase. Furthermore, their degradation or loss could have far reaching<br />
effects well beyond the regions where they exist. The larger or more rapid the change in climate, the<br />
greater the number of such systems at risk and the damage that is likely <strong>to</strong> occur.<br />
■ Inequitable distribution of impacts. Developing countries tend <strong>to</strong> be more vulnerable <strong>to</strong> climate change<br />
than developed countries, and poor people more than wealthy people. Thus, while a small rise in<br />
temperature appears likely <strong>to</strong> have a net benefit for many developed countries, it would cause net harm<br />
<strong>to</strong> many developing countries. In general, climate change is likely <strong>to</strong> also exacerbate income inequalities<br />
between and within countries. Large or rapid increases in temperature would likely cause net harm <strong>to</strong><br />
most countries, but more so <strong>to</strong> poor ones.<br />
■ Net global impacts will become increasingly negative as global temperature changes become large.<br />
Some experts argue that, for small changes in temperature, net economic benefits around the world may<br />
be greater than the net damages. However, since most people live in developing countries, the majority<br />
of humans would already be adversely affected. At medium <strong>to</strong> high increases in temperature, the net<br />
economic impacts are likely <strong>to</strong> become overwhelmingly negative.<br />
■ Rising temperatures are expected <strong>to</strong> increase the risks associated with extreme weather events.<br />
Examples of such events include floods, droughts, tropical and other s<strong>to</strong>rms, extremely high<br />
temperatures, and wild fires. If the global change in temperature becomes large, there is an increasing<br />
risk of exceeding critical design or natural thresholds for infrastructure collapse and hence catastrophes.<br />
■ Large scale climate surprises. There is a very low risk that climates may undergo an abrupt, quantum<br />
change as long as global temperature changes are small. Examples of such changes include the abrupt<br />
cessation of the Gulf Stream in the North<br />
34<br />
GLOBAL REASONS FOR CONCERN<br />
Atlantic, or the collapse of the West<br />
<strong>An</strong>tarctic Ice Sheet. However, large<br />
changes in climate could cause critical<br />
thresholds that limit these risks <strong>to</strong> be<br />
exceeded. Such large-scale climate<br />
surprises would be calami<strong>to</strong>us.<br />
FIGURE 4.3<br />
Global reasons for concern increase with rising<br />
temperatures<br />
Source: IPCC TAR WGII 2001<br />
Very Low Higher<br />
Positive or Negative Market Impacts: Net Negative in<br />
Majority of People Adversely Affected All Metrics<br />
Negative for Some Regions Negative for Most Regions<br />
Increase Large Increase<br />
Risks from Future<br />
Large-Scale<br />
Discontinuities<br />
Aggregate Impacts<br />
Distribution<br />
of Impacts<br />
Risks from Extreme<br />
<strong>Climate</strong> Events<br />
Risks <strong>to</strong> Some Risks <strong>to</strong> Many Risks <strong>to</strong> Unique and<br />
Threatened Systems<br />
-0.6 0<br />
Past Future<br />
1 2 3 4 5<br />
Increase in global mean temperature after 1990 (°C)
A warmer Canada<br />
Alarge number of <strong>Canadian</strong> researchers from a broad<br />
range of scientific disciplines are now actively<br />
investigating the possible environmental, social, and<br />
economic effects of climate change in Canada. Many of<br />
these scientists share their research results with each other<br />
under programs such as the <strong>Canadian</strong> <strong>Climate</strong> Impacts<br />
and Adaptation Network (C-CIARN) <strong>to</strong> help provide more<br />
comprehensive pictures of how future changes in our<br />
climate and weather may affect our ecosystems, our<br />
economy and our society – region by region and sec<strong>to</strong>r by<br />
sec<strong>to</strong>r. These results also become important <strong>Canadian</strong><br />
input for international assessments in<strong>to</strong> how climate<br />
change may affect the world as a whole. The information<br />
included in this chapter is largely based on recent results<br />
emerging from these studies.<br />
CANADA’S FORESTS<br />
About 45% of Canada’s landmass is covered by trees, from<br />
the black spruce and birches of the cold boreal forests <strong>to</strong><br />
the pine and hardwoods of the warmer and more humid<br />
southern latitudes. The two regions that remain treeless do<br />
so partly for climatic reasons – the Prairie grasslands<br />
because of low soil humidity, and the northern tundra<br />
because of low temperatures.<br />
Given the extent of this resource, it is not surprising that<br />
forestry is Canada’s largest industry. Companies involved in<br />
the harvesting and processing of wood products in this<br />
country generate revenues in excess of $45 billion and<br />
directly employ more than 360 000 people. The forestrelated<br />
<strong>to</strong>urism industry adds several billion dollars of<br />
additional benefits. Furthermore, forests are important<br />
from an ecological perspective. They provide vital habitats<br />
for wildlife, significantly affect the hydrological and<br />
radiative processes of the climate system, reduce soil<br />
erosion and form a major part of the global reservoir of<br />
5<br />
CHAPTER<br />
living carbon. Hence their future health is important not<br />
only <strong>to</strong> Canada’s economic well-being but also <strong>to</strong> the<br />
elemental processes of the biosphere.<br />
Even small changes in temperature and precipitation can<br />
significantly affect the growth behaviour of trees. For<br />
example, a modest 1°C warming over the past century has<br />
already caused a significant increase in the length of the<br />
growing seasons and enhanced plant growth in mid <strong>to</strong><br />
high latitudes of Canada. Trembling aspens in central<br />
Alberta now bloom more than three weeks earlier than<br />
they did 100 years ago. With model projections of<br />
increases in temperatures of some 2 <strong>to</strong> 6°C and changes in<br />
precipitation patterns across much of Canada during the<br />
next 50 years, much larger impacts on its forests can be<br />
expected in the decades <strong>to</strong> come. The net impact on the<br />
biosphere and on <strong>Canadian</strong>s will depend on a wide range<br />
of other biophysical and socio-economic fac<strong>to</strong>rs, and<br />
hence will vary considerably from region <strong>to</strong> region. It<br />
could be positive in one region and negative in another,<br />
and will slowly shift the boundaries of the different forest<br />
types over time. Once forests have fully responded <strong>to</strong> these<br />
changes — a process that could take centuries — the<br />
distribution of ecozones across Canada will likely have<br />
been altered radically (Fig. 5.1). This shift is expected<br />
<strong>to</strong> substantially reduce the <strong>to</strong>tal area of Canada covered<br />
by trees, with most of the losses occurring due <strong>to</strong> the<br />
expansion of grasslands northward and eastward, in step<br />
with warmer temperatures and reductions in available<br />
soil moisture levels in the interior of the North American<br />
continent.<br />
The largest changes would occur in areas now covered by<br />
boreal forests. At the southern edges of these forests, the<br />
dominant black spruce would gradually yield <strong>to</strong> the<br />
encroachment of grasslands and the evergreens and<br />
hardwoods of the cool temperate forests. Meanwhile, at the<br />
northern margins, some northward expansion of the boreal<br />
35
<strong>An</strong> <strong>Introduction</strong> <strong>to</strong> <strong>Climate</strong> <strong>Change</strong><br />
FIGURE 5.1<br />
Potential changes in North American forest and grassland boundaries resulting from a typical doubled CO2 climate. The<br />
graphic on the upper left shows typical vegetation for current climate conditions while the lower right graphic shows<br />
new vegetation areas based on a simulated double CO2 climate. Areas where there is no change in vegetation type<br />
remain white.<br />
forests in<strong>to</strong> tundra regions would occur, although greatly<br />
delayed by the comparatively slow decay of the underlying<br />
permafrost and the poor quality of the soils in many parts<br />
in the tundra landscape.<br />
The net effect of the projected changes in climate could<br />
eventually result in a <strong>Canadian</strong> forest ecosystem that is<br />
more productive than <strong>to</strong>day. In Quebec’s forests, for<br />
example, the combined effects of higher carbon dioxide<br />
concentrations, warmer temperatures and more humid<br />
conditions could help increase average forest growth by<br />
2050 by some 50 <strong>to</strong> 100%. However, in many regions the<br />
process for change is likely <strong>to</strong> be very disruptive. That is<br />
because most <strong>Canadian</strong> tree species can migrate at the rate<br />
36<br />
Source: Bachelet and Neilson 2000.<br />
of 700 m or less per year, while the temperatures that help<br />
determine the range within which each species grows well<br />
can shift by about 100 km for every 1°C of warming.<br />
Hence, along the warm margins of ecosystems, many of<br />
the plants end up in climate conditions ill-suited for their<br />
healthy growth. This is especially the case at ecosystem<br />
margins and threshold areas. Since these vulnerable areas<br />
are more prone <strong>to</strong> the sporadic stresses caused by diseases,<br />
insect infestations and wild fire, their transition from one<br />
forest type <strong>to</strong> another will also be sporadic, and often<br />
abrupt. The related consequences for the services that<br />
forest ecosystems provide <strong>to</strong> the biosphere and <strong>to</strong><br />
<strong>Canadian</strong>s may be severely negative.
CHAPTER 5 | A WARMER CANADA<br />
Canada’s forests are also vulnerable <strong>to</strong> other stresses that,<br />
when added <strong>to</strong> that of climate change, can substantially<br />
add <strong>to</strong> these negative impacts. Particularly in eastern<br />
Canada, increased ultraviolet radiation, ground-level ozone<br />
pollution, acid rain, and leaching of chemicals from the<br />
soil are all fac<strong>to</strong>rs that can harm trees. Past diebacks of<br />
birch and maple stands in Ontario and Quebec may be<br />
symp<strong>to</strong>matic of such stresses. Furthermore, warmer<br />
climates will also quickly bring with them the danger of<br />
increased insect and disease infestation, as insect species<br />
and viruses once alien <strong>to</strong> <strong>Canadian</strong> forests migrate<br />
northward and existing ones become more virulent. In<br />
addition, the more rapid accumulation of dead biomass<br />
caused by these stresses will exacerbate the effects of drier<br />
summer conditions and increased lightning activity in<br />
increasing the frequency and severity of forest fires. Such<br />
changes are already evident in some parts of Canada.<br />
During the warm, dry years since the early 1980s,<br />
infestations of mountain pine beetles in western Canada<br />
have increased dramatically. In 2001 alone, some<br />
18.6 million ha of these forests were affected by insect<br />
defoliation. These direct and indirect effects of climatic<br />
FIGURE 5.2<br />
Projected changes in forest fire risks in 2100 relative <strong>to</strong><br />
<strong>to</strong>day, calculated as a ratio of seasonal severity ratings<br />
(based on CGCM climate simulations)<br />
Source: <strong>Canadian</strong> Forestry Service.<br />
change have helped <strong>to</strong> cause a dramatic rise in the annual<br />
loss of our <strong>Canadian</strong> forests <strong>to</strong> wildfire. In 2002, for<br />
example, some 2.8 million ha of <strong>Canadian</strong> forests were<br />
swept by fire. Experts agree that, in most regions of<br />
Canada, these losses will likely increase as temperatures<br />
rise (Figure 5.2).<br />
While such destruction of forest cover can initially add<br />
large volumes of excess carbon dioxide in<strong>to</strong> the<br />
atmosphere and eventually amplify the warming that has<br />
already occurred, re-growth in affected areas will over<br />
many decades slowly remove much of this carbon from the<br />
atmosphere again.<br />
AGRICULTURE<br />
In 1998, the <strong>Canadian</strong> agriculture and agri-food industry<br />
generated approximately $95 billion in domestic revenue<br />
and was the country’s third largest employer. However,<br />
despite the importance of agriculture <strong>to</strong> its citizens,<br />
Canada’s agricultural potential is limited by, among other<br />
things, its cold climate. With the length of frost-free<br />
growing seasons restricted <strong>to</strong> between 200 days in the<br />
extreme south and merely a matter of weeks in the far<br />
north, <strong>Canadian</strong> soils remain inactive for a major part of<br />
the year. Furthermore, severe winters can cause frost<br />
damage even <strong>to</strong> dormant vegetation, thus restricting the<br />
cultivation of over-wintering crops, such as winter wheat,<br />
on the Prairies and in other similarly affected areas. When<br />
growing seasons do arrive, growth rates of plants in<br />
<strong>Canadian</strong> climates are further restricted by the amount of<br />
heat energy available <strong>to</strong> them during the season. These<br />
fac<strong>to</strong>rs impose major limitations on the types of crops that<br />
can be grown in Canada, as well as on the yields and the<br />
number of crops that can be harvested in one year.<br />
It would seem, therefore, that warmer temperatures would<br />
be very good for Canada’s agriculture. For example, under<br />
typical climate scenarios for 2050 AD, growing seasons<br />
around Whitehorse and Yellowknife would be similar <strong>to</strong><br />
those in Edmon<strong>to</strong>n <strong>to</strong>day, while conditions in New<br />
Brunswick would resemble those of the Niagara peninsula.<br />
Hence, across Canada, there would be considerable<br />
potential for cultivating higher yield crops requiring longer<br />
37
<strong>An</strong> <strong>Introduction</strong> <strong>to</strong> <strong>Climate</strong> <strong>Change</strong><br />
and warmer growing seasons, for increased multi-cropping<br />
in southerly latitudes, and for the expansion of frontier<br />
agriculture northward. Grain corn could become an<br />
important agricultural crop in areas such as Mani<strong>to</strong>ba and<br />
northern Ontario, winter wheat could do well on the<br />
Prairies, and apples and grapes could become highly<br />
productive in Quebec. The direct effects of higher carbon<br />
dioxide as a fertilizer for plants could further add <strong>to</strong> these<br />
benefits.<br />
However, agricultural crop production is also very<br />
sensitive <strong>to</strong> changes and extremes in weather and climate.<br />
Many crops, for example, are sensitive <strong>to</strong> heat stress,<br />
particularly during key stages of development, and may be<br />
adversely affected by the increased frequency and severity<br />
of summer heat waves. Furthermore, projected changes in<br />
summer precipitation patterns and characteristics suggest<br />
that the duration and severity of drought periods may<br />
increase significantly in many areas within the midlatitudes<br />
of the Northern Hemisphere. Rising temperatures<br />
will also increase the rate at which vegetation and soils<br />
lose water <strong>to</strong> the atmosphere, thus further reducing<br />
available soil moisture. However, when rain does occur, it<br />
is expected <strong>to</strong> be more intense, thus increasing the risks of<br />
periods of excessive soil moisture and regional floods and<br />
related soil losses <strong>to</strong> water erosion. In fact, most major<br />
crop disasters that occur each year are caused by such<br />
extremes in temperature and soil moisture. Recent events<br />
in the <strong>Canadian</strong> Prairies, such as the sequence of drought<br />
years between 2000 and 2003, as well as the very wet year<br />
in many parts of that region in 2004, while not<br />
unprecedented in Canada’s climate his<strong>to</strong>ry, are in many<br />
respects useful examples of what may occur more<br />
frequently during the decades <strong>to</strong> come.<br />
Other fac<strong>to</strong>rs affecting crop production will not stay<br />
constant or unrestrictive. In the first place, the availability<br />
of soils suitable for agriculture in Canada is limited. At<br />
present, only about 10 million hectares of potential<br />
agricultural land in Canada are unutilized due <strong>to</strong> climate<br />
constraints, and much of this consists of marginal soils<br />
unsuitable for cereal grain production. Some of this<br />
potential farmland is also covered with valuable timber<br />
stands. Consequently, the potential for expanding<br />
agriculture in<strong>to</strong> the northern frontier is not large. Secondly,<br />
38<br />
because insects, pests and plant diseases respond quite<br />
quickly <strong>to</strong> climatic shifts, the probability of severe<br />
infestations in future decades is increased.<br />
WATER RESOURCES<br />
Canada’s freshwater is an immensely valuable resource that<br />
is considered by many <strong>to</strong> be plentiful, renewable and<br />
relatively clean. It is s<strong>to</strong>red in its liquid form in rivers,<br />
lakes, soils and aquifers and in vegetation. It is also present<br />
in its solid form in glacier ice, snowpacks, lake and river<br />
ice and permafrost. Its presence is essential <strong>to</strong> life and very<br />
important <strong>to</strong> a broad range of economic activities and<br />
sec<strong>to</strong>rs of society. Some estimates suggest that its<br />
measurable contribution <strong>to</strong> the <strong>Canadian</strong> economy may<br />
exceed $20 billion/year. However, its overabundance can<br />
also cause catastrophic floods and related damage <strong>to</strong><br />
ecosystems and society. Despite Canada’s abundance of<br />
water, this valuable resource is now under pressure from<br />
growing and often conflicting human requirements.<br />
Furthermore, it is particularly vulnerable <strong>to</strong> the impacts of<br />
climate variability and change.<br />
<strong>Climate</strong> models project that, during the coming decades,<br />
water resources will become more abundant across much<br />
of northern Canada. Furthermore, its presence as snow<br />
and ice will decrease over time, being replaced by water<br />
in its liquid form. Consequently, winter stream flows are<br />
expected <strong>to</strong> increase across much of Canada, spring<br />
freshets will occur earlier, and peak melt water runoff<br />
will be lower in magnitude. However, slowly degrading<br />
permafrost will also change the ground water hydrology<br />
in the north, changing streamflows and breaking down<br />
natural barriers that currently control much of regional<br />
drainage patterns.<br />
In contrast, summer water abundance in southern Canada<br />
will likely decrease – and become more variable. Various<br />
studies suggest that the combined effects of increased<br />
evaporation of surface water under warmer climates and<br />
altered precipitation patterns will likely cause summer<br />
meteorological droughts in the interior of southern Canada<br />
<strong>to</strong> become more frequent, more intense, and of longer<br />
duration. These will, in turn, result in intervals of very low
CHAPTER 5 | A WARMER CANADA<br />
FIGURE 5.3<br />
Various model projections of future changes in Lake Erie<br />
water levels, compared with his<strong>to</strong>rical changes since 1920<br />
<strong>Change</strong> in water levels<br />
(cm)<br />
80<br />
40<br />
0<br />
-40<br />
-80<br />
-120<br />
-160<br />
-200<br />
His<strong>to</strong>rical<br />
Range of future<br />
projections<br />
1920 1940 1960 1980 2000<br />
Year<br />
2020 2040 2060<br />
streamflows and lake levels and depleted ground water<br />
resources. For larger water reservoirs, this is expected <strong>to</strong><br />
lead <strong>to</strong> persistent decreases in mean water levels. For<br />
example, some of the Great Lakes, which collectively<br />
provide freshwater <strong>to</strong> some 45 million people, could<br />
experience a drop in water levels of a metre or more<br />
within the next 50 <strong>to</strong> 75 years.<br />
Such intense periods of water shortages will have major<br />
impacts on hydro electricity production, marine<br />
transportation, agricultural irrigation, on-water recreational<br />
activities, municipal water supply, and a range of other<br />
socio-economic uses. In western Canada, these shortages<br />
will be exacerbated by the gradual disappearance of alpine<br />
glaciers that currently provide much of the freshwater<br />
input in regional streams and rivers in summer.<br />
Competition for water use and political pressures for water<br />
transfers between hydrological basins will increase.<br />
Furthermore, severe droughts will also cause increased<br />
degradation of water quality, greater risk of eutrophication<br />
and extensive harm <strong>to</strong> aquatic ecosystems.<br />
Ironically, while spring floods due <strong>to</strong> rapid snow melt may<br />
decrease in frequency, there may be an increase in the risk<br />
of more intense and frequent summer flooding and the<br />
related damages that such floods can cause. That is<br />
because hotter summers are likely <strong>to</strong> increase the intensity<br />
of rainfall events when they do occur. For example,<br />
<strong>Canadian</strong> studies suggest that, by 2080, an extreme<br />
summer rainfall event that now occurs about once every<br />
40 years might occur as often as once per decade. When<br />
precipitation is intense, less of the water enters the soils <strong>to</strong><br />
recharge groundwater and more runs off in<strong>to</strong> streams,<br />
rivers, wetlands and lakes. Such run-off can help recharge<br />
surface reservoirs depleted by drought. However, it can<br />
also enhance soil erosion and can result in much more<br />
disastrous summer floods.<br />
FISHERIES<br />
With its long coastline and its many fresh water lakes,<br />
commercial and recreational fishing is an important part of<br />
Canada’s economy, contributing more than $10 billion<br />
each year. More importantly, for many <strong>Canadian</strong>s,<br />
particularly in aboriginal and small coastal communities,<br />
it is a way of life – and an inherent part of their culture.<br />
Hence the well-being of fish resources in waters within<br />
and adjacent <strong>to</strong> Canada is important.<br />
However, most fish species have a distinct, although<br />
complex set of environmental and habitat conditions<br />
within which they thrive and beyond which they decline<br />
and possibly perish. These conditions include a number<br />
of climatic fac<strong>to</strong>rs, such as air and water temperature,<br />
precipitation and wind patterns. Hence, fish health,<br />
productivity and distribution are also sensitive <strong>to</strong> changes<br />
in climate. For any given region, some species will<br />
become healthier and more abundant, others will become<br />
distressed and perhaps disappear completely, and new<br />
species may invade and even dominate. There is good<br />
evidence <strong>to</strong> suggest that such changes are already taking<br />
place. For example, climate change appears <strong>to</strong> be an<br />
important fac<strong>to</strong>r in declining salmon s<strong>to</strong>cks off the coast<br />
of British Columbia, while sockeye and pink salmon are<br />
being reported in Arctic regions well beyond their<br />
known range. In the Atlantic Ocean, recent rises in<br />
water temperatures are believed <strong>to</strong> have contributed<br />
<strong>to</strong> a decline in flounder.<br />
39
<strong>An</strong> <strong>Introduction</strong> <strong>to</strong> <strong>Climate</strong> <strong>Change</strong><br />
This relationship between climate and fish resources is<br />
complex, involving both the direct effects on each species<br />
as well as the indirect effects through changes in<br />
abundance of food supply and preda<strong>to</strong>rs. Some species,<br />
like salmon, are also affected by changes in both<br />
freshwater and ocean habitats. In addition, there are other<br />
important non-climatic fac<strong>to</strong>rs affecting fish resources,<br />
particularly those of man-made pollution and resource<br />
mismanagement. Although these interconnections are as<br />
yet poorly unders<strong>to</strong>od, there are some useful projections<br />
that can already be made. For example, projections for<br />
higher water temperatures and more frequent periods of<br />
low river flow suggest increased salmon mortality as they<br />
head up-stream <strong>to</strong> spawn. Furthermore, more frequent<br />
flash floods could also damage gravel beds used for<br />
spawning. However, this may be offset by reduced<br />
mortality of juvenile salmon as they head out <strong>to</strong> sea.<br />
<strong>Change</strong>s in ocean climate also affect the distribution and<br />
significance of certain marine diseases, such as the eastern<br />
oyster disease, and the risks of harmful <strong>to</strong>xic algae blooms.<br />
In the Arctic, more open water may increase the food<br />
supply and hence abundance of many fish species, but<br />
could threaten Arctic cod and alter traditional northern<br />
fishing practices because of changes in sea ice cover.<br />
In fresh water lakes and rivers, warmer temperatures<br />
would generally benefit warm water fish such as bass and<br />
sturgeon, but reduce the abundance of cold water species<br />
like trout and lake salmon. New species that thrive in<br />
warmer waters can be expected <strong>to</strong> migrate in<strong>to</strong> these lakes,<br />
competing with existing species, some of which may<br />
disappear completely. Lower water levels would threaten<br />
shoreline wetlands that provide important fish habit and<br />
result in degraded water quality. However, shorter ice<br />
cover seasons would reduce over winter fish mortality.<br />
COASTAL ZONES<br />
Canada has more than 240 000 kilometres of ocean<br />
shoreline. Along these shores are the coastal ecosystems,<br />
where the dynamic interaction of land and sea help<br />
provide high ecological diversity. Roughly seven million<br />
<strong>Canadian</strong>s live in these coastal areas, many in smaller<br />
communities that depend on the ocean’s resources and<br />
40<br />
<strong>to</strong>urism <strong>to</strong> make a living. Hence, healthy coastal<br />
ecosystems are of critical importance <strong>to</strong> their culture<br />
and economic well-being.<br />
The sensitivity of these coastlines <strong>to</strong> the impacts of<br />
climate change, particularly those due <strong>to</strong> sea level rise, is<br />
influenced by a variety of fac<strong>to</strong>rs, particularly the regional<br />
characteristics of ocean processes, the nature of the<br />
shoreline, and whether vertical movements of the Earth’s<br />
crust are causing the regional land masses <strong>to</strong> rise or sink.<br />
Much of Canada’s coastline is rugged and unpopulated. In<br />
areas such as the Hudson Bay region, the land mass is also<br />
still rebounding due <strong>to</strong> the delayed effects of deglaciation<br />
many thousands of years ago. This can offset at least some<br />
of the effects of global sea level rise. Thus, Canada is much<br />
less vulnerable <strong>to</strong> the impacts of global sea level rise than<br />
many other nations. However, it will not remain unaffected<br />
(Figure 5.4).<br />
In the Maritime Provinces, for example, the combination<br />
of sinking land masses and abundance of sandy shores<br />
make more than 80% of the region’s coastline moderately<br />
<strong>to</strong> highly sensitive <strong>to</strong> sea level rise. Accelerated sea level<br />
FIGURE 5.4<br />
Sensitivity of Canada’s coastlines <strong>to</strong> sea level rise
CHAPTER 5 | A WARMER CANADA<br />
rise would inundate much of the region’s lowlands,<br />
causing some of the highly productive tidal salt marshes <strong>to</strong><br />
disappear. Many of the freshwater coastal marshes would<br />
become salt marshes, and soft coastlines would erode more<br />
rapidly. Both stronger waves in winter due <strong>to</strong> reduced sea<br />
ice cover and a likely increase in intense s<strong>to</strong>rm surges<br />
would increase the risks of local flooding and erosion. In<br />
populated areas, this will have large impacts on built<br />
infrastructure. Along the north shore of Prince Edward<br />
Island alone, about 10% of current assessed coastal<br />
property values could be lost within 20 years, and almost<br />
50% within the next century.<br />
Along the Arctic coast, the largest impacts of climate<br />
change will likely be caused by changes in reduced ice<br />
cover and the decay of permafrost. Reduced sea ice cover<br />
will benefit some ocean species, such as whales, that need<br />
access <strong>to</strong> open water, but will threaten species such as<br />
seals and polar bears that rely on the presence of ice. It<br />
would open up Arctic waters <strong>to</strong> increased marine shipping<br />
and create new opportunities for economic regional<br />
development. However, this also adds <strong>to</strong> concerns about<br />
pollution and sovereignty, and adversely impacts<br />
northerners who rely on extended, stable ice cover for safe<br />
travel, access <strong>to</strong> communities and hunting grounds, and<br />
other traditional activities. Decaying permafrost would also<br />
destabilize coastal land areas, increasing the risks of land<br />
slides and compounding the coastal erosion caused by<br />
rising sea levels and reduced ice cover. Some communities<br />
in low lying regions of the western Arctic are already<br />
undergoing such changes. Parts of Tuk<strong>to</strong>yaktuk, for<br />
example, have experienced extensive coastal retreat since<br />
1935, resulting in the destruction or relocation of a<br />
number of community buildings. While protective<br />
measures have helped <strong>to</strong> stabilize this retreat, further<br />
sea level rise and permafrost decay would cause further<br />
inundation and erosion.<br />
<strong>An</strong>other highly sensitive coastal region is the Fraser delta<br />
region of British Columbia. This region is highly<br />
populated, and significant parts of the region are less than<br />
one metre above sea level and already protected by an<br />
extensive dyke system. Here the main concerns include the<br />
breaching of these dykes, erosion of soft shoreline areas<br />
and the consequent risks <strong>to</strong> coastal ecosystems,<br />
infrastructure and archaeological sites. A one metre<br />
rise in sea level would put more than 15 000 hectares of<br />
residential and industrial properties and 4 600 hectares of<br />
highly productive farmland at risk, and would contaminate<br />
much of the regions ground water with salt intrusion.<br />
TRANSPORTATION<br />
<strong>Canadian</strong>s spend more than $150 billion each year <strong>to</strong><br />
travel and transport goods across Canada and <strong>to</strong> and from<br />
other nations. The infrastructure involved employs more<br />
than 800 000 people, uses more than 1.4 million km of<br />
roads, 50 000 km of rail lines and 1700 airports and<br />
involves more than 17 million mo<strong>to</strong>r vehicles, 28 000<br />
airplanes, and 2000 commercial marine vessels. It is a<br />
system that is essential <strong>to</strong> Canada’s economy and its<br />
culture. It is also a system whose various components are<br />
sensitive <strong>to</strong> climate and weather throughout their service<br />
lifetimes – in planning, design, construction, maintenance<br />
and performance.<br />
Although the transportation infrastructure in Canada is<br />
quite robust, future changes in climate will have significant<br />
impacts – some positive and other adverse. For example,<br />
warmer winters will likely reduce frost damage <strong>to</strong><br />
pavements and rails in many southern parts of Canada,<br />
and would shorten the season for snow removal and<br />
related transportation hazards. However, milder winters<br />
may increase surface transportation infrastructure damage<br />
in areas where warmer temperatures are likely <strong>to</strong> increase<br />
freeze-thaw cycles. More frequent hot days in summer may<br />
also increase road and rail damage. In northern regions,<br />
milder winters would reduce the bearing capacity and<br />
length of time winter roads can used <strong>to</strong> transport goods<br />
and resources <strong>to</strong> and from isolated communities.<br />
Degradation of permafrost would further affect all-season<br />
roads and transport of resources by rail and pipelines.<br />
<strong>Change</strong>s in the frequency and severity of other types of<br />
extreme weather can also be important <strong>to</strong> transportation.<br />
Large floods, which are expected <strong>to</strong> become more<br />
frequent, can wash out large sections of roadways and rail<br />
beds, while more frequent intense winter s<strong>to</strong>rms may<br />
41
<strong>An</strong> <strong>Introduction</strong> <strong>to</strong> <strong>Climate</strong> <strong>Change</strong><br />
trigger additional economic losses due <strong>to</strong> major<br />
disruptions of air and surface transportation.<br />
For marine transportation, shorter and milder winter ice<br />
seasons will allow longer shipping seasons and may reduce<br />
the risk of ice damage <strong>to</strong> ships and coastal infrastructure.<br />
The Northwest Passage could eventually become a major<br />
international shipping route. On the other hand, increased<br />
surging of Greenland glaciers may increase iceberg<br />
hazards. Further, in the Great Lakes and St. Lawrence<br />
Seaway system, lower lake levels would reduce the<br />
carrying capacity of marine transports through the<br />
system.<br />
HUMAN HEALTH AND WELL BEING<br />
Good health is one of the most important aspects of wellbeing.<br />
In fact, <strong>Canadian</strong>s spend more than $100 billion<br />
each year <strong>to</strong> maintain and improve their health.<br />
Weather is an important fac<strong>to</strong>r in how healthy we are. In<br />
Canada, for example, deaths due <strong>to</strong> heat stroke or heart<br />
attacks are most prevalent in summer, when heat stress is<br />
more likely <strong>to</strong> affect people. On the other hand, illnesses<br />
and deaths due <strong>to</strong> respira<strong>to</strong>ry infections such as<br />
pneumonia or flu viruses occur much more frequently<br />
during the winter season. Extreme weather events,<br />
including floods, droughts, wind s<strong>to</strong>rms, bad air days and<br />
lightning, can also cause serious and sometimes deadly<br />
damage <strong>to</strong> our well-being.<br />
<strong>Climate</strong> change will alter this relationship between<br />
health and weather in complex ways. For example,<br />
a modest increase in average temperatures can cause a<br />
disproportionate increase in the number of very hot days,<br />
and hence the occurrence of heat stress related deaths<br />
and illnesses. Intense smog episodes are also projected<br />
<strong>to</strong> become more frequent during such hot summer days,<br />
causing further stress for young children, the elderly and<br />
those with respira<strong>to</strong>ry problems. During periods of intense<br />
drought, dust s<strong>to</strong>rms and smoke from forest fires can add<br />
<strong>to</strong> this stress.<br />
42<br />
Warmer climates and altered weather behaviour will also<br />
affect the spread of various harmful substances and<br />
diseases. During floods, bacteria and chemicals from<br />
sewage spills and run-off from farmlands can inject these<br />
in<strong>to</strong> drinking water and necessitate the closing of beaches<br />
<strong>to</strong> swimming. Warmer climates also increase the risk of<br />
food poisoning due <strong>to</strong> enhanced microbial activity or the<br />
occurrence of <strong>to</strong>xic algae blooms in marine environments.<br />
Recently the warming of climates in southern Canada has<br />
also contributed <strong>to</strong> the spread of insect and rodent borne<br />
diseases, such as the West Nile Virus and Lyme disease.<br />
<strong>An</strong>other potential health risk is the re-emergence of<br />
malaria in southern Canada.<br />
In northern Canada, changes in the physical environment<br />
will make winters less stressful, but will increase the health<br />
risks associated with travel over weaker ice surfaces and<br />
will make the harvesting of traditional food sources more<br />
difficult. Furthermore, changes in atmospheric circulation<br />
and warmer temperatures may increase the transport of<br />
harmful pollutants from industrial regions <strong>to</strong> the north.<br />
ENERGY PRODUCTION AND USE<br />
Each year, <strong>Canadian</strong>s consume about 11 petajoules of<br />
energy and export more than 5 petajoules of energy <strong>to</strong><br />
other countries, primarily the United States. Hence, the<br />
exploration, production, transportation and use of energy<br />
is an important aspect of Canada’s economy, directly<br />
employing some 225 000 people and contributing about<br />
$65 billion <strong>to</strong> Canada’s Gross Domestic Product.<br />
The energy sec<strong>to</strong>r is also very sensitive <strong>to</strong> weather and its<br />
variations, and hence will be significantly impacted by<br />
climate change.<br />
For example, energy consumption for space heating and<br />
cooling in our homes, offices and fac<strong>to</strong>ries changes with<br />
outside temperatures. Within the next 50 years or so, the<br />
projected warming of our climate could reduce winter<br />
heating costs in Canada by some 20-30%. These savings<br />
will be partially offset by increased summer cooling costs
CHAPTER 5 | A WARMER CANADA<br />
in southern Canada. Warm climates would also generally<br />
improve the efficiency of surface and marine transportation<br />
of oil and gas.<br />
However, climate change may also have significant effects<br />
on the production and transportation of energy. For<br />
instance, in southern Canada, an expected decrease in<br />
mean lake levels and river flows and increased frequency<br />
of severe droughts will likely decrease the potential for<br />
hydro electricity generation. The reverse is likely in<br />
northern Canada, where water abundance is likely <strong>to</strong><br />
increase. There is also a risk that more intense winter<br />
s<strong>to</strong>rms could increase damage and disruption of electricity<br />
transmission grids. Milder winters would also benefit this<br />
sec<strong>to</strong>r through shorter ice seasons but also challenge it<br />
with the risk of more frequent mid-winter river ice jams.<br />
In northern and coastal regions, fossil fuel energy<br />
production and transportation activities will also need <strong>to</strong><br />
deal with the effects of decaying permafrost on pipelines<br />
and roads, and of increased iceberg hazards along Canada’s<br />
east coast.<br />
GLOBAL SECURITY<br />
Experts predict that the greatest economic and social costs<br />
of climate change will likely occur in poor regions of the<br />
world, many of which are already challenged with<br />
inadequate food and water resources and with other<br />
challenges such as rising sea levels. However, climate<br />
related disasters abroad will also have wide ranging<br />
indirect implications for the economic, social and political<br />
security of <strong>Canadian</strong>s. <strong>Change</strong>s in the global distribution<br />
of food production, for instance, will alter traditional food<br />
trade patterns. Canada, as a major exporter and importer<br />
of food, will need <strong>to</strong> adapt <strong>to</strong> the new conditions, finding<br />
new supplies in some cases and new markets in others.<br />
Meanwhile, the potential social upheaval from chronic<br />
food shortages and other disasters from climate change in<br />
the developing world will place further pressure on<br />
Canada <strong>to</strong> provide emergency relief assistance, accept<br />
environmental refugees and help resolve armed conflicts<br />
that may arise from increased resource scarcities.<br />
Furthermore, while pursuing aggressive and perhaps<br />
costly domestic action <strong>to</strong> reduce their own emissions of<br />
greenhouse gases, Canada and other industrialized nations<br />
will be expected <strong>to</strong> transfer financial and technical<br />
resources <strong>to</strong> help developing nations undertake similar<br />
action.<br />
43
<strong>An</strong> <strong>Introduction</strong> <strong>to</strong> <strong>Climate</strong> <strong>Change</strong><br />
In spite of the uncertainties associated with them, climate models now provide a reasonably clear indication<br />
of the probable direction of the large scale change of average surface climates during the decades <strong>to</strong><br />
come. However, both humans and ecosystems are much more vulnerable <strong>to</strong> the frequency, intensity and<br />
duration of extreme weather events such as droughts, floods, wind s<strong>to</strong>rms, heat waves and cold spells than<br />
<strong>to</strong> gradual shifts in climate. Because such events often exceed the <strong>to</strong>lerance of our social and ecological<br />
systems and are difficult <strong>to</strong> predict in advance, they can bring with them hardship, economic loss, severe<br />
social and ecological disruption, and even loss of life.<br />
Determining the influence of warmer climate on the risks associated with extreme weather events is<br />
therefore critical <strong>to</strong> our understanding of the impact of an enhanced greenhouse effect. However, climate<br />
models have so far provided only preliminary indications of how these risks may change. Studies in<strong>to</strong> past<br />
relationships between climate and extreme weather, and the use of extreme event models linked <strong>to</strong> climate<br />
models have helped <strong>to</strong> provide additional insights. Experts have considerable confidence in some of the<br />
results, like those related <strong>to</strong> temperature extremes, but much less so for other types of extremes.<br />
Not surprisingly, these studies suggest with considerable confidence that hot spells in summer will become<br />
more frequent and more severe, while very cold periods in winter will become less frequent – although they<br />
will still occur. By 2050, for example, hot summer days in southern Canada exceeding 30°C are likely <strong>to</strong><br />
become four times more frequent than <strong>to</strong>day. Both extreme low and high precipitation events are also<br />
expected <strong>to</strong> become more frequent. For instance, by mid-21st century, extreme periods of low<br />
precipitation across central North America which presently occur about once every 50 years could happen<br />
as often as once every 15 <strong>to</strong> 20. At the other extreme, intense rainfall events could also occur twice as<br />
frequently. These changes have major implications for the frequency of intense droughts and floods.<br />
Much less certain are the impacts of climate change on the frequency and severity of s<strong>to</strong>rms such as<br />
hurricanes, <strong>to</strong>rnadoes and winter blizzards. There are indications, however, that the maximum potential<br />
intensity of such s<strong>to</strong>rms are likely <strong>to</strong> increase as the surface temperatures of the Earth increase.<br />
44<br />
CLIMATE CHANGE AND EXTREME WEATHER<br />
FIGURE 5.5<br />
Number of days with temperatures<br />
exceeding 30°C, 2050 vs <strong>to</strong>day
How do we respond?<br />
As the preceding chapters indicate, climate change<br />
is a complex issue that is only partially unders<strong>to</strong>od.<br />
Yet it is also an issue of critical importance <strong>to</strong> human<br />
societies, particularly those in developing regions of<br />
the world and of future generations. In general, experts<br />
agree that policy makers cannot wait until all the scientific<br />
questions are answered before they act, since by then<br />
it may be far <strong>to</strong>o late <strong>to</strong> do so. Hence, we must approach<br />
this as a risk management problem. To do so requires<br />
three distinctly different but complementary types<br />
of responses.<br />
First, scientists need <strong>to</strong> continue <strong>to</strong> work diligently <strong>to</strong><br />
better understand how the climate system works, how<br />
it is likely <strong>to</strong> change in the future, how such changes may<br />
affect natural ecosystems and human society and how we<br />
might adapt <strong>to</strong> these changes. Such enhancement of<br />
understanding will be important <strong>to</strong> policy makers in the<br />
future as they deal with increasingly <strong>to</strong>ugh decisions<br />
on how <strong>to</strong> respond <strong>to</strong> the risks that a changing climate<br />
will pose.<br />
Secondly, policy makers already need <strong>to</strong> consider what<br />
measures can be taken now <strong>to</strong> reduce the emissions of<br />
greenhouse gases, which are projected <strong>to</strong> be the primary<br />
drivers for future climate change. Emissions need <strong>to</strong> be<br />
reduced <strong>to</strong> a level that would ensure that the rate and<br />
magnitude of future climate change remain within<br />
acceptable limits. Such measures would not be able <strong>to</strong> s<strong>to</strong>p<br />
future climate change from happening – we are <strong>to</strong>o late for<br />
that – but would hopefully buy both ecosystems and<br />
societies time <strong>to</strong> adapt <strong>to</strong> the changes that do occur. While<br />
initial measures can be modest, they will likely need <strong>to</strong> be<br />
strengthened as the scientific understanding improves, and<br />
as the evidence for potentially dangerous changes in<br />
climate becomes more convincing.<br />
The third response strategy is <strong>to</strong> anticipate the changes in<br />
climate that we expect <strong>to</strong> be unavoidable, and <strong>to</strong> prepare<br />
for these through adaptation measures. Such measures can<br />
improve our <strong>to</strong>lerance for change and raise the thresholds<br />
of acceptability.<br />
ENHANCING OUR UNDERSTANDING OF<br />
CLIMATE CHANGE<br />
The global research effort<br />
6<br />
CHAPTER<br />
In 1957, American researchers Roger Revelle and Hans<br />
Seuss issued a clear warning <strong>to</strong> the international science<br />
community that human interference with the climate<br />
system was a serious concern that needed <strong>to</strong> be<br />
investigated. They noted that the rapid increase in carbon<br />
dioxide emissions from the exponential rise in use of fossil<br />
fuels for energy was initiating a global scale geophysical<br />
experiment with the planet that was poorly unders<strong>to</strong>od<br />
and potentially dangerous. Revelle and Seuss called for a<br />
major global research effort <strong>to</strong> understand the<br />
implications. They themselves started a program for<br />
rigorous moni<strong>to</strong>ring of atmospheric composition.<br />
It <strong>to</strong>ok another two decades after this warning before the<br />
international science community began <strong>to</strong> respond in an<br />
organized and coordinated manner. A major miles<strong>to</strong>ne in<br />
this development was the first World <strong>Climate</strong> Conference,<br />
held in Geneva in 1979. Conference participants<br />
considered the unusual global weather behaviour of the<br />
previous decades, discussed how <strong>to</strong> move forward <strong>to</strong><br />
better understand how the climate system works, and<br />
agreed on the need <strong>to</strong> coordinate and accelerate related<br />
national research efforts. In response, the World<br />
Meteorological Organization (WMO) collaborated with the<br />
United Nations Environment Programme (UNEP) and the<br />
International Council of Scientific Unions (ICSU) <strong>to</strong><br />
45
<strong>An</strong> <strong>Introduction</strong> <strong>to</strong> <strong>Climate</strong> <strong>Change</strong><br />
launch the World <strong>Climate</strong> Programme (WCP). In 1986, the<br />
ICSU established a complementary and ambitious initiative<br />
called the International Geosphere-Biosphere Programme<br />
(IGBP). The IGBP sought <strong>to</strong> expand the WCP research<br />
efforts <strong>to</strong> include the Earth’s entire living ecosystem.<br />
These and other related programs have already contributed<br />
substantially <strong>to</strong> our understanding of the global climate<br />
system and the sensitivity of ecosystems and human<br />
society <strong>to</strong> changes within it. Continued research is<br />
expanding our knowledge of how elements such as clouds,<br />
sea ice, and the hydrological cycle affect climatic processes.<br />
It is also unraveling such major uncertainties as the<br />
complex role of the oceans as a reservoir for greenhouse<br />
gases and as a sink, source and transporter of heat.<br />
Because the effects of climate shifts will vary from one area<br />
<strong>to</strong> another, efforts are being made as well <strong>to</strong> develop useful<br />
scenarios of regional climate change. As these research<br />
efforts continue, impact and adaptation studies are<br />
beginning <strong>to</strong> identify those natural and human systems<br />
that are most sensitive <strong>to</strong> climate change and <strong>to</strong> investigate<br />
how such sensitivities might be ameliorated through<br />
actions <strong>to</strong> mitigate the impacts. As they progress, such<br />
studies also need <strong>to</strong> look carefully at the <strong>to</strong>tal impact of all<br />
assaults on natural ecosystems and human health,<br />
including acid precipitation, increased ultraviolet radiation<br />
and local air pollution as well as climate change.<br />
Assessing and communicating climate<br />
change science<br />
Traditionally, scientists seek new knowledge by observing<br />
the behaviour of physical and chemical systems, proposing<br />
hypotheses <strong>to</strong> describe the processes that contribute <strong>to</strong><br />
such behaviour, then testing these hypotheses through<br />
experimentation. Results are shared with peers, who<br />
engage in adversarial debate in an effort <strong>to</strong> disprove the<br />
hypothesis and/or seek <strong>to</strong> reproduce results. This scientific<br />
process helps <strong>to</strong> slowly build up the incremental<br />
knowledge that helps humanity <strong>to</strong> understand the<br />
behaviour of natural systems and <strong>to</strong> advise non-scientists<br />
accordingly. In many respects, confidence in the science<br />
being communicated is thus based largely on the<br />
unsuccessful attempts <strong>to</strong> disprove hypotheses and theories,<br />
rather than the ability <strong>to</strong> provide absolute proof.<br />
46<br />
However, scientific issues such as climate change are very<br />
complex. They involve a very broad range of scientific<br />
disciplines, and must therefore consider the intricate<br />
interactions and feedbacks between the various<br />
components of the issue. Furthermore, at least for the<br />
climate system, human society is an inextricable part of the<br />
challenge in understanding its behaviour – both in terms<br />
of causes for change and feedbacks from human response<br />
<strong>to</strong> impacts. Finally, because the consequences of the<br />
‘geophysical’ experiment that humans are now undertaking<br />
with the planet are already occurring <strong>to</strong>day and are<br />
potentially dangerous, there is urgency in taking action <strong>to</strong><br />
reduce the risks. In other words, politicians and the public<br />
may need <strong>to</strong> respond <strong>to</strong> the threat well before all the<br />
scientific answers <strong>to</strong> their concerns and questions are fully<br />
addressed. This presents a major communication challenge<br />
for the scientific community - one that seeks <strong>to</strong> effectively<br />
provide decision makers with the available information<br />
they need without compromising its scientific integrity.<br />
To ensure such evolving scientific knowledge is made<br />
available <strong>to</strong> the policy community in a timely and effective<br />
manner, regular multi-disciplinary science assessments are<br />
needed. Furthermore, <strong>to</strong> help ensure the accuracy,<br />
relevance and completeness of such assessments, they need<br />
<strong>to</strong> be reviewed by both the scientific peer community and<br />
stakeholders outside of the science community. The WMO<br />
and UNEP, at the request of the United Nations General<br />
Assembly, established the Intergovernmental Panel on<br />
<strong>Climate</strong> <strong>Change</strong> (IPCC) in 1988 <strong>to</strong> coordinate and<br />
facilitate such assessment processes for climate change<br />
science.<br />
To date, the IPCC has prepared three major comprehensive<br />
assessments of climate change science, the first completed<br />
in 1990, the second in 1995 and the third in 2001. A<br />
fourth assessment, <strong>to</strong> be completed in 2007, is now<br />
underway. The assessments have focused on the three<br />
themes: climate science, impacts and adaptation, and<br />
mitigation options. Each assessment takes more than two<br />
years <strong>to</strong> complete, and each has involved several thousand<br />
scientific experts from countries around the world <strong>to</strong> draft<br />
and review the contents of the reports. The full report is<br />
also summarized in a Summary for Policy Makers (SPM)<br />
report and a Synthesis Report (SR). The simplified
CHAPTER 6 | HOW DO WE RESPOND?<br />
contents of these two reports are jointly drafted by lead<br />
scientific authors of the main report and staff members of<br />
the IPCC Bureau, and then negotiated - line by line - by<br />
government representatives meeting in IPCC plenary<br />
session. Lead authors are present during this process <strong>to</strong><br />
ensure the accuracy and integrity of the information<br />
provided, but the involvement of government<br />
representatives helps <strong>to</strong> enhance their comprehensibility<br />
and relevance <strong>to</strong> policy makers.<br />
Some individuals have argued, primarily through media<br />
outlets and web sites, that the confidence in climate<br />
change science is inadequate <strong>to</strong> justify action at this time<br />
and that the integrity of the IPCC assessment process has<br />
been compromised by political interference. However,<br />
following the release of the third IPCC assessment,<br />
seventeen academies of sciences from various countries<br />
around the world released a strong endorsement of both<br />
the IPCC assessment process and the conclusions of its<br />
reports. Independently, a special committee of the<br />
American National Academies of Sciences advised their<br />
country’s President that the full IPCC Third Assessment<br />
Report on climate change science was “an admirable<br />
summary of research activities in climate science”.<br />
While the committee acknowledged that the SPM puts<br />
stronger emphasis on concerns about the risks posed by<br />
climate change and less emphasis on uncertainties than<br />
did the full report – <strong>to</strong> be expected from a summary<br />
document – it had the full consent of convening lead<br />
authors. Furthermore, they noted, such differences in<br />
emphasis did not affect the fundamental conclusions of<br />
the report.<br />
Exploring linkages <strong>to</strong> other atmospheric issues<br />
<strong>Climate</strong> change and other atmospheric issues, such as<br />
stra<strong>to</strong>spheric ozone depletion, acid rain and local air<br />
quality, are not separate environmental concerns but<br />
related consequences of a more fundamental issue – the<br />
effect of human activities on the chemical composition of<br />
the atmosphere itself. In fact, the relationships between<br />
these concerns are multiple and complex.<br />
One way in which these issues are related is through<br />
common human activities that release the gases and<br />
aerosols that cause them. These activities fall in<strong>to</strong> three<br />
broad but related categories: land use change, industrial<br />
processes and the burning of fossil fuels. The release of<br />
chlorofluorocarbons, for example, both contributes <strong>to</strong> the<br />
destruction of the ozone layer in the stra<strong>to</strong>sphere and<br />
enhances the greenhouse effect. The burning of gasoline in<br />
a car engine releases greenhouse gases such as carbon<br />
dioxide and nitrous oxide, but also emits volatile gases<br />
such as nitrogen oxides that contribute <strong>to</strong> urban smog<br />
issues. The chemical processes that contribute <strong>to</strong> smog also<br />
remove the hydroxyl radicals that cleanse the atmosphere<br />
of methane - another greenhouse gas.<br />
<strong>An</strong>other linkage is the complex physical processes and<br />
chemical reactions within the atmosphere. <strong>An</strong> enhanced<br />
greenhouse effect, for example, is expected <strong>to</strong> warm the<br />
lower atmosphere but cause the upper atmosphere <strong>to</strong> cool.<br />
This changes the rate of production and hence distribution<br />
of ozone in the upper region. However, it could also<br />
enhance the risks of ozone holes in polar regions. Near the<br />
surface, warmer temperatures enhance the risk of<br />
bad air quality days. Moreover, changes in wind direction<br />
caused by uneven warming of the Earth’s climate may<br />
also alter where acid rain is deposited.<br />
Finally, damage <strong>to</strong> ecosystems and human health is<br />
sometimes the results of several of these stresses acting<br />
<strong>to</strong>gether. Ecosystems that have already been weakened by<br />
the effects of acidification, surface ozone exposure and/or<br />
increased bombardment by UV-B radiation can die when<br />
exposed <strong>to</strong> the added stress of warmer temperatures or<br />
drought. Alternatively, acidified lakes that have slowly<br />
recovered over time can become re-acidified if droughts<br />
expose shallow parts of the lake bot<strong>to</strong>m and re-oxidize the<br />
sulphates that have been deposited in the sediments over<br />
time. Studies also suggest that human deaths can rise<br />
significantly if vulnerable people seriously affected by bad<br />
air quality must deal with the added impacts of heat stress.<br />
Understanding these linkages is therefore fundamental <strong>to</strong><br />
the formulation of an effective response <strong>to</strong> these issues.<br />
Since action with respect <strong>to</strong> one problem can affect some<br />
or all of the others, a holistic approach is required <strong>to</strong><br />
address them efficiently and effectively.<br />
47
<strong>An</strong> <strong>Introduction</strong> <strong>to</strong> <strong>Climate</strong> <strong>Change</strong><br />
MOVING TOWARDS CONSENSUS ON THE<br />
NEED FOR ACTION<br />
Dialogue between scientists and policy makers about the<br />
risks of human-induced climate change had already begun<br />
well before the IPCC began its comprehensive science<br />
assessments. In 1985, for example, an international<br />
gathering of climate change experts met in Villach, Austria<br />
<strong>to</strong> review the current state of understanding surrounding<br />
the issue of climate change. At the conclusion of their<br />
his<strong>to</strong>ric meeting, they released a statement <strong>to</strong> governments<br />
around the world warning them that many of the<br />
important economic decisions being made <strong>to</strong>day are based<br />
on the assumption that climate is a constant. That, they<br />
cautioned, is no longer a valid assumption.<br />
During the next five or so years, there followed a flurry of<br />
other meetings and conferences organized by various<br />
governments <strong>to</strong> discuss how <strong>to</strong> respond <strong>to</strong> the warning<br />
issued at the Villach meeting. The 1988 World Conference<br />
on the Changing Atmosphere, sponsored by Canada and<br />
held in Toron<strong>to</strong>, one of the first of these, was a pivotal<br />
event, in this process. It brought <strong>to</strong>gether nearly 300<br />
politicians, policy advisors, legal experts, environmental<br />
advocates and scientists <strong>to</strong> discuss the scientific basis for<br />
concern about atmospheric change and <strong>to</strong> recommend a<br />
course of action <strong>to</strong> the world community. Participants were<br />
deeply concerned that the human impact on the<br />
atmosphere had now become so powerful as <strong>to</strong> amount <strong>to</strong><br />
‘an unintended, uncontrolled, globally pervasive<br />
experiment whose ultimate consequences could only be<br />
second <strong>to</strong> a global nuclear war.” A significant outcome of<br />
the conference was its success in transferring concern<br />
about climate change from the scientific community <strong>to</strong> the<br />
world community. Equally important was its<br />
recommendation <strong>to</strong> reduce global carbon dioxide<br />
emissions by 20% of 1988 levels by 2005.<br />
Other meetings quickly followed. Out of these meetings<br />
came the realization that, although unilateral actions are<br />
also valuable, it was crucially important that the nations of<br />
the world work <strong>to</strong>gether in order <strong>to</strong> ensure that action on<br />
climate change would be globally effective. Hence, the<br />
international community began the process of formulating<br />
48<br />
a common understanding of the issues and of exploring<br />
the feasibility of international consensus and a global<br />
political response.<br />
GLOBAL POLITICAL RESPONSE<br />
While this process of consensus building on principles for<br />
action on climate change was underway, the United<br />
Nations General Assembly began its own deliberations on<br />
the threat of climate change. After having passed several<br />
resolutions expressing concern about the risks of climate<br />
change for humanity and the need for action, in 1988 it<br />
asked the WMO and UNEP <strong>to</strong> organize the IPCC for the<br />
purpose of coordinating relevant science assessments. In<br />
addition, it established an Intergovernmental Negotiating<br />
Committee <strong>to</strong> begin the task of developing a Framework<br />
Convention on <strong>Climate</strong> <strong>Change</strong> (FCCC). Following two<br />
years of intensive negotiations, the FCCC was approved at<br />
the United Nations Conference on Environment and<br />
Development, held in Rio de Janeiro in 1992. The ultimate<br />
objective of the FCCC is <strong>to</strong> stabilize greenhouse gas<br />
concentrations at levels that would avoid ‘dangerous’<br />
human interference with the climate system. It has now<br />
been signed and ratified by more than 190 member<br />
countries, and annual meetings of the Conference of<br />
the Parties (CoP) <strong>to</strong> the Convention have been held<br />
since 1995.<br />
At the third meeting of the CoP, held in Kyo<strong>to</strong> in 1997,<br />
member countries moved a significant step further. They<br />
agreed on a Pro<strong>to</strong>col <strong>to</strong> the Convention that sought firm<br />
commitments from industrialized member countries <strong>to</strong><br />
take the first concrete steps <strong>to</strong> curtail global greenhouse<br />
gas emissions. One of the key provisions of this Kyo<strong>to</strong><br />
Pro<strong>to</strong>col is that these industrialized nations, known as<br />
<strong>An</strong>nex I countries, would be required <strong>to</strong> reduce their<br />
collective emissions of six key greenhouse gases by about<br />
5.2% below 1990 levels by the first reporting period of<br />
2008-12. Targets for individual countries varied from a<br />
reduction of 8% for the countries of the European Union<br />
<strong>to</strong> an increase of up <strong>to</strong> 10% for countries with special<br />
circumstances that were causing rapid growth in emissions<br />
(e.g., Iceland).
CHAPTER 6 | HOW DO WE RESPOND?<br />
Further regional renegotiation of the European Union<br />
target saw some EU countries accept targets as high as a<br />
27% increase (Portugal) and as low as a 28% reduction<br />
(Luxembourg). Canada agreed <strong>to</strong> a target of 6% reduction.<br />
While other non-<strong>An</strong>nex I countries were not held <strong>to</strong> a<br />
commitment for specific reduction targets in this first step,<br />
they would be required <strong>to</strong> report on emissions and seek<br />
voluntary action <strong>to</strong> curtail them.<br />
To come in<strong>to</strong> effect, the Kyo<strong>to</strong> Pro<strong>to</strong>col had <strong>to</strong> be signed<br />
and ratified by at least 55 member countries. Furthermore,<br />
those who ratified had <strong>to</strong> represent at least 55% of the<br />
collective <strong>An</strong>nex I emissions in 1990. As of July 2005,<br />
151 countries had ratified. More importantly, with Russia’s<br />
ratification in November, 2004, the ratifying countries<br />
included representation of 61% the <strong>to</strong>tal <strong>An</strong>nex I<br />
emissions. With both criteria met, the Pro<strong>to</strong>col became<br />
legally binding <strong>to</strong> its ratifying members on February 16,<br />
2005.<br />
THE CANADIAN RESPONSE<br />
The Government of Canada maintains that climate change<br />
is one of the most significant environmental and<br />
sustainable development challenges facing the globe and<br />
that the Kyo<strong>to</strong> Pro<strong>to</strong>col is the only global mechanism <strong>to</strong><br />
start reducing greenhouse gas emissions. That is why<br />
Canada ratified the Kyo<strong>to</strong> Pro<strong>to</strong>col in December 2002 and<br />
believes that it is an important step in the right direction.<br />
The task of meeting Canada’s Kyo<strong>to</strong> target is, however, a<br />
significant challenge. Both its population and its economy<br />
have been growing rapidly since 1990. This healthy<br />
development has also caused a significant increase in<br />
emissions. Between 1990 and 2003, <strong>Canadian</strong> greenhouse<br />
gas emissions increased by 24%. Canada’s challenge is <strong>to</strong><br />
reduce emissions <strong>to</strong> 6% below 1990 levels over the 2008-<br />
2012 period. This will require a reduction in emissions of<br />
some 270 mega<strong>to</strong>nnes.<br />
To tackle this challenge, on April 13, 2005 the<br />
Government introduced the 2005 <strong>Climate</strong> <strong>Change</strong> Plan:<br />
Moving Forward on <strong>Climate</strong> <strong>Change</strong>: A Plan for Honouring<br />
our Kyo<strong>to</strong> Commitment.<br />
The Plan is a key component of Project Green, the<br />
government’s broader environmental vision aimed at<br />
supporting a healthy environment and a competitive<br />
economy. It details the general approach and delivery<br />
mechanisms that will guide the actions needed across the<br />
economy <strong>to</strong> allow Canada <strong>to</strong> honour its commitment <strong>to</strong><br />
the Kyo<strong>to</strong> Pro<strong>to</strong>col in a way that encourages continued<br />
economic competitiveness in both the short and longer<br />
terms. These mechanisms include the <strong>Climate</strong> Fund, the<br />
Partnership Fund, the Large Final Emitter System, and<br />
federal programs.<br />
A primary <strong>to</strong>ol for Canada’s approach <strong>to</strong> climate change,<br />
the <strong>Climate</strong> Fund is a market-based mechanism that will<br />
encourage emission reductions across the economy. The<br />
purpose of the <strong>Climate</strong> Fund is <strong>to</strong> create a permanent<br />
institution for the purchase of emission reduction credits<br />
on behalf of the Government of Canada.<br />
Canada’s Large Final Emitters include companies in the<br />
mining and manufacturing, oil and gas, and thermal<br />
electricity sec<strong>to</strong>rs. These sec<strong>to</strong>rs make an important<br />
contribution <strong>to</strong> Canada’s economic base, but they are also<br />
large contribu<strong>to</strong>rs (just under 50%) of Canada’s <strong>to</strong>tal<br />
greenhouse gas emissions. The 2005 <strong>Climate</strong> <strong>Change</strong><br />
FIGURE 6.1<br />
Country delegates discuss the Kyo<strong>to</strong> Pro<strong>to</strong>col at one of<br />
the CoP meetings<br />
49
<strong>An</strong> <strong>Introduction</strong> <strong>to</strong> <strong>Climate</strong> <strong>Change</strong><br />
Plan outlines a Large Final Emitter System that will reduce<br />
emissions from covered sec<strong>to</strong>rs while promoting their<br />
economic growth and competitiveness.<br />
The Partnership Fund will provide the basis for synergy<br />
and collaboration with provinces and terri<strong>to</strong>ries by cost<br />
sharing key initiatives. Clean energy and energy efficiency<br />
projects will be priorities, as will bringing programs and<br />
services closer <strong>to</strong> the individuals who need them.<br />
<strong>Climate</strong> change programs play an important role in<br />
generating emission reductions and promoting early<br />
action. Budget 2005 and the Plan expanded a number of<br />
programs, including EnerGuide for Houses as well as the<br />
Wind Power Production Incentive. The Government also<br />
announced the Renewable Power Production Incentive <strong>to</strong><br />
support emerging renewable energy sources. To further<br />
advance the deployment of renewable energy, the capital<br />
cost allowance rate for investments in highly efficient cogeneration<br />
and renewable energy systems equipment was<br />
increased.<br />
The Plan builds on the Governments previous investments<br />
in climate change. Between 1997 and 2003 the<br />
Government made incremental investments (<strong>to</strong> a <strong>to</strong>tal of<br />
$3.7 billion) in climate change though successive budgets.<br />
Action Plan 2000, for example, comprises 45 measures<br />
that target key sec<strong>to</strong>rs accounting for 90% of Canada’s<br />
greenhouse gas emissions. Many of those measures broke<br />
new ground, while a number received additional support<br />
through subsequent allocations. These include, for<br />
example, programs <strong>to</strong> encourage energy efficiency retrofits<br />
of existing commercial buildings.<br />
These early programs provided the foundation for the<br />
2002 <strong>Climate</strong> <strong>Change</strong> Plan for Canada, which used a<br />
broader range of <strong>to</strong>ols including information, incentives,<br />
regulations and tax measures, across a number of sec<strong>to</strong>rs<br />
including: transportation; housing and commercial /<br />
institutional buildings; large industrial emitters; renewable<br />
energy and cleaner fossil fuels; agriculture; forestry and<br />
landfills. While previous investments laid the groundwork<br />
for behavioral, technological and economic changes,<br />
investments made through Budget 2005 and outlined in<br />
50<br />
the 2005 <strong>Climate</strong> <strong>Change</strong> Plan are critical in placing<br />
Canada on the lower emissions trajec<strong>to</strong>ry that will be<br />
needed <strong>to</strong> achieve the significant cuts required over time.<br />
Canada has also moved forward <strong>to</strong> enhance its<br />
contribution <strong>to</strong> improve scientific understanding of climate<br />
change and <strong>to</strong> apply that understanding <strong>to</strong> help <strong>Canadian</strong>s<br />
adapt <strong>to</strong> changes that will still unavoidably occur,<br />
regardless of efforts <strong>to</strong> curtail global greenhouse gas<br />
emissions. Infusion of new funding in<strong>to</strong> government and<br />
academic research initiatives within Canada through<br />
programs such as the <strong>Climate</strong> <strong>Change</strong> Action Fund, Action<br />
Plan 2000 and resources provided directly <strong>to</strong> the <strong>Canadian</strong><br />
Foundation for <strong>Climate</strong> and Atmospheric Sciences have<br />
complemented existing climate change research initiatives.<br />
While many of these programs have limited duration, their<br />
benefits include continued international leadership of<br />
<strong>Canadian</strong> scientists in reducing the scientific uncertainty<br />
surrounding the climate change issue. They also help <strong>to</strong><br />
maintain and enhance <strong>Canadian</strong> capacity <strong>to</strong> investigate the<br />
impacts of climate change on <strong>Canadian</strong>s and <strong>to</strong> explore<br />
options for adapting <strong>to</strong> projected changes in climate.<br />
While the Kyo<strong>to</strong> Pro<strong>to</strong>col was pivotal for mobilizing global<br />
action on climate change, a new international agreement<br />
must provide the framework <strong>to</strong> drive prosperous 21st<br />
century economies that are innovative and efficient as well<br />
as lead <strong>to</strong> deeper reductions in GHG emissions. Canada’s<br />
Plan for Honouring our Kyo<strong>to</strong> Commitments: Moving<br />
Forward on <strong>Climate</strong> <strong>Change</strong> recognizes that a future<br />
international agreement must meet certain key objectives.<br />
It must:<br />
■ Have broader participation with fair goals, including all<br />
industrialized and key emerging economies;<br />
■ Generate outcomes that will result in real progress over<br />
the longer term;<br />
■ Provide incentives <strong>to</strong> invest in developing and sharing<br />
transformative environmental technologies <strong>to</strong> reduce<br />
emissions at home and abroad;<br />
■ Maximize the deployment of existing clean technologies;<br />
■ Support a streamlined and efficient global carbon<br />
market; and<br />
■ Address adaptation as well as mitigation.
CHAPTER 6 | HOW DO WE RESPOND?<br />
If we are going <strong>to</strong> build successfully on the Kyo<strong>to</strong> Pro<strong>to</strong>col,<br />
we need a truly global and long-term approach, with<br />
efficiently operating market mechanisms in place. A truly<br />
global approach would have many points of participation<br />
and allow for truly global emissions trading, pay more<br />
attention <strong>to</strong> integrating climate change goals with<br />
development and trade policies, better address economic<br />
growth issues for all countries, and place greater emphasis<br />
on effective technology transfer by promoting and<br />
deploying innovative and existing technologies.<br />
The objectives laid out in Canada’s Plan for Honouring our<br />
Kyo<strong>to</strong> Commitment represent a solid foundation from<br />
which <strong>to</strong> launch a dialogue on the future.<br />
THE ROLE OF THE CITIZEN<br />
How can the individual <strong>Canadian</strong> citizen influence the<br />
outcome of a global environmental issue that is already<br />
challenging the wisdom and resources of the world’s<br />
governments and international agencies? The answer,<br />
simply put, is that it is the individual citizens who must<br />
create the environment of opinion which will encourage<br />
governments <strong>to</strong> act. <strong>An</strong>d it is the individual citizens who<br />
can take actions themselves <strong>to</strong> reduce their personal<br />
emissions and who can support the policies that an<br />
effective response <strong>to</strong> the risks of climate change will<br />
demand.<br />
The estimated 23 billion <strong>to</strong>nnes of carbon dioxide that<br />
humans, globally, pour in<strong>to</strong> the atmosphere each year<br />
through the combustion of fossil fuels are not produced by<br />
governments but by the more than 6 billion people who<br />
now occupy the Earth. Each time we turn up the<br />
thermostat, drive a car, turn on a hot water tap, or open a<br />
refrigera<strong>to</strong>r door, we add <strong>to</strong> the problem. By changing our<br />
attitudes and lifestyles, by becoming more knowledgeable<br />
about the issue and rethinking our attitude <strong>to</strong> the<br />
environment, we can make a difference.<br />
In addition <strong>to</strong> exerting our influence on policy matters,<br />
there are many other things that we can do in our personal<br />
lives <strong>to</strong> ease the burden that we place on the environment.<br />
Every year, each <strong>Canadian</strong> produces an average of over<br />
5 <strong>to</strong>nnes of greenhouse gas emissions. The One-Tonne<br />
Challenge encourages all <strong>Canadian</strong>s <strong>to</strong> reduce their<br />
personal greenhouse gas emissions by one <strong>to</strong>nne, or<br />
by 20%. They can achieve this goal by being more<br />
energy efficient, reducing waste and water use and<br />
wise consumers. There are many actions included in<br />
the One-Tonne Challenge and these are listed in the<br />
accompanying box on the next page. More information on<br />
the One-Tonne Challenge can be found on our website at:<br />
www.climatechange.gc.ca/one<strong>to</strong>nne.<br />
51
<strong>An</strong> <strong>Introduction</strong> <strong>to</strong> <strong>Climate</strong> <strong>Change</strong><br />
52<br />
PROTECTING THE ATMOSPHERE: A PERSONAL AGENDA<br />
The One Tonne Challenge<br />
The guide <strong>to</strong> the One-Tonne Challenge outlines the following actions <strong>Canadian</strong>s can take<br />
on climate change. In general, it means using less energy, improving air quality and<br />
protecting our environment, while saving money. The One-Tonne Challenge is an educational<br />
program challenging <strong>Canadian</strong>s <strong>to</strong> reduce their individual GHG emissions by one <strong>to</strong>nne,<br />
or about 20%.<br />
On the Road<br />
Cars and trucks on our road are responsible for about 18% of Canada’s <strong>to</strong>tal GHGs. Every year, mo<strong>to</strong>r<br />
vehicles exhaust release more than 134 million <strong>to</strong>nes of GHGs in<strong>to</strong> the atmosphere. Here is what<br />
you can do.<br />
■ Drive 10% less.<br />
■ Use your vehicle’s air conditioner sparingly.<br />
■ Give up your second vehicle.<br />
■ Don’t idle.<br />
■ Drive at the posted speed limit.<br />
■ Use a block heater on a timer.<br />
■ Keep your vehicle well maintained.<br />
■ Use ethanol-blended gasoline.<br />
■ Measure your vehicle’s tire pressure once a month.<br />
■ Remove roof racks when not in use.<br />
■ Don’t buy more than you need.<br />
■ Buy the most fuel-efficient vehicle.<br />
At Home<br />
It takes a lot of energy <strong>to</strong> run a home for heating and cooling, major appliances, hot water and lighting.<br />
Maintaining a comfortable living space can be expensive, whether you rent or own your home. So it is<br />
important <strong>to</strong> “shop smart” for the most energy-efficient appliances and equipment and <strong>to</strong> keep them well<br />
maintained. Here are some tips of what you can do at home.<br />
■ Install one of <strong>to</strong>day’s energy-efficient furnaces<br />
■ Use caulking and weather stripping <strong>to</strong> seal air leaks.<br />
■ Look for the ENERGY STAR label on windows and sliding glass doors.<br />
■ Install s<strong>to</strong>rm windows.<br />
■ Replace exterior doors in poor repair with insulated core doors or add s<strong>to</strong>rm doors.<br />
■ Keep your furnace well maintained.<br />
■ Seal and insulate warm-air ducts.<br />
■ Upgrade your insulation in walls, basement and attic.<br />
■ Lower your thermostat in winter, at night and when you are away during the day<br />
■ Shut off the pilot light of your natural gas fireplace or wall heater in summer.
CHAPTER 6 | HOW DO WE RESPOND?<br />
At Home (continued)<br />
■ Install a ceiling fan.<br />
■ Remove window air conditioners for the winter<br />
■ Keep window curtains open during the day in winter.<br />
■ Keep blinds, curtains and windows closed during the day in summer.<br />
■ Use fans as your first line of defense against summer heat.<br />
■ Set your air conditioner at 24°C<br />
■ Clean the air conditioner’s filter every month.<br />
■ Turn off all sources of heat in summer.<br />
■ Maintain your refrigera<strong>to</strong>r and freezer for better energy use.<br />
■ Look for an ENERGY STAR qualified refrigera<strong>to</strong>r if you are in the market for a new one.<br />
■ Unplug that second refrigera<strong>to</strong>r or freezer.<br />
■ Select the dishwasher’s no-heat or air-drying cycle.<br />
■ Increase the efficiency of your refrigera<strong>to</strong>r and freezer by keeping them away from heat sources.<br />
■ Rinse in cold water and wash in warm.<br />
■ Avoid over-drying clothes.<br />
■ Install outdoor au<strong>to</strong>matic timers<br />
■ Use more-efficient light bulbs<br />
■ Ensure your computer system is set up <strong>to</strong> use its energy-saver option.<br />
■ Look on the box for ENERGY STAR- qualified equipment.<br />
■ Use as little paper as possible.<br />
■ Turn off lights and equipment when a work area isn’t being used.<br />
■ If you are buying a laser printer, look for energy-saver features.<br />
■ Buy a moni<strong>to</strong>r that is the right size for your needs.<br />
■ Capture rainwater for your garden.<br />
■ Practice “grass cycling”<br />
■ Water your garden or lawn early in the morning. Avoid using chemical pesticides or fertilizers.<br />
■ Limit your use of gas-powered lawn mowers.<br />
■ Maintain your pool efficiently<br />
■ Plant trees.<br />
■ Install a low-flow shower head with a shut-off lever.<br />
■ Go for a high-efficiency water heater unit.<br />
■ Take a quick shower instead of a bath.<br />
■ Avoid running the tap.<br />
■ Insulate water pipes. Turn-off your cottage’s water heater.<br />
■ Recycle all recyclable materials.<br />
■ Compost your organic kitchen waste.<br />
■ Pay attention <strong>to</strong> goods and packaging.<br />
53
<strong>An</strong> <strong>Introduction</strong> <strong>to</strong> <strong>Climate</strong> <strong>Change</strong><br />
54
References for figures and<br />
tables and further reading<br />
Bachelet, D. and Neilson, R.P. 2000. Biome Redistribution Under<br />
<strong>Climate</strong> <strong>Change</strong>. In The impact of climate change on America’s<br />
forests: a technical document supporting the 2000 USDA Forest<br />
Service RPA Assessment. (Joyce, L. A. and Birdsey, R., technical<br />
edi<strong>to</strong>rs) Gen. Tech. Rep. RMRS-GTR-59. Fort Collins, CO.<br />
CDIAC (Carbon Dioxide Information <strong>An</strong>alysis Centre) Trends On<br />
Line at http://cdiac.esd.ornl.gov/trends/trends.htm<br />
CRC Handbook of Chemistry and Physics. *82 nd Edition<br />
Gajewski, K., Vance, R. Sawada, M., Fung, I. et al. 2000. The<br />
climate of North America and adjacent ocean waters ca. 6ka,<br />
<strong>Canadian</strong> Journal of Earth Sciences, 37, 661-681.<br />
IPCC (Intergovernmental Panel on <strong>Climate</strong> <strong>Change</strong>) 2001. Third<br />
Assessment Report. WG I. <strong>Climate</strong> <strong>Change</strong> 2001: The Scientific<br />
Basis. J.T. Hough<strong>to</strong>n et al. (Eds). 881pp. Cambridge<br />
University Press.<br />
IPCC (Intergovernmental Panel on <strong>Climate</strong> <strong>Change</strong>) 2001. Third<br />
Assessment Report. WG II. <strong>Climate</strong> <strong>Change</strong> 2001: Impacts,<br />
Adaptation and Vulnerability. J.J. McCarthy et al. (Eds.).<br />
1032pp. Cambridge University Press.<br />
Intergovernmental Panel on <strong>Climate</strong> <strong>Change</strong> 2001. Third<br />
Assessment Report. Synthesis Report R.T. Watson and the Core<br />
Writing Team (Eds.). 397pp. Cambridge University Press.<br />
IPCC (Intergovernmental Panel on <strong>Climate</strong> <strong>Change</strong>) 2000. Land<br />
Use, Land-use <strong>Change</strong>, and Forestry. R.T. Watson et al (Eds).<br />
377pp. Cambridge University Press.<br />
IPCC (Intergovernmental Panel on <strong>Climate</strong> <strong>Change</strong>) 2000. Special<br />
Report on Emissions Scenarios. N. Nakicenovic et al. (Eds)<br />
599pp. Cambridge University Press.<br />
IPCC (Intergovernmental Panel on <strong>Climate</strong> <strong>Change</strong>) 1995. Second<br />
Assessment Report. WG I. <strong>Climate</strong> <strong>Change</strong> 2001: The Scientific<br />
Basis. J.T. Hough<strong>to</strong>n et al. (Eds). 572pp. Cambridge<br />
University Press.<br />
IPCC (Intergovernmental Panel on <strong>Climate</strong> <strong>Change</strong>) 1995. Second<br />
Assessment Report. WG II. <strong>Climate</strong> <strong>Change</strong> 2001: Impacts,<br />
Adaptation and Mitigation of <strong>Climate</strong> <strong>Change</strong>. R.T. Watson et al.<br />
(Eds.). 872pp. Cambridge University Press.<br />
Kharin, V. V. and Zwiers, F.2000. <strong>Change</strong>s in the extremes in an<br />
ensemble of transient climate simulations with a coupled<br />
atmosphere-ocean GCM. J.<strong>Climate</strong> 13: 3760-3788.<br />
Kiehl and Trenberth, 1997. Earth’s annual global mean energy<br />
budget. Bull. American Meteorological Society 78: 197-208.<br />
Moberg, A., D.M. Sonechkin, K. Holmgren, N.M. Datsenko, and<br />
W. Karlen, 2005. High variable Northern Hemisphere<br />
temperatures reconstructed from low- and high-resolution<br />
proxy data. Nature, 433, 613-617.<br />
Zhang, X., L.A. Vincent, W.D. Hogg and A. Niitsoo. 2000.<br />
Temperature and Precipitation Trends in Canada during the<br />
20th Century. Atmospheric Ocean, Vol. 38(3): 395-429.<br />
(updated 2005).<br />
55
Notes