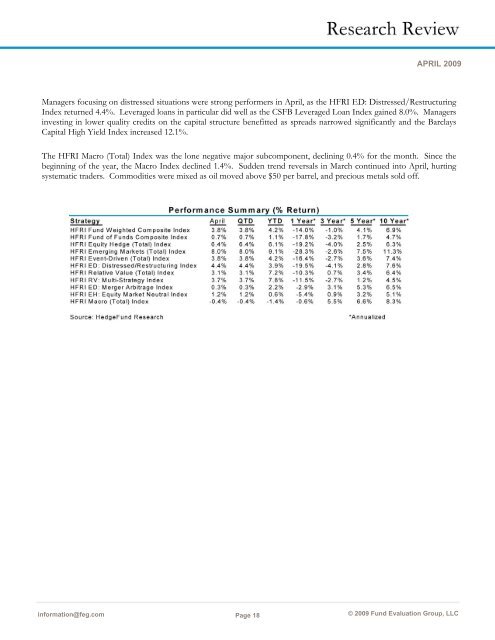
information@feg.com Page 18 APRIL 2009 Managers focusing on distressed situations were strong performers in April, as the HFRI ED: Distressed/Restructuring Index returned 4.4%. Leveraged loans in particular did well as the CSFB Leveraged Loan Index gained 8.0%. Managers investing in lower quality credits on the capital structure benefitted as spreads narrowed significantly and the Barclays Capital High Yield Index increased 12.1%. The HFRI Macro (Total) Index was the lone negative major subcomponent, declining 0.4% for the month. Since the beginning of the year, the Macro Index declined 1.4%. Sudden trend reversals in March continued into April, hurting systematic traders. Commodities were mixed as oil moved above $50 per barrel, and precious metals sold off. © 2009 <strong>Fund</strong> <strong>Evaluation</strong> <strong>Group</strong>, <strong>LLC</strong>
DISCLOSURES Indices: information@feg.com Page 19 APRIL 2009 Russell Investments rank U.S. common stocks from largest to smallest market capitalization at each annual reconstitution period (May 31). The primary Russell Indices are defined as follows: 1) the top 3,000 stocks become the Russell 3000 Index, 2) the largest 1,000 stocks become the Russell 1000 Index, 3) the smallest 800 stocks in the Russell 1000 Index become the Russell Midcap index, 4) the next 2,000 stocks become the Russell 2000 Index, 5) the smallest 1,000 in the Russell 2000 Index plus the next smallest 1,000 comprise the Russell Microcap Index. S&P 500 Index consists of 500 stocks chosen for market size, liquidity and industry group representation, among other factors by the S&P Index Committee, which is a team of analysts and economists at Standard and Poor's. The S&P 500 is a market-value weighted index, which means each stock's weight in the index is proportionate to its market value and is designed to be a leading indicator of U.S. equities, and meant to reflect the risk/return characteristics of the large-cap universe. Morgan Stanley Capital International – MSCI - A series of indices constructed by Morgan Stanley to help institutional investors benchmark their returns. There are a wide range of indices created by Morgan Stanley covering a multitude of developed and emerging economies and economic sectors. Barclays Capital Fixed Income Indices – an index family comprised of the Barclays Capital Aggregate Index, Government/ Corporate Bond Index, Mortgage-Backed Securities Index, and Asset-Backed Securities Index, Municipal Index, High-Yield Index, and others designed to represent the broad fixed income markets and sectors within constraints of maturity and minimum outstanding par value. The FTSE NAREIT Composite Index (NAREIT Index) includes only those companies that meet minimum size, liquidity and free float criteria as set forth by FTSE and is meant as a broad representation of publicly traded REIT securities in the U.S. Relevant real estate activities are defined as the ownership, disposure, and development of income-producing real estate. The HFRI Monthly Indices (HFRI) are equally weighted performance indexes, compiled by Hedge <strong>Fund</strong> Research Inc., and are used by numerous hedge fund managers as a benchmark for their own hedge funds. The HFRI are broken down into 37 different categories by strategy, including the HFRI <strong>Fund</strong> Weighted Composite, which accounts for over 2000 funds listed on the internal HFR Database. The HFRI <strong>Fund</strong> of <strong>Fund</strong>s Composite Index is an equal weighted, net of fee, index composed of approximately 800 fund of funds which report to HFR. See www.hedgefundresearch.com for more information on index construction. This report was prepared by <strong>Fund</strong> <strong>Evaluation</strong> <strong>Group</strong>, <strong>LLC</strong> (FEG) − an investment adviser registered under the Investment Advisers Act of 1940, as amended − providing non-discretionary and discretionary investment advice to its clients on an individual basis. The information herein was obtained from various sources. FEG does not guarantee the accuracy or completeness of such information provided by third parties. The information in this report is given as of the date indicated and believed to be reliable. FEG assumes no obligation to update this information, or to advise on further developments relating to it. Index performance results do not represent any managed portfolio returns. An investor cannot invest directly in a presented index, as an investment vehicle replicating an index would be required. An index does not charge management fees or brokerage expenses, and no such fees or expenses were deducted from the performance shown. Neither the information nor any opinion expressed in this report constitutes an offer, or an invitation to make an offer, to buy or sell any securities. FEG, its affiliates, directors, officers, employees, employee benefit programs and client accounts may have a long position in any securities of issuers discussed in this report. Any return expectations provided are not intended as, and must not be regarded as, a representation, warranty or predication that the investment will achieve any particular rate of return over any particular time period or that investors will not incur losses. Past performance is not indicative of future results. This report is prepared for general circulation and information only. It does not address specific investment objectives, or the financial situation and the particular needs of any person. © 2009 <strong>Fund</strong> <strong>Evaluation</strong> <strong>Group</strong>, <strong>LLC</strong>