download pdf - Fund Evaluation Group, LLC
download pdf - Fund Evaluation Group, LLC
download pdf - Fund Evaluation Group, LLC

Create successful ePaper yourself
Turn your PDF publications into a flip-book with our unique Google optimized e-Paper software.
PRIVATE CAPITAL OVERVIEW<br />
2012 was a remarkable year for the capital markets, especially in light of the<br />
major headwinds faced worldwide. While the euro, the value of gold, and the<br />
fiscal cliff kept the news media busy, public and private companies charged<br />
ahead with strong earnings and returns.<br />
Through September 30, 2012, the most recently available data, private equity<br />
funds reported a 9.3% average internal rate of return (IRR). 1 Given the strong<br />
fourth quarter in public markets, full year returns in the low double-digits are<br />
a reasonable expectation for private equity funds.<br />
Venture capital returns continued to lag buyout returns in the third quarter.<br />
Late-stage venture funds, down 0.4% year-to-date, were a significant drag on<br />
the sector due to the fall-off in valuations for a number of earlier-in-the-year<br />
IPOs (e.g, Facebook). Seed/early stage venture, however, was the best<br />
performing sector within private equity year-to-date, recording a 15.5% net<br />
IRR versus 9.6% for all buyouts. 2<br />
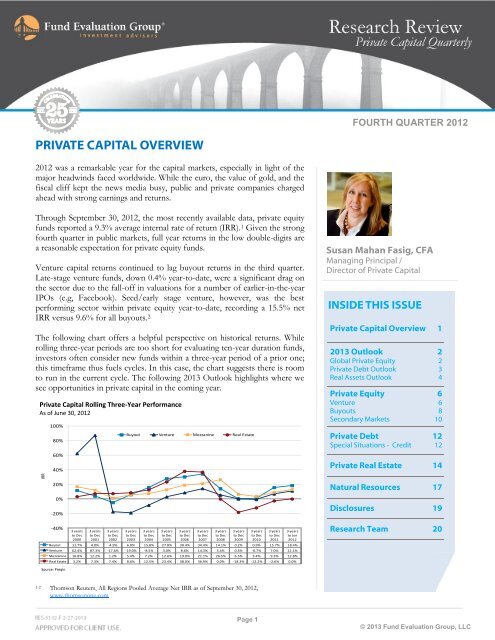
The following chart offers a helpful perspective on historical returns. While<br />
rolling three-year periods are too short for evaluating ten-year duration funds,<br />
investors often consider new funds within a three-year period of a prior one;<br />
this timeframe thus fuels cycles. In this case, the chart suggests there is room<br />
to run in the current cycle. The following 2013 Outlook highlights where we<br />
see opportunities in private capital in the coming year.<br />
Private Capital Rolling Three-Year Performance<br />
Private Capital Rolling 3-Year Performance<br />
As of June 30, 2012<br />
as of June 30, 2012<br />
IRR<br />
100%<br />
80%<br />
60%<br />
40%<br />
20%<br />
0%<br />
-20%<br />
-40%<br />
3 years<br />
to Dec<br />
2000<br />
3 years<br />
to Dec<br />
2001<br />
3 years<br />
to Dec<br />
2002<br />
3 years<br />
to Dec<br />
2003<br />
3 years<br />
to Dec<br />
2004<br />
3 years<br />
to Dec<br />
2005<br />
3 years<br />
to Dec<br />
2006<br />
3 years<br />
to Dec<br />
2007<br />
3 years<br />
to Dec<br />
2008<br />
3 years<br />
to Dec<br />
2009<br />
1-2 Thomson Reuters, All Regions Pooled Average Net IRR as of September 30, 2012,<br />
www.thomsonone.com<br />
3 years<br />
to Dec<br />
2010<br />
Page 1<br />
3 years<br />
to Dec<br />
2011<br />
Buyout 11.7% 4.0% -4.9% 6.0% 15.8% 27.8% 30.4% 34.4% 14.1% 0.2% 0.9% 15.7% 18.4%<br />
Venture 62.4% 87.3% -17.6% -19.0% -8.5% 3.0% 8.6% 14.3% 5.4% 0.3% -0.7% 7.0% 11.1%<br />
Mezzanine 16.8% 12.2% 1.2% 5.4% 7.2% 12.6% 19.0% 21.1% 26.5% 6.5% 3.4% 9.3% 12.8%<br />
Real Estate 3.2% 7.3% 7.4% 8.6% 12.5% 23.4% 38.0% 36.9% 0.0% -18.3% -12.2% -2.6% 0.0%<br />
Source:<br />
Source: Preqin<br />
Preqin<br />
Buyout Venture Mezzanine Real Estate<br />
3 years<br />
to Jun<br />
2012<br />
FOURTH QUARTER 2012<br />
Susan Mahan Fasig, CFA<br />
Managing Principal /<br />
Director of Private Capital<br />
INSIDE THIS ISSUE<br />
Private Capital Overview 1<br />
2013 Outlook<br />
Global Private Equity<br />
Private Debt Outlook<br />
Real Assets Outlook<br />
Private Equity<br />
Venture<br />
Buyouts<br />
Secondary Markets<br />
Private Debt<br />
Special Situations - Credit<br />
2<br />
2<br />
3<br />
4<br />
6<br />
6<br />
8<br />
10<br />
12<br />
12<br />
Private Real Estate 14<br />
Natural Resources 17<br />
Disclosures 19<br />
Research Team 20<br />
© 2013 <strong>Fund</strong> <strong>Evaluation</strong> <strong>Group</strong>, <strong>LLC</strong>
2013 OUTLOOK<br />
In 2012 private funds continued a moderate pace of fundraising and investing<br />
that began with the financial crisis. Over $310 billion was raised globally by<br />
687 private funds. 1 In private equity sectors, the amount invested exceeded<br />
the amount of new capital raised, bringing the markets into better balance.<br />
As of January 31, over 1,800 private funds across all sectors were seeking an<br />
aggregate $780 billion in new investment capital. 2 Not all of this capital will<br />
be raised in 2013, but the total likely will increase year-over-year.<br />
Slow global GDP growth and cheap credit are likely to serve as a backdrop to<br />
investment activity in 2013. An increase in the use of debt is expected to fuel<br />
merger & acquisition activity in 2013. In addition, the revolution in natural<br />
gas development in North America and the cyclical recovery in non-core real<br />
estate are expected to continue as drivers of investment opportunities. Global<br />
currencies and geopolitical events however, are hot-button issues that could<br />
derail the pace of activity in the coming year.<br />
Global Private Equity Outlook<br />
Trends in private equity include ongoing contraction in the ranks of fund<br />
managers. In venture capital, those remaining see significant opportunities in<br />
mobile communications, cloud computing, and big data. These trends<br />
increasingly impact all aspects of our personal and professional lives. Venture<br />
funds seem to have evolved in a bifurcated manner, with very small funds<br />
addressing early-stage opportunities, or very large funds playing the full<br />
spectrum, from early to late stage. Both strategies have seen success. In the<br />
middle of 2012, we commented on the well-publicized Kauffman Foundation<br />
report on venture capital that described venture investing as a broken model<br />
for investors. 3 FEG determined our best approach to this area remained with<br />
early-stage-focused fund managers. The past year rewarded early stage<br />
investors with a 16% return versus 3% for later-stage funds. 4 We continue to<br />
believe industry consolidation and innovation can provide attractive returns<br />
for experienced early-stage venture investors with a defined niche.<br />
In recent periods, many buyout funds in the U.S. have struggled to raise<br />
capital as investors consolidated relationships, limited new allocations, and<br />
sought portfolio diversification by investing in non-U.S.-focused funds,<br />
particularly emerging markets. The case for emerging markets private equity is<br />
strong, as these countries are already contributing half of global GDP<br />
growth. 5 This growth is driven by a rapidly emerging middle class of prime<br />
working age, with its growing consumer spending budget. This strategy is not<br />
without risk. China, for example, needs to evolve from government-led<br />
growth to consumer-driven growth, and the ride may be bumpy. In addition,<br />
most emerging markets are small and the depth of management talent is<br />
limited. In recent years, India was awash in new capital, which drove<br />
valuations to unattractive levels. Much of this overhang has shaken out in the<br />
past two years, but this risk remains in any emerging market. We continue to<br />
Page 2<br />
FOURTH QUARTER 2012<br />
Susan Mahan Fasig, CFA<br />
Managing Principal /<br />
Director of Private Capital<br />
“Slow global GDP<br />
growth and cheap<br />
credit are likely to<br />
serve as a backdrop to<br />
investment activity in<br />
2013.”<br />
© 2013 <strong>Fund</strong> <strong>Evaluation</strong> <strong>Group</strong>, <strong>LLC</strong>
focus on experienced and stable fund management teams, with some<br />
form of a pan-emerging-markets focus, to ensure a healthy perspective<br />
on valuations.<br />
Within the U.S., interesting trends are emerging. Credit markets are<br />
sifting from conservative to aggressive, which is likely to increase<br />
merger & acquisition activity and benefit buyout funds, provided they<br />
avoid “too much of a good thing.” <strong>Fund</strong>amentally, manufacturing in<br />
the U.S. is increasingly competitive with overseas markets. Several<br />
factors are driving this trend: cheap and abundant energy as compared<br />
to other developed markets, rising labor and land costs in Asia, and<br />
innovation in advanced technologies. These factors are highlighted in<br />
the sidebar on this page.<br />
Secondary markets continued to enjoy a robust pipeline of<br />
opportunity. The double-strength volume is attributable to heavy<br />
selling by financial institutions, primarily for regulatory reasons,<br />
alongside the maturity of peak fundraising vintage year funds (those<br />
formed between 2005 and 2007). Pricing remains moderate, which<br />
positions recent vintage year secondary funds in line for robust returns.<br />
Private Debt Outlook<br />
Credit markets rallied significantly in 2012 and rewarded investors<br />
across strategies and geographies. Securitized assets, including<br />
residential mortgage-backed securities (RMBS) and commercial<br />
mortgage-backed securities (CMBS), posted double-digit returns. Some<br />
RMBS recorded price movements of 50% or better for the year. 11 At<br />
this point in the cycle, the major move is behind us, but the assets<br />
continue to offer attractive returns when compared with other credit<br />
opportunities.<br />
Relative to expectations for 2012, European debt provided healthy<br />
opportunities, but not the flood of activity expected. Increased capital<br />
requirements for European banks, defined in the Basel III regulations,<br />
were postponed. At present, most banks have the capacity to sell and<br />
many have active selling programs. Globally, PwC estimates $80 billion<br />
of illiquid asset sales will occur in 2013, up from $58 billion in 2012. 12<br />
Distressed credits trading in the current environment are more<br />
idiosyncratic than earlier in the cycle. Value is likely to be realized over<br />
time, not from a quick trade.<br />
Issuance of new debt in conjunction with buyout deals and<br />
recapitalizations ramped up late in the year. Recapitalizations alone<br />
generated over $64 billion in dividends to investors. 13 Activity may<br />
have been influenced by a desire to move ahead of tax law changes in<br />
the U.S. Many new deals featured “covenant lite” and PIK (pay in<br />
kind) options, reminiscent of the credit bubble days. Conditions today<br />
have been described as “short of frothy” but they are trending that<br />
Page 3<br />
FOURTH QUARTER 2012<br />
ADVANTAGE U.S.?<br />
THREE REASONS TO FAVOR<br />
MANUFACTURING AT HOME:<br />
Cheap Energy:<br />
and<br />
Labor and Land:<br />
Technology and Speed:<br />
© 2013 <strong>Fund</strong> <strong>Evaluation</strong> <strong>Group</strong>, <strong>LLC</strong>
Page 4<br />
FOURTH QUARTER 2012<br />
way. Private debt in the form of mezzanine lending to middle market credits remains reasonably attractive, although total<br />
return expectations may trend lower.<br />
Real Assets Outlook<br />
Real assets strategies performed well in 2012 and appear poised to continue this trend. Investors added inflation<br />
protection strategies in many forms to their portfolios. Looking forward, inflation hedging strategies remain attractive in<br />
the face of loose monetary policy around the globe.<br />
Real estate continued to rebound in 2012, posting returns in public and private markets. Stabilized properties in core<br />
markets are now priced near prior peaks. Opportunities remain in stressed, messy, small- to medium-sized properties,<br />
those generally located in less-than-glamorous locations, and in some niche markets.<br />
Within the energy sector, oil prices reacted to<br />
economic and political activity during the<br />
year. Crude oil prices ranged from over $100<br />
per barrel early in the year, into the $80s midyear,<br />
to ending the year at $92. 14 Natural gas<br />
prices were driven by domestic production<br />
and demand. Prices appear to have bottomed<br />
mid-year before trending up to a five-year<br />
high of $3.35/mmbtu at year-end. 15 Ongoing<br />
development of the North American energy<br />
industry offers a range of investment<br />
opportunities in public and private strategies.<br />
We continue to purse investments in direct<br />
ownership of producing assets, energy<br />
buyouts, and publicly traded master limited<br />
partnerships (MLPs).<br />
In other real assets strategies, timber<br />
produced a 7.8% return in 2012, trending up<br />
from five years of lackluster returns and<br />
activity. 16 We remain unenthusiastic about<br />
timber, choosing higher-returning strategies<br />
for locked-up capital, but expect timber to<br />
continue to benefit from the rebound in housing. Similar to timber, agriculture and other commodities can also provide<br />
diversification and modest returns to a globally diversified portfolio.<br />
In Summary<br />
Performance Summary<br />
Through 9/30/2012 Quarter 1 Year 3 Year* 5 Year* 10 Year* 20 Year*<br />
Global Private Equity 3.8% 7.2% 4.2% 0.8% 3.7% 15.8%<br />
U.S. Venture Capital 0.6% 7.2% 6.1% 1.8% 4.6% 19.6%<br />
U.S. Buyouts 4.5% 15.1% 12.4% 4.7% 10.0% 9.9%<br />
Distressed Bonds/Loans -1.1% 4.1% 10.5% -1.0% 8.1% n/a<br />
Private Core Real Estate 5.1% 11.0% 10.9% 2.3% 8.3% 8.6%<br />
Timber 1.4% 2.2% -0.5% 3.3% 7.6% 9.7%<br />
S&P 500 Index 3.4% 30.2% 13.2% 1.1% 8.0% 8.5%<br />
NASDAQ Composite 0.8% 29.0% 13.7% 2.9% 10.3% 8.7%<br />
MSCI World Index 1.6% 22.3% 8.1% -1.6% 8.6% 7.2%<br />
Inflation (CPI) + 5% 5.9% 6.9% 7.3% 7.1% 7.5% 7.5%<br />
Through 12/31/2012 Quarter 1 Year 3 Year* 5 Year* 10 Year* 20 Year*<br />
Distressed Bonds/Loans 2.7% 6.4% 7.2% 0.2% 7.8% n.a.<br />
Private Core Real Estate 2.5% 10.5% 12.6% 2.1% 8.4% 8.8%<br />
Timber 5.9% 7.8% 3.0% 2.7% 8.2% 8.9%<br />
S&P 500 Index -0.4% 16.0% 10.9% 1.7% 7.1% 8.2%<br />
NASDAQ Composite -3.1% 15.9% 10.0% 2.6% 8.5% 7.8%<br />
MSCI World Index 2.6% 16.5% 7.5% -0.6% 8.1% 7.4%<br />
Inflation (CPI) + 5% -0.2% 1.6% 2.0% 1.8% 2.4% 2.4%<br />
Sources: Thomson Reuters, NCREIF (w w w .ncreif.org), <strong>Fund</strong> <strong>Evaluation</strong> <strong>Group</strong>, <strong>LLC</strong> * Annualized<br />
We see select investments across private equity, private debt, and real assets strategies continuing to provide interesting<br />
opportunities for generating returns in 2013. These ideas have not changed materially with the turn to a new year. We<br />
expect the credit cycle to wane while equity (primary and secondary) and energy strategies dominate. A healthy pipeline<br />
of U.S. private equity funds are expected to benefit from improvements in the relative cost position and innovation in<br />
North America. These trends also will continue to pull real estate out of cyclical lows.<br />
© 2013 <strong>Fund</strong> <strong>Evaluation</strong> <strong>Group</strong>, <strong>LLC</strong>
We Appreciate Your Feedback<br />
Page 5<br />
FOURTH QUARTER 2012<br />
You will soon receive a survey from us on the topic of our regular communications to you, including the quarterly<br />
commentaries and Research Reviews. We’ve been publishing our commentary for more than five years, and our Research<br />
Review for more than ten years, and we would like to solicit feedback from our readers about these publications. As we<br />
celebrate our twenty-fifth anniversary this year, we are reminded that our clients and readers are our most important<br />
asset. We would sincerely appreciate your participation in this survey, so that we may continue to serve your best<br />
interests.<br />
1 Preqin, Private Equity <strong>Fund</strong>raising 4Q12<br />
2 Preqin, www.preqin.com; Comparable fundraising was $330 million in 2011 and $310 million in 2012<br />
3 We Have Met the Enemy…and He Is Us, Ewing Marion Kauffman Foundation, May 2012<br />
4 Thomson Reuters Private Equity Performance Index (PEPI) as of September 30, 2012<br />
5 International Monetary <strong>Fund</strong>, World Economic Outlook Database<br />
6-7 Tan, Kopin, Made in America The Next Boom, Barron’s, January 28, 2013. In 2012, U.S. energy production was over 20million BOE/day versus imports<br />
of less than 8million BOE/day; Natural gas cost $3.55/mmbtu in the U.S. versus approximately $12 in Europe and $16 in Japan.<br />
8 Capital International Private Equity, View From the Field, presentation to investors, Beijing, October 2012<br />
9 Tan, Kopin, Made in America The Next Boom, Barron’s, January 28, 2013<br />
10 Robots versus Job Growth, CBS News60 Minutes, January 14, 2013<br />
11 Markit ABX.HE 2007-1 AAA, Markit ABX.HE 2006-2 AAA, and Markit ABX.HE 2006-1 AA<br />
12 Global Credit & Distressed Markets: Current State and Outlook, Quarterly Market Call, SVP Global, January 31, 2013<br />
13 Dai, Shasha, Risky Business? PE’s Div Recap Gold Rush, Dow Jones Private Equity Analyst, January 2013<br />
14-15 Energy Information Agency, www.eia.gov<br />
16 NCREIF Timberland Index, www.ncreif.com<br />
© 2013 <strong>Fund</strong> <strong>Evaluation</strong> <strong>Group</strong>, <strong>LLC</strong>
PRIVATE EQUITY: VENTURE<br />
2012 could be characterized as a repeat of recent years for venture capital,<br />
with one notable exception: the Facebook IPO. The venture capital industry<br />
continued to contract in 2012, with fewer firms raising less capital. Exit<br />
activity moderated throughout the year and industry performance held steady.<br />
While the Facebook IPO was covered extensively in FEG’s Research Reviews<br />
and in the popular press, we believe this deal was likely a once-in-a-generation<br />
return for venture investors. As such, the venture funds that invested early in<br />
Facebook (and even some of the later investors) made extraordinary returns<br />
despite the volatile path the company took in the public markets. Even some<br />
purchases of Facebook on the secondary market turned out quite well,<br />
provided they were not made in the two years leading up to Facebook’s IPO.<br />
Anecdotally, the message we have been hearing from venture fund managers<br />
is that it is time to return to basics. Visions of quick returns from social<br />
gaming, social networking, and other consumer ventures are being replaced<br />
with a focus on building long-term value. Popular investment themes for<br />
venture funds include the migration to cloud computing, harnessing the<br />
amount of data flowing through the network (big data), and the continued<br />
development of the SaaS (software as a service) business model.<br />
<strong>Fund</strong>raising and Investing Environment<br />
Last year was the third consecutive year to see an increase in venture capital<br />
raised. Despite this increase, the estimated number of active venture funds<br />
continued to drop. Even among those active funds, a meaningful percentage<br />
might not be considered to be “institutional”. For example, approximately<br />
one-third of all U.S. venture capital funds formed in 2012 were capitalized<br />
with $50 million or less. 1 Additionally, a relatively small number of funds<br />
accounted for an increasing share of the aggregate capital. Similar to the third<br />
quarter, the five largest funds in the fourth quarter accounted for 55% of the<br />
total capital raised. 2 Investment in companies fell 10% in 2012, reversing the<br />
rising trend in 2010 and 2011. 3 The most active sectors continued to be<br />
software, biotechnology, clean technology, and Internet-related companies.<br />
The software sector was the only sector to experience an increase in<br />
investment during 2012.<br />
(Billion)<br />
U.S. Venture Capital Investment<br />
Through December 31, 2012<br />
$35<br />
$30<br />
$25<br />
$20<br />
$15<br />
$10<br />
$5<br />
$0<br />
Venture <strong>Fund</strong>raising<br />
Venture Investment<br />
Estimated Active <strong>Fund</strong>s<br />
2007 2008 2009 2010 2011 2012<br />
Page 6<br />
1,000<br />
Source: National Venture Capital Association, Press Release dated January 7, 2013, and MoneyTree Report by PricewaterhouseCoopers and the<br />
National Venture Capital Association based on data from Thomson Reuters; Estimated Active <strong>Fund</strong>s from NVCA reports and reflects the number of<br />
funds raising capital in a given year plus the prior three years.<br />
900<br />
800<br />
700<br />
600<br />
500<br />
400<br />
300<br />
200<br />
100<br />
-<br />
Estimated Active <strong>Fund</strong>s<br />
FOURTH QUARTER 2012<br />
Nathan C. Werner, CFA<br />
Senior Vice President<br />
“Visions of quick returns<br />
from social gaming,<br />
social networking, and<br />
other consumer<br />
ventures are being<br />
replaced with a focus on<br />
building long-term<br />
value.”<br />
© 2013 <strong>Fund</strong> <strong>Evaluation</strong> <strong>Group</strong>, <strong>LLC</strong>
Exit Environment<br />
Page 7<br />
FOURTH QUARTER 2012<br />
Venture-backed exits slowed in 2012, as IPO activity dropped following Facebook’s messy IPO in May. 4 The number of<br />
acquisitions of venture-backed companies fell for the third straight year, but the aggregate dollars spent remained in line<br />
with longer-term averages thanks to several transactions in excess of $1 billion. Large corporations looked to venturebacked<br />
companies to provide innovative technology, products, and services. In the second half of 2012, VMWare purchased<br />
Nicira Networks for $1.25 billion, Microsoft bought Yammer for $1.2 billion, Facebook bought Instagram for $1.0<br />
billion, and Cisco purchased Meraki, Inc. for $1.25 billion.<br />
Performance<br />
Venture Capital Exit Activity<br />
Through December 31, 2012 31, 2012<br />
Number of Venture-Backed Companies<br />
600<br />
500<br />
400<br />
300<br />
200<br />
100<br />
Median performance was again in the single-digits for venture investors. More recent vintage years are seeing performance<br />
creep higher, as funds benefit from the exit environment.<br />
Global Venture Capital Quartile Performance<br />
As As of September of September 30, 2012 30, 2012<br />
20%<br />
15%<br />
10%<br />
5%<br />
0%<br />
Vintage Year IRR Global Venture Capital Quartile Performance<br />
-5%<br />
-10%<br />
-15%<br />
0<br />
Source: Source: Preqin<br />
Preqin<br />
467<br />
416<br />
Acquisitions IPO<br />
87 7 13 68 51 49<br />
Source: NVCA Press Release Release "Venture-Backed Exits Exits Enjoyed Enjoyed HIgher Average Values on on Lower Total Total Volumes in 2012"; in 2012"; 1/2/2013<br />
Top Quartile Median Bottom Quartile<br />
2000 2001 2002 2003 2004 2005 2006 2007 2008<br />
1 Preqin, www.preqin.com, accessed February 1, 2013<br />
2 NVCA Press Release “Venture Capital <strong>Fund</strong>s Raised $20.6 billion during 2012”; January 7, 2013<br />
3 The MoneyTree Report by PricewaterhouseCoopers and the National Venture Capital Association, based on data from Thomson Reuters<br />
4 NVCA Press Release “Venture-Backed Exits Enjoyed Higher Average Values on Lower Total Volumes in 2012”; January 2, 2013<br />
351<br />
521<br />
488<br />
435<br />
© 2013 <strong>Fund</strong> <strong>Evaluation</strong> <strong>Group</strong>, <strong>LLC</strong>
PRIVATE EQUITY: BUYOUTS<br />
Another year of modest fundraising allowed global buyout funds to work off<br />
another $150 billion of the global capital overhang over the past year.<br />
<strong>Fund</strong>raising for global buyouts increased year-over-year, while the pace of<br />
investing was relatively flat. Global exit activity also was essentially unchanged<br />
as measured by number of transactions, but modestly higher in terms of<br />
value. Dividend recaps picked up in the fourth quarter and set a new record<br />
for the year. 1 Robust credit markets facilitated these partial liquidity events<br />
and the attractive credit terms are likely to continue into 2013.<br />
Buyout <strong>Fund</strong>raising and Investing<br />
Buyout funds raised $88.4 billion in new capital commitments in 2012, a 12%<br />
increase over the prior year. 2 The number of funds raising capital declined by<br />
6% in 2012 despite the increase in fundraising. Commitments to U.S. and<br />
European funds both increased in 2012, while less capital was raised for<br />
funds based in Asia and other global markets. Just over half of all funds<br />
raised were in the U.S.<br />
Globally, buyout funds invested significantly more capital than was raised<br />
during the year. In 2012, $256.7 billion was invested in 2,904 deals. Over the<br />
past three years, a similar pace of activity has reduced the overhang of capital<br />
by over $500 billion. 3<br />
Global Buyout - <strong>Fund</strong>raising<br />
$300<br />
$250<br />
$200<br />
$150<br />
$100<br />
$50<br />
Commitments ( billions) Global Buyout - <strong>Fund</strong>raising<br />
$0<br />
Source: Preqin<br />
U.S. Europe<br />
Rest of World Number of <strong>Fund</strong>s<br />
2007 2008 2009 2010 2011 2012<br />
Page 8<br />
300<br />
250<br />
200<br />
150<br />
100<br />
50<br />
0<br />
Number of <strong>Fund</strong>s<br />
FOURTH QUARTER 2012<br />
James W. Angelica<br />
Senior Research Analyst<br />
“Over the past three<br />
years, a similar pace of<br />
activity has reduced the<br />
overhang of capital by<br />
over $500 billion.”<br />
© 2013 <strong>Fund</strong> <strong>Evaluation</strong> <strong>Group</strong>, <strong>LLC</strong>
Buyout Exit Activity<br />
Exits increased for the third straight year as managers continued<br />
to focus on realizations and returning capital to their investors.<br />
Total exits of buyout-backed companies increased<br />
14% year-over-year, driven by increases in trade sales as well<br />
as secondary buyouts (the sale of a company from one private<br />
equity manager to another). 4<br />
Buyout Performance<br />
Page 9<br />
FOURTH QUARTER 2012<br />
Median buyout performance for vintage years 2007 to 2009, was in the range of 9.0% to 9.3%. 5 In the same time frame,<br />
top-quartile funds produced results in the mid- to high teens, 500 to 600 basis points above median.<br />
1 Risky Business? PE’s Div Recap Gold Rush, Dow Jones Private Equity Analyst, January 2013<br />
2 Preqin, www.preqin.com, “Global Buyout <strong>Fund</strong>raising”, January 2013<br />
3 Preqin, www.preqin.com, “Buyout Deal Analysis”, January 2013<br />
4 Preqin, www.preqin.com, “PE Buyout-backed Exits”, January 2013<br />
5 Preqin, www.preqin.com, “Performance Analyst”, January 2013<br />
Global Buyout - Exits<br />
- Exits<br />
Number of Exits<br />
1,400<br />
1,200<br />
1,000<br />
800<br />
600<br />
400<br />
200<br />
0<br />
Source: Source: Preqin Preqin<br />
Global Buyout - Vintage Year Performance<br />
30%<br />
25%<br />
20%<br />
15%<br />
IRR Global Buyout - Vintage Year Performance<br />
10%<br />
5%<br />
0%<br />
Source: Preqin<br />
Upper Quartile Median Lower Quartile<br />
2004 2005 2006 2007 2008 2009<br />
IPO Restructuring<br />
Recapitalisation Sale to GP<br />
Trade Sale Sale to Management<br />
2007 2008 2009 2010 2011 2012<br />
© 2013 <strong>Fund</strong> <strong>Evaluation</strong> <strong>Group</strong>, <strong>LLC</strong>
PRIVATE EQUITY: SECONDARY MARKETS<br />
Private equity secondary pricing was little changed in the second half of 2012,<br />
with average high bids at approximately 80% of net asset value (NAV), which<br />
represented a 20% discount to reported values. 1 Last year’s volume matched<br />
the record set in 2011, with $25 billion of transactions closed.<br />
Private Equity Secondary Bid Prices<br />
Average High Bid<br />
120%<br />
100%<br />
80%<br />
60%<br />
40%<br />
% of NAV Private Equity Secondary Bid Prices<br />
20%<br />
0%<br />
Source: Cogent Partners Secondary Pricing Trends and Analysis, January 2013<br />
Source: Cogent Partners Secondary Pricing Trends and Analysis, January<br />
Several trends emerged with respect to the types of assets sold in the<br />
secondary market. In the buyout sector, funds raised during peak years (2005,<br />
2006, and 2007) represented an estimated 60% of transaction volume over<br />
the past three years. These funds are five years old on average. Conversely,<br />
trading in venture capital funds has been concentrated in funds at or near the<br />
end of their terms. <strong>Fund</strong>raising volume in venture peaked in 1999 and 2000,<br />
and over the last three years, more than 40% of the venture funds marketed<br />
by Cogent, a leading investment bank for secondary markets, were more than<br />
ten years old at the time of sale.<br />
Financial institutions and pensions remained the largest sellers of secondaries.<br />
These investors drove most of the commitments during the peak fundraising<br />
years of 2005 to 2007. Selling from banks slowed in the second half of 2012,<br />
partly due to the rally in the public equity markets and delayed regulatory<br />
action. Cogent estimates that banks are holding $70 billion of illiquid private<br />
equity assets on a global basis, which serve as a potential pipeline for future<br />
transactions.<br />
Completed Completed Transactions in 2012<br />
By Sellers (Transaction Value)<br />
2%<br />
2%<br />
12%<br />
21%<br />
10%<br />
24%<br />
29%<br />
Financial Institution<br />
Public Pension<br />
Corporate Pension<br />
<strong>Fund</strong> of <strong>Fund</strong>s<br />
Family Office<br />
Source: Cogent Partners Secondary Pricing Trends and Analysis,<br />
Source: Cogent Partners Secondary Pricing Trends and<br />
January 2013<br />
Analysis January 2013<br />
Page 10<br />
FOURTH QUARTER 2012<br />
Nathan C. Werner, CFA<br />
Senior Vice President<br />
“Last year’s volume<br />
matched the record set<br />
in 2011, with $25 billion<br />
of transactions closed.”<br />
© 2013 <strong>Fund</strong> <strong>Evaluation</strong> <strong>Group</strong>, <strong>LLC</strong>
Page 11<br />
FOURTH QUARTER 2012<br />
Secondary fund managers indicated that deal flow is slowing. The level of stress witnessed several years ago continued<br />
to dissipate and pricing has stabilized. Overall volume is likely to remain robust but trend down in 2013, in line with the<br />
historic pace of primary market fundraising.<br />
1 Cogent Partners Secondary Pricing Trends & Analysis, January 2013<br />
© 2013 <strong>Fund</strong> <strong>Evaluation</strong> <strong>Group</strong>, <strong>LLC</strong>
PRIVATE DEBT: SPECIAL SITUATIONS – CREDIT<br />
Securitized Assets<br />
2012 could be categorized as the year of securitized assets. 1 Pick your acronym,<br />
whether it’s ABS, RMBS, CMBS, CLO, or CDO—they all went up in<br />
2012, and went up with authority. During the credit crisis of 2007 and 2008,<br />
these bonds became unwelcome guests on investors’ balance sheets due to<br />
their complexity, questionable credit quality, and opaque nature. Many were<br />
subsequently sold into a soft secondary market. As such, the prices for these<br />
securities languished for several years. Many reached dollar prices in the $30s<br />
and $40s (on par value of $100) before the recent resurgence amid improved<br />
market conditions and investors’ quest for yield. Even with the strong gains<br />
in 2012, most investors continue to expect attractive results in 2013—albeit<br />
with lower return expectations following the rally. In most cases, high singledigit<br />
net returns are being targeted on an un-levered basis depending on the<br />
quality of the security, with some managers incorporating modest leverage to<br />
push return expectations to the low- to mid-teens.<br />
Private Credit<br />
While public credit markets traded at levels that are priced for perfection, the<br />
private credit markets appeared more reasonable, particularly for middle market<br />
companies. According to S&P Capital IQ LCD Quarterly, 2 purchase price<br />
multiples for middle market companies were 7.9x for 2012, well below the<br />
9.3x level seen at the height of the market in 2007. Additionally, transaction<br />
volume in the middle market was lower in 2012 than in 2011, as only 72 new<br />
transactions came to market in 2012 versus 133 in 2011. 3 Capital structures<br />
for middle market transactions remained well balanced. The equity allocation<br />
for middle market transactions was above the historical average at 41% of the<br />
capital structure, versus a historical average of 37%, a 1997 market low of<br />
29%, and a more recent 2007 “bubble” Leveraged Buyout (LBO) equity low<br />
of 32%. A senior debt multiple (senior debt/EBITDA) of 3.7x at the end of<br />
the year was just above the historical average of 3.5x. 4 Additionally, total leverage<br />
measured by debt/EBITDA was slightly above the historical average of<br />
4.1x. Both metrics indicate an active, but not frothy, market in recent middle<br />
market transactions.<br />
The much ballyhooed private equity “overhang” from peak year capital raises<br />
remains at approximately $355 billion. 5 Approximately one-third of this capital<br />
needs to be put to work in the near future, due to the “use it or lose it”<br />
structure of long-term lock-up funds (although many have extension features).<br />
As such, the markets have been anticipating an increase in buyout activity<br />
(there were only 18 middle market LBO transactions in 2012, down<br />
from 33 in 2011, and well off the 1999 peak high of 140 transactions). 6 Strong<br />
Page 12<br />
FOURTH QUARTER 2012<br />
Keith M. Berlin<br />
Senior Vice President / Director of<br />
Global Fixed Income and Credit<br />
“Most investors continue<br />
to expect attractive<br />
results in the securitized<br />
markets in 2013.”<br />
© 2013 <strong>Fund</strong> <strong>Evaluation</strong> <strong>Group</strong>, <strong>LLC</strong>
Page 13<br />
FOURTH QUARTER 2012<br />
demand for newly issued bank debt stemming from the resurgence of collateralized loan obligations and other yieldseeking<br />
investors could support an uptick in private transactions. Dell’s recent decision to go private is likely to be financed<br />
in part by a supportive bank loan market, with investors expecting Dell’s issuance to be well received. While we<br />
are uncertain whether 2013 will be the year of resurgence for LBOs and merger and acquisition activity, we continue to<br />
watch the underlying credit market fundamentals, aware that markets can move quickly from conducive to aggressive.<br />
1 Securitized assets are large pools of securities collateralized by assets such as bank loans, residential or commercial mortgages, or other receivables (vehicles,<br />
credit cards, etc.). These pools are divvied up into similar risk categories and sold off in tranches to investors with varying risk tolerances. Acronyms for<br />
collateralized loan obligations (CLOs), non-agency residential mortgages (RMBS), commercial mortgage-backed securities (CMBS), are typical nomenclature<br />
for investors in these assets.<br />
2 S&P Capital IQ LCD Quarterly, Fourth Quarter 2012<br />
3 S&P Capital IQ Q4 2012 High-End Middle Market Lending Review<br />
4 S&P Capital IQ LCD Quarterly, Fourth Quarter 2012<br />
5 Shopping List for Private Equity, http://online.barrons.com/article/SB50001424053111903463204578044641750722634.html<br />
6 S&P Capital IQ Q4 2012 High-End Middle Market Lending Review<br />
© 2013 <strong>Fund</strong> <strong>Evaluation</strong> <strong>Group</strong>, <strong>LLC</strong>
PRIVATE REAL ESTATE<br />
Real estate values, as measured by the NCREIF Property Index (NPI),<br />
increased 2.5% in the fourth quarter of 2012 and 10.5% for the full year.<br />
Retail was the top performing sector for both the quarter and the year,<br />
returning 3.0% in the fourth quarter and 11.6% in 2012. The apartment<br />
sector also outperformed, with a return of 2.8% for the fourth quarter and an<br />
11.2% return for the year. 1<br />
Real estate transaction volume in the in the U.S. totaled $64 billion in the<br />
fourth quarter, up from $57 billion in the third quarter; for the full year 2012,<br />
transaction volume increased 11% to $190 billion. 2 A key factor driving<br />
increased transaction volume was sellers’ motivation to close transactions<br />
prior to year-end due to concerns about increases in capital gains taxes.<br />
Additionally, continued liquidity improvements in U.S. lending markets<br />
contributed to higher transaction activity. 3<br />
Property values in major metropolitan markets (New York, San Francisco,<br />
Washington D.C., Boston, and Chicago) have, in many cases, rebounded to<br />
their pre-recession levels and continued to command premium pricing, driven<br />
by low interest rates in fixed-income assets. Cap rates for top-tier properties<br />
in these areas have fallen to 5%, and in some cases, trophy assets have traded<br />
below 5% cap rates. 4<br />
NCREIF National Property Index Sector Returns<br />
Fourth Quarter 2012<br />
Apartment<br />
Industrial<br />
Office<br />
Retail<br />
Hotel<br />
Source: NCREIF<br />
Source: NCREIF<br />
2.4%<br />
2.2%<br />
2.2%<br />
2.8%<br />
3.0%<br />
Real Estate Capital Markets<br />
YTD 2012 Q4-2012<br />
New CMBS issuance topped $48 billion for 2012, up from approximately $30<br />
billion in 2011, 5 but remained at a fraction of peak issuance. The CMBS<br />
market strengthened in part due to investors’ appetite for yield in light of<br />
record-low interest rates. New CMBS offerings have sold at their tightest<br />
yield spreads since 2007.<br />
8.2%<br />
9.5%<br />
Page 14<br />
10.7%<br />
11.2%<br />
11.6%<br />
0% 1% 2% 3% 4% 5% 6% 7% 8% 9% 10% 11% 12% 13%<br />
FOURTH QUARTER 2012<br />
Christian S. Busken<br />
Senior Vice President /<br />
Director of Real Assets<br />
“CMBS loan maturities<br />
are expected to peak in<br />
2014, which could add<br />
to distress in the<br />
market.”<br />
© 2013 <strong>Fund</strong> <strong>Evaluation</strong> <strong>Group</strong>, <strong>LLC</strong>
Page 15<br />
FOURTH QUARTER 2012<br />
The CMBS delinquency rate stabilized in December 2012 at 9.7%; however, there is still a large volume of unresolved<br />
CMBS loans in special servicing from borrowers who took out five-year loans at the top of the market, when<br />
underwriting standards were less stringent. 6 Those borrowers now face maturities on properties that have seen<br />
significant declines in value. CMBS loan maturities are expected to peak in 2014, which could add to distress in the<br />
market. 7<br />
Apart from the CMBS market, commercial banks, private real estate funds, insurance companies, and government<br />
sponsored enterprises (GSEs) represent sources of capital for commercial real estate acquisitions, although core,<br />
stabilized properties maintain easier access to financing.<br />
Property Sectors<br />
(billions)<br />
U.S. U.S. CMBS CMBS Issuance<br />
$250<br />
$200<br />
$150<br />
$100<br />
$50<br />
$0<br />
$168.7<br />
$202.7<br />
$230.2<br />
$12.1<br />
Apartment<br />
As measured by rents and occupancies, fundamentals in the apartment sector remain the strongest among the major real<br />
estate property types. Apartment vacancy rates fell to 4.5% at year-end, down from 4.6% at the end of the third quarter,<br />
the lowest level in over a decade. 8 Average rents for apartments rose by 0.6% in the fourth quarter and 3.8% for the full<br />
year, with the largest increases in San Francisco and Seattle, where rents increased by nearly 6%. 9 As apartment rents<br />
have continued to rise, home buying has become more economical than renting in some areas, as measured by the rentto-mortgage<br />
ratio.<br />
Office<br />
As of year-end 2012, the office vacancy rate stood at 17.1%, compared to 17.3% at year-end 2011. 10 Asking rents in the<br />
office sector rose 0.8% during the fourth quarter and 1.8% for the year to an average of approximately $28.46/square<br />
foot. 11 Demand for office space is closely tied to employment, and continued uncertainty about a sustained economic<br />
recovery continued to weigh on the sector. Nevertheless, technology centers such as San Francisco saw rent growth of<br />
6.6% in 2012. 12 The office absorption rate for the year was positive, at 17.2 million square feet, but well below the 2005<br />
high of 66.7 million square feet. 13<br />
$2.7<br />
$12.0<br />
$30.0<br />
$48.2<br />
2005 2006 2007 2008 2009 2010 2011 2012<br />
Source: Fidelity Investments<br />
© 2013 <strong>Fund</strong> <strong>Evaluation</strong> <strong>Group</strong>, <strong>LLC</strong>
Page 16<br />
FOURTH QUARTER 2012<br />
Retail<br />
Retail properties experienced modestly improving fundamentals during the fourth quarter. The vacancy rate for malls<br />
declined slightly to 8.6% compared to 8.7% at the end of the third quarter. 14 Mall rents rose 0.2% in the quarter to an<br />
average of $39.31 per square foot. 15 Vacancy rates at retail strip centers declined to 10.7%, down from 10.8% at the end of<br />
the third quarter; average rents rose by 0.2% to $19.08 per square foot. 16 Competition from Internet retailers remains an<br />
ongoing concern in the retail sector, and retailers have been slow to lease new space because of concerns about the<br />
sustainability of the economic recovery.<br />
1 www.ncreif.com January 25, 2013<br />
2-3 Jones Lang LaSalle Global Markets Perspective, First Quarter 2013<br />
4 UBS 2013 Real Estate Market Outlook<br />
5 Bloomberg<br />
6-7 Heschmeyer, Mark CMBS Outlook Brightens Some, but Not Much, Costar, January 23, 2013<br />
8-9 Wotapka, Dawn, “Apartment Rents Continue to Rise as Vacancies Fall,” The Wall Street Journal, January 7, 2013<br />
10-13 Brown, Eliot, “Demand for Office Space Still Sluggish,” The Wall Street Journal, January 7, 2013<br />
© 2013 <strong>Fund</strong> <strong>Evaluation</strong> <strong>Group</strong>, <strong>LLC</strong>
NATURAL RESOURCES<br />
Oil and natural gas prices remained stable through year-end, despite concerns<br />
about the fiscal cliff. The fundamental supply/demand outlook for oil remained<br />
strong, contributing to demand for assets held by private energy<br />
funds.<br />
Crude oil prices declined slightly during the fourth quarter to close at $91.82,<br />
down from $92.20 at the end of the third quarter. 1 Following a 17% increase<br />
during the third quarter, natural gas prices experienced a marginal increase in<br />
the fourth quarter, closing at $3.35/mmbtu, compared to $3.32/mmbtu at the<br />
end of the third quarter. 2 Evidence of slowing production was the key factor<br />
contributing to stable natural gas prices after they reached a multi-year low<br />
earlier in the year. Additionally, the percentage of electricity generated from<br />
natural gas continues to grow, as power generation plants switch from coal to<br />
natural gas.<br />
Crude Oil and Natural Gas Prices<br />
$160<br />
$140<br />
$120<br />
$100<br />
$80<br />
$60<br />
Crude Oil Crude Oil and Natural Gas Prices<br />
$40<br />
$20<br />
$0<br />
2001 2002 2003 2004 2005 2006 2007 2008 2009 2010 2011 2012<br />
Source: Source: Energy Energy Information Information Agency Agency<br />
Private Energy <strong>Fund</strong>s<br />
Crude Oil Natural Gas<br />
Private energy funds saw record inflows of new capital in 2012, driven by<br />
strong returns on recent funds and increased demand from institutional investors<br />
for real assets strategies with inflation protection characteristics. Through<br />
the third quarter, U.S. private equity firms raised approximately $11.5 billion<br />
for energy-focused funds; additional funds raised significant capital late in the<br />
year. During 2012, Blackstone <strong>Group</strong> announced that it had closed its first<br />
dedicated energy fund, with $2.5 billion in commitments. <strong>Fund</strong>s offered by<br />
larger, established energy groups have been oversubscribed, including EnCap<br />
Page 17<br />
$91.82<br />
$15<br />
$3.35<br />
$20<br />
$10<br />
$5<br />
$0<br />
Natural Gas<br />
FOURTH QUARTER 2012<br />
Christian S. Busken<br />
Senior Vice President /<br />
Director of Real Assets<br />
“Private energy funds<br />
saw record inflows of<br />
new capital in 2012,<br />
driven by strong returns<br />
on recent funds and<br />
increased demand from<br />
institutional investors for<br />
real assets strategies<br />
with inflation protection<br />
characteristics.”<br />
© 2013 <strong>Fund</strong> <strong>Evaluation</strong> <strong>Group</strong>, <strong>LLC</strong>
Page 18<br />
FOURTH QUARTER 2012<br />
IX (oversubscribed on $5 billion), Riverstone Global Energy and Power <strong>Fund</strong> V (oversubscribed on $6 billion), and<br />
Kayne Anderson Energy <strong>Fund</strong> VI (oversubscribed on $1.6 billion).<br />
Most private energy funds continued to achieve strong performance, driven by successful execution by their portfolio<br />
companies, and an active transaction market for oil and natural gas assets.<br />
Transaction activity in the energy sector was robust during 2012, and many private equity energy funds experienced realizations<br />
through sales of portfolio companies and initial public offerings. A key factor contributing to deal flow in the<br />
energy sector has been a move by larger, publicly traded oil and gas companies into unconventional resource plays.<br />
Timber<br />
U.S. timberland values increased 5.9% during the fourth quarter and 7.8% for the full-year, as measured by the NCREIF<br />
Timberland Index. This increase represented the strongest gain in the timberland index in five years. The gain was attributable<br />
to higher appraisal values for timber properties, driven in part by stabilization in the forest products market.<br />
The improving housing market was a key factor contributing strength to the timberland index.<br />
Domestic timberland transaction volume for 2012 totaled nearly $4 billion, the highest level since 2008. 3 The increase<br />
was attributable mainly to a large sale by Forest Capital Partners earlier in the year. Discount rates decreased, as buyers<br />
sought to invest capital and sellers capitalized on opportunities to realize value. 4<br />
1-2 Energy Information Agency www.eia.gov<br />
3-4 Forest Investment Associates Quarterly Update – Fourth Quarter 2012<br />
© 2013 <strong>Fund</strong> <strong>Evaluation</strong> <strong>Group</strong>, <strong>LLC</strong>
Page 19<br />
FOURTH QUARTER 2012<br />
Disclosures:<br />
This report was prepared by <strong>Fund</strong> <strong>Evaluation</strong> <strong>Group</strong>, <strong>LLC</strong> (FEG), a federally registered investment adviser under the Investment Advisers Act of<br />
1940, as amended, providing non-discretionary and discretionary investment advice to its clients on an individual basis. Registration as an investment<br />
adviser does not imply a certain level of skill or training. The oral and written communications of an adviser provide you with information about<br />
which you determine to hire or retain an adviser. <strong>Fund</strong> <strong>Evaluation</strong> <strong>Group</strong>, <strong>LLC</strong>, Form ADV Part 2A & 2B can be obtained by written request<br />
directed to: <strong>Fund</strong> <strong>Evaluation</strong> <strong>Group</strong>, <strong>LLC</strong>, 201 East Fifth Street, Suite 1600, Cincinnati, OH 45202, Attention: Compliance Department.<br />
The information herein was obtained from various sources. FEG does not guarantee the accuracy or completeness of such information provided by<br />
third parties. The information in this report is given as of the date indicated and believed to be reliable. FEG assumes no obligation to update this<br />
information, or to advise on further developments relating to it.<br />
FEG, its affiliates, directors, officers, employees, employee benefit programs and client accounts may have a long position in any securities of issuers<br />
discussed in this report.<br />
Investments in private funds are speculative, involve a high degree of risk and are designed for sophisticated investors.<br />
Index performance results do not represent any managed portfolio returns. An investor cannot invest directly in a presented index, as an investment<br />
vehicle replicating an index would be required. An index does not charge management fees or brokerage expenses, and no such fees or expenses<br />
were deducted from the performance shown.<br />
Neither the information nor any opinion expressed in this report constitutes an offer, or an invitation to make an offer, to buy or sell any securities.<br />
Any return expectations provided are not intended as, and must not be regarded as, a representation, warranty or predication that the investment<br />
will achieve any particular rate of return over any particular time period or that investors will not incur losses.<br />
Past performance is not indicative of future results.<br />
This report is prepared for informational purposes only. It does not address specific investment objectives, or the financial situation and the<br />
particular needs of any person who may receive this report.<br />
Information on any indices mentioned can be obtained either through your consultant or by written request to information@feg.com.<br />
Indices:<br />
The Consumer Price Index is a gauge of inflation that measures the prices of a basket of goods purchased by the “typical” consumer.<br />
Morgan Stanley Capital International – MSCI - A series of indices constructed by Morgan Stanley to help institutional investors benchmark their<br />
returns. There are a wide range of indices created by Morgan Stanley covering a multitude of developed and emerging economies and economic<br />
sectors. See www.morganstanley.com for more information.<br />
The NASDAQ Composite Index is a broad-based capitalization-weighted index of stocks in all three NASDAQ tiers: Global Select, Global Market<br />
and Capital Market. The index was developed with a base level of 100 as of February 5, 1971.<br />
The NCREIF Property Index is a quarterly time series composite total rate of return measure of investment performance of a very large pool of<br />
individual commercial real estate properties acquired in the private market for investment purposes only. The NCREIF Timberland Index is a<br />
quarterly time series composite return measure of investment performance of a large pool of individual timber properties acquired in the private<br />
market for investment purposes only. See www.ncreif.org for more information.<br />
The NCREIF Timberland Index is a quarterly time series composite return measure of investment performance of a large pool of individual timber<br />
properties acquired in the private market for investment purposes only. All properties in the Timberland Index have been acquired, at least in part,<br />
on behalf of tax-exempt institutional investors - the great majority being pension funds. As such, all properties are held in a fiduciary environment.<br />
The S&P 500 Index is capitalization-weighted index of 500 stocks. The S&P 500 Index is designed to measure performance of the broad domestic<br />
economy through changes in the aggregate market value of 500 stocks representing all major industries.<br />
© 2013 <strong>Fund</strong> <strong>Evaluation</strong> <strong>Group</strong>, <strong>LLC</strong>
RESEARCH TEAM<br />
Name Title Focus<br />
James W. Angelica Senior Research Analyst Private Capital - Buyouts<br />
Page 20<br />
FOURTH QUARTER 2012<br />
Nolan M. Bean, CFA, CAIA Managing Principal Investment Philosophy and Portfolio<br />
Construction<br />
Keith M. Berlin Senior Vice President / Director of<br />
Global Fixed Income and Credit<br />
Global Fixed Income and Credit<br />
Mark G. Brinker, CFP ®, CAIA Research Analyst Portfolio Analytics and Liquid Alternatives<br />
Christian S. Busken Senior Vice President /<br />
Director of Real Assets<br />
Real Assets<br />
Kevin J. Conroy, CFA, CAIA Senior Research Analyst Hedged Strategies<br />
Gregory M. Dowling, CFA, CAIA Managing Principal /<br />
Director of Hedged Strategies<br />
Susan Mahan Fasig, CFA Managing Principal /<br />
Director of Private Capital<br />
Hedged Strategies<br />
Private Capital<br />
Jeffrey D. Furst, CFA, CAIA Senior Research Analyst Hedged Strategies<br />
Brian A. Hooper<br />
Gregory D. Houser, CFA<br />
Jay R. Johnston<br />
Senior Research Analyst Global Equities<br />
Senior Vice President Capital Markets<br />
Research Analyst Real Assets<br />
J. Alan Lenahan, CFA, CAIA Managing Principal /<br />
Director of Hedged Strategies<br />
Hedged Strategies<br />
David L. Mason, CAIA Senior Research Analyst Hedged Strategies<br />
Christopher M. Meyer, CFA Managing Principal /<br />
Chief Investment Officer<br />
Investment Philosophy and<br />
Portfolio Construction<br />
Michael J. O’Connor Senior Research Analyst Global Fixed Income and Credit<br />
Michael J. Oyster, CFA<br />
William B. Phelps<br />
Managing Principal / Portfolio Strategist Portfolio Management<br />
Senior Operations Analyst Managed Solutions<br />
Cheryl A. Ramsey Senior Research Analyst Global Equities<br />
Christina M. Sunderman<br />
Senior Research Analyst Global Equities<br />
G. Scott Tabor Senior Research Analyst Private Capital<br />
Nathan C. Werner, CFA Senior Vice President Private Capital – Venture Capital<br />
Ryan S. Wheeler, CAIA<br />
Director of <strong>Fund</strong> Operations Managed Solutions<br />
© 2013 <strong>Fund</strong> <strong>Evaluation</strong> <strong>Group</strong>, <strong>LLC</strong>