download pdf - Fund Evaluation Group, LLC
download pdf - Fund Evaluation Group, LLC
download pdf - Fund Evaluation Group, LLC

Create successful ePaper yourself
Turn your PDF publications into a flip-book with our unique Google optimized e-Paper software.
PRIVATE EQUITY: SECONDARY MARKETS<br />
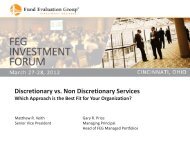
Private equity secondary pricing was little changed in the second half of 2012,<br />
with average high bids at approximately 80% of net asset value (NAV), which<br />
represented a 20% discount to reported values. 1 Last year’s volume matched<br />
the record set in 2011, with $25 billion of transactions closed.<br />
Private Equity Secondary Bid Prices<br />
Average High Bid<br />
120%<br />
100%<br />
80%<br />
60%<br />
40%<br />
% of NAV Private Equity Secondary Bid Prices<br />
20%<br />
0%<br />
Source: Cogent Partners Secondary Pricing Trends and Analysis, January 2013<br />
Source: Cogent Partners Secondary Pricing Trends and Analysis, January<br />
Several trends emerged with respect to the types of assets sold in the<br />
secondary market. In the buyout sector, funds raised during peak years (2005,<br />
2006, and 2007) represented an estimated 60% of transaction volume over<br />
the past three years. These funds are five years old on average. Conversely,<br />
trading in venture capital funds has been concentrated in funds at or near the<br />
end of their terms. <strong>Fund</strong>raising volume in venture peaked in 1999 and 2000,<br />
and over the last three years, more than 40% of the venture funds marketed<br />
by Cogent, a leading investment bank for secondary markets, were more than<br />
ten years old at the time of sale.<br />
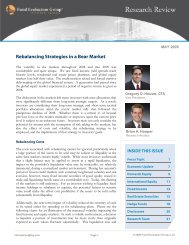
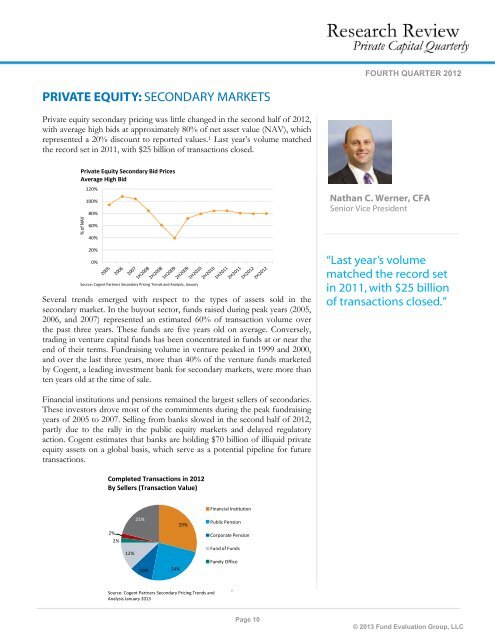
Financial institutions and pensions remained the largest sellers of secondaries.<br />
These investors drove most of the commitments during the peak fundraising<br />
years of 2005 to 2007. Selling from banks slowed in the second half of 2012,<br />
partly due to the rally in the public equity markets and delayed regulatory<br />
action. Cogent estimates that banks are holding $70 billion of illiquid private<br />
equity assets on a global basis, which serve as a potential pipeline for future<br />
transactions.<br />
Completed Completed Transactions in 2012<br />
By Sellers (Transaction Value)<br />
2%<br />
2%<br />
12%<br />
21%<br />
10%<br />
24%<br />
29%<br />
Financial Institution<br />
Public Pension<br />
Corporate Pension<br />
<strong>Fund</strong> of <strong>Fund</strong>s<br />
Family Office<br />
Source: Cogent Partners Secondary Pricing Trends and Analysis,<br />
Source: Cogent Partners Secondary Pricing Trends and<br />
January 2013<br />
Analysis January 2013<br />
Page 10<br />
FOURTH QUARTER 2012<br />
Nathan C. Werner, CFA<br />
Senior Vice President<br />
“Last year’s volume<br />
matched the record set<br />
in 2011, with $25 billion<br />
of transactions closed.”<br />
© 2013 <strong>Fund</strong> <strong>Evaluation</strong> <strong>Group</strong>, <strong>LLC</strong>