download pdf - Fund Evaluation Group, LLC
download pdf - Fund Evaluation Group, LLC
download pdf - Fund Evaluation Group, LLC

You also want an ePaper? Increase the reach of your titles
YUMPU automatically turns print PDFs into web optimized ePapers that Google loves.
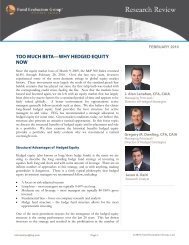
Buyout Exit Activity<br />
Exits increased for the third straight year as managers continued<br />
to focus on realizations and returning capital to their investors.<br />
Total exits of buyout-backed companies increased<br />
14% year-over-year, driven by increases in trade sales as well<br />
as secondary buyouts (the sale of a company from one private<br />
equity manager to another). 4<br />
Buyout Performance<br />
Page 9<br />
FOURTH QUARTER 2012<br />
Median buyout performance for vintage years 2007 to 2009, was in the range of 9.0% to 9.3%. 5 In the same time frame,<br />
top-quartile funds produced results in the mid- to high teens, 500 to 600 basis points above median.<br />
1 Risky Business? PE’s Div Recap Gold Rush, Dow Jones Private Equity Analyst, January 2013<br />
2 Preqin, www.preqin.com, “Global Buyout <strong>Fund</strong>raising”, January 2013<br />
3 Preqin, www.preqin.com, “Buyout Deal Analysis”, January 2013<br />
4 Preqin, www.preqin.com, “PE Buyout-backed Exits”, January 2013<br />
5 Preqin, www.preqin.com, “Performance Analyst”, January 2013<br />
Global Buyout - Exits<br />
- Exits<br />
Number of Exits<br />
1,400<br />
1,200<br />
1,000<br />
800<br />
600<br />
400<br />
200<br />
0<br />
Source: Source: Preqin Preqin<br />
Global Buyout - Vintage Year Performance<br />
30%<br />
25%<br />
20%<br />
15%<br />
IRR Global Buyout - Vintage Year Performance<br />
10%<br />
5%<br />
0%<br />
Source: Preqin<br />
Upper Quartile Median Lower Quartile<br />
2004 2005 2006 2007 2008 2009<br />
IPO Restructuring<br />
Recapitalisation Sale to GP<br />
Trade Sale Sale to Management<br />
2007 2008 2009 2010 2011 2012<br />
© 2013 <strong>Fund</strong> <strong>Evaluation</strong> <strong>Group</strong>, <strong>LLC</strong>