Tool for Conducted EMI and Filter Design - Faculdade de Engenharia
Tool for Conducted EMI and Filter Design - Faculdade de Engenharia
Tool for Conducted EMI and Filter Design - Faculdade de Engenharia

You also want an ePaper? Increase the reach of your titles
YUMPU automatically turns print PDFs into web optimized ePapers that Google loves.
<strong>Tool</strong> <strong>for</strong> <strong>Conducted</strong> <strong>EMI</strong> <strong>and</strong> <strong>Filter</strong> <strong>Design</strong><br />
Elio Freitas Magnus, Júlio C. M. <strong>de</strong> Lima, V. M. Canalli, J. A. Pomilio <strong>and</strong> F. S. Dos Reis<br />
Pontifícia Universida<strong>de</strong> Católica do Rio Gr<strong>and</strong>e do Sul<br />
<strong>Faculda<strong>de</strong></strong> <strong>de</strong> <strong>Engenharia</strong><br />
Departamento <strong>de</strong> <strong>Engenharia</strong> Elétrica<br />
Avenida Ipiranga, 6681 - Porto Alegre – RS<br />
CEP 90619-900 - Brasil<br />
e-mail:f.dosreis@ieee.org<br />
Abstract - In this paper a simulation tool that allows us<br />
to <strong>de</strong>termine the conducted Electromagnetic<br />
Interference (<strong>EMI</strong>), generated <strong>for</strong> the basic PFP<br />
converters (Cuk, Buck, Boost, Buck-Boost, Sepic, <strong>and</strong><br />
Zeta converters) will be presented. Using this<br />
Software, we can <strong>de</strong>termine full <strong>EMI</strong> spectrum in<br />
dB/µV in accordance with the CISPR 16 st<strong>and</strong>ard. An<br />
<strong>EMI</strong> filter <strong>de</strong>sign methodology that allow us to<br />
accommodate the conducted Electromagnetic<br />
Interference (<strong>EMI</strong>) generated by power factor<br />
correctors to international st<strong>and</strong>ards in the <strong>de</strong>sign<br />
step is also presented. There<strong>for</strong>e, this can be an useful<br />
aid <strong>for</strong> power electronics <strong>de</strong>signers.<br />
Keywords <strong>EMI</strong>, PFPs, <strong>Filter</strong>.<br />
I. INTRODUCTION<br />
A crucial task in the recent years has been the<br />
reduction of the product <strong>de</strong>velopment time, because the<br />
product lifetime has become shorter quickly. Keeping this<br />
in mind, is important to minimize the <strong>EMI</strong> failures in the<br />
<strong>de</strong>sign time, because the real cost of <strong>EMI</strong> compliance<br />
failing is not the charge ma<strong>de</strong> to EMC cre<strong>de</strong>ntial<br />
laboratories <strong>for</strong> testing <strong>and</strong> re-testing, that can be<br />
expensive, with Test House fees up to U$ 1,500.00 per<br />
day. These fees fa<strong>de</strong> into insignificance when compared<br />
with the impact of the resulting <strong>de</strong>lay on product time to<br />
market [1].<br />
The influence of the <strong>EMI</strong> injected into the AC line by<br />
the power converters working as Power Factor<br />
Preregulators (PFP) in the electronic <strong>de</strong>sign is becoming<br />
more <strong>and</strong> more important. This is because the converters<br />
need to fulfil the international st<strong>and</strong>ards <strong>for</strong> <strong>EMI</strong> of<br />
current <strong>and</strong> future regulation limits of conducted <strong>and</strong><br />
radiated noise generation. These regulations also limit the<br />
minimum power factor <strong>for</strong> the equipment connected to<br />
the AC line.<br />
All these facts <strong>de</strong>monstrate the importance of the <strong>EMI</strong><br />
analysis of power converters working as Power Factor<br />
Preregulator (PFP).<br />
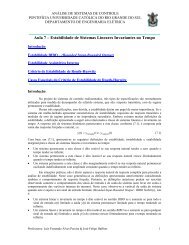
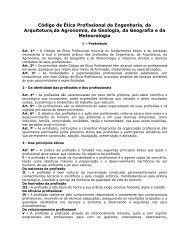
A method <strong>for</strong> <strong>de</strong>termination of PFP conducted<br />
Electromagnetic Interference (<strong>EMI</strong>) emission was<br />
presented by Dos Reis et al [2]. Which it was based, in a<br />
group of curves as you can see in figure 1, that allow us<br />
to <strong>de</strong>termine the amplitu<strong>de</strong> of the conducted <strong>EMI</strong><br />
Differential Mo<strong>de</strong> (DM) (first harmonic) in dB/µV in<br />
accordance with the International Special Committee on<br />
Radio Interference publication 16 (CISPR 16) [3]<br />
st<strong>and</strong>ard, <strong>for</strong> (Cuk, Buck, Boost, Buck-Boost, Sepic <strong>and</strong><br />
Zeta) converters working as PFP, in all operates mo<strong>de</strong>s<br />
Continuous Conduction Mo<strong>de</strong> (CCM), Discontinuous<br />
Conduction Mo<strong>de</strong> (DCM) <strong>and</strong> Frequency Modulation<br />
(FM) as proposed by Albach [4]. In that work the authors<br />
only present the first harmonic [4]. The curves are ma<strong>de</strong><br />
taking into account a simulation of the measuring<br />
apparatus in accordance with CISPR 16. A very good<br />
method <strong>for</strong> this simulation was presented by Albach [4].<br />
Fig. 1: Example of <strong>EMI</strong> <strong>de</strong>sign curves.<br />
In this work a full simulation tool is presented. This<br />
tool was <strong>de</strong>veloped in or<strong>de</strong>r to run in a Personal<br />
Computer <strong>and</strong> can simulate the entire <strong>EMI</strong> spectrum.<br />
Using this Software it is possible to <strong>de</strong>terminate with<br />
very good accuracy the conducted <strong>EMI</strong> be<strong>for</strong>e build a<br />
prototype. This in<strong>for</strong>mation can contribute to reduce the<br />
product <strong>de</strong>velopment time <strong>and</strong> there<strong>for</strong>e the cost.<br />
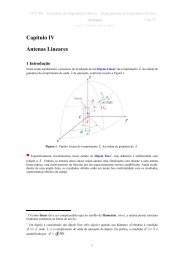
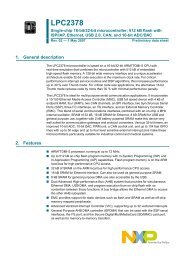
This software permit the simulation of the Line<br />
Impedance Stabilization Network (LISN) like you can see<br />
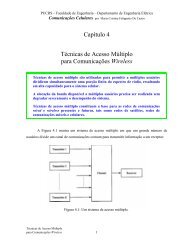
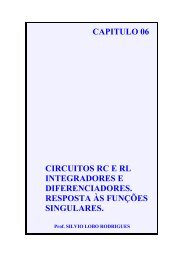
in figure 2 <strong>and</strong> the <strong>EMI</strong> receiver parts (input filter,<br />
<strong>de</strong>modulator, Quase-Peak Detector <strong>and</strong> Mechanical<br />
Measurement Apparatus) like you can see in figure 3, in<br />
accordance with the CISPR 16 st<strong>and</strong>ard. Using the<br />
proposed software tool, the <strong>EMI</strong> curves can be obtained<br />
from simulation analysis. The CISPR 16 establish a<br />
st<strong>and</strong>ardized way to <strong>de</strong>terminate the <strong>EMI</strong> spectrum. In<br />
or<strong>de</strong>r to comply with CISPR 16 st<strong>and</strong>ards, an <strong>EMI</strong> receiver<br />
must inclu<strong>de</strong> a filter with specified b<strong>and</strong>widths <strong>and</strong> shapes,<br />
an envelope <strong>de</strong>tector, a quasi-peak <strong>de</strong>tector <strong>and</strong> a meter<br />
with time constants specified like in table 1. In the follow
sections an example of the mathematical harmonic<br />
analysis obtained <strong>for</strong> Sepic <strong>and</strong> Cuk converters is<br />
presented.<br />
+<br />
Impedance<br />
U (t)<br />
D<br />
-<br />
± 20 % Maximum Tolerance<br />
Frequency (MHz)<br />
50µH<br />
5 Ω<br />
LISN<br />
50<br />
Ω<br />
Fre.<br />
kHz<br />
Imp.<br />
Ω<br />
10 5,4<br />
20<br />
80<br />
150<br />
300<br />
800<br />
10000<br />
Fig. 2. Line Impedance Stabilization Network.<br />
+<br />
U (t)<br />
int<br />
D<br />
-<br />
D<br />
R 1w<br />
C D<br />
C w<br />
+<br />
R<br />
1D<br />
U (t)<br />
CD<br />
-<br />
R 2w<br />
R<br />
2D<br />
+<br />
U (t)<br />
w<br />
-<br />
7,3<br />
21<br />
33<br />
43<br />
49<br />
50<br />
(a)<br />
(b)<br />
(c)<br />
Fig. 3. <strong>EMI</strong> receiver parts (a) input filter, (b)<br />
<strong>de</strong>modulator, (c) quasi-peak <strong>de</strong>tector <strong>and</strong> mechanical<br />
meas. apparatus.<br />
TABLE I<br />
MEASUREMENTS SPECIFICATIONS ACCORDING TO CISPR 16<br />
Range of frequency<br />
Characteristics .10 to 0.15 to 30 to 1000<br />
150 kHz 30 MHz MHz<br />
BANDWIDTH 220 Hz 9 kHz 120 kHz<br />
Charge time constant (τ1) 45 ms 1 ms 1 ms<br />
Discharge time constant (τ2) 500 ms 160 ms 550 ms<br />
Mechanical time constant (τm) 160 ms 160 ms 100 ms<br />
II. HARMONIC ANALYSIS OF THE INPUT CURRENT FOR<br />
SEPIC AND CUK<br />
The <strong>EMI</strong> simulation is obtained from the input current<br />
harmonic analysis of the studied converter <strong>and</strong> from the<br />
simulation of the LISN <strong>and</strong> <strong>EMI</strong> receiver. The high<br />
frequency current harmonics flows through the LISN<br />
which is a current voltage transducer (fig. 2) the voltage<br />
at the output of the LISN is applied to the <strong>EMI</strong> input filter<br />
receiver fig. 3 (a), after that the interference voltage<br />
Uint(t) is applied to the envelope <strong>de</strong>tector fig. 3 (b), the<br />
<strong>de</strong>modulated voltage UD (t) is applied to the quasi-peak<br />
<strong>de</strong>tector <strong>and</strong> finally the result is shown in the meter fig. 3<br />
(c). In this section we present the harmonic analysis of<br />
the input inductor current iL1 <strong>for</strong> Sepic <strong>and</strong> Cuk<br />
converters as PFP in Discontinuous Conduction Mo<strong>de</strong><br />
(DCM). The same analysis can be exten<strong>de</strong>d to the others<br />
basic PFP converters working in all operation mo<strong>de</strong>s.<br />
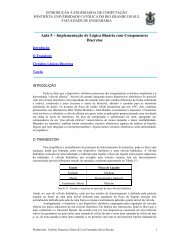
The basic structures of the Sepic <strong>and</strong> Cuk converters<br />
are shown in Fig. 4. In or<strong>de</strong>r the results obtained <strong>for</strong> the<br />
Boost converter are showed in this paper, thereunto, the<br />
buck converter results are showed too.<br />
For the present analysis, the elements in Fig. 4 will be<br />
consi<strong>de</strong>red as follows:<br />
a) Inductors L1 <strong>and</strong> L2 will be represented by its<br />
inductance.<br />
b) The output capacitor Cf is represented as a voltage<br />
source, because Cf is large enough.<br />
c) All semiconductors are i<strong>de</strong>al switches.<br />
d) The voltage vg <strong>de</strong>notes the rectified mains input<br />
voltage<br />
vg = Vg | sin ωt |, where Vg is the peak value of the mains<br />
input voltage (ve), ω = 2πf <strong>and</strong> f is the line voltage<br />
frequency. In a S.F. period we consi<strong>de</strong>r vg constant <strong>and</strong><br />
its value is vg = Vg| sin ω t1i |. We can make this<br />
simplification because the line voltage has a frequency<br />
(50 - 60 Hz) which is much lower than the S.F.<br />
e) The capacitor C1 voltage follows the input voltage in a<br />
line period as <strong>de</strong>scribed by Simonetti et al [5].<br />
L<br />
i C<br />
D<br />
g 1<br />
+<br />
v<br />
e<br />
-<br />
+<br />
v<br />
e<br />
-<br />
+<br />
v g<br />
-<br />
+<br />
v Q<br />
g L<br />
2<br />
Ccc<br />
-<br />
i g<br />
L<br />
1<br />
Q<br />
(a)<br />
1 :n T<br />
i d<br />
C L<br />
a Cb 2<br />
(b)<br />
1 :n T<br />
D<br />
i d<br />
C cc<br />
R<br />
R<br />
+<br />
V<br />
-<br />
-<br />
V<br />
+
Fig. 4. Sepic <strong>and</strong> Cuk converters (a) <strong>and</strong> (b) respectively.<br />
The Sepic <strong>and</strong> Cuk converters in DCM present an<br />
average input current proportional to the input voltage in<br />
a switching period as shown in [6]. It can be<br />
<strong>de</strong>monstrated that, Sepic <strong>and</strong> Cuk converters when<br />
operating as PFP in DCM have the same input current.<br />
There<strong>for</strong>e, the analysis ma<strong>de</strong> <strong>for</strong> Sepic converter is also<br />
valid <strong>for</strong> Cuk converter. Throughout this paper, the<br />
results obtained <strong>for</strong> Sepic converter is the same as the<br />
results obtained <strong>for</strong> Cuk converter.<br />
The input current <strong>for</strong> Sepic <strong>and</strong> Cuk converters as PFP<br />
in DCM, within a S.F. period, is given as a function of<br />
the time instants t1i, t2i, t3i <strong>and</strong> t4i. The in<strong>de</strong>x i = 1, 2 ... I,<br />
represent the numbers of the S.F. periods within one halfwave<br />
period of the input voltage vg. The I value is<br />
<strong>de</strong>fined as I = fs / (2.0 f), in the case of constant switching<br />
frequency. In Fig. 5 we show the input current as a<br />
function of the time instants t1i, t2i, t3i <strong>and</strong> t4i, <strong>for</strong> one<br />
switch period of a Sepic or Cuk converter as PFP in<br />
DCM. In the Table II, the time intervals are best<br />
explained.<br />
TABLE II<br />
TIME INTERVALS.<br />
t1i transistor becomes conducting.<br />
t2i transistor becomes non-conducting.<br />
t3i currents iL1 <strong>and</strong> iL2 becomes equal.<br />
t4i transistor becomes conducting again.<br />
t4i-t1i = T = 1 / fs high frequency period.<br />
t2i-t1i = ton = dT on time of the transistor.<br />
To know the conducted <strong>EMI</strong> DM generated by these<br />
converters, we need to know the high frequency Fourier<br />
coefficients. The Fourier expansion of the input current<br />
can be expressed by equation (1).<br />
⎛<br />
⎜a<br />
⎝<br />
nπt<br />
nπt<br />
⎞<br />
+ b sin ⎟<br />
τ τ ⎠<br />
∑ ∞<br />
ao<br />
i (t) = +<br />
L1<br />
n<br />
n<br />
2 n=1<br />
cos (1)<br />
The coefficients an <strong>and</strong> bn have been calculated as in [4],<br />
where:<br />
I<br />
2 t 4i = ∑ ∫t<br />
i 1i τ i=1<br />
(t) cos nωt<br />
dt (2)<br />
I<br />
2 t 4i = ∑ ∫t<br />
i 1i τ i=1<br />
(t) sin nωt<br />
dt (3)<br />
π<br />
τ =<br />
ω<br />
... ... ω = 2πf<br />
(4)<br />
a L<br />
n 1i<br />
b L<br />
n 1i<br />
Fig. 5. Input current as a function of time intervals.<br />
III. <strong>EMI</strong> TOOL DESCRIPTION<br />
In this section will be presented a <strong>de</strong>scription of the<br />
software that allows to <strong>de</strong>termine the conducted <strong>EMI</strong> in<br />
dB/µV <strong>for</strong> the more employed PFP converters, in<br />
accordance to the CISPR 16 [3] st<strong>and</strong>ard. This tool can be<br />
used <strong>for</strong> <strong>de</strong>velopment of the Boost, Buck, Buck-Boost,<br />
Zeta, Sepic <strong>and</strong> Cuk converters.<br />
The main parts of the software are <strong>de</strong>scribed in the<br />
follow steps:<br />
• The calculation of input current <strong>for</strong> the cited<br />
converters in high frequency (h.f.). An example of<br />
input data is shown in the figure 6.<br />
• To obtain the Fourier coefficients an <strong>and</strong> bn of the<br />
input current. This coefficients <strong>for</strong> all converters can<br />
be obtained as <strong>for</strong> Sepic <strong>and</strong> Cuk converters. To<br />
check the obtained coefficients the tool supply an<br />
input current time domain as shown in figure 7.<br />
• To obtain the interference voltage, simulating the<br />
input current across of the artificial mains network<br />
(LISN).<br />
• To simulate measurements apparatus in accordance<br />
to CISPR 16, using the characteristics of the table 1.<br />
• To show in graphic <strong>for</strong>ms the conducted <strong>EMI</strong>. An<br />
example is showed in figure 8.<br />
It is important to observe that at fs = 150 kHz the<br />
curves have a discontinuity. This discontinuity at 150<br />
kHz has its origin in the CISPR 16, which establishes<br />
changes in the measurement apparatus at this frequency.<br />
The most important change occurs in the b<strong>and</strong>width of<br />
the receiver that changes from 200 Hz to 9 kHz.<br />
For validation of this tool, results obtained in [4] <strong>and</strong><br />
[7] were compared <strong>and</strong> showed that <strong>for</strong> few steps of<br />
calculation, they are very good.
Fig. 6: Input data <strong>for</strong> boost converter.<br />
Fig. 7: Simulated input current <strong>for</strong> boost converter.<br />
Fig. 8: Graphical output <strong>for</strong> <strong>Conducted</strong> <strong>EMI</strong>.<br />
IV. <strong>EMI</strong> FILTER DESIGN CONSIDERATIONS<br />
The <strong>de</strong>sign of a suitable <strong>EMI</strong> filter can be done<br />
according different approaches [7-9]. Usually a highor<strong>de</strong>r<br />
filter is used to reduce inductance <strong>and</strong> capacitance<br />
values.<br />
I<strong>de</strong>ally it could be consi<strong>de</strong>red that no harmonic<br />
components exist in the frequency range between the line<br />
<strong>and</strong> the switching frequencies. This fact would allow to<br />
center the filter resonance at a suitable frequency in or<strong>de</strong>r<br />
to guarantee the required attenuation. In this i<strong>de</strong>al<br />
situation the filter could be undamped.<br />
In the Continuous Conduction Mo<strong>de</strong> the input rectified<br />
voltage is usually used to create the current reference<br />
wave<strong>for</strong>m. In this case the presence of instabilities in the<br />
filter output (converter si<strong>de</strong>) can lead to severe converter<br />
malfunction [10].<br />
As the input voltage wave<strong>for</strong>m is not so important <strong>for</strong><br />
the proper operation of the PFC in the Discontinuous<br />
Conduction Mo<strong>de</strong>, some damping effect is necessary to<br />
avoid oscillations in the average input current produced<br />
by transient situations, like load or line changes.<br />
According to the paper proposition, the filter will be<br />
<strong>de</strong>signed consi<strong>de</strong>ring only the differential mo<strong>de</strong> <strong>EMI</strong><br />
noise produced by the converter. For this type of filter,<br />
not only the required attenuation but also other<br />
restrictions must be taken into account. For example,<br />
VDE st<strong>and</strong>ard specifies a maximum x-type capacitance of<br />
2.2 µF [8] in or<strong>de</strong>r to limit the line current ( 50/60 Hz<br />
component) even at no load situation. The maximum<br />
capacitance should be used to minimise the inductance<br />
value.<br />
Let us consi<strong>de</strong>r the damped second or<strong>de</strong>r filter<br />
topology shown in figure 9. This filter attenuates 40<br />
dB/<strong>de</strong>c. For a given necessary attenuation, the cut-off<br />
frequency is given by:<br />
f x<br />
f c = (1)<br />
A1<br />
A2<br />
10<br />
where fc is the cut-off frequency, fx is the frequency in<br />
which the required attenuation (A1) is <strong>de</strong>termined. A2 is<br />
the filter characteristic attenuation.<br />
The inductance value is given by:<br />
1<br />
L f = (2)<br />
2 2<br />
4π<br />
C f<br />
The maximum C1+C2 value is 2.2 µF [8], <strong>and</strong> <strong>for</strong> a<br />
proper damping effect, C2=10C1. The damping resistance<br />
can be calculated as:<br />
Line si<strong>de</strong><br />
L<br />
1<br />
c<br />
f<br />
R d = (3)<br />
C 2<br />
L C<br />
f 2<br />
R<br />
d<br />
Converter si<strong>de</strong><br />
Fig. 9 <strong>EMI</strong> differential mo<strong>de</strong> filter.<br />
V. FILTER DESIGN EXAMPLE<br />
The st<strong>and</strong>ard IEC CISPR 11 [11] <strong>de</strong>termines limits <strong>for</strong><br />
conducted noise <strong>for</strong> industrial, scientific <strong>and</strong> medical<br />
equipment (ISM). The limit <strong>for</strong> mains terminal<br />
disturbance voltage in the frequency b<strong>and</strong> 150 kHz to 500<br />
C<br />
1
kHz is 66 dB/µV (average level), measured according to<br />
CISPR 16.<br />
Let us consi<strong>de</strong>r a boost PFC, in DCM, <strong>and</strong> the 102<br />
dB/µV predicted <strong>EMI</strong> level shown in Fig. 8. The required<br />
filter attenuation is 36 dB/µV. To have this value at 150<br />
kHz, a second-or<strong>de</strong>r filter must have a cut-off frequency<br />
at 18.9 kHz (equation (38)). Adopting C1=220 nF <strong>and</strong><br />
C2=2 µF, the inductance (equation (39)) <strong>and</strong> damping<br />
resistance (equation (40)) are, respectively, 322 µH <strong>and</strong><br />
38 Ω. Figure 10 shows the filter frequency response,<br />
given the 36 dB attenuation at 150 kHz.<br />
Fig. 10 – <strong>EMI</strong> filter attenuation.<br />
IV. EXPERIMENTAL RESULTS<br />
For experimental validation of the proposed tool, a<br />
Boost, a Buck, a Sepic <strong>and</strong> a Zeta converters prototypes<br />
were implemented <strong>and</strong> tested at Labelo (a cre<strong>de</strong>ntial<br />
measurement laboratory). Un<strong>de</strong>rwriters Laboratories Inc.<br />
of the USA recognize this Laboratory. The experimental<br />
<strong>EMI</strong> result <strong>for</strong> the Boost converter are shown in Fig. 11.<br />
The results obtained by the proposed <strong>EMI</strong> tool <strong>for</strong> Boost<br />
converter are shown in Fig. 8. The simulations <strong>and</strong> the<br />
implemented prototype <strong>for</strong> Boost converter was ma<strong>de</strong><br />
using the specifications shown in the input panels of the<br />
Fig. 6. The results obtained in the lab were compared<br />
with the results of the simulation <strong>and</strong> are presented in the<br />
Table III.<br />
Fig. 11. Experimental results <strong>for</strong> the Boost Converter test.<br />
TABLE III<br />
COMPARISON BETWEEN LAB AND PROPOSED<br />
TOOL RESULTS.<br />
FREQUENCY<br />
CONDUCTED <strong>EMI</strong> GENERATED BY<br />
A BOOST CONVERTER (dB/ µV)<br />
(kHz)<br />
LAB’S RESULTS<br />
RESULTS OF THE<br />
PROPOSED TOOL<br />
30 115,2 113,9<br />
60 116,4 113,3<br />
90 111,6 110,6<br />
120 109,3 105,4<br />
150 - 95,8<br />
VI. ACKNOWLEDGMENTS<br />
The authors gratefully acknowledges the support of the<br />
Brazilian agency FAPERGS <strong>for</strong> their financial support to<br />
this work.<br />
VII. CONCLUSIONS<br />
The presented tool is very important to the<br />
<strong>de</strong>velopment of projects of conducted <strong>EMI</strong> filter,<br />
reducing the steps of cut-<strong>and</strong>-trial, that normally are used<br />
to solve conducted <strong>EMI</strong> problems.<br />
This tool can contribute to the reduction of the product<br />
<strong>de</strong>velopment time, reducing this way, the cost of<br />
<strong>de</strong>velopment <strong>and</strong> providing a quick return of investments,<br />
with the advantage that the product can be sold be<strong>for</strong>e the<br />
similar product of the competitor are on the market.<br />
In the research, this software helps the <strong>de</strong>velopment<br />
of more efficient <strong>and</strong> suitable converters according to the<br />
international st<strong>and</strong>ard rules <strong>and</strong> the consumer market.<br />
Besi<strong>de</strong>s of this, the software is also very helpful to teach<br />
the Power Electronic discipline.<br />
The simulation time is short, if consi<strong>de</strong>red that the<br />
software execute thous<strong>and</strong>s of interactions, converging to<br />
the values with an acceptable precision <strong>and</strong> running<br />
complex equations at the same time.<br />
VIII. REFERENCES<br />
1. Hewlett Packard. EMC In The European Environment<br />
- Seminar. 1992.<br />
2. F. S. Dos Reis, J. Sebastián, J. Uceda, 1994, PESC'94,<br />
1117 - 1126.<br />
3. CISPR 16 - Specification <strong>for</strong> Radio Interference<br />
Measuring Apparatus <strong>and</strong> Measurement Methods, second<br />
edition 1987.<br />
4. Albach, M. 1986. PESC'86, 203 - 212.<br />
5. D.S.L. Simonetti, J. Sebastián, F.S. Dos Reis <strong>and</strong> J.<br />
Uceda. 1992. IECON 92, 283 - 288.<br />
6. K. H. Liu <strong>and</strong> Y. L. Lin, 1989, PESC'89, 825 - 829.<br />
7. F.S. Dos Reis, J. Sebastián <strong>and</strong> J. Uceda. EPE 95,<br />
3.259 – 3.264.