Complete mitochondrial DNA sequence analysis of Bison bison and ...
Complete mitochondrial DNA sequence analysis of Bison bison and ...
Complete mitochondrial DNA sequence analysis of Bison bison and ...

Create successful ePaper yourself
Turn your PDF publications into a flip-book with our unique Google optimized e-Paper software.
168 K.C. Douglas et al. / Mitochondrion 11 (2011) 166–175<br />
2.3. mt<strong>DNA</strong> genome <strong>analysis</strong><br />
The complete <strong>mitochondrial</strong> <strong>sequence</strong>s <strong>of</strong> 30 Bos taurus (domestic<br />
cattle, hereafter “cattle”), 2 Bos indicus (zebu), 3 Bos grunniens (yak), 1<br />
<strong>Bison</strong> <strong>bison</strong> (American <strong>bison</strong>), <strong>and</strong> 1 Bubalus bubalis (water buffalo)<br />
were obtained from GenBank (Benson et al., 2005) (Supplemental<br />
Materials Table 1). The complete <strong>mitochondrial</strong> genome <strong>sequence</strong>s<br />
were aligned using Clustal X (Larkin et al., 2007) in the MEGA 4.0<br />
phylogenetic package <strong>and</strong> corrected by h<strong>and</strong> when necessary. The<br />
genomes were parsed into the following data sets for functional <strong>and</strong><br />
phylogenetic analyses: 1) <strong>bison</strong> only; 2) <strong>bison</strong> <strong>and</strong> hybrids <strong>and</strong> 3) Bos,<br />
<strong>bison</strong>, <strong>and</strong> hybrids. To investigate the variation among <strong>bison</strong> mt<strong>DNA</strong><br />
genomes, an unrooted haplotype network (spring tree) was created<br />
using TCS v1.21 (Clement et al., 2000).<br />
2.4. <strong>Bison</strong>–cattle hybridization <strong>analysis</strong> parameters<br />
An alignment <strong>of</strong> <strong>bison</strong> <strong>and</strong> hybrid haplotypes was created to assess<br />
differences in the two genomes. A previously published cattle mt<strong>DNA</strong><br />
<strong>sequence</strong> (AB074966.1) was used to identify putative gene boundaries<br />
<strong>and</strong> overlapping regions. Aligned files were analyzed gene-bygene<br />
in DnaSP v5 (Librado <strong>and</strong> Rozas, 2009) using the genetic code<br />
for mammalian mt<strong>DNA</strong> to assess the total numbers <strong>of</strong> polymorphic<br />
sites, synonymous changes, <strong>and</strong> non-synonymous changes. Nonsynonymous<br />
changes were then coded by amino acid class (nonpolar,<br />
uncharged polar, positive, negative) to evaluate the number<br />
<strong>of</strong> class-changing mutations between the <strong>bison</strong> <strong>and</strong> hybrid groups.<br />
Changes in tRNA structure due to <strong>sequence</strong> differences between<br />
the <strong>bison</strong> <strong>and</strong> hybrid groups were evaluated using the online<br />
program tRNAscan-SE (Lowe <strong>and</strong> Eddy, 1997; http://lowelab.ucsc.<br />
edu/tRNAscan-SE/). The cove only method (cut-<strong>of</strong>f score=20 bits)<br />
<strong>and</strong> the mito/chloroplast source definition were used. Locations <strong>of</strong><br />
changes were recorded in the following categories: D loop/stem, T C<br />
loop/stem, central loop, anticodon loop/stem, or acceptor arm stem.<br />
2.5. Phylogenetic <strong>analysis</strong><br />
RAxML version 7.0.3 was used to generate unweighted maximum<br />
likelihood phylogenetic trees (Stamatakis, 2006). The GTRGAMMA<br />
model was utilized, <strong>and</strong> 1000 replicates were used to generate<br />
bootstrap values. To account for different nucleotide substitution<br />
rates across the <strong>mitochondrial</strong> genome, we partitioned the <strong>sequence</strong><br />
as follows: each <strong>of</strong> the 13 protein-coding genes <strong>and</strong> the 2 r<strong>DNA</strong> genes<br />
were treated as independent regions (15 total); the 22 t<strong>DNA</strong> genes<br />
were grouped into one large region; <strong>and</strong> the D loop was defined as<br />
an independent region. For each partition, individual alpha-shape<br />
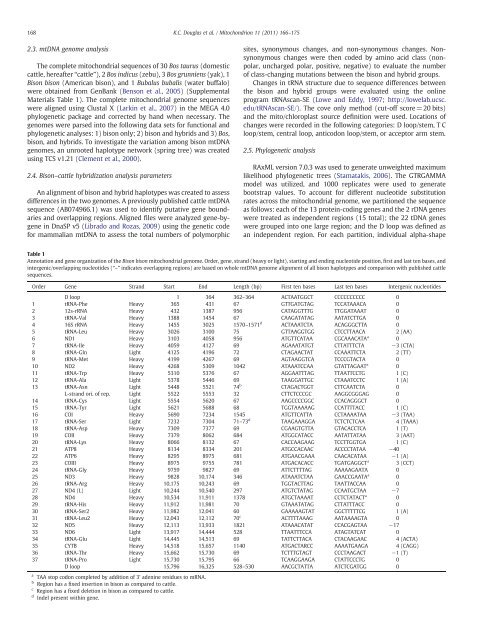
Table 1<br />
Annotation <strong>and</strong> gene organization <strong>of</strong> the <strong>Bison</strong> <strong>bison</strong> <strong>mitochondrial</strong> genome. Order, gene, str<strong>and</strong> (heavy or light), starting <strong>and</strong> ending nucleotide position, first <strong>and</strong> last ten bases, <strong>and</strong><br />
intergenic/overlapping nucleotides (“–” indicates overlapping regions) are based on whole mt<strong>DNA</strong> genome alignment <strong>of</strong> all <strong>bison</strong> haplotypes <strong>and</strong> comparison with published cattle<br />
<strong>sequence</strong>s.<br />
Order Gene Str<strong>and</strong> Start End Length (bp) First ten bases Last ten bases Intergenic nucleotides<br />
D loop 1 364 362–364 ACTAATGGCT CCCCCCCCCC 0<br />
1 tRNA-Phe Heavy 365 431 67 GTTGATGTAG TCCATAAACA 0<br />
2 12s-rRNA Heavy 432 1387 956 CATAGGTTTG TTGGATAAAT 0<br />
3 tRNA-Val Heavy 1388 1454 67 CAAGATATAG AATATCTTGA 0<br />
4 16S rRNA Heavy 1455 3025 1570–1571 d<br />
ACTAAATCTA ACAGGGCTTA 0<br />
5 tRNA-Leu Heavy 3026 3100 75 GTTAAGGTGG CTCCTTAACA 2 (AA)<br />
6 ND1 Heavy 3103 4058 956 ATGTTCATAA CGCAAACATA a<br />
0<br />
7 tRNA-Ile Heavy 4059 4127 69 AGAAATATGT CTTATTTCTA −3 (CTA)<br />
8 tRNA-Gln Light 4125 4196 72 CTAGAACTAT CCAAATTCTA 2 (TT)<br />
9 tRNA-Met Heavy 4199 4267 69 AGTAAGGTCA TCCCGTACTA 0<br />
10 ND2 Heavy 4268 5309 1042 ATAAATCCAA GTATTAGAAT a<br />
0<br />
11 tRNA-Trp Heavy 5310 5376 67 AGGAATTTAG TTAATTCCTG 1 (C)<br />
12 tRNA-Ala Light 5378 5446 69 TAAGGATTGC CTAAATCCTC 1 (A)<br />
13 tRNA-Asn Light 5448 5521 74 b<br />
CTAGACTGGT CTTCAATCTA 0<br />
L-str<strong>and</strong> ori. <strong>of</strong> rep. Light 5522 5553 32 CTTCTCCCGC AAGGCGGGAG 0<br />
14 tRNA-Cys Light 5554 5620 67 AAGCCCCGGC CCACAGGGCT 0<br />
15 tRNA-Tyr Light 5621 5688 68 TGGTAAAAAG CCATTTTACC 1 (C)<br />
16 COI Heavy 5690 7234 1545 ATGTTCATTA CCTAAAATAA −3 (TAA)<br />
17 tRNA-Ser Light 7232 7304 71–73 d<br />
TAAGAAAGGA TCTCTCTCAA 4 (TAAA)<br />
18 tRNA-Asp Heavy 7309 7377 69 CGAAGTGTTA GTACACCTCA 1 (T)<br />
19 COII Heavy 7379 8062 684 ATGGCATACC AATATTATAA 3 (AAT)<br />
20 tRNA-Lys Heavy 8066 8132 67 CACCAAGAAG TCCTTGGTGA 1 (C)<br />
21 ATP8 Heavy 8134 8334 201 ATGCCACAAC ACCCCTATAA −40<br />
22 ATP6 Heavy 8295 8975 681 ATGAACGAAA CAACACATAA −1 (A)<br />
23 COIII Heavy 8975 9755 781 ATGACACACC TGATGAGGCT a<br />
3 (CCT)<br />
24 tRNA-Gly Heavy 9759 9827 69 ATTCTTTTAG AAAAAGAATA 0<br />
25 ND3 Heavy 9828 10,174 346 ATAAATCTAA GAACCGAATA a<br />
0<br />
26 tRNA-Arg Heavy 10,175 10,243 69 TGGTACTTAG TAATTACCAA 0<br />
27 ND4 (L) Light 10,244 10,540 297 ATGTCTATAG CCAATGCTAA −7<br />
28 ND4 Heavy 10,534 11,911 1378 ATGCTAAAAT CCTCTATACT a<br />
0<br />
29 tRNA-His Heavy 11,912 11,981 70 GTAAATATAG CTTATTTACC 0<br />
30 tRNA-Ser2 Heavy 11,982 12,041 60 GAAAAAGTAT GGCTTTTTCG 1 (A)<br />
31 tRNA-Leu2 Heavy 12,043 12,112 70 c<br />
ACTTTTAAAG AATAAAAGTA 0<br />
32 ND5 Heavy 12,113 13,933 1821 ATAAACATAT CCACGAGTAA −17<br />
33 ND6 Light 13,917 14,444 528 TTAATTTCCA ATAGTATCAT 0<br />
34 tRNA-Glu Light 14,445 14,513 69 TATTCTTACA CTACAAGAAC 4 (ACTA)<br />
35 CYTB Heavy 14,518 15,657 1140 ATGACTARCC AAAATGAAGA 4 (CAGG)<br />
36 tRNA-Thr Heavy 15,662 15,730 69 TCTTTGTAGT CCCTAAGACT −1 (T)<br />
37 tRNA-Pro Light 15,730 15,795 66 TCAAGGAAGA CTATTCCCTG 0<br />
D loop 15,796 16,325 528–530 AACGCTATTA ATCTCGATGG 0<br />
a<br />
TAA stop codon completed by addition <strong>of</strong> 3' adenine residues to mRNA.<br />
b<br />
Region has a fixed insertion in <strong>bison</strong> as compared to cattle.<br />
c<br />
Region has a fixed deletion in <strong>bison</strong> as compared to cattle.<br />
d<br />
Indel present within gene.