Declaration Dr. Thomas H. Pringle - Buffalo Field Campaign
Declaration Dr. Thomas H. Pringle - Buffalo Field Campaign
Declaration Dr. Thomas H. Pringle - Buffalo Field Campaign

Create successful ePaper yourself
Turn your PDF publications into a flip-book with our unique Google optimized e-Paper software.
02/14/2011 10:36 5206827080<br />
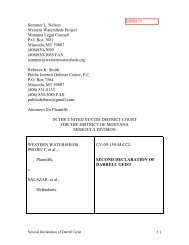
Summer L. Nelson<br />
Western Watersheds PrQject<br />
Montana Legal Counsel<br />
P.O. Box 7681<br />
Missoula, MT 59807<br />
(406)830-3099<br />
(406)830-3085 FAX<br />
summer@westemwatersheds.org<br />
Rebecca K. Smith<br />
Public Interest Defense Center, P.C.<br />
P.O. Box 7584<br />
Missoula, ¥T 59807<br />
(406) 531-8133<br />
(406) 830-3085 FAX<br />
p ublicde [ense@gmaiLcom<br />
Attorneys for Plaintiffs<br />
WESTERN WATERSHEDS<br />
:PROJECT, et al.,<br />
Plaintiffs,<br />
v.<br />
SALAZAR, et al.,<br />
Defendants.<br />
PICTURE ROCKS HDWR<br />
IN 1HE UNITED STATES DISTRICT COURT<br />
FOR THE DISTRICT OF MONTANA<br />
:MISSOULA DNISION<br />
CV-09-1S9-M-CCL<br />
DECLARATION OF DR.<br />
mOMAS PRINGLE<br />
01/06
02/14/2011 10:35 5205827080 PICTURE ROCKS HDWR PAGE 02/05<br />
1. My name is <strong>Thomas</strong> <strong>Pringle</strong>. I am a molecular biologist on the<br />
genomics team annotating dozens of mammalian genomes at the<br />
University of California at Santa Cruz.<br />
2. I received my undergraduate degree in 1966 from Harvard, completed<br />
graduate work in molecular biology at the University of Cali fomi a<br />
San Diego, and received a Ph.D. in mathematics at the University of<br />
Oregon. I was fonnerly a college professor at Gettysburg College in<br />
Pennsylvania and taught biochemical genetics at the University of<br />
Texas Medical School. I currently direct the Sperling Biomedical<br />
Foundation based in Eugene, Oregon.<br />
3. I am an expert on vertebrate comparative genomics and have<br />
published nWllerouS original research articlcs in major scientific<br />
journals in which I analyzed genetic variations similar to those of<br />
bison for neutrality, adaptation or disease. My recent publications on<br />
this topic include the following:<br />
a. Nature. 2010 Feb. 18; 463(7283): 943-7. Complete Khoisan and<br />
Bantu genomes from southern Africa.<br />
b. Nature. 2008 Nov. 20; 456(7220):387-90. Sequencing the<br />
nuclear genome of the extinct woolly mammoth.<br />
c. Nature. 2008 May 8; 453(7192):175-83. Genome analysis of<br />
the platypus reveals unique signatures of evolution.<br />
d. Science. 2007 Nov. 2;318(5851):792-4. Molecular and<br />
genomic data identify the closest living relative of primates.<br />
e. PNAS 2011 (in press). Conservation genomics of Tasmanian<br />
Devil.<br />
f. Science 2011 (in press). Adaptive change in the mammoth<br />
proteome.<br />
g. Genome Res. 2007 Dec.;! 7(12): 1797-808. 28-way vertebrate<br />
alignment and conservation track in the UCSC Genome<br />
Browser.<br />
h. Genome Res. 2007 Apr.; 17(4):413-21. Using genomic data to<br />
unravel the root of the placental mammal phylogeny.<br />
1. Genome Res. 2002 Jun.; 12(6):996-1006. The human genome<br />
browscr at uses.<br />
J. PLoS Comput. BioI. 2007 Dec.;3(12):e247. Comparative<br />
genomics search for losses of long-established genes on the<br />
human lineage.
02/14/2011 10:35 5205827080 " PICTURE ROCKS HDWR<br />
nine standard methods of biomedical genetics, an academic field<br />
under development since 1949.<br />
9. One of the pUblications I relied upon for my research was published in<br />
December 2010 by <strong>Dr</strong>. James Derr and colleagues entitled "Complete<br />
mitochondrial DNA sequence analysis of Bison bison and bison-cattle<br />
hybrids: function and phylogeny". It is attached to my<br />
declaration. Another key document concerning the nearest Hving<br />
relative of bison was published in December 2010 by Zhaofang Wang<br />
and colleagues entitled "Phylogcographical analyses of domestic and<br />
wild yaks based on mitochondrial DNA: new data and reappraisal".<br />
The synthe:sis of new data in these two papers and many others<br />
established that certain bison genetic variations are not hannless<br />
variants but instead deleterious mutations.<br />
10. I conducted analysis of complete bison mitochondrial genumes 1n a<br />
comparative genomics context and established that a widespread bison<br />
mitochondrial genome, haplotype 6, carries substitutions (relative to<br />
haplotype 8) in both cytochrome b (V98A: the amino acid valine at<br />
position 98 in hap H is changed to alanine in hap 6) and ATP6 (I60N:<br />
isoleucine at position 60 in hap 8 is changed to asparagine in hap 6).<br />
Both variants in haplotype 6 are unambiguously deleterious according<br />
to numerous bioinfonnatic criteria and clinical observations in other<br />
species; together as a double mutation the strongly imply that these<br />
bison are affected by significant mitochondrial disease.<br />
11. Since similar mutations in human and dog cause consistent clinical<br />
impairment of energy production from food (via mitochondrial<br />
oxidative phosphorylation). these bison are predicted significantly<br />
impaired in aerobic capacity, plausibly disrupting highly evolved cold<br />
toleran.ce, winter feeding behaviors, escape from predators and<br />
competition for breeding.<br />
12. To estimate prevalence of diseased and non-diseased baplotypes at<br />
YNP, I used all available data as of January 15,2011. This consisted<br />
of two YNP complete mitochondrial genomes that speak: directly to<br />
disease or non-disease status but primarily of shorter mitochondrial<br />
control region sequences obtained by F. Gardipee for 151 YNP and 28<br />
GINP bison with representative saItlpling from known geographical<br />
locations. These later sequences did not directly cover the two regions<br />
PAGE 04/ 05
02/14/2011 10:36 5206827080 PICTURE ROCKS HDWR<br />
of interest (cytochrome b and A TP6). However, the variety of<br />
controls and re-analysis described in my paper strongly indicate that<br />
the Gardipee data can be unambiguously mapped into disease or notdisease<br />
ha.plotype and these shorter sequences can thus serve as a<br />
reliable proxy for full data, as they routinely are throughout<br />
biomedical genetics. The Ga.rdipee thesis is attached to my<br />
declaration.<br />
13. Below Ire-cast Gardipee's Table 3-1 into disease (hap6) and nondisease<br />
(hap8) coIwnns under the assumption that truncated microhaplotypes<br />
still provide a valid window into the status of the protein<br />
coding genes cytochrome b and A TP6.<br />
PAGE 05/06<br />
V98A I60N V98V 1601<br />
hap 6 hap 8<br />
Park Herd<br />
Hayden<br />
(deleterious) (healthy) % Healthy<br />
YNP<br />
YNP<br />
Valley<br />
Lamar Valley<br />
88<br />
19<br />
6<br />
22<br />
6%<br />
54%<br />
YNP Mirror Plateau 10 6 38%<br />
GTNP Antelope Flats 20 0<br />
0%<br />
GlNP WolfCreek 8<br />
°<br />
0%<br />
14. In some years the cull size has exceeded 1,000 animals and in one<br />
year the cull was approximately 1,400 individuals which may<br />
significantly exceed the total number of estimated hap 8 bison in the<br />
park (some 778 animals. assuming averaged YNP data above is<br />
roughly representative of current Park bison with total herd size taken<br />
as 3,500). However Park hison move about and herd numbers<br />
fluctuate; direct DNA testing of coralled animals prior to cull would<br />
be a more accurate way of measuring non-disease animals slated for<br />
cull.<br />
15. Because the hap 8 (healthy) bison are disproportionally in the<br />
Northern herd of the Park according to the best available data<br />
(Gardipee), they may be over-represented in corralled animals near<br />
Gardiner destined for slaughter, disproportionally reducing the<br />
number of hap 8 animals. These data suggest 2011 culls could worsen
02/14/2011 10:35 5205827080 PICTURE ROCKS HDWR PAGE 05/05<br />
the ratio of healthy to diseased mitochondrial genomes. Despite the<br />
necessary DNA testing being cheap. accurate and rapid, YNP does not<br />
currently detennine the genetic status of bison prior to slaughter.<br />
16. The cull size is so large relative to the known healthy hap 8 bison<br />
population that it could be severely reduced or effectively eliminated.<br />
This would preclude later recovery because no other known source of<br />
genetically purc bison with genetically healthy mitochondrial DNA is<br />
known to exist.<br />
TIiis declaration is made under 28 U.S.C. Sec. 1746. I declare under penalty<br />
of petjury that the foregoing is true and correct to the best of my current<br />
knowledge.<br />
Executed on February 14,2011, in Tucson, Arizona
Abstract<br />
Widespread Mitochondrial Disease in North American Bison<br />
<strong>Thomas</strong> H. <strong>Pringle</strong><br />
Sperling Foundation, Eugene, Oregon 97405 USA tom@cyber-dyne.com<br />
North American bison have rebounded from near-extinction in the nineteenth century but from such small inbred founding populations<br />
that once-rare deleterious nuclear gene alleles and mitochondrial haplotypes are now be at high frequencies. The initial bottleneck was<br />
compounded by decades of unnatural selection affecting bison conservation genomics and undercutting restoration initiatives. The<br />
genomics era began in late 2010 for bison and sister species yak with the release of 102 whole mitochondrial genomes, displacing<br />
earlier control region and microsatellite data not extending to coding regions. This allows detection of both sporadic and sub-clade<br />
level mutations in mitochondrially encoded proteins and tRNAs by comparative genomics methods: deleterious mutations in both<br />
cytochrome b (V98A) and ATP6 (I60N) occur within a single common bison haplotype. Since similar mutations in human and dog<br />
cause clinical impairment of mitochondrial oxidative phosphorylation, these bison are predicted significantly impaired in aerobic<br />
capacity, disrupting highly evolved cold tolerance, winter feeding behaviors, escape from predators and competition for breeding.<br />
Because Yellowstone National Park bison are subjected to genetically uninformed culls and surplus animals used to seed new<br />
conservation herds, mutational status has significant implications. Continuing take of the remaining bison with wildtype mitochondria<br />
may recapitulate errors of nineteenth century bison stewardship bringing bison conservation to the point of no return.<br />
Introduction<br />
Recovery of a species from a severe bottleneck requires consideration of both nuclear and mitochondrial genomics (1, 2) because<br />
inbred reduced populations may have lost much of their former genetic diversity and harbor unnaturally high frequencies of<br />
deleterious alleles (3). Inbreeding depression in Florida panthers (4), collapse of the pygmy rabbit captive breeding program (5),<br />
facial tumors in tasmanian devil (6) and required rescue of the Texas State Bison Herd (7) have put such concerns on center stage.<br />
In the case of bison, natural selection has not been fully operative on deleterious alleles for decades, having been largely displaced<br />
by predator control, genetically uninformed culls, trophy bull hunts, winter hay feeding, and selection for docility. Recovery of large<br />
herds of animals outwardly resembling bison serves no authentic conservation purpose if these bison are hobbled by inherited<br />
disease and no longer function as they had evolved up to the era of human interference.<br />
Genetic isolation of small bison populations has been mitigated in the past by animal exchanges but these have sometimes spread<br />
tuberculosis and brucellosis (8) and brought in descendants of hybridization experiments with domestic cattle (9). The focus today is<br />
restoration of pre-settlement bison genetic diversity without inadvertent spread of inherited disease (1).<br />
For the nuclear genome, the 1000 Human Genome Project concluded (10) that each individual human nuclear genome carries 275<br />
loss-of-function variants and 75 variants previously implicated in inherited disease (both classes typically heterozygous),<br />
additionally differing from the reference human proteome at 10,488 non-synonymous sites. The deleterious alleles include 200 inframe<br />
indels, 90 premature stop codons, 45 splice-site-disrupting variants and 235 deletions shifting reading frame. In bison, in view<br />
of the recent extreme bottleneck and subsequent small herd size history, the overall genetic load should be worse, with deleterious<br />
nuclear genes more commonly homozygous.<br />
Based on extensive clinical testing, a recent study estimates that 1 in 5000 human live births has inherited mitochondrial disease,<br />
with an additional 1 in 200 asymptomatic carriers (11), subject to the complexities of heteroplasmic inheritance of mitochondrial<br />
genomes discussed below. Bison mitochondrial genomes may be affected at even higher frequencies; indeed, significant anomalies<br />
in mitochondrial gene products have already been reported (2).<br />
The limited assessments of bison genetic status provided by sequencing functionally uninformative regions (homopolymers, control<br />
regions, synonymous and non-coding SNPs) have been superseded by direct sequencing of whole nuclear and mitochondrial<br />
proteomes. The cattle nuclear genome was released in October 2007 and soon assembled, aligned and refined (12-14); yak and water<br />
buffalo genome are underway (15) and bison proposed.<br />
Mitochondrial genomes are available for over 214 species of mammals (16), sometimes in high multiplicities for individual species.<br />
This multiplicity allows rare private polymorphisms and features of small clades to be distinguished from an appropriate reference<br />
(or inferred ancestral) genome. Certain mitochondrial genes have been separately sequenced, with over 5,000 GenBank entries for<br />
1,250 mammalian species in the case of cytochrome b. For ancient DNA, some 44 control region sequences are available from fossil<br />
bison and 298 for extinct steppe bison (17). Whole genome sequencing from a frozen carcass is feasible but not yet begun (18).<br />
Data availability is thus quite favorable for comparative genomics though mitochondrial DNA evolves quite rapidly diminishing the<br />
utility of distant outgroups. However the phylogenetic tree is well-established for close-in pecoran ruminants, with ((((bison, steppe<br />
bison), yak), cow), water buffalo) the relevant phylogenetic tree topology here (43).
Below, analysis of complete bison mitochondrial genomes in this comparative genomics context establishes that a widespread bison<br />
haplotype carries substitutions in both cytochrome b (V98A: valine at position 98 changed to alanine) and ATP6 (I60N: isoleucine at<br />
position 60 changed to asparagine). Both variants are unambiguously deleterious according to numerous bioinformatic criteria and<br />
clinical observations in other species; together they strongly imply that these bison are affected by significant mitochondrial disease.<br />
Methods<br />
Relevant GenBank entries were acquired by Blastn of reliably annotated seed sequence queries. Some entries needed re-curation<br />
when the mitochondrial DNA arose from hybridization with another species (such as GenBank accession AB177774). Other entries<br />
were not adequately annotated by haplotype, herd origin, or domestication status in the accompanying publication. Entries lacking<br />
bison source data (or journal publication) has diminished value but was still used after quality control. Older GenBank entries<br />
containing multiple alignment anomalies were discarded as sequencing or submission error. It is difficult to distinguish between<br />
sporadic mutation implied by a single sequence from outright sequencing error when raw read data is not deposited at GenBank and<br />
indeed may not have been saved. Exceptional outcomes are rarely validated by re-sequencing (46).<br />
Wild cattle such as gaur and banteng and fossil aurochsen data were used in place of modern domestic cattle breeds to improve<br />
reconstruction of ancestral sequence nodes and bison mitochondrial protein assessment because inbred domestic cattle have<br />
numerous derived characters (13, 14).<br />
Sequence data never submitted to GenBank, such as the control region sequence fragments for Yellowstone and Grand Teton<br />
National Parks bison located in an unpublished but approved 2007 dissertation (19), was accepted after passing quality review;<br />
haplotypes were mapped into current whole genome based nomenclature (reference 2 and Table 8).<br />
Haplotype re-mapping was also conducted for ancient bison DNA but not for extinct steppe bison because of sequence divergence<br />
and DNA damage possibly resulting in sequence error (17, 20, 21). However alignment of steppe bison DNA at cytosines strictly<br />
conserved in extant yak and bison did not exhibit the expected excess of C to T transitions resulting from putative postmortem<br />
cytosine deamination, though alignment indel abundances are compatible with a substantial error rate in homopolymer run length<br />
determination (data not shown). Full length mitochondrial genomes from steppe bison are very relevant to contemporary bison<br />
conservation genomics but none had been posted to GenBank as of January, 2011.<br />
Fasta headers of sequences directly downloaded from GenBank begin with uninformative accession numbers, yet alignment<br />
programs are generally restricted as to the number of characters displayed. As this leads to unintelligible output in alignments of<br />
thusands of sequences from multiple species, headers were replaced with a simple flat database of concatenated attributes such as<br />
genus, species, haplotype, domestic, wild, and disease allele status.<br />
NCBI provides the main gateway to sequence data via Blast servers (61). While the algorithm itself is stable, formatting options are<br />
not. Understanding these is critical when querying mitochondrial gene products because the enormous amount of available data<br />
overwhelms current display capacity. This causes shorter sequences from bison and yak to score lower than longer sequences from<br />
diverged species and even nuclear numts, resulting in their loss in output. This can be partly remedied by a careful choice of query,<br />
setting the hidden output parameter to its current maximum of 20,000 matches, and making full use of taxonomic inclusion and<br />
exclusion settings. This still does not address GenBank entries filed under the wrong taxon, a serious issue when hybridizations was<br />
not recognized at the time of sequence submission, resulting in spurious genetic diversity when interpreted by a bioinformatics<br />
pipeline.<br />
Output format from a Blast query were manually adjusted to raise the default to the maximum number of alignments allowed,<br />
withthe ‘alignment view’ option re-set to ‘flat query anchored with dots for identities’ because this accommodates indels in either<br />
query or matches, reducing clutter by exhibiting only differences relative to the query. However to speed Blast searches, GenBank<br />
now collapses multiplicities into single precomputed matches in the original output (that is, identical sequences -- even from<br />
different species -- are represented by a single proxy). Those multiplicities are lost upon reformatting but can be captured by using<br />
the taxonomy link from the initial output.<br />
Because output line width is restricted to 80 characters even for a 16,000 base pair whole genome query, this may result in hundreds<br />
of screens of output, almost all dots. To extract information, output was reformatted into a single row and columnized at each<br />
position using a desktop spreadsheet or after realignment of collected accessions in Multalin (22) set at one character break.<br />
Uninformative columns can be moved aside or deleted and the manageable remainder assessed for phylogenetic characters,<br />
haplotype classification, or amino acid variational statistics (reduced alphabet). This approach is far easier to adjust after a formatting<br />
change is made at NCBI than a formal mining algorithm code.<br />
The new ‘find related data’ feature at GenBank proves critical to managing thousands of accession numbers -- a central issue in<br />
bioinformatics because ten thousand vertebrate genomes are being deposited, each with twenty thousand coding genes (15). A long<br />
list of match accessions can be recast as species multiplicities for a non-redundant list of taxa, ordered in a provided phylogenetic<br />
tree. Similarly, all PubMed publication identification numbers associated with the accessions can be requested, allowing quick<br />
recovery of all applicable journal abstracts and those with open access. The thirteen proteins from thousands of mammalian
mitochondrial genomes can be extracted into fasta format and recompiled as separate sets with a database sort on the header. tRNA<br />
compilation still requires screen scrapes or complicated grep procedures -- however these have been conveniently compiled<br />
elsewhere (25).<br />
Multalin proved to be the most useful online alignment program (22) because it accepts very large input databases, allows arbitrary<br />
display widths, optionally maintains input order, allows character separation and an option to display all residues or only differences<br />
relative to a canonical first sequence.<br />
Bison and yak tRNA variations were evaluated using MitoMap (33), which maintains a complete list of human tRNA mutations and<br />
associated disease, and the curated phylogenetic tRNA dataset Mamit (23). Comparative genomics takes a few twists because<br />
mammalian mitochondrial tRNAs evolve quite rapidly in comparison to nuclear tRNAs. Generalized nucleotide alignment programs<br />
do not reliably place gaps, in part because they do not recognize -- or anchor the alignment to -- reverse complementary stem base<br />
pairs and other non-local constraints. Even if they did, homological (evolutionary descent) alignment may differ from cloverleafbased<br />
structural alignment. Parsing tRNA sequences into standard folding cloverleaf subdomains and reverse-complementing one<br />
member of each stem pair allows a single difference alignment to display all exceptions to stem base pairing. This proved not<br />
indicative of mitochondrial disease because presumptive wildtype mitochondrial tRNAs in many species already show imperfect<br />
base pairing.<br />
Seven methods are used here to classify observed amino acid variation in bison and yak mitochondrial proteins as either dysfunctional,<br />
near-neutral, or potentially adaptive. While non-synonymous SNP interpretation never attains 100% sensitivity and selectivity, the<br />
massive data set of mitochondrial proteins (12,603 sequences in 1,637 mammals utilized for cytochrome b) and relatively slow<br />
evolution (83% identity between bison and platypus) favor reliable interpretation. Prediction accuracy -- as tested on clinically and<br />
biochemically validated human disease alleles -- is very high on the moderate to radical change at conserved sites considered here (31,<br />
32).<br />
1. Validity of the amino acid substitution: the reported change may be an artifact when an older sequencing technology is used or read<br />
coverage is low, when ambient DNA base composition is anomalous or a homopolymer read length error could occur, when toocomplex<br />
a mutation is required to produce the substitution, when ambiguity in base determination occurs elsewhere in the submitted<br />
sequence, when multiple anomalous substitutions are reported within the same animal, when nuclear pseudogenes (numts) and<br />
hybridization with another species are not considered, or when no re-sequencing or raw read reevaluation is reported in the case of a<br />
surprising change in a large population survey of inbred animals.<br />
2. Unique aspects of mitochondrial disease: the inheritance of the mitochondrial genome is quite different from that of nuclear genes<br />
because of heteroplasmy, undercutting decades of assumptions in population genetics (60), challenging the accuracy of that data<br />
(47-49), and here affecting methods for associating amino acid variation with mitochondrial disease:<br />
• Mitochondrial DNA is maternally inherited in bison. The bull may carry mitochondrial mutations or even whole cattle<br />
mitochondria but these do not pass on to descendants (negligible paternal leakage). On the other hand, cattle mitochondrial<br />
DNA from a distant hybridization persists indefinitely without dilution or fragmentation despite subsequent backcrosses to<br />
bison.<br />
• Each maturing bison oocyte has some 260,000 copies of mitochondrial DNA with up to ten copies in a single mitochondrion<br />
(24). These may differ in initial sequence (heteroplasmy) and acquire additional differences over time which are not shuffled<br />
onto composite haplotypes because of the effective absence of recombination.<br />
• Replication occurs unevenly in maturing oocytes as does subsequent stochastic segregation of mitochondria to generations of<br />
daughter cells and later mitochondrial replication in descendent stem cells. Post-natal selection may affect haplotype ratios. A<br />
disease haplotype, initially rare and functionally compensated by healthy haplotypes, can surge either ontogenetically (causing<br />
late disease onset in a somatic cell lineage) or phylogenetically (leading to effective inheritance in descendants and earlier<br />
onset) within a single generation, a haplotype bottleneck effect.<br />
• Bison DNA sequences reported to GenBank do not originate from oocytes but rather from blood, muscle, skin, hair, or<br />
intestinal sloughing. Although heteroplasmy implies these tissues should often contain multiple haplotypes, only one haplotype<br />
per sample has ever been reported for bison, with the rest apparently discarded as sequencing or cloning error. In contrast,<br />
recent careful re-sequencing of a 6,738 year old aurochs established a single heteroplasmic control region site (59).<br />
Consequently bison data does not directly report on oocyte haplotype abundances nor predict disease status of either parent or<br />
descendants. This applies in particular to sporadic mutations reported for a single animal (which could equally be sequence<br />
error, somatic mutation, or heteroplasmic surge). However when a substantial sub-clade with a given set of amino acid<br />
variations is inherited over many generations, that provides evidence for complete oocyte penetration of that haplotype and<br />
conventional inheritance of the amino acid change in all descendants. On the other hand, frameshift and internal stop codon<br />
mutations -- lethal because oxidative phosphorylation is essential -- imply internal compensation by unreported wildtype<br />
haplotypes must be occurring at a significant level given the essentiality of oxidative phosphorylation.
• The mutation rate in mitochondria is some tenfold higher than in chromosomal DNA, often attributed to reactive oxygen<br />
species generated by oxidative phosphorylation, sub-optimal functioning of imported nuclear replication and repair genes or<br />
lack of protective histones (26). Mutational hotspots may also exist because of local base compositional anomalies,<br />
homopolymer run susceptibility or regional propensity to fold into tertiary structures. Despite this, observed recurrent mutation<br />
is rare in protein coding regions: the same amino substitution seldom arises de novo in oocyte DNA, much less rises from low<br />
heteroplasmy status to full heritability, as seen from human mitochondrial disease statistics (27) and the lack of phylogenetic<br />
reoccurrence in unrelated clades despite voluminous data (next section). This implies most observed amino acid substitution in<br />
bison arose from unique events and their presence today in descendants is phylogenetically informative.<br />
• If multiple haplotypes in a population happen to wax and wane across a species divergence, the resulting mitochondrial lineage<br />
sorting could give a quite different phylogenetic tree of that from nuclear genes, an issue compounded by small sampling sizes<br />
chosen for sequencing. Mitochondrial heteroplasmic persistence and resurgence makes the determination -- indeed definition --<br />
of amino acid ancestral state somewhat problematic. It further complicates establishment of the reduced alphabet (set of fully<br />
functional amino acids at a given position) which may drift over time according to clade because of varying co-evolving<br />
residues.<br />
• Functional compensation can occur if single mitochondrion carries multiple haplotypes, one of them wildtype which can arise<br />
via mitochondrial fusion if not initially present. Compensation by a nuclear genes imported into mitochondria may occur in<br />
yeast (28). Non-compensable mitochondria may turn over more rapidly or replicate more slowly (be selected against). These<br />
considerations make it very difficult to predict the impact on oxidative phosphorylation of a deleterious variation in a<br />
mitochondrially encoded protein unless only this haplotype class occurs in the cell and the amino acid substitution is at a site<br />
not physically interacting with or influenced by any nuclear gene product. Cytochrome b resides in the bc1 complex which<br />
involves 11 gene products, all but one nuclear encoded. Thus a bison cytochrome b variation cannot be internally compensated<br />
nor by a secondary variant of ATP6 (or any other mitochondrially encoded protein). Compensation by an altered nuclear gene<br />
could give another form of mitochondrial disease when cross-matched with a conventional bison mitochondrial haplotype.<br />
• Despite these opportunities for compensation, it is rarely observed experimentally except as yeast petite suppressors (billions of<br />
cells plated out under strong selection, bison populations in the thousands). Mitochondrial disease is surprisingly common in<br />
species far less inbred than bison:<br />
“One in 4000 individuals is at risk of developing a mitochondrial disease sometime in their lifetime. Half of those<br />
affected are children who show symptoms before age five, and approximately 80% of them will die before age 20.<br />
The mortality rate is roughly that of cancer... The mutation rate of the mitochondrial genome is 10–20 times<br />
greater than of nuclear DNA, and mtDNA is more prone to oxidative damage than is nuclear DNA. Mutations in<br />
human mtDNA cause premature aging, severe neuromuscular pathologies and maternally inherited metabolic<br />
diseases, and influence apoptosis (29)." [WC Copeland: Chief, Laboratory of Molecular Genetics, NIH]<br />
3. Physical-chemical nature of amino acid change: statistics drawn from millions of amino acid changes studied over the last sixty<br />
years (30) in conjunction with in vitro assessment of the resulting protein and correlation to clinical disease status show mild<br />
changes in properties such as hydrophobicity, polarity, charge, aromaticity, branched side chains, hydrogen-bonding and disulfide<br />
capacity, and beta sheet, 3-10 turn or alpha helix forming or ending propensity are vastly less probable to give rise to dysfunctional<br />
protein than radical substitutions. This conservatism is reflected in mitochondrial genetic code in that the most common form of<br />
mutation often give no change at all (synonymy) or cause a mild change (same cell, row or column). The risk that substitutions<br />
cause protein dysfunction can be quantitated by Grantham distances, Blosum matrices, or the more recent SIFT and PolyPhen2<br />
algorithms used in part here (31). The latter relies on a curated protein sequence and structural data set covering only a small<br />
fraction of available GenBank data and that out of phylogenetic tree topological context (e.g. sea urchin proteins are not equally<br />
relevant as cow to bison).<br />
4. Comparative genomics: amino acids vary greatly in their tolerance of substitutions according to site position within the protein and<br />
its importance to function, correlating with selective pressure to maintain it. Should a peptide containing the residue be posttranslationally<br />
removed and degraded, there may be no constraints whatsoever provided by the physical-chemical nature of the<br />
substitution. At the other extreme, a residue critical to an enzyme active site tolerates no change at all over trillions of years of<br />
observable branch length. Most site positions are intermediate, allowing mild change as defined by a restricted alphabet specific to<br />
that site via comparative genomic alignment, along the lines of phylogenetic tree-aware TreeSAAP (32). Most nsSNPs involve a<br />
single nucleotide change with transitions predominating over transversions. If an amino acid change -- mild or not -- is a mere<br />
transition away from a conserved residue yet never observed in thousands of species despite a high mutation rate, it likely has arisen<br />
numerous times but never attained a foothold because selective pressure eliminated it (when drift alone did not), even as other<br />
reduced alphabet changes did get fixed in the same protein. Homoplasic recurrence of the change elsewhere in mammals are<br />
detected here via clade pattern analysis: if the change does occur uncommonly elsewhere, are these concentrated in sub-clades<br />
(indicating persistence and so fitness for reduced alphabet) or scattered randomly in the taxonomic sense (indicting unfixed recurrent<br />
mutation). This sharpening provided by clade pattern analysis -- quantitated by supportive branch length summing -- becomes<br />
critical as the amount of data becomes astronomical. Although moderate frequency of a polymorphism is sometimes used in medical<br />
genomics to argue against deleterious nature, that is not applicable here because of the founder effect and subsequent inbreeding in
ison, in effect making them the counterpart of a inherited disease pedigree; allele frequency is in fact extremely low when taken in<br />
the comparative genomics sense.<br />
5. Protein structure: amino acid changes can be placed within a high resolution x-ray structure of a homologous protein (or domain)<br />
when available at PDB. No such data is directly available for bison or yak proteins, but quite commonly for cattle. In such cases, it<br />
may be possible to interpret the structural significance of a substitution in terms of correct folding, protein stability, interactions with<br />
other residues in the same or hetero-oligomeric partners and evaluate in silico the impact of the substitution on stability energetics<br />
by molecular dynamics simulations. High sequence conservation (bison to cow) and extreme fold conservation allows reliable<br />
annotation transfer. Surprisingly few of the thirteen mitochondrially encoded proteins have any match whatsoever (Blastp against<br />
PDB), cytochrome b and cytochrome oxidase components being the exceptions. The latter are irrelevant because no bison variation<br />
occurs in them (next section). The best match of bison ATP6 -- to the E. coli crystallographic structure 1C17 -- is uninformative<br />
because of excessive divergence.<br />
6. Orthologous disease transfer: a comparable allele to a bison variation may have been previously studied in human mitochondrial<br />
disease with direct biochemical and clinical assessment of disease phenotype. The outcome of thousands of such studies are<br />
tabulated at the MitoMap web site (33). Additional data from veterinarian studies of mitochondrial disease is compiled at OMIA<br />
(34). The bison alleles considered here do not have exact counterparts. Even if they did, divergence elsewhere in the primary<br />
sequence would preclude direct interpretative transfer. However the bison variant V98A of cytochrome b corresponds in<br />
orthologous position to canine V98M. Affected Shetland sheepdogs have significant mitochondrial disease (35). Since alanine is a<br />
more extreme substitution than methionine for branched chain aliphatic valine, V98A bison are predicted to be similarly impaired.<br />
Unlike nuclear genes, the many hundreds of known human mitochondrial disease alleles -- dispersed over 13 different proteins and<br />
22 tRNAs -- all present with related phenotypes despite different nomenclatures such as lactic acidosis, cardiomyopathy, exercise<br />
intolerance. The outcome of all mutations is the same: impaired oxidative phosphorylation. This is the case for all 21 human disease<br />
alleles of ATP6 (33), none of which correspond to position 60 of bison I60N. However specifics of human disease manifestation<br />
vary because of heteroplasmy -- different cell lineages affected at different stages of development, altering location and age of<br />
disease onset (29). Putative disease alleles in bison need direct biochemical validation; that could be provided rom bison muscle<br />
biopsies bythe same laboratories that routinely evaluate human mitochondria (35).<br />
7. Experimental model systems: yeast and hamster cell lines provide surprisingly relevant model systems (28, 37-39). Mutant alleles of<br />
human genes are knocked into the nucleus, suitably altered to use the nuclear gene translation table and carry mitochondrial<br />
targeting signals, with mitochondrial transcription of the competing homolog knocked down by ethidium bromide. This results in a<br />
heterologous oxidative phosphorylation system (allotopic expression) of one human protein interacting with 12 mitochondrial and<br />
many nuclear proteins from the other species. Because little has changed in oxidative phosphorylation over the last billion years,<br />
this characterizes structural and functional attributes of known mutations despite heterologous protein-protein interactions. The<br />
yeast or hamster system could be adapted to specifically study the effect of mutations in bison mitochondrial proteins to supplement<br />
strictly bioinformatic methods reported here.<br />
8. The accuracy of SNP interpretation is high but still imperfect. The rate of false positives is routinely estimated by blinded prediction<br />
of allele status of intensively studied human genes such as hemoglobin, cystic fibrosis, and rhodopsin where large numbers of<br />
variants from patients, controls and large scale SNP surveys have been clinically evaluated (31 and references therein). Accuracy<br />
can exceed 90%, with errors overwhelmingly concentrated in borderline changes in amino acid physical-chemical properties (32).<br />
Methods used here on bison V98A and I60N were validated using unblinded test suite of known pathogenetic mutations in human<br />
cytochrome b and ATP6 (51). In the special case here of two significant but not catastrophic changes in two mitochondrial proteins<br />
in different non-complementing oxidative phosphorylation complexes with demonstrated heritability (low or no wildtype<br />
heteroplasmy), prediction accuracy in the mitochondrial disease setting can be conservatively estimated as the complement of the<br />
probability of both being innocuous: 1- (1 - 0.85)(1 - 0.85) = 98%.<br />
9. Fossil bison DNA represents an important control because animals operating under the full force of natural selection are not<br />
expected to exhibit high levels of deleterious alleles. Here 44 fossil bison control region sequences are available at GenBank (17).<br />
Note these have widely variable Holocene dates and do not represent a population sample in the sense of contemporary bison data.<br />
Results<br />
Bison sequencing effort initially focused on control region polymorphisms, homopolymer run lengths (microsatellites), and<br />
determination of base at primarily intergenic SNPs (43), data perhaps relevant to overall genetic diversity and past hybridization but<br />
not to proper functioning of the 20,000-odd nuclear and mitochondrial genes where the bison genetic burden can be expected to be<br />
far worse than in less inbred species which are already serious enough (10). Steppe bison could be helpful here but only the last 33<br />
bp of tRNA Pro are available (eg AY748559). Since the entire tRNA pro is identical in all bison and yak, the observed 100% identity<br />
of steppe bison comes as no surprise. There is additional sporadic variation but this probably arises from dna damage that affects<br />
sequencing accuracy.<br />
However new population-level sequencing of yak (40-42) and bison whole mitochondrial genomes (2) now makes it feasible to<br />
search for mitochondrial disease in these species. Indeed, Douglas and coworkers note an alarming number of anomalies and the
possibility of mitochondrial dysfunction in bison (2), no surprise given the historic bison bottleneck, subsequent inbreeding in small<br />
founder herds, restriction of gene flow between herds, and decades of unnatural selection (3,7) given the high incidence of<br />
mitochondrial disease in other mammals (29, 50).<br />
Here, variation in all 13 mitochondrially encoded proteins and 22 tRNAs in all published bison and yak mitochondrial genomes<br />
(Table 1) was collected and evaluated by comparative genomics and comparison to human mutational databases (see methods<br />
section). Extensive data both from bison and yak and their immediate outgroups (wild cattle, water buffalo) proved necessary to sort<br />
out sporadic private variation affecting individual animals from variation affecting whole subclades and to assign synapomorphies<br />
(derived characters relative to ancestral state) to the appropriate lineage using the known ruminant phylogenetic tree (43).<br />
Thus a variation in bison with respect to cattle is not a bison mutation issue if yak and water buffalo outgroups are in concordance<br />
with bison but instead the ancestral value. Should only yak support bison, again the variation is not plausibly a mutation because of<br />
fixation and persistence over millions of years in the face of natural selection but better viewed as a shared synapomorphy of these<br />
sister taxa.<br />
As a byproduct of this investigation, informative synapomorphies of Bos taurus were found shared in every case by all other species<br />
of wild cattle (Tables 1, 2), establishing that neither banteng (Bos javanicus) or gaur (Bos gaurus) should be allied with bison + yak<br />
in contrast to a weakly supported outcome from a nuclear bead chip SNP array (43). It is not at all unusual for nuclear and<br />
mitochondrial phylogenies to differ. Using the latter, the taxonomic incongruity of yak nomenclature (Bos grunniens sistered to<br />
Bison bison) is easily remedied by a change to Bison grunniens (or Poephagus grunniens). Note that the divergence of bison and<br />
cattle exceeds that of bison and yak, taken as 2.5 myr after reviewing fossil evidence and prior estimates (40), so distinction by<br />
genus is warranted both by time of divergence and extent of accrued divergence.<br />
Mitochondrial disease can results from tRNA mutations (33) through inefficient or incorrect production of mitochondrial proteins<br />
with clinical symptoms variable but ultimately similar to protein mitochondrial disease as both affect oxidative phosphorylation.<br />
Bison and yak tRNAs differed at 11 sites in 9 tRNAs though Pro, Trp, Ile, Leu (CUN), and Arg tRNAs were conserved in the 102<br />
mitochondrial genomes considered (51). None of the tRNA substitutions had an exact counterpart to any linked to human<br />
mitochondrial disease; the degree of overall sequence divergence is too high in many cases for reliable annotation transfer.<br />
Bison have no tRNA changes that track with sub-clades, only private alleles (51). None of these affect the anti-codon loop or other<br />
strongly conserved domains, disfavoring the errant nuclear gene hyper-mutagenizing scenario (46). Analysis of a manually curated<br />
alignment of 127 species including yak and 41 other cetartiodactyls shows high natural variability at all of the affected sites,<br />
suggesting the substitutions may be innocuous or nearly so. Thus tRNA alleles have no implications for bison conservation genomics<br />
management (51).<br />
Sporadic amino acid mutations are not heritable if they represent somatic mutation, tissue-specific surge in heteroplasmic abundance<br />
of a haplotype not significantly represented in their own oocytes or occur in a bull. These have little significance for herd<br />
conservation genomics management in contrast to deleterious variations observed in multiple animals (which rules out sequencing<br />
error and a sub-dominant heteroplasmy ratio). Consequently amino acid variants observed in single bison are considered further in<br />
supplemental material (51).<br />
Eight of the thirteen bison mitochondrially encoded proteins lack non-sporadic coding variation in the 33 complete bison genomes<br />
available, namely COX1-3, ND1-3, ND4L and ND6. Yak are similar with subclade level variation in ND1, ND3, ND6, COX1,<br />
COX3 and ATP8. These results accord with the relative conservation of these mitochondrial proteins within mammals (44, 45) and<br />
are again inconsistent with an errant imported hyper-mutating nuclear gene such as POLG replicase being the source of<br />
mitochondrial proteome variation (46).<br />
However 8 sites in the remaining 5 bison proteins (9 in 7 yak proteins) do represent heritable nsSNP variation that cannot be<br />
explained as sequence error, somatic mutation or heteroplasmy artifact (Tables 3, 4). The nine approaches described in the methods<br />
section were applied in turn to each variant to distinguish between inconsequential neutral drift within the phylogenetically<br />
acceptable range of the site (reduced alphabet wobble), a derived adaptive shift, and structurally deleterious changes at the protein<br />
level.<br />
These latter are not necessarily maladaptive because they could reflect balanced polymorphisms (eg malarial disease resistance of<br />
heterozygous sickle cell hemoglobin E6V nuclear gene (30), corresponding to a persistent heteroplasmy ratio in mitochondrial<br />
genes) or be fully compensated by co-evolving amino acid residues within the same protein or one that interacts with it (as seen for<br />
oxidative phosphorylation in yeast suppressors of the petite phenotype). These possibilities must be considered in evaluating a<br />
structurally deleterious substitution for mitochondrial disease.<br />
The two strongest candidates for mitochondrial disease in bison are V98A in the CYTB gene (cytochrome b) and I60N in ATP6<br />
(ATP synthase Fo component). These are systematically evaluated below using nine quasi-independent methods.
Neither variant can be explained by sequencing error. Both are observed in 17 whole genome determinations and targeted partial<br />
sequences from different laboratories. Neither occurs in a compositionally or structurally anomalous region that might be prone to<br />
repeated independent sequence error. Both are one-step base changes, the most common type of mitochondrial mutation.<br />
Because both are observed in multiple animals in physically separated herds, neither somatic mutation nor heteroplasmy ratio surging<br />
are likely explanations. Despite high read coverage with modern sequencing technology, no heteroplasmy was reported even<br />
subsequent to enhanced awareness following its discovery in aurochsen (59). Although clearly heritable as the dominant heteroplasmic<br />
haplotype, no descendent genealogies have been directly studied: a heteroplasmy contribution from residual co-existing wildtype<br />
haplotypes may continue, with current limits of detection sensitivity being about 5% (46). Mitochondrial disease still results in humans<br />
in the heteroplasmic state (27, 29).<br />
Both V98A and I60N represent potentially significant changes in the physical-chemical nature of the substituted amino acid not<br />
commonly found accepted in statistical compilations of observed amino acid changes. Valine and isoleucine are branched chain<br />
aliphatic residues with bulky hydrophobic side chains, typically deeply shielded in the interior of proteins (or as transmembrane<br />
regions) from the aqueous milieu. The side chain of alanine consists of a single small methyl substituent, that of asparagine is larger<br />
but strongly polar and hydrogen bonding. As substitutions, these are energetically unfavorable in typical proteins with the former<br />
leaving an unfilled hole and the latter disengaging a polar component from hydrogen-bonding solvent.<br />
The site-specific context can strongly refine evaluation by the physical-chemical nature of the change alone -- not all residues operate<br />
under the same evolutionary constraints. Table 5 shows the outcome of very large scale comparative genomics alignment, made<br />
possible by thousands of GenBank entries for phylogenetically close-in mitochondrial proteins. Neither alanine or asparagine has any<br />
place in the normal reduced alphabet at these sites in any species -- despite the fact that both are just a simple base change away from<br />
the original amino acid and would not only have arisen frequently but also been fixed in some species as were changes to bona fide<br />
reduced alphabet elements in the same or flanking amino acids. Billions of years of branch length are sampled by the data.<br />
Exceptions inevitably arise in massive data sets as allele frequencies sampled drop below 0.1%, matching sequence error rates<br />
especially for older data. Those exceptions can be objectively evaluated by examining their taxonomic coherence. In the case of both<br />
V98A and I60N, the exceptions are phylogenetically scattered (51) and do not form subclades indicative of acceptance into that<br />
subclade’s local reduced alphabet. These exceptions could instead represent somatic mutation, heteroplasmy sampling effects, or even<br />
an independent reoccurrence of the mutation seen in bison. All of these are expected at some level given the high incidence of<br />
mitochondrial disease reported from human (11).<br />
As a further control to other variant loci of bison and yak (51), variation relative to cattle mitochondrial genomes was assessed in all<br />
13 mitochondrially encoded proteins of a Holocene aurochs sequenced at heteroplasmy depth (59). Here A23T in cytochrome b, T90I<br />
in ND5 and V55L in ND4 initially appear anomalous. However upon large-scale alignment within ruminants, all three changes are<br />
both common and taxonomic sub-clade coherent (51). This leaves no candidate loci for mitochondrial disease in the thirteen proteins<br />
of this aurochs.<br />
In terms of structural impacts of the two bison amino acid substitutions, ATP6 and cytochrome b act in different structural complexes,<br />
namely the F1FO ATP synthase and complex III. These do not physically interact, implying that I60N and V98A cannot induce crosscompensatory<br />
change. Their effects on decreased ATP production could be additive or alternatively one mutation be rate limiting<br />
rendering the other moot.<br />
ATP6, like many multi-pass membrane proteins, does not have a satisfactory crystallographic structural determination. To locate I60N<br />
within the tertiary structure, it is currently necessary to use E. coli PDB model 1C17 for bison, even though the alignment is quite<br />
weak overall at 27% identity and does not extend informatively to the I60N site (Table 6A). The corresponding residue, position 108,<br />
lies within the second transmembrane helix (56). However this is not consistent with secondary structure of mammalian orthologs.<br />
The secondary structure analysis of yak ATP6 (SwissProt accession Q7YCA5) shows I60N is located in a loop region connecting the<br />
first two transmembrane helices as it does in cattle (accession P00847). The yak protein is 97% identical to bison and has the expected<br />
wildtype value isoleucine at position 60. Other secondary structure prediction tools give the same result (data not shown).<br />
Conservation within the primary sequence may have structural implications, for example periodic conservation of 3 or 4 residues<br />
suggests an alpha helix with one side constrained. However phylogenetic conservation of a 5 residue window on each side of I60N<br />
does not show a clear pattern (Table 6B). Several the residues have broad reduced alphabets while others are near-invariant. Proline, a<br />
helix-breaker, occurs at position 63 in the bison protein. Thus the structural implications of asparagine at position 60, which arises<br />
from from wildtype valine via a T --> A transversion, cannot be determined, though it is clearly a radical substitution (branched<br />
aliphatic hydrophobic to polar) in terms of the constraints of this site, not being seen in 1635 other mammalian ATP6 sequences<br />
despite numerous substitutions in position 60 and nearby residues gaining traction.<br />
The structural effect of V98A on bison cytochrome b can be assessed using the available high resolution data for the orthologous<br />
bovine complex (57). V98 occurs at the end of transmembrane helix B, sandwiched between six strongly conserved residues. The<br />
preceding residue, H97, is one of two critical axial histidine ligands to the high-potential heme. Two residues later, a strictly invariant
arginine R100 provides an essential salt bridge to a buried proprionate side chain of this same heme. Structural models of this region,<br />
adapted from previous publications (57, 58), are shown in Figure 1.<br />
An alignment of 5000 cytochrome b sequences establishes that 99.6% of mammalian species have valine or isoleucine (and less<br />
commonly methionine). This cannot be because opportunities for fixation of substitutions are rare -- 18 of the 20 possible amino acids<br />
occur at position 62 of ATP6. V98A arises from a simple T to C transition. Thus strong selective pressure enforces the restriction to<br />
isoleucine and valine here.<br />
A structural perturbation of the histidine axial ligand might change heme redox potential (optimized for the respiratory chain long<br />
ago); disruption of the proprionate salt bridge could affect folding, overall thermodynamic stability or production of reactive oxygen<br />
species. Thus it is no surprise that position 98 is under strong selection -- but why isoleucine and valine and no others?<br />
The explanation lies in the post-beta carbon side chain, not the alpha carbon or peptide bond -- any amino acid provides these. A beta<br />
carbon alone cannot suffice -- in that case glycine and proline might be excluded from the reduced alphabet but nothing else. The side<br />
chain of alanine, the bison mutation under consideration, consists of just a methyl group. Here the complete absence of observed<br />
leucine at position 98 (Table 5) is informative because like isoleucine and valine, it is a branched chain aliphatic amino acid more<br />
similar than alanine. However the branching comes later, at the gamma carbon. This rules out insertion in the hydrophobic membrane<br />
milieu because leucine could do that equally well. Similarly phenylalanine, tryptophan and tyrosine do not occur at position 98,<br />
establishing the hydrophobicity, while necessary, is not sufficient. The reduced alphabet then consists of only isoleucine and valine<br />
because the constraint is a packing issue in a hydrophobic environment. Alanine is functionally unacceptable because it leaves a<br />
packing void that is energetically unfavorable to protein folding, stability or functionality at the axial or proprionate ligands (57).<br />
Mutations at orthologous sites known to cause (or not) mitochondrial disease in other species can be informative, even though<br />
sequence divergence elsewhere in the protein means results cannot be literally carried over to bison. However establishment of<br />
pathogenicity and its clinical manifestation are still useful because bison are inconvenient to study in a veterinary context.<br />
In the case of V98A in bison cytochrome b, a very similar mutation V98M causing severe mitochondrial disease has been studied in<br />
dog (35). A human polymorphism V98L was found in a large scale SNP survey but the individual’s disease status (if any) was not<br />
determined. Mutations at fourteen other positions have been documented (27) for human cytochrome b, producing exercise intolerance<br />
(S35P, S151P, G290D), cardiac or skeletal muscle myopathy (G34S, G251S, N255H, G339E, multi-system disorder (Y278C), neonatal<br />
polyvisceral failure (S279P), and optic neuropathy from swollen ganglia (A29T, D171N, V356M). These are still relevant to bison<br />
V98A because at some level all mitochondrial disease affects the same process (cellular energy production via oxidative<br />
phosphorylation).<br />
Another 125 human amino acid changing polymorphism of cytochrome b have been detected but rarely is a disease association ruled<br />
out. This is unfortunate because changes proven to be neutral could supplement the test suite provided by known pathogenetic<br />
mutations and allow double blinded assessment of prediction accuracy statistics. Lacking that, the first site occurrence in each<br />
phenotypic class (S35P, G34S, Y278C, S279P, and A29T), studied along with ATP6 described below by the same methods used here to<br />
assess bison V98A, all classified as pathogenic (51).<br />
In the case of bison I60N in the ATP6 protein, no other mammal has a known pathogenic mutation or neutral polymorphism at position<br />
60. However pathogenic human mutations are known at twenty sites along the protein. Three sites were selected for addition to the<br />
methods test suite, H90Y, L156P, and L220P to represent exercise fatigue alleles (50). The reported symptoms have an uncanny<br />
similarity to those of cytochrome b (which resides in a separate protein complex not interacting with ATP6): exercise endurance,<br />
muscle weakness, ataxia, lactic acidemia, optic neuropathy, and so forth (27). Thus the phenotype for bison I60N would likely be<br />
similar to these and indeed to V98A.<br />
Experimental model systems allow biochemical testing of specific mutations. These are applicable to bison but have not yet been<br />
applied to the specific sites considered here. However five cytochrome b sites pathogenic in human have been tested in allotopic yeast,<br />
including two causing exercise intolerance (S151P, G290D) and one causing skeletal muscle myopathy (G34S). These gave results<br />
concordant with clinical expectations despite the great divergence of human and yeast but more importantly give insight into the<br />
specific chain of events leading to protein malfunction, for example failure to assembly into a respiratory sub-complex. The human<br />
ATP6 mutation L156P brings about a 45% reduction in ATP production relative to controls (53); L217P also had reduced ATP<br />
production though normal coupling efficiencies (54). Hamster cell lines offer less sequence mismatch; an allotopic system there has<br />
evaluated L156R in ATP6x (55). These studies indicate that bison mutations V98A and I60N could reduce mitochondrial ATP<br />
production by a wide variety of mechanisms. Together in the same haplotype, these could be additive, synergistic, or one site be rate<br />
limiting and the other irrelevant in the combination. Even with a low level of residual wildtype heteroplasmy, ATP production would<br />
still be lowered (53).<br />
The prevalence of bison haplotypes hosting V98A / I60N is not directly known, other than from the 32 complete whole genomes<br />
sequenced and fragmentary cytochrome b (and many fewer ATP6) sequences. Researchers have not generally specified whether<br />
bison were chosen at random for sequencing nor indicated familial relationships or even gender. Sample sizes are quite small relative<br />
to herd size. With older samples, the bison would not still be alive. It is thus problematic to extrapolate to overall incidence in North<br />
American conservation herds at this time.
However a great deal of bison control region data exists. While not directly extendable to the coding regions of interest, the<br />
haplotype class defined by the control region can be mapped into the new global haplotype classes defined by whole genome<br />
sequencing (2). This mapping is necessarily ambiguous (one to many) given changes outside the control region are not observed and<br />
the full set of global haplotypes might not yet be known.<br />
However the five global haplotypes containing the V98A / I60N double feature, namely Bhap2, Bhap8, Bhap10, Bhap11, and<br />
Bhap17 in earlier terminology (2) are very similar to each other overall according to all-vs-all Blastn (Table 7), identical in the<br />
control region fragment commonly sequenced and reliably distinguished there from the other known global haplotypes by conserved<br />
diagnostic residues within positions 15894-15965 of the Yellowstone bison GU947004 (Table 8).<br />
Thus under the assumption that the control region alone serve as a satisfactory proxy to positions 98 of CYTB and 60 of ATP6, the<br />
status of an additional 133 bison (44 of them fossil, only two with potential V98A I60N) can be inferred from GenBank data.<br />
Gardipee determined haplotypes for 179 additional bison in a 2006 masters thesis (21). The data for contemporary are combined into<br />
an overall estimate of 145 bison with the V98A / I60N haplotype and 34 without in Table 8 and Table 9. All 29 bison sequenced from<br />
Grand Tetons National Park carry the deleterious allele, as do 117 of 151 bison tested from Yellowstone (72%). Rates are much<br />
lower in overall bison data (42%, Table 7) and were a few percent at most in fossil bison.<br />
The two fossil bison at issue may carry either, both or neither of V98A I60N assuming the double haplotype arose in sequential steps<br />
over time. These bison, dated to 170 (Anchorage AY748509) and 3250 years ago (Natural Trap Cave, Wyoming AY748518) are<br />
priority targets for re-sequencing as they could reflect intermediate stages in the development of the disease haplotype. Steppe bison<br />
control region sequences are available (17) but not easily mapped to bison haplotypes. Here too it would be valuable to sequence<br />
entire mitochondrial genomes.<br />
Discussion<br />
Applying the nine methods for evaluating amino acid substitutions, observed bison protein variants V98A and I60N are both<br />
predicted to have significantly sub-optimal energy production from oxidative phosphorylation. Two mutations acting synergistically<br />
in the same heritable haplotype strengthens the conclusion that affected bison have mitochondrial disease to an estimated 98%<br />
confidence (see methods). Biochemical verification of reduced ATP production by allotropic knock-in and standard laboratory<br />
protocols is important and feasible (36).<br />
Mitochondrial disease is common in humans so it comes as no great surprise to find another species affected by it. The alarming<br />
frequency of occurrence in bison can be attributed (3, 7) to the severe bison bottleneck of the nineteenth century followed decades of<br />
inbreeding and suppression of natural selection. Mitochondrial disease in dog breeds has a similar history (35).<br />
Based on the available evidence, the disease haplotype was uncommon in pre-contact bison but widespread today, affecting bison in<br />
numerous discrete herds including Yellowstone and Grand Tetons national parks. Ironically, Yellowstone bison are used to found<br />
new herds and improve genetics of existing herds.<br />
While symptoms of mitochondrial disease vary somewhat according to the specific mutation, the common denominator is inadequate<br />
ATP production from loss of oxidative phosphorylation capacity. Exercise intolerance, lactic acid buildup in blood, and ragged red<br />
muscle fiber can be expected in affected bison (2, 27). While not lethal at birth, these bison may be significantly impaired in escape<br />
from predators, winter cold tolerance, brushing snow aside for feeding, combat for breeding opportunities and similar aerobic<br />
activities.<br />
If the goal in bison management is restoration of pre-contact genomics (1), then mutations in the mitochondrial genome need more<br />
extensive survey sequencing, direct biochemical and behavioral evaluation, genetic testing prior to culls and introductions to other<br />
herds and similar consideration of disease alleles in the companion nuclear genome. The nuclear genome may carry valuable genetic<br />
diversity (even in an animal with mitochondrial disease) but may also have very substantial genetic disease issues of its own (10).<br />
To date, genetic management of bison conservation herds has largely eliminated bovine mitochondrial DNA introduced a century<br />
ago in hybridization experiments. Bison mitochondrial disease could also be managed away with retention of nuclear genetic<br />
diversity since only the latter is passed on by bulls. However this is not occurring with the present system of quasi-random culls of<br />
animals of unknown genetic status.<br />
The present emphasis on genetically pure herds may be a misplaced priority if genetic disease is widespread in both nuclear and<br />
mitochondrial genomes of non-introgressed herds. Indeed, based on time of divergence and sequenced genomes from related<br />
laurasiatheres, the pre-contact bison genome will be 99% identical to nineteenth century cattle. These changes will be<br />
overwhelmingly concentrated in intergenic and intronic gene deserts and in synonymous sites in coding exons, with amino acid<br />
change primarily at intrinsically variable inconsequential sites (52). Thus a bison nuclear proteome, briefly introgressed by an<br />
introduced cow in 1900 and diluted for the subsequent century (7) will not exhibit a single significant change in a typical protein of<br />
450 residues relative to a pre-contact bison, the real issue being exacerbation of the formerly heterozygous genetic burden by
inbreeding, small herd sizes and genetically uninformed culls. Mildly introgressed animals may preserve important and authentic<br />
pre-contact genetic diversity no longer otherwise represented in extant pure bison.<br />
Acknowledgements and Disclosures<br />
I thank the UCSC Genomics Group (Hiram Clawson) for software support, Evim Foundation for logistical support and Sperling<br />
Foundation for financial support under grant 2010.GNTCS.012. No animals were subjected to invasive procedures, harassed, tagged,<br />
sampled, corralled or treated; no tissue samples were collected and no cell lines used forthis study. All software algorithms are<br />
available free online at the indicated links. The author has no commercial interests in bison or yak management and no conflicts to<br />
disclose.<br />
References<br />
1. Marris E. Conservation: The genome of the American West. Nature 2009 Feb19;457(7232):950-2. Abstract<br />
2. Douglas KC, Halbert ND et al. Complete mitochondrial DNA sequence analysis of Bison bison and bison-cattle hybrids: function<br />
and phylogeny. Mitochondrion 2011 Jan;11(1):166-75. Abstract<br />
3. Hedrick PW. Conservation genetics and North American bison (Bison bison). JHered 2009 Jul-Aug;100(4):411-20. Abstract<br />
4. Johnson WE, Onorato DP et al. Genetic restoration of the Florida panther. Science 2010 Sep24;329(5999):1641-5. Abstract<br />
5. Saylor R, Shipley L Considering the possible extinction of the Columbia Basin pygmy rabbit. WSU Investigators Report 2004 Jan:<br />
1-6. Pdf<br />
6. McCallum H, Jones M et al. Transmission dynamics of Tasmanian devil facial tumor disease may lead to disease-induced<br />
extinction. Ecology 2009 Dec;90(12):3379-92. Abstract<br />
7. Hedrick PW. Cattle ancestry in bison: explanations for higher mtDNA than autosomal ancestry. Mol Ecol 2010 Aug;19(16):<br />
3328-35. Abstract<br />
8. Halbert ND, Derr JN. A comprehensive evaluation of cattle introgression into US federal bison herds. J Hered 2007 Jan-Feb;98(1):<br />
1-12. Abstract<br />
9. Geist V. Phantom Subspecies: The Wood Bison (Bison bison athabascae Rhoads 1897) is not a valid taxon, but an ecotype. Arctic<br />
1991 Dec;44(4):283-300. Pdf<br />
10. Durbin RM, Abecasis GR et al. A map of human genome variation from population-scale sequencing. Nature 2010 Oct28;467<br />
(7319):1061-73. Abstract<br />
11. Cree LM, Samuels DC et al. The inheritance of pathogenic mitochondrial DNA mutations. Biochim Biophys Acta 2009 Dec;1792<br />
(12):1097-102. Abstract<br />
12. Miller W, Rosenbloom K et al. 28-way vertebrate alignment and conservation track in the UCSC Genome Browser. GenomeRes<br />
2007 Dec;17(12):1797-808. Abstract<br />
13. Zimin AV, Delcher AL et al. A whole-genome assembly of the domestic cow, Bos taurus. Genome Biol 2009 10(4):R42. Abstract<br />
14. Liu Y, Qin X et al. Bos taurus genome assembly. BMC Genomics 2009 Apr 24;10:180. Abstract<br />
15. Genome 10K Community of Scientists Genome 10K: a proposal to obtain whole-genome sequence for 10,000 vertebrate specie. J<br />
Hered 2009 Nov-Dec;100(6):659-74. Abstract<br />
16. Shen YY, Shi P et al. Relaxation of selective constraints on avian mitochondrial DNA following the degeneration of flight ability.<br />
Genome Res 2009 Oct;19(10):1760-5. Abstract<br />
17. Shapiro B, <strong>Dr</strong>ummond AJ et al. Rise and fall of the Beringian steppe bison. Science 2004 Nov 26;306(5701):1561-5. Abstract<br />
18. Axelsson E, Willerslev E et al. The effect of ancient DNA damage on inferences of demographic histories. Mol Biol Evol 2008<br />
Oct;25(10):2181-7. Abstract<br />
19. Rambaut A, Ho SY et al. Accommodating the effect of ancient DNA damage on inferences of demographic histories. Mol Biol<br />
Evol 2009 Feb;26(2):245-8. Abstract
20. Zuzula GD, MacKay M et al. A late Pleistocene steppe bison (Bison priscus) partial from Tsiigehtchic, Northwest Territories,<br />
Canada. Quaternary Science Reviews 2009 28;2734–2742. Pdf<br />
21. Gardipee MF. Development of fecal dna sampling methods to assess genetic population structure of Greater Yellowstone bison.<br />
University of Montana 2007 MS thesis. Pdf<br />
22. Corpet F Multiple sequence alignment with hierarchical clustering. NucleicAcids Res 1988 Nov 25;16(22):10881-90. Abstract<br />
23. Pütz J, Dupuis B et al. Mamit-tRNA, a database of mammalian mitochondrial tRNA primary and secondary structures. RNA 2007<br />
Aug;13(8):1184-90. Abstract<br />
24. Michaels GS, Hauswirth WW et al. Mitochondrial DNA copy number in bovine oocytes and somatic cells. Dev Biol 1982 Nov;94<br />
(1):246-51. Abstract<br />
25. Helm M, Brulé H et al. Search for characteristic structural features of mammalian mitochondrial tRNAs. RNA 2000 Oct;6(10):<br />
1356-79. Abstract<br />
26. Zhao H, Jie S et al. Length heteroplasmies in human mitochondrial DNA control regions and breast cancer risk. Int J Mol<br />
Epidemiol Genet 2010;1(3):184-192. Pdf<br />
27. Brandon MC, Lott MT et al. MITOMAP: a human mitochondrial genome database--2004 update. Nucleic Acids Res. 2005 Jan<br />
1;33:D611-3. Abstract<br />
28. Steinmetz LM, Curt Scharfe. Systematic screen for human disease genes in yeast. Nat Genet. 2002 Aug;31(4):400-4. Abstract<br />
29. Copeland WC. Mitochondrial DNA Replication Group: Mitochondrial Genetic Diseases. NIEHS NIH 2011 Jan. Html<br />
30. Ingram VM. The chemical difference between normal and sickle cell haemoglobins. Biochim Biophys Acta 1959 Dec;36:402-11.<br />
Abstract<br />
31. Adzhubei IA, Schmidt S et al. A method and server for predicting damaging missense mutations. Nat Methods 2010 Apr;7(4):<br />
248-9. Abstract<br />
32. McClellan DA, Ellison DD. Assessing and improving the accuracy of detecting protein adaptation with the TreeSAAP analytical<br />
software. Int J Bioinform Res Appl. 2010;6(2):120-33. Abstract<br />
33. MitoMap Html<br />
34. Sayers EW, Barrett T et al. Database resources of the National Center for Biotechnology Information. Nucleic Acids Res. 2011 Jan;<br />
39:D38-51. Abstract<br />
35. Li FY, Cuddon PA et al. Canine spongiform leukoencephalomyelopathy is associated with a missense mutation in cytochrome b.<br />
Neurobiol Dis. 2006 Jan;21(1):35-42. Abstract<br />
36. Giulivi C, Zhang YF et al. Mitochondrial dysfunction in autism. JAMA 2010 Dec 1;304(21):2389-96. Abstract<br />
37. Zullo SJ, Parks W Tet al. Stable transformation of CHO Cells and human NARP cybrids following transfer of ATPase6 gene to the<br />
nuclear genome. Rejuvenation Res. 2005 Spring;8(1):18-28. Abstract<br />
38. Hao HX, Rutter J. Revealing human disease genes through analysis of the yeast mitochondrial proteome. Cell Cycle. 2009 Dec<br />
15;8(24):4007-8. Abstract<br />
39. Perocchi F, Mancera E et al. Systematic screens for human disease genes, from yeast to human and back. Mol Biosyst. 2008 Jan;4<br />
(1):18-29. Abstract<br />
40. Wang Z, Shen X et al. Phylogeographical analyses of domestic and wild yaks based on mitochondrial DNA: new data and<br />
reappraisal. Journal of Biogeography 2010 Dec;v37(12)2332–2344. Abstract<br />
41. Gu Z, Zhao X et al. Complete sequence of the yak (Bos grunniens) mitochondrial genome and its evolutionary relationship with<br />
other ruminants. Mol Phylogenet Evol. 2007 Jan;42(1):248-55. Abstract
42. XB Q, Jianlin H et al. Assessment of cattle genetic introgression into domestic yak populations using mitochondrial and<br />
microsatellite DNA markers. Anim Genet. 2010 Jun 1;41(3):242-52. Abstract<br />
43. Decker JE, Pires JC et al. Resolving the evolution of extant and extinct ruminants with high-throughput phylogenomics. PNAS<br />
2009 Nov 3;106(44):18644-9. Abstract<br />
44. da Fonseca RR, Johnson WE et al. The adaptive evolution of the mammalian mitochondrial genome. BMC Genomics. 2008 Mar<br />
4;9:119. Abstract<br />
45. Shen YY, Shi P, Sun YB, Zhang YP. Relaxation of selective constraints on avian mitochondrial DNA following the degeneration of<br />
flight ability. Genome Res. 2009 Oct;19(10):1760-5. Abstract<br />
46. Wang W, Shen P et al. Identification of rare DNA variants in mitochondrial disorders with improved array-based sequencing.<br />
Nucleic Acids Res. 2011 Jan 1;39(1):44-58. 20843780<br />
47. Schon EA, Gilkerson RW. Functional complementation of mitochondrial DNAs: mobilizing mitochondrial genetics against<br />
dysfunction. Biochim Biophys Acta. 2010 Mar;1800(3):245-9. Abstract<br />
48. Poe BG, Duffy CF et al. Detection of heteroplasmy in individual mitochondrial particles. Anal Bioanal Chem. 2010 Aug;397(8):<br />
3397-407. Abstract<br />
49. Osborne A, Reis AH et al. Single-Molecule LATE-PCR Analysis of Human Mitochondrial Genomic Sequence Variations. PLoS<br />
ONE. 2009; 4(5): e5636. Abstract<br />
50. Elliott HR, Samuels DC et al. Pathogenic mitochondrial DNA mutations are common in the general population. Am J Hum Genet.<br />
2008 Aug;83(2):254-60. Abstract<br />
51. Supporting supplemental information is provided at the UCSC comparative genomics web site. Html<br />
52. Schuster SC, Miller W et al. Complete Khoisan and Bantu genomes from southern Africa. Nature. 2010 Feb 18;463(7283):943-7.<br />
Abstract<br />
53. Kucharczyk R, Rak M et al. Biochemical consequences in yeast of the human mitochondrial DNA 8993T>C mutation in the<br />
ATPase6. Biochim Biophys Acta. 2009 May;1793(5):817-24. Abstract<br />
54. Kucharczyk R, Ezkurdia N et al. Consequences of the pathogenic T9176C mutation of human mitochondrial DNA on yeast<br />
mitochondrial ATP synthase. Biochim Biophys Acta. 2010 Jun-Jul;1797(6-7):1105-12.Abstract<br />
55. Mattiazzi M, Vijayvergiya C et al. The mtDNA T8993G (NARP) mutation results in an impairment of oxidative phosphorylation<br />
that can be improved by antioxidants. Hum Mol Genet. 2004 Apr 15;13(8):869-79. Abstract<br />
56. Tsaousis GN, Tsirigos KD et al. ExTopoDB: a database of experimentally derived topological models of transmembrane proteins.<br />
Bioinformatics. 2010 Oct 1;26(19):2490-2. Abstract<br />
57. Iwata S, Lee JW et al. Complete structure of the 11-subunit bovine mitochondrial cytochrome bc1 complex. Science 281:64-71<br />
(1998). Abstract<br />
58. Esser L, Gong X et al. Surface-modulated motion switch: capture and release of iron-sulfur protein in the cytochrome bc1<br />
complex. PNAS 103:13045-13050(2006). Abstract<br />
59. Edwards CJ, Magee DA et al. A Complete Mitochondrial Genome Sequence from a Mesolithic Wild Aurochs (Bos primigenius).<br />
PLoS One. 2010 Feb 17;5(2):e9255. Abstract<br />
60. White DJ, Wolff JN et al. Revealing the hidden complexities of mtDNA inheritance. Mol Ecol. 2008 Dec;17(23):4925-42. Abstract<br />
61. NCBI Blast server Html
Table 1. Data set of complete cytochrome b and whole mitochondrial genome sequences used. The first two columns provides genus,<br />
species and common name according to NCBI taxonomy. The third column gives the number of of complete genomes; the fourth<br />
auxiliary cytochrome b partial sequences. Bison and yak accession numbers are provided elsewhere (2, 40).<br />
Bos grunniens yak 72 53<br />
Bison bison plains bison 33 7<br />
Bison athabascae woods bison 2 3<br />
Bison bonasus wisent 4 9<br />
Bison priscus steppe bison 0 0<br />
Bos sauveli kouprey 0 5<br />
Bos frontalis mithun gayal 0 16<br />
Bos gaurus gaur 0 17<br />
Bos javanicus banteng 2 39<br />
Bos taurus cattle 168 500<br />
Bos primigenius aurochs 1 17<br />
Bos indicus zebu 3 387<br />
Bubalus bubalis water buffalo 4 342<br />
Table 2. Informative derived characters of Bos taurus shared by Bos javanicus and Bos gaurus: amino acid variation at otherwise<br />
conserved sites that are fixed in all wild cattle sequences but differ from ancestral ruminant value (as exhibited in water buffalo,<br />
bison and yak). None of the sites support a sister relationship of any species of wild cattle to bison + yak to the exclusion of Bos<br />
taurus; no evidence lineage sorting was found. Bos frontalis and Bos sauveli are not included because of insufficient data.<br />
Bos indicus Bos primigenius Bos javanicus Bos gaurus<br />
Bos Bison Bos Bison Bos Bison Bos Bison<br />
CYTB 4 0 4 0 4 0 4 0<br />
ATP8 1 1 2 0 2 0 - -<br />
ND5 14 0 14 0 14 0 - -<br />
ND6 4 0 - - 4 0 - -<br />
ND4L 2 0 - - 2 0 - -<br />
ND3 0 0 0 0 0 0 - -<br />
COX1 - - 1 0 1 0 - -<br />
COX3 5 0 5 0 5 0 - -<br />
COX2 2 0 2 0 2 0 2 0<br />
ND2 5 0 5 0 5 0 - -<br />
ND1 2 0 2 0 2 0 - -<br />
ATP6 3 1 4 0 4 0 - -<br />
ND4 8 0 8 0 8 0 - -<br />
totals 50 1 47 0 47 0 6 0
Table 3. Bison non-sporadic mitochondrial protein variation. The first column provides GenBank accession, haplotype nomenclature<br />
(2) and bison provenance (YP: Yellowstone NP, BR: National Bison Refuge, MT: private Montana herd, EI: Elk Island NP, TX:<br />
Texas State Bison Herd, IT: Italian zoo). The second column provides multiplicity (number of bison with a given haplotype). The<br />
following columns provide the gene name and amino acid at a specified site (numbering relative to GU970004 proteins). V98A in<br />
CYTB (cytochrome b) and I60N in ATP6 are deleterious (see text).<br />
Accession_Haplo_Loc mult CYTB ATP6 ATP6 ND5 ND4 ATP6 ND4 ATP8<br />
GU947004_bHap17_YP 1 A98 N60 M182 H159 T314 A177 L442 E38<br />
GU947001_bHap2__BR 11 A98 N60 M182 H159 T314 A177 L442 E38<br />
GU947000_bHap10_FN 3 A98 N60 M182 H159 T314 A177 L442 E38<br />
GU946994_bHap11_MT 1 A98 N60 M182 H159 T314 A177 L442 E38<br />
GU946988_bHap8__MT 1 A98 N60 M182 H159 T314 A177 L442 E38<br />
GU946979_bHap3__MT 2 V98 I60 T182 Y159 A314 A177 L442 K38<br />
GU946998_bHap12_MT 1 V98 I60 T182 Y159 A314 A177 L442 K38<br />
GU946980_bHap4__MT 1 V98 I60 T182 Y159 A314 A177 L442 E38<br />
GU946985_bHap6__MT 1 V98 I60 T182 Y159 A314 A177 L442 E38<br />
GU946989_bHap9__MT 2 V98 I60 T182 Y159 A314 A177 M442 E38<br />
GU946982_bHap5__MT 1 V98 I60 T182 Y159 A314 A177 M442 E38<br />
GU947006_wHap14_EI 1 V98 I60 T182 Y159 A314 A177 L442 E38<br />
EU177871_bHapX__IT 1 V98 I60 T182 Y159 T314 A177 L442 E38<br />
GU946987_bHap7__MT 1 V98 I60 T182 Y159 A314 A177 L442 E38<br />
GU947002_bHap13_TX 2 V98 I60 T182 Y159 A314 T177 L442 E38<br />
GU947003_bHap16_TX 1 V98 I60 T182 Y159 A314 T177 L442 E38<br />
GU947005_wHap15_EI 1 V98 I60 T182 Y159 A314 T177 L442 E38<br />
Table 4. Yak non-sporadic mitochondrial protein variation. The first column provides GenBank accession, haplotype nomenclature<br />
(grouped from those of reference 40 which also provides Tibetan location). The following columns provide the gene name and<br />
amino acid variation at a specified site (numbering relative to GQ464262 proteins). M383V is possibly sub-functional (see text).<br />
Accession_Haplo ND2 ND2 ND4 ATP8 ND5 ND5 ND4L COX3 CYTB<br />
GQ464262_hapA I29 S318 V398 S63 I62 M383 V17 V192 I192<br />
GQ464261_hapA I29 S318 V398 S63 I62 M383 V17 V192 I192<br />
GQ464257_hapA I29 S318 V398 S63 I62 M383 V17 V192 I192<br />
GQ464251_hapA I29 S318 V398 S63 I62 M383 V17 V192 I192<br />
GQ464250_hapA I29 S318 V398 S63 I62 M383 V17 V192 I192<br />
GQ464249_hapA I29 S318 V398 S63 I62 M383 V17 V192 I192<br />
GQ464260_hapB V29 P318 M398 L63 I62 M383 V17 V192 I192<br />
GQ464266_hapB V29 P318 M398 L63 V62 V383 V17 V192 I192<br />
GQ464263_hapB V29 P318 M398 L63 V62 V383 V17 V192 I192<br />
GQ464259_hapB V29 P318 M398 L63 V62 V383 V17 V192 I192<br />
GQ464264_hapB V29 P318 M398 L63 V62 V383 V17 V192 T192<br />
GQ464246_hapB V29 P318 M398 L63 V62 V383 V17 V192 T192<br />
GQ464253_hapB V29 P318 M398 L63 V62 V383 V17 V192 I192<br />
GQ464252_hapB V29 P318 M398 L63 V62 V383 V17 V192 I192<br />
GQ464247_hapB V29 P318 M398 L63 V62 V383 V17 V192 I192<br />
GQ464255_hapB V29 P318 M398 L63 V62 V383 A17 V192 I192<br />
GQ464254_hapB V29 P318 M398 L63 V62 V383 A17 V192 I192<br />
GQ464265_hapB V29 P318 M398 L63 V62 V383 A17 V192 I192<br />
GQ464248_hapB V29 P318 M398 L63 V62 V383 V17 I192 I192<br />
GQ464258_hapB V29 P318 M398 L63 V62 V383 V17 I192 I192<br />
GQ464256_hapB V29 P318 M398 L63 V62 V383 V17 I192 I192
Table 5. Reduced alphabet for each nsSNP determined by large-scale comparative genomics alignment. The first two rows provide<br />
mitochondrial gene name and variation relative to ancestral. The columns under each variant provide the abundances of other amino<br />
acids at that position in other ruminant data. The set of major alternative residues at a given site form its reduced alphabet;<br />
uncommon residues generally reflect sequence error or mutation (possibly somatic or heteroplasmic) in the individual chosen for<br />
sequencing but are sometimes adaptive or a clade-specific addition to the reduced alphabet.<br />
CYTB ATP6 ATP6 ND5 ND4 ATP6 ND4 ATP8<br />
V98A I60N T182M Y159H A314T A177T L442M E38K<br />
4522 V 531 M 553 S 225 Y 281 A 998 A 221 L 215 E<br />
430 I 392 I 286 M 73 H 8 T 88 T 46 I 34 K<br />
34 M 106 T 98 T 5 I 4 S 19 M 17 S<br />
11A 37 V 92 L 3 V 2 V 8 T 15 M<br />
2 G 6 A 57 I 1 P 2 V 5 T<br />
1 A 5 N 10 A 1 A 1 F 5 G<br />
4 L 4 V 3 V<br />
2 P 2 F 2 A<br />
1 S 1 M<br />
1 C<br />
Table 7. Haplotype clustering by all-vs-all Blastn of all complete bison mitochondrial genomes. The first column provides global<br />
haplotypes using the terminology of reference 2; the second a reduced set of haplotypes defined in Table 7 by the control region<br />
diagnostic domain; the third a representative accession number. The fourth column gives multiplicities (example: first data row<br />
shows 11 complete mitochondrial genomes are identical to GU94700). The remaining columns show the number of base pair<br />
differences out of the 16,323 compared. Shading indicates blocks of closely related global haplotypes. The matrix is not quite<br />
symmetric because of gap alignment effects.<br />
Haplo mHap Accession # U01 U04 U00 994 988 997 U06 982 980 871 985 987 992 998 U05 U02<br />
BNBR1 hapA GU947001 11 0 2 3 4 4 20 21 21 22 22 25 25 26 26 23 23<br />
BYNP1586 hapA GU947004 1 2 0 5 6 6 22 23 23 24 24 25 25 28 28 25 25<br />
BFN5 hapA GU947000 3 3 5 0 1 1 19 20 20 21 21 24 24 25 25 22 22<br />
B1031 hapA GU946994 1 4 6 1 0 2 20 21 21 22 22 25 25 26 26 23 23<br />
B973 hapA GU946988 1 4 6 1 2 0 20 21 21 22 22 25 25 26 26 23 23<br />
B1091 hapB GU946997 2 20 22 19 20 20 0 11 1 8 16 11 11 12 12 13 13<br />
wElkI14 hapB GU947006 1 21 23 20 21 21 11 0 12 13 17 16 16 17 17 14 16<br />
B897 hapB GU946982 1 21 23 20 21 21 1 12 0 9 17 12 12 13 13 14 14<br />
B877 hapB GU946980 1 22 24 21 22 22 8 13 9 0 18 7 10 10 10 11 9<br />
Euro hapB EU177871 1 22 24 21 22 22 16 17 17 18 0 21 21 22 22 19 21<br />
B935 hapB GU946985 1 25 25 24 25 25 11 16 12 7 21 0 13 13 13 14 12<br />
B961 hapB GU946987 1 25 25 24 25 25 11 16 12 10 21 13 0 14 14 15 15<br />
B1018 hapB GU946992 2 26 28 25 26 26 12 17 12 10 22 13 14 0 1 15 15<br />
B1191 hapB GU946998 1 27 26 24 25 25 13 18 14 11 23 14 15 1 0 16 16<br />
wElk1 hapC GU947005 1 23 25 22 23 23 13 14 14 11 19 14 15 15 15 0 10<br />
BTSBH1001 hapD GU947002 3 23 25 22 23 23 13 16 14 9 21 12 15 15 15 10 0
Table 6. A. Phylogenetic conservation of ATP6 in a ten amino acid window about I60N. Light shading shows amino acids found in<br />
other mammals at greater than 1% frequency. Dark shading indicates bison sequence (not always the highest frequency)>The<br />
neighborhood of I60N exhibits variable levels of conservation and no overt periodicity. The structure of the loop region containing<br />
I60N is thus not constrained by available data. B. Alignment against the only homologous protein with determined 3D structure (PDB<br />
1C17|M from E. coli) is not informative in the I60N region so the effect of the asparagine substitution cannot be modeled.<br />
Phylogenetic Conservation of ATP6 in Neighborhood about I60N<br />
55 56 57 58 59 60 61 62 63 64 65<br />
K 1356 Q 1582 M 1011 M 1189 A 325 M 535 H 1083 N 1336 T 603 K 1151 G 1600<br />
Q 161 H 13 L 515 F 126 S 238 P 525 L 414 S 197 K 212 G 212 A 11<br />
N 37 N 12 I 75 I 7 L 196 I 391 I 72 T 38 P 193 N 54 S 5<br />
H 19 E 11 V 17 T 4 M 92 T 108 V 29 G 21 Q 173 P 52 V 3<br />
S 17 R 2 F 5 V 2 I 90 Q 35 M 24 D 17 L 107 Q 31 M 2<br />
Y 12 Y 1 T 2 S 2 Q 58 V 9 T 1 H 6 H 71 T 28 T 1<br />
G 10 T 1 Y 1 N 49 L 8 Q 1 P 4 V 54 A 28 P 1<br />
R 6 Q 1 G 25 A 6 H 1 K 4 I 49 E 25 K 1<br />
T 3 I 1 V 12 S 1 A 1 R 1 S 41 S 18 G 1<br />
M 1 F 1 F 11 N 1 N 1 A 37 L 8 E 1<br />
L 1 H 4 H 1 L 1 N 25 R 6<br />
K 1 S 1 Y 24 M 4<br />
I 1 R 1 M 14 I 3<br />
E 1 R 13 D 2<br />
A 1 F 4 K 1<br />
E 3 H 1<br />
P 2<br />
Y 1<br />
B. Alignment of bison ATP6 with homologous protein PDB 1C17|M from E. coli<br />
*<br />
Bison: KQMMSNHNPKGQTWTLMLMLMSLILFIGSTNLLGLLPHSFTPTTQLSMNLGMA<br />
L+ + L+ +I ++LGL P+ +++ L MA<br />
Ecoli: PLALTIFVWVFLMNLMDLLPIDLLPYIAE-HVLGLPALRVVPSADVNVTLSMA
Table 8. Predicting health status from control region haplotypes. The first column provides GenBank accession, the second the<br />
sequence of the diagnostic portion of the control region (positions 15894-15965 of Yellowstone bison GU947004), the third<br />
haplotype notation here, with columns four through six providing the observed or predicted amino acid of position 98 in cytochrome<br />
b and position 60 in ATP6. Column seven correlates diagnostic region haplotype with haplotype terminology of reference 2. Light<br />
red: observed disease alleles; dark red: predicted disease. Light green: observed healthy alleles; dark green: predicted health. Other<br />
light/dark colors pairs show observed/predicted healthy alleles in less common haplotypes.<br />
Accession TTGCAAACACCACTAGCTAACGTCACTCACCCCCAAAAATGCATTACCCAAACGGGGGGAAATATACATAAC Haplo Status CYTB ATP6 Haplo1<br />
GU946996 C.....................................-................................. hapA observed 98A 60N bHap2<br />
GU946995 C.....................................-................................. hapA observed 98A 60N bHap2<br />
GU946981 C.....................................-................................. hapA observed 98A 60N bHap2<br />
GU946976 C.....................................-................................. hapA observed 98A 60N bHap2<br />
GU946983 C.....................................-................................. hapA observed 98A 60N bHap2<br />
GU946984 C.....................................-................................. hapA observed 98A 60N bHap2<br />
GU946993 C.....................................-................................. hapA observed 98A 60N bHap2<br />
GU946986 C.....................................-................................. hapA observed 98A 60N bHap2<br />
GU946977 C.....................................-................................. hapA observed 98A 60N bHap2<br />
GU946978 C.....................................-................................. hapA observed 98A 60N bHap2<br />
GU947001 C.....................................-................................. hapA observed 98A 60N bHap2<br />
GU947004 C.....................................-................................. hapA observed 98A I60 bHap17<br />
GU946991 C.....................................-................................. hapA observed 98A 60N bHap10<br />
GU946990 C.....................................-................................. hapA observed 98A 60N bHap10<br />
GU947000 C.....................................-................................. hapA observed 98A 60N bHap10<br />
GU946994 C.....................................-................................. hapA observed 98A 60N bHap11<br />
GU946988 C.....................................-................................. hapA observed 98A 60N bHap8<br />
AY748509 C.....................................-................................. hapA predicted 98A 60N .....<br />
AY748518 C.....................................-................................. hapA predicted 98A 60N .....<br />
AF083362 C.....................................-................................. hapA predicted 98A 60N .....<br />
AF083357 C.....................................-................................. hapA predicted 98A 60N .....<br />
EF693810 C.....................................-................................. hapA predicted 98A 60N .....<br />
U12948.. C.....................................-................................. hapA predicted 98A 60N .....<br />
U12946.. C.....................................-................................. hapA predicted 98A 60N .....<br />
U12945.. C.....................................-................................. hapA predicted 98A 60N .....<br />
U12934.. C.....................................-................................. hapA predicted 98A 60N .....<br />
U12933.. C.....................................-................................. hapA predicted 98A 60N .....<br />
EU272058 C.....................................-................................. hapA predicted 98A 60N .....<br />
EU272056 C.....................................-................................. hapA predicted 98A 60N .....<br />
DQ452027 C.....................................-................................. hapA predicted 98A 60N .....<br />
AY428859 C.....................................-................................. hapA predicted 98A 60N .....<br />
GU946997 ......................................-...................--............ hapB observed V98 I60 bHap9<br />
GU946989 ......................................-...................--............ hapB observed V98 I60 bHap9<br />
GU947006 ......................................-...................--............ hapB observed V98 I60 wHap14<br />
GU946982 ......................................-...................--............ hapB observed V98 I60 bHap5<br />
GU946980 ......................................-...................--............ hapB observed V98 I60 bHap4<br />
EU177871 ......................................-...................--............ hapB observed V98 I60 .....<br />
GU946985 ......................................-...................--............ hapB observed V98 I60 bHap6<br />
GU946987 ......................................-...................--............ hapB observed V98 I60 bHap7<br />
GU946992 ......................................-...................--............ hapB observed V98 I60 bHap3<br />
GU946979 ......................................-...................--............ hapB observed V98 I60 bHap3<br />
GU946998 ......................................-...................--............ hapB observed V98 I60 bHap12<br />
AY748745 ......................................-...................--............ hapB predicted V98 I60 .....<br />
AY748477 ......................................-...................--............ hapB predicted V98 I60 .....<br />
AY748530 ......................................-...................--............ hapB predicted V98 I60 .....<br />
AY748519 ......................................-...................--............ hapB predicted V98 I60 .....<br />
AY748630 ......................................-...................--............ hapB predicted V98 I60 .....<br />
AY748495 ......................................-...................--............ hapB predicted V98 I60 .....<br />
AY748693 .................................A....-...................--............ hapB predicted V98 I60 .....<br />
AY748690 ......................................-...................--............ hapB predicted V98 I60 .....<br />
AY748689 ......................................-...................--............ hapB predicted V98 I60 .....<br />
AY748687 ......................................-...................--............ hapB predicted V98 I60 .....<br />
AY748702 ......................................-...................--............ hapB predicted V98 I60 .....<br />
AY748739 ......................................-...................--............ hapB predicted V98 I60 .....<br />
AY748747 ......................................-...................--............ hapB predicted V98 I60 .....<br />
AY748700 ......................................-...................--............ hapB predicted V98 I60 .....<br />
AY748685 ......................................-................A..--............ hapB predicted V98 I60 .....<br />
AY748678 ......................................-...................--............ hapB predicted V98 I60 .....<br />
AY748676 ......................................-...................--............ hapB predicted V98 I60 .....<br />
AY748677 ......................................-...................--............ hapB predicted V98 I60 .....<br />
AY748701 ......................................-...................--............ hapB predicted V98 I60 .....<br />
AY748680 ......................................-...................--............ hapB predicted V98 I60 .....
AY748671 ......................................-...................--............ hapB predicted V98 I60 .....<br />
AY748672 ......................................-...................--............ hapB predicted V98 I60 .....<br />
AY748679 ......................................-...................--............ hapB predicted V98 I60 .....<br />
AY748617 .........T............................-.......T...........--............ hapB predicted V98 I60 .....<br />
AY748699 ......................................-...................--............ hapB predicted V98 I60 .....<br />
AY748620 ...........................T..........-...................--............ hapB predicted V98 I60 .....<br />
AY748748 ......................................-...................--............ hapB predicted V98 I60 .....<br />
AY748742 ......................................-...................--............ hapB predicted V98 I60 .....<br />
AY748758 ......................................-...................--............ hapB predicted V98 I60 .....<br />
AY748757 ......................................-...................--............ hapB predicted V98 I60 .....<br />
AY748618 ......................................-...................--............ hapB predicted V98 I60 .....<br />
AF083364 ......................................-...................--............ hapB predicted V98 I60 .....<br />
AF083363 ......................................-...................--............ hapB predicted V98 I60 .....<br />
AF083360 ......................................-...................--............ hapB predicted V98 I60 .....<br />
AF083361 ......................................-...................--............ hapB predicted V98 I60 .....<br />
U12941.. ......................................-...................--............ hapB predicted V98 I60 .....<br />
U12943.. ......................................-...................--............ hapB predicted V98 I60 .....<br />
U12960.. ......................................-...................--............ hapB predicted V98 I60 .....<br />
GU947005 ......................................-...................--...........T hapC observed V98 I60 wHap15<br />
AY748478 ......................................-...................--...........T hapC predicted V98 I60 .....<br />
AY748476 ..A...................................-...................--...........T hapC predicted V98 I60 .....<br />
AY748695 ..............................T.......-...................--...........T hapC predicted V98 I60 .....<br />
AY748675 ......................................-...................--...........T hapC predicted V98 I60 .....<br />
AY748673 ......................................-...................--...........T hapC predicted V98 I60 .....<br />
AY748674 ......................................-...................--...........T hapC predicted V98 I60 .....<br />
AY748529 ......................................-...................--...........T hapC predicted V98 I60 .....<br />
AF083359 ......................................-...................--...........T hapC predicted V98 I60 .....<br />
U12959.. ......................................-...................--...........T hapC predicted V98 I60 .....<br />
U12942.. ......................................-...................--...........T hapC predicted V98 I60 .....<br />
U12937.. ......................................-...................--...........T hapC predicted V98 I60 .....<br />
U12951.. ......................................-...................--...........T hapC predicted V98 I60 .....<br />
GU946999 ......................................-...................-....G.......T hapD observed V98 I60 bHap13<br />
GU947002 ......................................-...................-....G.......T hapD observed V98 I60 bHap13<br />
GU947003 ......................................-...................-....G.......T hapD observed V98 I60 bHap16<br />
AY748682 ..........................................................--............ hapE weak pred V98 I60 .....<br />
AY748669 ..........................................................--............ hapE weak pred V98 I60 .....<br />
AY748521 ..........................................................--............ hapE weak pred V98 I60 .....<br />
AF083358 ..........................................................--............ hapE weak pred V98 I60 .....<br />
AY748681 ......................................-...................-............. hapF weak pred 98A 60N .....<br />
U12864.. ......................................-...................-............. hapF weak pred 98A 60N .....<br />
Table 9. Sequence data of Gardipee (22) for Yellowstone and Grand Tetons National Parks. First and second columns provide herd<br />
locations. The third column shows number of bison carrying the disease haplotype; the fourth the numbers of bison with wildtype<br />
mitochondrial DNA. The final column shows the percentage of healthy bison varies with geographic location of the herds (which<br />
have little observed mixing).<br />
Park Herd V98A I60N V98V I60I % Healthy<br />
YNP Hayden Valley 88 6 6%<br />
YNP Lamar Valley 19 22 54%<br />
YNP Mirror Plateau 10 6 38%<br />
GTNP Antelope Flats 20 0 0%<br />
GTNP Wolf Creek 8 0 0%
Figure 1. Structural models of the V98A region of bison cytochrome b adapted from previous crystallographic models of the bovine<br />
ortholog (57, 58). Here H97 is an axial ligand to heme iron and R100 forms a salt bridge to heme proprionate.<br />
" ,
DEVELOPMENT OF FECAL DNA SAMPLING METHODS TO<br />
ASSESS GENETIC POPULATION STRUCTURE<br />
OF GREATER YELLOWSTONE BISON<br />
By<br />
Florence Marie Gardipee<br />
Associate of Science, Medical Laboratory Technology, Austin Community College,<br />
Austin, Texas, 1982<br />
Bachelor of Science, Wildlife Biology, The University of Montana,<br />
Missoula, Montana, 2003<br />
Thesis<br />
presented in partial fulfillment of the requirements<br />
for the degree of<br />
Master of Science<br />
Wildlife Biology<br />
The University of Montana<br />
Missoula, MT<br />
Spring 2007<br />
Approved by:<br />
<strong>Dr</strong>. David A. Strobel, Dean<br />
Graduate School<br />
Fred W. Allendorf, Co-Chair<br />
Division of Biological Sciences<br />
Gordon Luikart, Co-Chair<br />
Division of Biological Sciences<br />
Mark Hebblewhite<br />
Department of Ecosystem and Conservation Sciences<br />
Richmond Clow<br />
Native American Studies
Gardipee, Florence, M.S., May 2007 Wildlife Biology<br />
Development of fecal DNA sampling methods to assess genetic population structure of<br />
Greater Yellowstone bison<br />
Co-Chairperson: Fred W. Allendorf<br />
Co-Chairperson: Gordon Luikart<br />
The bison (Bison bison) of Yellowstone National Park (YNP) and Grand Teton National<br />
Park (GTNP) represent two of only three remaining populations of plains bison that have<br />
no evidence of hybridization with cattle. Therefore, these bison are an important source<br />
for ecological and genetic restoration of wild bison. Little is known regarding genetic<br />
population structure and gene flow among the Greater Yellowstone Area (GYA) bison<br />
herds. I evaluated the feasibility of fecal DNA sampling for genetic analyses of wild<br />
bison populations. I used matched blood and fecal samples from eight radio-collared<br />
bison from Hayden Valley breeding group (YNP), and multiplex polymerase chain<br />
reaction (PCR) of four microsatellite loci to assess amplification success and genotyping<br />
error rates. The amplification success rate was 92% and the genotyping error rate was<br />
12% on average across all individuals, and loci. Exclusion of two poor quality samples<br />
from data analyses increased amplification success to 97%, and reduced the genotyping<br />
error rate to 4%. I PCR amplified a 470 bp mitochondrial DNA (mtDNA) fragment for<br />
sequencing, and successfully identified haplotypes for120 individuals. The error rate for<br />
mtDNA sequencing was 0.0005 nucleotide mis-incorporations across all samples.<br />
Sequencing and RFLP analysis of mtDNA control region from 179 fecal samples<br />
collected over two consecutive seasons was conducted to evaluate population structure<br />
among YNP breeding groups, and between GTNP and YNP bison populations. I found<br />
significant genetic distinction between YNP and GTNP bison populations (FST = 0.191, p<br />
< 0.001). The differences in haplotype frequencies between Hayden Valley and Lamar<br />
Valley breeding groups were highly significant (FST = 0.367, p < 0.001), and nearly two<br />
times greater than between GTNP and YNP thus providing evidence for at least two<br />
genetically distinct breeding groups within YNP. Differences between breeding groups<br />
remained significant even though haplotype frequencies were different between years<br />
within Hayden Valley (FST = 0.054, p < 0.05). The techniques and protocols developed<br />
have allowed high amplification success, low genotyping and sequencing error rates. This<br />
study demonstrated that non-invasive fecal DNA sampling is feasible for bison, and<br />
detected fine-scale population genetic structure in among GYA bison, suggesting female<br />
philopatry.<br />
ii
Table of Contents<br />
Abstract……………………………………………………………………………………ii<br />
List of Tables……………………………………………………………………………..iv<br />
List of Figures……………………………………………………………………………..v<br />
Appendices………………………………………………………………………...……...vi<br />
Dedication……………………………………………………………………………..…vii<br />
Acknowledgements……………………………………………………………………..viii<br />
Preface……………………………………………………………………...…………….ix<br />
Chapter 1. Introduction………………………………………………………………1<br />
Chapter 2. Non-invasive fecal DNA sampling and low genotyping<br />
error rates in the Greater Yellowstone Area bison<br />
Abstract…………………………………………………………………..13<br />
Introduction………………………………………………………………14<br />
Methods…………………………………………………………………..15<br />
Results……………………………………………………………………20<br />
Discussion………………………………………………………………..22<br />
Chapter 3. Genetic Population Structure in the Greater Yellowstone Area bison<br />
populations revealed by mitochondrial DNA analyses<br />
Abstract…………………………………………………………………..31<br />
Introduction………………………………………………………………32<br />
Methods…………………………………………………………………..34<br />
Results……………………………………………………………………36<br />
Discussion………………………………………………………………..37<br />
iii
Literature Cited…………………………………………………………………………..46<br />
List of Tables<br />
2-1 Amplification success (AS), allelic dropout (AD) and false allele (FA) rates for all<br />
loci co-amplified in the multiplex PCR. Total and average error rates were first<br />
estimated across all genotypings (loci and individuals), and then excluding data<br />
from two individual samples, YELL-024 and YELL-030……………………….27<br />
2-2 Amplification success (AS), allelic dropout (AD) rates for all individual samples.<br />
Averages were first estimated across all individuals, and then excluding data from<br />
two individuals, YELL-024 and YELL-030……………………………………..28<br />
3-1 Distribution and frequency of haplotype 6 among the GYA bison populations<br />
sampled over two consecutive breeding seasons, 2005 and 2006, and the total<br />
number of samples analyzed from each population per season………………….45<br />
3-2 FST values based on haplotype frequencies among GYA bison populations…….45<br />
iv
List of Figures<br />
1-1 Map of YNP showing key bison winter ranges and locations of bison breeding<br />
groups as described by Meagher 1973, Taper and Meagher 2000, Meagher et al.<br />
2002………………………………………………………………………………12<br />
2-1 Flow diagram showing the two extractions per fecal sample, and five, multiplex<br />
PCR amplification (using four microsatellite loci) per extraction, and number of<br />
genotypings per individual radio-collared bison used to assess amplification and<br />
genotyping error rates...………………………………………………………….26<br />
3-1 Approximate locations of GYA bison breeding groups, represented by the<br />
respective haplotype frequencies of bison sampled within each area……………44<br />
v
Appendices<br />
2-1 Characteristics of microsatellite loci amplified in the multiplex PCR; primers, and<br />
chromosome location (Halbert 2003). Allele ranges, and number of alleles (NA)<br />
found in the eight radio-collared bison used to assess amplification success and<br />
error rates for this study………………………………………………………….29<br />
2-2 Amplification rates (AS) reported in our study and for other species with non-<br />
pellet form feces (Reed et al. 1997; Wasser et al. 1997; Kohn et al. 1999; Bradley<br />
et al. 2000; Lathuillière et al. 2001; Morin et al. 2001; Parsons 2001; Lucchini et<br />
al. 2002; Murphy et al. 2002; Eggert et al. 2003; Fernando et al. 2003; Buchan et<br />
al. 2005)………………………………………………………………………….29<br />
2-3 Allelic dropout (AD) rates reported in our study and for other species with non-<br />
pellet form feces (Morin et al. 2001; Parsons 2001: Lucchini et al. 2002; Murphy<br />
et al. 2002; Eggert et al. 2003; Fernando et al. 2003; Buchan et al. 2005)...…....30<br />
vi
Dedication<br />
The work presented within the body of this thesis is dedicated to all of those who have<br />
subsisted in respectful co-existence with bison in the past, and to those who dream of a<br />
time when bison thundered across the plains, and work toward their restoration. Mostly, I<br />
would like to dedicate this thesis to the tribal elders of the North American First Nations,<br />
who guide our path to the future through teaching us about our past. One such elder who<br />
has played a major role in my life, is my adopted Mom and spiritual mentor, <strong>Dr</strong>.<br />
Henrietta Mann, who inspires me to be the best scientist and human being I can possibly<br />
be. She has taught me to be generous, respectful, strong, how to feel the earth under my<br />
feet, and stretch my hands to the sky. I would also like to dedicate this thesis to my<br />
beautiful daughters, Jasmine, Juanita, and Jade for their love and patient support. Finally<br />
I offer honor, respect and gratitude to the bison of Greater Yellowstone for their generous<br />
contributions to this study.<br />
vii
Acknowledgements<br />
This study would not have been possible without the cooperation and support of<br />
Rick Wallen, Bison Biologist, the Yellowstone National Park Bison Ecology Program<br />
staff, and Steve Cain, Supervisory Wildlife Biologist, Grand Teton National Park. I feel<br />
privileged and honored to have had guidance and support from my advisors, Fred<br />
Allendorf and Gordon Luikart. I owe them both a debt of gratitude for their patience and<br />
kind efforts in assisting me to achieve my academic goals. Committee members Rich<br />
Clow and Mark Hebblewhite deserve thanks and recognition for their support and<br />
valuable suggestions. I would like thank Paul Spruell for inspiring my interest in<br />
conservation genetics and providing expertise. Special thanks go to my research assistant,<br />
Michael O’Brien, for his hard work and dedication to this study both in the lab and the<br />
field. Ericka Gutierrez, Katie Jo Rabbit, and Christine Grossen (AKA “The <strong>Buffalo</strong><br />
Girls”) assisted with field studies and lab work. Recognition and gratitude for sharing<br />
laboratory facilities and technical expertise go to Jason Hicks, Steve Amish, and Scott<br />
Mills. Sally Painter, John Powell, and Robb Leary of the Montana Fish, Wildlife, and<br />
Parks Fish Genetics Laboratory provided invaluable technical expertise to this study as<br />
well. I am very grateful to Brian Steele who provided assistance and expertise with<br />
statistical analyses. Funding was provided by; Boyd Evison Graduate Research<br />
Fellowship, Yellowstone National Park, Len Broberg (EVST-UM), Lila Fishman (DBS-<br />
UM), Charlie Janson, Associate Dean, DBS-UM, and Patagonia, Inc. Graduate funding<br />
was provided by Teaching Assistantships, the Sloans Program, and NSF-ECOS Program.<br />
I would also like to thank Penny Kukuk, Carol Brewer, Vanessa Ezenwa, Scott Mills,<br />
Mary Kamensky, Patrick Weasel Head, Kate Shanley, and Dave Dwyer for their support.<br />
viii
Preface<br />
Dale Lott grew up on the National Bison Range, and spent most of his adult life<br />
studying bison behavior and ecology. This work culminated in a book titled, “American<br />
Bison: A Natural History”. Chapter five of this publication, amusingly titled, “Digestion:<br />
Grass to Gas and Chips”, discusses the remarkable digestive system of bison. At the end<br />
of this chapter he touts the usefulness of fecal studies in wildlife, and for bison in<br />
particular; “In their passage chips also pick up bison cells that contain the individual’s<br />
complete genome. It is possible that they could reveal not only the individual’s identity<br />
but perhaps the identity of its parents as well. So science will just keep chipping away at<br />
the secrets in the belly of the beast….but few other ways are as humane and efficient as<br />
chip analysis. No need to subdue the buffalo with a tranquilizing darts–and no worries<br />
that hormone levels in the blood sample reflect short-term peaks or bottoms caused by the<br />
trauma of the sampling. Little wonder then, that when the chips are down, the biologist’s<br />
spirits are up. The investigator that at first seems a figure of fun, a dedicated pooper-<br />
scooper, is really the very model of a modern-day mammalogist.”<br />
Dale was right! The non-invasive fecal DNA sampling protocols I have developed<br />
for population genetic studies of free-ranging bison, has just begun to reveal “the secrets<br />
in the belly of the beast”. I have become the dedicated “pooper-scooper”, and hope to<br />
continue the use of non-invasive fecal sampling to learn as much as I can about the wild<br />
bison of Greater Yellowstone. And, who knows how much we will continue to learn<br />
about these amazing animals through just sampling of their feces? Hopefully, we will<br />
gain the information and insights we need in order to conserve them for future<br />
generations.<br />
ix
Chapter 1.<br />
Introduction<br />
Conservation of wild bison (Bison bison) is crucial to conservation of North<br />
American Tribal cultures and the biodiversity of the plains ecosystem. Bison are an<br />
ecological and cultural keystone species (McHugh 1972; Erdoes and Ortiz 1984; Knapp<br />
et al. 1999). Concern for the persistence of wild bison has increased since conservation<br />
status reviews revealed that they are ecologically extinct from over 90% of their former<br />
habitats. Of the estimated >450,000 bison in the United States (U.S.), 95% of them reside<br />
on private ranches where they have been subjected to hybridization with cattle and<br />
domestication (Boyd 2003). In addition, at least seven of ten federal bison herds show<br />
evidence of hybridization (Halbert and Derr 2007).<br />
Prior to Euro-American settlement, the bison populations that roamed North<br />
America were reduced from an estimated 30 million (Seton 1937; Barsness 1985;<br />
Hornaday 2002) to less than 1000 by the late 1800’s (Coder 1975; Hornaday 2002; Smits<br />
1994). Shortly after this near extermination, the few hundred remaining bison were either<br />
captured and sent to zoos or adopted by private ranchers (Coder 1975; Hornaday 2003).<br />
The conservation efforts of the past have insured that the American bison is no longer at<br />
risk of demographic extinction. However, the loss of genetic diversity due to multiple<br />
bottlenecks, founder effects, hybridization, and domestication pose the risk of genomic<br />
extinction, and reduced evolutionary potential (Freese et al. 2007).<br />
Following Boyd’s (2003) recommendations, the Wildlife Conservation Society<br />
has initiated a comprehensive review of the status of bison in collaboration with the<br />
IUCN Bison Specialist Group. In 2005, the WCS began the revitalization of the<br />
1
principles of the historic American Bison Society in an effort to bring about the<br />
ecological recovery of bison populations across their historic range (Freese et al. 2007).<br />
Individual and collaborative efforts directed at ecological restoration of bison to<br />
their former ranges have been initiated by government agencies, private citizens, non-<br />
governmental organizations, and Native American tribes (Freese et al. 2007). They face<br />
two major issues in pursuing these efforts; locating large tracts of suitable habitat for<br />
bison, and identifying source populations with sufficient genetic diversity and no<br />
evidence of hybridization that can contribute to the conservation of the bison genome<br />
(Freese et al. 2007).<br />
The Greater Yellowstone Area (GYA) bison herds represent an evolutionary<br />
legacy for conservation of bison because they are the only surviving naturally occurring<br />
wild bison population in the United States (Freese et al. 2007). Two large herds currently<br />
reside within Yellowstone and Grand Teton National Parks (YNP and GTNP). Previous<br />
genetic studies revealed that the GYA bison have a relatively high degree of genetic<br />
variation and no evidence of hybridization (Ward et al. 1999; Halbert and Derr 2007).<br />
The GYA bison may also represent an ecological microcosm of historic bison<br />
populations, thus requiring careful conservation efforts to ensure their persistence.<br />
Population genetic studies would provide crucial information for agencies charged with<br />
the management and conservation of these bison populations:<br />
• National Park Service (NPS)<br />
• U.S. Fish and Wildlife Service (USFWS)<br />
• U.S. Forest Service (USFS)<br />
2
• United States Department of Agriculture, Animal and Plant Health Inspection<br />
Service (USDA-APHIS)<br />
• Montana Fish, Wildlife, and Parks (MFWP)<br />
• Wyoming Game and Fish (WGF)<br />
• Montana Department of Livestock (MDOL)<br />
Previous genetic studies of the GYA bison relied upon opportunistic sampling<br />
animals captured on winter ranges outside of park boundaries. Over forty microsatellite<br />
loci were used to assess genetic diversity and evaluate whether more than one<br />
subpopulation exists within YNP bison (Halbert 2003). Population substructure analyses<br />
conducted in STRUCTURE (Pritchard et al. 2000) suggested the presence of three<br />
subpopulations (or breeding groups) for 166 bison exiting the park though the northern<br />
boundary, and one primary subpopulation for 63 bison exiting through West Yellowstone<br />
(Halbert 2003). Although, Halbert (2003) tested for genetic differentiation between YNP<br />
and GTNP bison herds (FST = 0.102), the rate and direction of gene flow between these<br />
parks was not thoroughly assessed. Because bison were not sampled at the geographic<br />
locations of breeding groups within the parks, population structure could not be<br />
confirmed, and the partitioning of genetic diversity among breeding groups remained<br />
unknown.<br />
An expanded assessment of population structure and gene flow between GYA<br />
bison populations through non-invasive fecal sampling, microsatellite studies, and the<br />
addition of mtDNA sequencing could confirm whether population structure among<br />
breeding groups truly exists. YNP bison breeding groups are known to congregate in two<br />
primary geographic locations (Lamar Valley/ Mirror Plateau and Hayden Valley), and<br />
3
within a possible third location (Mirror Plateau/Pelican Valley) during the summer rut<br />
season (Fig. 1-1) (Meagher et al. 2002; Geremia et al. 2005; Jones et al. 2006). Genetic<br />
variation and population substructure, for these breeding groups is unknown. This is, in<br />
large part, due to the difficulty obtaining blood or tissue samples from wild, free ranging<br />
bison during the summer. Also, the high risk of undue physiological stress from live<br />
capture, and potential mortality associated with immobilizing agents further hinder<br />
invasive approaches to sample collection. Sampling bison with traditional methods while<br />
they are congregated in large groups during the breeding season can be complicated,<br />
dangerous and stressful for the bison. Therefore, an alternative sampling approach was<br />
considered for acquiring genetic data from bison within the parks. Non-invasive fecal<br />
DNA sampling offers an efficient means of acquiring genetic data from GYA bison<br />
populations across their geographic range, with minimum risk to wild bison, and<br />
personnel collecting samples. This approach will also allow us to associate the genetic<br />
data with specific locations of breeding groups.<br />
Most importantly, the non-invasive sampling approach is highly compatible with<br />
NPS wildlife management philosophy which mandates the following: “The Wildlife<br />
Management Program will achieve the NPS’s primary mission by…minimizing human<br />
impacts on native animals, populations, communities, and ecosystems, and the processes<br />
that sustain them” (USDOI-NPS 2006). This study will also assist the NPS with meeting<br />
the Genetic Resource Management Principles “to protect the full range of genetic types<br />
(genotypes) of native plants and animal populations in the parks by perpetuating natural<br />
evolutionary processes and minimizing human interference with evolving genetic<br />
diversity…the Service will maintain the appropriate levels of natural genetic diversity”,<br />
4
through providing genetic information crucial for management of the GYA bison<br />
(USDOI-NPS 2006).<br />
Non-invasive sampling for genetic studies<br />
Non-invasive sampling has the advantage of extracting DNA from alternative<br />
sources of cellular material without physically handling wildlife. DNA has been extracted<br />
from hairs, feces, urine, feathers, snake skins, eggshells, and even skulls found in owl<br />
pellets (Bricker et al. 1996; Morin and Woodruff 1996; Taberlet and Fumagali 1996).<br />
Analysis of genetic material, particularly microsatellites, obtained through non-invasive<br />
sources collected in the field can be highly informative. Fecal DNA samples can provide<br />
individual identification, relatedness estimates, pedigree construction, sex identification,<br />
estimates of census and effective population size, mark-recapture data, and determine<br />
genetic variation within and between populations (Luikart and England 1999; Taberlet et<br />
al. 1999; Frantz et al. 2003; Wilson et al. 2003). Non-invasive fecal sampling has been<br />
used successfully in studies of ungulates, such as alpine ibex (Capra ibex), Corsican<br />
mouflon (Ovis musimo), and bighorn sheep (Ovis canadensis) (Maudet et al. 2004;<br />
Luikart et al. 2007). Fecal sampling in wild, free ranging ungulates, such as bison, can<br />
allow observation of groups or individuals at safe distances for social dominance ranking,<br />
sex, and age group prior to collection of feces, thus, providing an opportunity to collect<br />
additional data with respect to their ecology.<br />
DNA amplification from fecal samples (as well as other non-invasive sample<br />
types) can present several challenges to successful genotyping that may potentially offer<br />
false results (Taberlet et al. 1999). Genotyping error rates can be high in certain types of<br />
5
samples. However, repeated genotyping of heterozygous individuals can be used to<br />
accurately determine genotyping error rates (Taberlet et al. 1999; Maudet et al. 2004).<br />
Seasonal differences in forage quality can potentially affect genotyping error rates<br />
from ungulate feces (Maudet et al. 2004). Maudet et al. (2004) found significant<br />
differences for DNA recovery in fecal samples collected in winter versus summer<br />
samples. DNA recovery rates were much lower, and genotyping error rates were much<br />
higher in seasons when forage quality is quite high, such as spring or summer. Recovery<br />
of DNA from bison fecal samples collected during the summer rut season could be<br />
challenging and error rates high. Bison typically form pie-shaped fecal depositions that<br />
may be more difficult to extract DNA from compared to pellet-form fecal depositions.<br />
However, non-invasive fecal DNA sampling has been successfully employed for genetic<br />
studies in African and Asian elephants, which form dung piles that are similar to, but<br />
larger than bison feces (Vidya et al. 2005; Archie et al. 2006).<br />
Feasibility studies should be conducted on all novel non-invasive sample types,<br />
before approaching a large scale genetic analysis to insure that DNA analysis is reliable<br />
(Taberlet et al. 1999; Maudet et al. 2004). Non-invasive fecal DNA samples can produce<br />
high error rates due to allelic dropout and false alleles, therefore it is necessary to<br />
estimate the number of replicate genotypings needed for confidently assigning correct<br />
genotypes (Taberlet et al. 1999; Maudet et al. 2004). We therefore assessed amplification<br />
success and error rates for fecal DNA extracted from bison feces.<br />
mtDNA and population structure<br />
Our primary objective was to assess population structure among the GYA bison<br />
breeding groups. We chose to use the mtDNA control region for this study because it is<br />
6
useful for evaluating genetic population structure and gene flow in mammal species that<br />
exhibit strong matrilineal social structure, similar to that found in bison. (Nyakaana et al.<br />
2002; Archie et al. 2006; Parsons et al. 2006). Female philopatry to natal ranges can play<br />
an important role in determining the genetic structure of populations (Chesser 1991; Storz<br />
1999). Philopatry has been documented in other ungulates such as roe deer (Capreolus<br />
capreolus), bushbuck (Tragelaphus scriptus), Svalbard reindeer (Rangifer tarandus<br />
platyrhynchus), desert bighorn sheep (Ovis canadensis nelsoni), and Soay sheep (Ovis<br />
aries) (Côté et al. 2002; Coltman et al. 2003; Epps et al. 2005; Nies et al. 2005; Wronski<br />
and Apio 2006). Bison have been observed to assemble in matrilineal groups which may<br />
include several generations of related individuals which travel together (McHugh 1972;<br />
Lott 2002; Halbert 2003). However, no studies have confirmed female philopatry free<br />
ranging, wild bison through the use of genetic markers such as mtDNA.<br />
The mtDNA control region has been widely used for assessing population genetic<br />
structure because of its high variability. This region of the mtDNA has been primarily<br />
used for surveying bison herds for evidence of hybridization with cattle, and evaluating<br />
phylogenetic relationships between North American bison populations. There are 10<br />
unique B. bison haplotypes and 12 variable sites that were previously detected within a<br />
470 bp section within the mtDNA control region. Only five haplotypes were detected<br />
among U.S. bison herds. However, there were no studies using this region of the mtDNA<br />
to study population structure at a fine-scale in large ungulates.<br />
Objectives<br />
This thesis focuses on two primary objectives: 1) develop and evaluate methods<br />
for using fecal DNA samples for population genetic studies of wild bison; 2) assess<br />
7
population structure within YNP breeding groups, and between YNP and GTNP bison<br />
populations using a 470 bp mtDNA control region sequence.<br />
In chapter 2, I addressed the following objectives:<br />
1) Determine whether non-invasive fecal samples can provide a reliable source of<br />
DNA for genetic studies in bison.<br />
a. Assess the success of PCR amplification and genotyping error rates for<br />
four microsatellite loci co-amplified in a single multiplex from bison fecal<br />
samples.<br />
b. Assess PCR amplification rates for and sequencing error rates for an<br />
mtDNA control region sequence from bison fecal DNA samples.<br />
In chapter 3, my objectives were the following:<br />
1) Evaluate population structure among the GYA bison using mtDNA amplified<br />
from bison feces.<br />
a. Test for genetic differences among the three breeding groups within YNP<br />
bison.<br />
b. Test for genetic differences between YNP and GTNP bison populations.<br />
Summary and Synthesis<br />
We had high amplification success (97%) and low error rates (4%), excluding two<br />
extremely poor quality samples, for genotyping using four microsatellite loci in a single<br />
multiplex PCR amplification. These results suggest that at least 25% more fecal samples<br />
should be collected than are necessary to insure adequate sample sizes. A single<br />
multiplex PCR using three to four microsatellite loci should be used to initially screen<br />
samples for quality before they are included in a full population genetics study. We<br />
8
demonstrated that multiplex PCR can be efficiently employed for amplifying several loci<br />
at once from fecal DNA samples, screening for sample quality, and genotyping individual<br />
bison, while achieving low genotyping error rates. Microsatellite genotyping error rates<br />
can be further reduced by screening many loci and using only those with low error rates,<br />
(error rates varied among loci from 1% to 8%).<br />
The per nucleotide error rate for mtDNA amplified from feces has not been<br />
previously published for any species. For our mtDNA study, we detected an error rate of<br />
0.0005 nucleotide mis-incorporations across all samples. This is approximately five times<br />
higher than published error rates for high quality DNA sources with the Platinum taq we<br />
used in our PCR amplification (0.0001) (Tindall and Kunkel 1988). We successfully<br />
identified haplotypes for 120 of 127 individuals through mtDNA sequencing. Sequencing<br />
of the mtDNA control region, and RFLP analysis, revealed two haplotypes among 179<br />
bison sampled from both parks over two consecutive rut seasons. The 470 bp sequence<br />
we amplified matched with the first 408 bp of haplotypes 6 and 8 previously defined by<br />
Ward et al. (1999).<br />
The frequencies of haplotypes 6 and 8 among the GYA breeding groups revealed<br />
surprising strong evidence for genetic population structure. Significant differentiation<br />
was detected between YNP and GTNP bison populations (FST = 0.191, p < 0.001).<br />
However, the most intriguing result was the substantial genetic differences we found<br />
among breeding groups within YNP. The differentiation between the Lamar Valley and<br />
Hayden Valley was nearly twice that found between the parks (FST = 0.367, p < 0.001).<br />
And, the differences in haplotype frequencies between Mirror Plateau and Hayden Valley<br />
breeding groups were higher than between the parks as well (FST = 0.231, p < 0.001).<br />
9
The highly differentiated population structure observed among the YNP breeding<br />
groups suggests female philopatry to natal ranges. However, this begs the question; why<br />
would bison exercise this behavior at such a fine scale? Is female philopatry a response to<br />
limited resources within the park, or have these modern bison carried on historical<br />
movement patterns of their ancestors? The long distance migrations of immense herds of<br />
bison across the plains were well documented prior to their near extirpation (McHugh<br />
1972; Barsness 1985). The GYA bison exhibit fairly predictable, limited seasonal<br />
migratory movements that may represent a microcosm of bison migration patterns of the<br />
past. Future genetic studies using DNA extracted from historic bison skulls found within<br />
the GYA, and collaboration with archeologists may provide answers to some of these<br />
questions (Cannon 2001; Cannon 2007).<br />
This history of bottlenecks and founder events, rather than natural bison ecology,<br />
may provide the most plausible explanation for the lower genetic differentiation we<br />
observed between the YNP and GTNP bison populations. Bison from YNP were used to<br />
found the GTNP bison population in 1948 (USDOI-NPS et al. 1996). In 1963, brucellosis<br />
was discovered in the GTNP bison population, which had been maintained between 15 to<br />
30 animals, the herd was subsequently reduced to nine calves, and supplemented a year<br />
later with 12 adult bison from Theodore Roosevelt National Park (TRNP) (USDOI-NPS<br />
et al. 1996). The TRNP population was founded by bison from Ft. Niobrara National<br />
Wildlife Refuge (FNNWR), which has only haplotype 6 (Ward et al. 1999). Both TRNP<br />
and FNNWR have evidence of hybridization with cattle (Halbert and Derr 2007).<br />
Therefore, the rate and direction of gene flow between GTNP and YNP should be further<br />
10
investigated using microsatellite loci, along with additional surveillance for<br />
hybridization.<br />
The field collection, laboratory, and molecular genetic techniques and protocols<br />
developed through this study provide an approach that will allow an expanded assessment<br />
of genetic diversity and population structure for the GYA bison. The high amplification<br />
success and low error rates we achieved demonstrate that non-invasive fecal DNA<br />
sampling is a viable approach for conducting population genetic studies of free ranging<br />
bison. This study has provided evidence for population structure among the GYA<br />
breeding groups, advanced the field of non-invasive studies in wildlife, and opened the<br />
door to future studies that will provide crucial information for the genetic conservation<br />
and ecological restoration of wild bison.<br />
11
Figure 1-1. Map of YNP showing locations of bison breeding groups as described by<br />
Meagher 1973, Taper and Meagher 2000, Meagher et al. 2002 (GYA map from USDOI-<br />
NPS 2007)<br />
West capture site<br />
Hayden Valley<br />
breeding group<br />
Antelope Flats<br />
breeding group<br />
North capture site<br />
Lamar Valley<br />
breeding group<br />
Mirror Plateau<br />
breeding group<br />
Wolf Ridge Road<br />
breeding group<br />
12
Chapter 2.<br />
Non-invasive fecal DNA sampling and low genotyping<br />
error rates in the Greater Yellowstone Area bison.<br />
Abstract: We assessed the feasibility of non-invasive fecal sampling in the Greater<br />
Yellowstone Area (GYA) bison using four microsatellite loci co-amplified in a multiplex<br />
PCR and a 470 bp mitochondrial DNA (mtDNA) control region sequence. Individual<br />
samples had significantly different error rates (p < 0.01). This was caused primarily by<br />
two samples that had relatively low amplification success and high error rates.<br />
Amplification success for all PCR amplifications was 92%, and increased to 97% after<br />
removing the two poor quality samples. Microsatellite genotyping error rates averaged<br />
14%, and were reduced to 4% after removing these two samples. We detected no<br />
significant difference in error rates between DNA extractions. However, there were<br />
significantly different error rates among the four microsatellite loci (p < 0.02). We<br />
successfully identified mtDNA haplotypes for 94% of individuals sequenced. For<br />
mtDNA sequencing, the nucleotide mis-incorporation rate during PCR was 0.0005 per bp<br />
across all 127 individual samples (including 470 bp per sample). This study demonstrated<br />
the feasibility of using non-invasive fecal DNA sampling in wild bison. The techniques<br />
and protocols we developed will be useful for future population genetic studies that will<br />
provide answers to questions regarding the ecology and evolution of wild bison, and<br />
information crucial to their conservation.<br />
13
INTRODUCTION<br />
Wild bison are at risk of genomic deterioration as a result of population<br />
bottlenecks, hybridization, and domestication (Freese et al. 2007). The Greater<br />
Yellowstone Area (GYA) bison represent two of only three remaining populations in the<br />
U.S. without hybridization with cattle (Freese et al. 2007; Halbert and Derr 2007).<br />
Knowledge regarding the distribution of genetic diversity among bison would help<br />
managers to conserve the diversity remaining in bison. GYA bison breeding groups,<br />
which congregate during the summer breeding season, should be targeted for sampling to<br />
evaluate genetic population structure because this is when most gene flow between these<br />
groups occurs. Unfortunately, traditional invasive methods of obtaining blood or tissue<br />
samples by capturing free ranging bison are extremely difficult, costly, and dangerous for<br />
both the bison and research personnel. Traditional sampling entails a high risk of<br />
physiological stress and potential mortality associated with immobilizing agents.<br />
We developed an alternative approach for acquiring DNA samples from wild<br />
bison in the field. Non-invasive fecal sampling has been used, with a high degree of<br />
success, in studies of ungulates, such as alpine ibex (Capra ibex) and Corsican mouflon<br />
(Ovis musimon), bighorn sheep (Ovis canadensis) (Maudet et al. 2004; Luikart et al.<br />
2007). Benefits of fecal sampling in wild, free ranging animals, such as bison, are three<br />
fold. First, individuals may be observed at safe distances for social dominance ranking,<br />
sex, and age group prior to collection of feces, thus, providing an opportunity to collect<br />
additional data, without disturbing individuals of interest. Second, fecal samples provide<br />
information for infectious diseases (i.e. bacteria, viruses, and parasites, etc.), diet, or<br />
hormone status (e.g. pregnancy or stress) (Borjesson et al. 1996; Möstl and Palme 2002;<br />
14
Waits and Paetkau 2005). Third, non-invasive fecal sampling can be used to address<br />
questions regarding population genetics of free ranging bison populations.<br />
DNA amplification from fecal samples (as well as other non-invasive sample<br />
types) often yields high genotyping error rates. However, seasonal differences in forage<br />
quality affect genotyping error rates in ungulates. Therefore, genotyping error rates may<br />
be higher in spring and summer due to forage quality (Maudet et al. 2004). An<br />
assessment of genetic variation and substructure among GYA bison breeding groups<br />
requires sampling during summer months, when genotyping error rates might be highest<br />
due to forage quality (Maudet et al. 2004). Bison typically form pie-shaped fecal<br />
depositions that are likely more difficult to extract DNA from compared to fecal pellets<br />
(Manel et al. 2004). However, non-invasive fecal DNA sampling has been successfully<br />
employed for genetic studies in African and Asian elephants, which form dung piles<br />
larger than bison feces (Vidya et al. 2005; Archie et al. 2006).<br />
The primary objective of this study was to develop and evaluate non-invasive<br />
fecal sampling techniques to facilitate genetic studies of free ranging bison. We<br />
quantified PCR amplification success, microsatellite genotyping error rates, and mtDNA<br />
sequencing error rates from bison fecal DNA samples.<br />
METHODS<br />
Sampling and extraction<br />
Matched blood and fecal samples were collected from eight radio-collared female<br />
adult bison by the YNP Bison Ecology Program staff in September 2006. Each fecal<br />
15
sample was extracted twice using the extraction process described below (Fig. 1). Each<br />
extraction was genotyped five times with four microsatellite loci.<br />
Blood samples were applied to Whatman © FTA cards according to manufacturer’s<br />
instructions. For DNA recovery for PCR, we used two separate punches from each FTA<br />
card that were purified according to manufacturers’ instructions. Two independent<br />
extractions (purifications) per individual were genotyped with the four microsatellite loci.<br />
Fecal samples for mtDNA studies were collected from 127 bison within YNP and<br />
GTNP, during the rut (July 2006). Most samples (~ 5 grams) were collected within 10-<br />
15 minutes of defecation and placed into vials containing ~20 mls of 95% ethanol<br />
(ETOH), and immediately placed into portable coolers until frozen at -20º C for up to 1<br />
year prior to extraction in a laboratory designated for non-invasive samples.<br />
All fecal extractions were carried out in a designated non-invasive laboratory.<br />
Each of the eight fecal samples was extracted twice for microsatellite analyses, and 127<br />
fecal samples only extracted once mtDNA studies. Sterile filter tips, transfer pipettes,<br />
collection tubes, and microtubes were used. The QIAamp © Stool Mini Kit (QIAGEN)<br />
was used to extract genomic DNA from all fecal samples according to manufacturer’s<br />
protocol with modifications as described below. Fecal samples were mixed well to insure<br />
relatively homogeneous distribution of cellular material prior to sub-sampling for<br />
extraction.<br />
We transferred approximately 1.5 to 2 ml of fecal suspension into Eppendorf<br />
microtubes which were centrifuged at 16,100 rcf (relative centrifugal force) for 5<br />
minutes. As much ethanol as possible was drawn off, leaving behind approximately 200<br />
μl of feces required for the QIAamp © extraction protocol. The QIAamp protocol was then<br />
16
carried out with one last modification. The final elution of DNA was repeated by passing<br />
the eluate through the column once more. This last step was modified in an attempt to<br />
recover as much DNA as possible. The tubes were centrifuged for one minute at 16,100<br />
rcf. Negative extraction controls, containing sterile distilled water, were used along with<br />
each set of fecal extractions to monitor for possible cross contamination.<br />
Microsatellite PCR and genotyping error rates<br />
We screened a set of 36 microsatellite loci for use with fecal DNA samples,<br />
which were previously used in other genetic studies of bison (Halbert (2003). Only loci<br />
that were previously found to have a minimum heterozygosity of 0.50 in GYA bison<br />
were used to provide high power for future population genetic studies. We identified four<br />
dinucleotide loci with allele ranges less than 200 bp, BM 711(157-163 bp; NED),<br />
BM2113 (123-143 bp; NED), BMS1001 (101-109 bp; 6- FAM), and BMS2258 (123-144<br />
bp; VIC) for use in a single multiplex PCR to estimate genotyping error rate (Appendix<br />
1).<br />
Multiplex PCR was carried out in 10 μl volumes containing 2 μl sterile HPLC<br />
H2O, 5 μl QIAGEN Multiplex PCR Mix, 1 μl QIAGEN Q-Solution, 1 μl 10x primers<br />
(Table 1), and 1 μl template DNA. PCR was performed in an MJ Research PTC-200<br />
Peltier Thermal Cycler using the following touchdown profile: 95º C for 5 min, followed<br />
by one cycle of 94º C for 30 s, 58º C for 1 min 30 s, and 72º C for 20 s. For the<br />
subsequent 19 cycles, all conditions remained the same except that the annealing<br />
temperature decreased by 0.5 degrees per cycle. This was followed by 26 cycles of 94º C<br />
for 30 s, 48º C for 1 min 30 s, and 72º C for 20 s. The profile concluded with a single<br />
extension of 72º C for 10 min.<br />
17
Fragment analysis was carried out on an ABI 3130xl using the GS-600 LIZ size<br />
standard and GeneMapper v3.7 software was used to size fragments and call alleles for<br />
each locus. Peaks less than 50 relative fluorescent units were not scored. Two people<br />
independently scored all electropherograms for each locus. True genotypes were assumed<br />
to be those obtained from DNA amplified from high quality blood samples.<br />
Amplification success (AS) was calculated by the proportion of PCR amplifications that<br />
resulted in a scoreable genotype. Allelic dropout (AD) rate was inferred when a<br />
homozygous genotype was scored for a heterozygous individual known from analysis of<br />
the corresponding blood sample. Allelic dropout rate was computed as the proportion of<br />
all genotypes among loci and individuals with a dropout. False alleles (FA) were inferred<br />
when a different allele was observed in a replicate PCR compared to true genotype<br />
known from blood.<br />
A generalized linear mixed model (GLMM) was used to test for differences in<br />
error rates among individual samples, loci, and between extractions per Steele (1996),<br />
and implemented using Gauss 7.0 Aptech Systems (http://www.aptech.com/). GLMM<br />
allows us to broaden the scope and inference of the individual samples used for<br />
evaluating genotyping error rate to the “population” of samples randomly collected in the<br />
field (Steele and Hogg 2003).<br />
mtDNA PCR and error rate<br />
We surveyed NCBI-GenBank and relevant literature to identify a short (< 500 bp)<br />
mtDNA sequence that could potentially be amplified from bison feces. Alignment of<br />
bison mtDNA D-loop sequences; AF083357 through AF083364 (Ward et al. 1999),<br />
CIC1 and CIC2 (Vogel et al. 2006) in MEGA 3.1 (Kumar et al. 2004), reveals 10 unique<br />
18
B. bison haplotypes and twelve variable sites within a 408bp section of this region.<br />
Primers BISCR-16348F and BISCR-16990R were used to amplify the first 470 bp of the<br />
mtDNA control region (Vogel et al. 2006). These same primers were used by Shapiro et<br />
al. (2004) to amplify this same region of the D-loop from fossil Bison bison bones<br />
ranging in age from modern to >60 ka BP.<br />
Primers BISCR-16348F 5'-CTACAGTCTCACCGTCAACCC-3' and BISCR-<br />
16990R 5'-GATGAGATGGCCCTGAAGAA-3' were used to amplify a 470 bp segment<br />
of the bison mtDNA control region (Shapiro et al. 2004; Vogel et al. 2006). PCR was<br />
carried out in 25 μl volumes containing; 8.95 μl sterile HPLC H2O, 2.5 μl<br />
Invitrogen © 10X PCR buffer, 1 μl dNTP’s, 0.5 μl of each primer, 2.5 μl BSA (2ng/μl),<br />
1.25 μl MgCl (50 mM), 0.3 μl Invitrogen © Platinum Taq Polymerase (5 units/μl), and 7.5<br />
μl of template DNA. PCR was performed in an MJ Research PTC-200 Peltier Thermal<br />
Cycler using the following touchdown protocol: 94º C for 5 min, followed by one cycle<br />
of 94º C for 30 s, 60º C for 30 s, and 72º C for 30 s. For the subsequent 10 cycles, all<br />
conditions remained the same except that the annealing temperature decreased by 0.5<br />
degrees per cycle. This was followed by 25 cycles of 94º C for 30 s, 55º C for 30 s, and<br />
72º C for 30 s. The profile concluded with a single extension of 72º C for 5 min.<br />
PCR products were purified using QIAquick © purification columns according to<br />
manufacturers’ instructions with one exception; the final elution was carried out with 20<br />
μl of Buffer EB instead of the recommended 30-50 μl to compensate for potential low<br />
quantity template DNA . The amount of purified post-PCR product was quantified by<br />
fluorometry prior to sequencing to insure that 5-10 ng/μl of amplified DNA was present<br />
in the sample. Sequencing was performed on the ABI 3100xl sequencer. Sequences were<br />
19
visualized, assessed for quality, and edited with Chromas 2.31<br />
(http://www.technelysium.com.au/chromas.html). MEGA 3.1 (Kumar et al. 2004) was<br />
used to align edited mtDNA sequences with known bison haplotypes. Comparison of<br />
sequence nucleotide variation at known variable sites determined the haplotype of each<br />
sample. PCR was repeated for sequences that matched a known haplotype at all known<br />
variable sites, but had nucleotide mis-incorporations at other sites, to rule out the<br />
existence of novel haplotypes. Repeated PCR amplification and sequencing was<br />
performed to resolve these ambiguities and determine the correct haplotype for those<br />
samples.<br />
Ambiguous sequences that could not be scored primarily due to numerous<br />
overlapping nucleotide peaks were re-extracted, PCR amplified, and sequenced again to<br />
determine the correct haplotype. Samples that repeatedly yielded ambiguous sequences<br />
post re-extraction were not assigned haplotypes. The per nucleotide error rate for mtDNA<br />
amplified from feces has not been previously published. We estimated the nucleotide<br />
mis-incorporation error rate is the number of erroneous nucleotide mis-incorporations<br />
(that occurred during PCR) divided by the total number of nucleotides sequenced.<br />
RESULTS<br />
Microsatellite loci<br />
Individual sample quality had a significant overall effect on microsatellite<br />
genotyping error rates (p < 0.01) (Table 1). Two samples contributed to the majority of<br />
genotyping errors. The combined errors from these two samples accounted for 34 of 72<br />
(47%) allelic dropout errors and produced the one false allele. Removal of these two<br />
20
individuals from the data set decreased the total overall genotyping error rate from 15%<br />
to 5% across all loci and samples, and increased amplification success from 92% to 97%<br />
(Table 1). There were no significant differences in error rates between extractions. This<br />
provided evidence that our extraction techniques are relatively consistent across all<br />
samples.<br />
There were significant differences in error rates among loci (p < 0.01) (Table 1).<br />
Error rates varied among loci from 12% to 20%, and were reduced to 1% to 8% when<br />
YELL-024 and YELL-030 are excluded from the analysis. Even with the exclusion of the<br />
two poor quality samples from the GLMM, we still detected significant differences in<br />
error rates among loci (p < 0.02). We observed no tendency for larger alleles to have<br />
higher error rates. BM 711, which has the largest allele range (157-163), produced fewer<br />
errors than loci in the median range (BM2113; 123-143 and BMS2258; 123-144). Within<br />
loci, we found no association between larger allele size and error rates.<br />
mtDNA and error rate<br />
We obtained sequences from 120 samples (94%) that matched with the first 408<br />
bp of two sequences previously identified as haplotypes 6 and 8 (GenBank accessions<br />
AF083362 and AF083364) by Ward et al. (1999). There are four base-pair differences<br />
between these two haplotypes, and three variable sites; two of which are single nucleotide<br />
polymorphisms (SNP’s), and one insertion-deletion.<br />
The remaining seven samples produced ambiguous sequences that were not<br />
scoreable due to multiple overlapping nucleotide peaks. The initial PCR for two of these<br />
samples yielded poor quality ambiguous sequences. Therefore PCR and sequencing was<br />
repeated. Two of these samples produced abbreviated or fragmented sequences that<br />
21
aligned with less than two out of three diagnostic sites, after a second PCR amplification.<br />
The remaining five samples consistently produced sequences with multiple overlapping<br />
nucleotide peaks, which precluded alignment with any haplotype. Multiple attempts<br />
involving repeated extraction, PCR amplification, and sequencing failed to resolve this<br />
issue for those samples.<br />
Ambiguous sequences that matched a haplotype at all three diagnostic sites, but<br />
had random nucleotide mis-incorporations at other sites, occurred in 4% of all samples.<br />
Haplotypes were not identified for these samples until repeated PCR and sequencing<br />
yielded a sequence that unambiguously aligned with a known haplotype without mis-<br />
incorporations at other sites within the sequence. The nucleotide errors were resolved for<br />
all of these samples on the second PCR. The per-nucleotide error rate was low for all of<br />
these samples, with the overall per-nucleotide error rate across all samples being 0.05%<br />
DISCUSSION<br />
We successfully extracted and amplified DNA from all eight matched fecal<br />
samples. However, because two samples had exceptionally high error rates, we<br />
recommend that future studies screen samples and exclude those that yield low<br />
amplification and high error rates. Thus, it is important to collect many extra fecal<br />
samples in the field to insure that there are sufficient high quality samples available for<br />
genetic study of interest. For bison, it may be necessary to collect at least 25% more fecal<br />
samples than what is needed to insure an adequate number are available for genetic<br />
analyses.<br />
22
We successfully optimized a multiplex (4-locus) PCR. This is important because<br />
multiplexing is especially challenging for poor quality DNA samples, and not widely<br />
used in non-invasive studies, but can greatly reduced time and cost of analyses while<br />
consuming less DNA (which is limited in low quality non-invasive samples). A single<br />
multiplex PCR allows for rapid screening to identify fecal samples with sufficiently high<br />
quality or quantity of template DNA. We recommend that future non-invasive studies<br />
use multiplexes, which was facilitated here by the use of QIAGEN Multiplex PCR kit.<br />
Only two other studies that employed noninvasive fecal DNA sampling for<br />
species that have non-pellet form feces reported higher amplification and lower error<br />
rates than we found in our study (Appendices 2-2 and 2-3). Fernando et al. (2003)<br />
reported amplification success of 97.5 to 100%, for six microsatellite loci, which were<br />
slightly higher than our overall AS rate (excluding poor quality samples). Our AD rate<br />
(4%) was nearly twice that reported by Fernando et al. (2%). Parsons (2001) reported a<br />
slightly higher AS rate (98.1%) than our study and a lower error rate (2%) for bottlenose<br />
dolphins (Tursiops truncatus). However, a noninvasive study of harbor seals (Phoca<br />
vitulina) reported very a low AS rate (60%) relative to our results (Reed et al.1997).<br />
The AS rate (97%) we achieved was also much higher than that found in<br />
noninvasive studies of African and forest elephants which ranged from 60% to 72%<br />
(Appendix 2-1) (Eggert et al. 2003; Fernando et al. 2003; Buchan et al. 2005). The rate<br />
of AD for African elephants ranged from 15% to 25% across 12 loci, and an average of<br />
15% AD rate was reported for 7 loci amplified from forest elephant feces (Appendix 2-<br />
2). Our AS rates were much higher, and AD error rates were lower those reported for<br />
terrestrial carnivore species such as wolves (Canis lupus), coyotes (Canis latrans,), black<br />
23
ears (Ursus americanus), and brown bears (Ursus arctos) as well (Appendices 2-1 and<br />
2-2) (Wasser et al. 1997; Kohn et al. 1999; Lucchini et al. 2002; Murphy et al. 2002).<br />
Noninvasive fecal DNA studies in primates reported the lowest AS and highest AD rates<br />
relative to our study results (Appendices 2-1 and 2-2) (Bradley et al.2000; Lathuillière et<br />
al. 2001; Morin et al. 2001).<br />
We found no large effect of extractions to error rates. Therefore, only one<br />
extraction per fecal sample is necessary prior to screening for quality. It would be much<br />
more cost effective and efficient to perform one extraction, and screening for sample<br />
quality with a single multiplex PCR, before using a sample for complete genetic studies.<br />
For mtDNA, we successfully amplified high quality sequences from 93% of fecal<br />
DNA extracts on the first attempt. Sequences that produced nucleotide mis-<br />
incorporations that did not match any previously described haplotypes were PCR<br />
amplified and sequenced at least once more. This resolved all nucleotide mis-<br />
incorporation errors. Seven apparently low quality samples yielded ambiguous sequences<br />
with multiple overlapping nucleotide peaks. Repeated PCR amplification and sequencing<br />
did not resolve this issue. However, our success rate for amplifying scoreable haplotypes<br />
was much higher than for scoreable microsatellite genotypes. The higher success is most<br />
likely due to the fact that mtDNA occurs in multiple copies within each cell. Therefore,<br />
mtDNA studies from fecal samples may require collection of only about 10% more<br />
samples in the field than necessary, as opposed to 25% more for microsatellite studies.<br />
The per nucleotide error rate (0.0005) for fecal DNA generated by our study<br />
demonstrates that caution must exercised in identifying new haplotypes through<br />
sequencing. Our fecal DNA extracts produced higher than average nucleotide mis-<br />
24
incorporation error rate (0.0005) for the platinum taq polymerase (0.0001) used in our<br />
PCR amplifications (Tindall and Kunkel 1988). Samples that do not match previously<br />
identified haplotypes should be sequenced in both directions at least twice before the<br />
haplotype can be confirmed. An initial subset of fecal DNA extractions should be<br />
sequenced in both directions to screen for potential haplotype diversity before proceeding<br />
with full mtDNA studies. In addition, initial sequencing in both directions will determine<br />
whether individual haplotype assignment can be confidently determined from sequencing<br />
in only one direction for cost effectiveness.<br />
This study clearly demonstrates that non-invasive fecal DNA sampling is a<br />
feasible approach for conducting population genetic studies of wild bison. We achieved<br />
reasonably high amplification success and minimal error rates through strict adherence to<br />
systematically developed field and laboratory protocols. This will allow us to use non-<br />
invasive fecal DNA sampling in an efficient and cost effective manner. The results of this<br />
study further advance the field of non-invasive genetic sampling in wildlife while<br />
providing another example of the feasibility and usefulness of this approach.<br />
25
Figures:<br />
Figure 2-1. Flow diagram showing the two extractions per fecal sample, and five,<br />
multiplex PCR amplification (using four microsatellite loci) per extraction, and number<br />
of genotypings per individual radio-collared bison used to assess amplification and<br />
genotyping error rates.<br />
Fecal Sample<br />
Extraction<br />
Extraction 1 Extraction 2<br />
PCR<br />
5 Genotypes 5 Genotypes<br />
26
Tables:<br />
Table 2-1. Amplification success (AS), allelic dropout (AD) rates for all loci coamplified<br />
in the multiplex PCR. Total and average error rates were first estimated<br />
across all genotypings (loci and individuals), and then excluding data from two<br />
poor quality individual samples, YELL-024 and YELL-030.<br />
Average<br />
Extraction 1 Extraction 2 per locus Total Total errors<br />
Locus AS AD AS AD AS AD error rates w/o 024 & 030<br />
BM711 0.93 0.11 0.95 0.21 0.94 0.16 0.16 0.03<br />
BM2113 0.93 0.24 0.90 0.06 0.91 0.15 0.15 0.04<br />
BMS1001 0.95 0.18 0.98 0.05 0.96 0.12 0.12 0.01<br />
BMS2258 0.90 0.22 0.85 0.18 0.88 0.20 0.20 0.08<br />
Averages: 0.93 0.19 0.92 0.12 0.92 0.16 0.14 0.04<br />
Averages excluding<br />
YELL-024 & YELL-030: 0.97 0.21 0.97 0.04 0.97 0.12<br />
27
Table 2-2. Amplification success (AS), allelic dropout (AD) rates for all individual<br />
samples. Averages were first estimated across all individuals, and then excluding data<br />
from the two poor quality samples; YELL-024 and YELL-030.<br />
Average<br />
Extraction 1 Extraction 2 per sample Total<br />
Sample ID AS AD AS AD AS AD error rates<br />
YELL-003 1.00 0.08 1.00 0.00 1.00 0.04 0.04<br />
YELL-011 0.90 0.03 1.00 0.03 0.95 0.03 0.03<br />
YELL-017 1.00 0.03 1.00 0.00 1.00 0.01 0.01<br />
YELL-024 0.95 0.26 0.95 0.21 0.95 0.24 0.24<br />
YELL-030 0.90 0.22 0.88 0.23 0.89 0.23 0.23<br />
YELL-031 0.98 0.13 0.90 0.03 0.94 0.08 0.08<br />
YELL-038 0.98 0.00 0.95 0.00 0.96 0.00 0.00<br />
YELL-039 1.00 0.00 1.00 0.00 1.00 0.00 0.00<br />
Averages: 0.96 0.09 0.96 0.06 0.96 0.08 0.08<br />
Averages excluding<br />
YELL-024 & YELL-030: 0.98 0.20 0.98 0.04 0.98 0.12 0.05<br />
28
Appendices<br />
Appendix 2-1. Characteristics of microsatellite loci amplified in the multiplex PCR;<br />
primers, and chromosome location (Halbert 2003). Allele ranges, and number of alleles<br />
(NA) found in the eight radio-collared bison used to assess amplification success and error<br />
rates for this study.<br />
l<br />
Locus Primers<br />
Allele<br />
Size Range N A Chromosome<br />
BM711 F 5’- CAGCATCAGCAACTAACATAGG -3'<br />
R 5’- TGGACCATGAGGGAAGTCTC -3'<br />
157-163 3 8<br />
BM2113 F 5’- GCTGCCTTCTACCAAATACCC -3’ 123-143 4 2<br />
R 5’- CTTCCTGAGAGAAGCAACACC -3’<br />
BMS1001 F 5’- GAGCCAATTCCTACAATTCTCTT -3' 101-109 4 27<br />
R 5’- AGACATGGCTGAAATGACTGA -3'<br />
BMS2258 F 5’- CCAGCAGAAGAGAAAGATACTGA -3' 123-144 5 7<br />
R 5’- AGTGGTAGAACTTCCATCTCACA -3'<br />
Appendix 2-2. Amplification rates (AS) reported in our study and for other species with<br />
non-pellet form feces (Reed et al. 1997; Wasser et al. 1997; Kohn et al. 1999; Bradley et<br />
al. 2000; Lathuillière et al. 2001; Morin et al. 2001; Parsons 2001; Lucchini et al. 2002;<br />
Murphy et al. 2002; Eggert et al. 2003; Fernando et al. 2003; Buchan et al. 2005).<br />
AS rate<br />
100%<br />
80%<br />
60%<br />
40%<br />
20%<br />
0%<br />
Asian elephant<br />
Bottlenose dolphin<br />
American bison<br />
Wolf<br />
Coyote<br />
Brown bear<br />
Harbor seal<br />
Chimpanzee<br />
Species<br />
Macaque<br />
Black bear<br />
Forest elephant<br />
African elephant<br />
29<br />
Gorilla
Appendix 2-3. Allelic dropout (AD) rates reported in our study and for other species<br />
with non-pellet form feces (Morin et al. 2001; Parsons 2001: Lucchini et al. 2002;<br />
Murphy et al. 2002; Eggert et al. 2003; Fernando et al. 2003; Buchan et al. 2005).<br />
AD rate<br />
25%<br />
20%<br />
15%<br />
10%<br />
5%<br />
0%<br />
Asian elephant<br />
Bottlenose dolphin<br />
American bison<br />
Brown bear<br />
Forest elephant<br />
Species<br />
Wolf<br />
African elephant<br />
Chimpanzee<br />
30
Chapter 3.<br />
Genetic Population Structure in the Greater Yellowstone<br />
Bison Revealed by Mitochondrial DNA Analyses<br />
Abstract: The Greater Yellowstone Area (GYA) populations are crucial for conservation<br />
of wild bison (Bison bison). The GYA provides the only place in the United States where<br />
the ecology and population genetic structure of free ranging plains bison populations may<br />
be observed. There are three locations where breeding groups congregate within YNP<br />
during the rut season; Hayden Valley, Lamar Valley, and Mirror Plateau. Bison in Grand<br />
Teton National Park (GTNP) primarily congregate in Antelope Flats during the rut. Non-<br />
invasive sampling and mitochondrial DNA studies were conducted to assess population<br />
subdivision. We hypothesized that fidelity to breeding areas would result in genetic<br />
differences among GYA breeding groups. Non-invasive fecal samples were collected<br />
from bison within the geographic locations of breeding groups during two consecutive rut<br />
seasons. We used sequencing and restriction fragment length polymorphism (RFLP)<br />
analysis of a 470 bp segment of the bison mtDNA control region to assess population<br />
structure. We found substantial differentiation between YNP and GTNP populations (FST<br />
= 0.1912, p < 0.001). We also found substantial differences in haplotype frequencies<br />
between the Lamar Valley and Hayden Valley breeding groups (FST = 0.3667, p < 0.001).<br />
Within Hayden Valley haplotype frequencies were different between two consecutive<br />
years (FST = 0. 0536, p < 0.05). However, the genetic differences between the Lamar<br />
Valley and Hayden Valley were highly significant for both 2005 and 2006. The relatively<br />
31
strong fine scale genetic differentiation among breeding groups within YNP suggests<br />
female philopatry to natal ranges.<br />
INTRODUCTION<br />
The most immediate genetic threats to bison conservation are population<br />
bottlenecks, hybridization with cattle, domestication, and anthropogenic selection (Freese<br />
et al. 2007). The Yellowstone bison is one of only two or three remaining non-hybridized<br />
source U.S. populations for bison reintroduction and restoration (Freese et al. 2007).<br />
Previous genetic studies, using microsatellite loci, revealed that the GYA bison have a<br />
relatively high degree of genetic variation and no evidence of hybridization (Ward et al.<br />
1999; Halbert 2003; Halbert and Derr 2007). This previous study, which relied upon<br />
opportunistic sampling of bison on winter ranges outside park boundaries, suggested the<br />
presence of three subpopulations (or breeding groups) within YNP (Halbert 2003).<br />
An expanded assessment of population structure and gene flow between GYA<br />
bison populations, using mtDNA and direct sampling of breeding groups, would further<br />
knowledge of the distribution of genetic variation in the parks. There are three locations<br />
where breeding groups congregate within YNP during the rut season; Hayden Valley,<br />
Lamar Valley, and Mirror Plateau (Meagher 1973; Taper and Meagher 2000; Meagher et<br />
al. 2002; Geremia et al. 2005; Jones et al. 2006). Bison in Grand Teton National Park<br />
(GTNP) primarily congregate in Antelope Flats during the rut (USDOI-NPS and USFWS<br />
2007). However, a smaller group of bison are known to range around Wolf Ridge Road<br />
near Moran, Wyoming (S. Cain pers. comm., Supervisory Biologist, GTNP, 2006).<br />
32
Female philopatry to natal ranges can play an important role in determining the<br />
genetic structure of populations (Chesser 1991; Storz 1999). Philopatry has been<br />
documented in other ungulates such as roe deer (Capreolus capreolus), bushbuck<br />
(Tragelaphus scriptus), Svalbard reindeer (Rangifer tarandus platyrhynchus), and Soay<br />
sheep (Ovis aries) (Côté et al. 2002; Coltman et al. 2003; Nies et al. 2005; Wronski and<br />
Apio 2006). Bison have been observed to assemble in matrilineal groups which may<br />
include several generations of related individuals which travel together (McHugh 1972;<br />
Lott 2002; Halbert 2003). Social structure, polygyny, and dominance hierarchies have<br />
been documented in bison as well (Lott 2002; Gates et al. 2005). However, no studies<br />
have confirmed female philopatry in free ranging, wild bison through the use of genetic<br />
markers such as mtDNA.<br />
Mitochondrial DNA (mtDNA) is especially useful for genetic studies involving<br />
non-invasive fecal samples where a limited number of cells may be present in fecal<br />
samples. We used non-invasive fecal DNA sampling to minimize disturbance to bison<br />
activities, and improve our ability to collect a sample of DNA from a significantly large<br />
proportion of the respective breeding groups. Previous studies revealed 10 B. bison<br />
haplotypes and 12 variable sites within a 470 bp section of the bison mtDNA control<br />
region (Polziehn et al. 1995; Polziehn et al. 1996; Ward et al. 1999; Shapiro et al.2004;<br />
Vogel et al. 2006). The variability of the 470 bp sequence could prove useful for mtDNA<br />
studies in the GYA bison populations to assess population structure.<br />
The primary objective of this study was to assess population structure among the<br />
GYA bison using mtDNA amplified from bison feces. We hypothesize that because<br />
33
fidelity to breeding areas may be high, there should be genetic differences among bison<br />
breeding groups of the Yellowstone population, and between YNP and GTNP.<br />
METHODS<br />
Sample collection and storage<br />
We collected fecal samples from bison within the geographic range of each<br />
breeding group during the 2005 and 2006 breeding seasons. We determined the relative<br />
age class of individuals sampled through field observations of horn length and width,<br />
body size, and condition (especially for older animals). Social dominance ranking was<br />
recorded for individuals who displayed obvious behavioral clues such as displacement of<br />
other bison from foraging patches or wallowing pits, false charges, challenges for mates,<br />
and leading groups of other bison. Most samples (~ 5 grams) were collected within 10-15<br />
minutes of defecation and placed into vials containing approximately 20 ml of 95%<br />
ethanol, and placed into coolers for up to 8 hours before they were frozen. Fecal samples<br />
were stored frozen at -20º C for up to 1 year prior to extraction.<br />
Extraction<br />
All fecal extractions were carried out in a designated non-invasive laboratory.<br />
Sterile filter tips, transfer pipettes, and microtubes were used. The QIAamp © Stool Mini<br />
Kit (QIAGEN) was used to extract genomic DNA from all fecal samples according to<br />
manufacturer’s protocol with modifications. Negative extraction and PCR controls were<br />
used to monitor for possible contamination.<br />
34
PCR amplification<br />
Primers BISCR-16348F 5'-CTACAGTCTCACCGTCAACCC-3' and BISCR-<br />
16990R 5'-GATGAGATGGCCCTGAAGAA-3' (Shapiro et al. 2004; Vogel et al. 2006)<br />
were used to amplify a 470 bp segment of the bison mtDNA control region. PCR was<br />
carried out in 25 μl volumes containing; 8.95 μl sterile HPLC H2O, 2.5 μl<br />
Invitrogen © 10X PCR buffer, 1 μl dNTP’s, 0.5 μl of each primer, 2.5 μl BSA (2ng/μl),<br />
1.25 μl MgCl (50 mM), 0.3 μl Invitrogen © Platinum Taq Polymerase (5 units/μl), and 7.5<br />
μl of template DNA. Amplification was performed in an MJ Research PTC-200 Peltier<br />
Thermal Cycler using the following touchdown protocol: 94º C for 5 min, followed by<br />
one cycle of 94º C for 30 s, 60º C for 30 s, and 72º C for 30 s. For the subsequent 10<br />
cycles, all conditions remained the same except that the annealing temperature decreased<br />
by 0.5 degrees per cycle. This was followed by 25 cycles of 94º C for 30 s, 55º C for 30 s,<br />
and 72º C for 30 s. The profile concluded with a single extension of 72º C for 5 min.<br />
Sequencing<br />
PCR products were purified using QIAquick © purification columns according to<br />
manufacturers’ instructions with one exception; the final elution was carried out with 20<br />
μl of Buffer EB instead of the recommended 30-50 μl to compensate for potential low<br />
quantity template DNA . The amount of purified post-PCR product was quantified by<br />
fluorometry to insure that 5-10 ng/μl of amplified DNA was present for sequencing on<br />
the ABI 3100xl sequencer. Sequences were visualized, assessed for quality, and edited<br />
using Chromas 2.31 (http://www.technelysium.com.au/chromas.html). MEGA 3.1<br />
(Kumar et al. 2004) was used to align edited mtDNA sequences with known bison<br />
haplotypes.<br />
35
RFLP<br />
PCR amplification was carried out as described above and digested with Ssp1,<br />
which cuts haplotype 8, resulting in two fragments (372 bp and 98 bp in length).<br />
Restriction digests were conducted in 20 μl volumes consisting of 11.3 μl sterile HPLC<br />
water, 2 μl RE 10X buffer, 0.2 μl acetylated BSA (10μg/ μl), and 5 μl PCR product and<br />
incubated at 37ºC for four hours. Digested products were run out on 2% agarose gels for<br />
two hours. Gels were stained with ethidium bromide solution, and visualized using a<br />
Hitachi FMBIOII scanner. We used 16 samples from YNP 2006 previously identified as<br />
either haplotype 6 or 8 through sequencing as controls to test the accuracy of our RFLP<br />
analysis. A set of 12 YNP 2005 samples identified as haplotype 6 were re-screened to<br />
evaluate whether failure to digest could result in erroneous haplotype identification. No<br />
haplotype identification errors were detected, thus validating the accuracy of the RFLP<br />
analysis.<br />
Data analysis<br />
The combined results of sequencing and RFLP analysis were used to determine<br />
the frequency and distribution of these haplotypes among the GYA bison populations,<br />
and determine FST values. Significance of FST values were tested by contingency chi-<br />
square analyses for comparisons among YNP breeding groups, and between parks.<br />
RESULTS<br />
Sequencing revealed two mtDNA control region haplotypes, amplified from<br />
120 GYA bison fecal samples from the 2006 breeding season. These haplotypes matched<br />
the first 408 bp of haplotypes 6 and 8 previously defined by Ward et al. (1999). RFLP<br />
36
analysis was used to resolve between haplotypes for 59 bison fecal samples collected in<br />
2005.<br />
Significant differentiation was found between YNP and GTNP populations (FST<br />
= 0.191, p < 0.001). Haplotype 6 was the most common in both parks, while haplotype 8<br />
was found only in 34 YNP bison samples tested, occurring most frequently in Lamar<br />
Valley (0.54) and Mirror Plateau (0.38), and least common in Hayden Valley 2005 and<br />
2006 (0.10 and 0.00, respectively) (Table 3-1).<br />
Among YNP breeding groups, we found substantial differentiation between the<br />
Lamar Valley and Hayden Valley (FST = 0.367, p < 0.001). The bison sampled in Mirror<br />
Plateau were more similar to the Lamar Valley breeding group (FST = 0.026) than they<br />
were to bison sampled in Hayden Valley 2005 and 2006 (FST = 0.103, and FST = 0.231,<br />
respectively, Table 3-2).<br />
Within Hayden Valley, haplotype frequencies were different between two<br />
consecutive years (FST= 0.054, p < 0.05). Haplotype 6 was found in 87% of bison<br />
samples tested from Hayden Valley in 2005, and in 100% of samples tested from Hayden<br />
during 2006 (Table 3-1). However, the genetic differences between Hayden Valley<br />
(2005) and Lamar Valley were significant for both years (2005: FST= 0.218, p < 0.001,<br />
2006: FST = 0.367, p < 0.001, Table 3-2).<br />
DISCUSSION<br />
The frequency of mtDNA control region haplotypes among the GYA bison<br />
provided strong evidence for genetic differentiation among breeding groups (Fig. 3-1).<br />
One of the most striking results of this study was the substantial differentiation we found<br />
37
etween the Lamar Valley and Hayden breeding groups. This was perhaps surprising for<br />
several reasons. First, in 1936, 71 bison were translocated from Lamar Valley to Hayden<br />
Valley and the Firehole, where bison had been absent for over 30 years (McHugh 1972;<br />
USDOI, NPS 2000; Gates et al. 2005). Assuming that this translocation captured a fair<br />
representation of haplotype frequencies present within Lamar during this time, we might<br />
expect little differentiation between these two groups. Second, bison are highly mobile<br />
and have been known to travel long distances in a short period of time (Carbyn 1997),<br />
and Hayden and Lamar Valleys are separated by less than 50 kilometers.<br />
However, the difference in haplotype frequencies between Hayden and Lamar<br />
breeding groups may not be all that surprising when we consider the role of female<br />
philopatry in determining genetic differentiation. Female philopatry has been observed in<br />
other highly mobile ungulate species such as roe deer (Capreolus capreolus), bushbuck<br />
(Tragelaphus scriptus), Svalbard reindeer (Rangifer tarandus platyrhynchus), desert<br />
bighorn sheep (Ovis canadensis nelsoni), and Soay sheep (Ovis aries) (Côté et al. 2002;<br />
Coltman et al. 2003; Epps et al. 2005; Nies et al. 2005; Wronski and Apio 2006). Female<br />
philopatry to natal ranges can play an important role in determining the genetic structure<br />
of populations (Chesser 1991; Storz 1999).<br />
Marked animal re-location data recorded for adult female bison from the central<br />
range reveals occasional movements west and north out of YNP park boundaries during<br />
winter months (Gates et al. 2005). However, these marked bison always return to the<br />
central range during the summer rut season (Gates et al. 2005). For example, YELL-011<br />
(a radio-collared adult female identified as haplotype 6) has been documented to travel to<br />
the northern range during winter month, and primarily range within Hayden Valley<br />
38
during summer rut season (Gates et al. 2005). Interestingly, Christianson et al. (2005)<br />
found significant differences in incisor wear, between female bison from the northern and<br />
central ranges of YNP suggesting limited exchange of individuals between the ranges.<br />
Differences in incisor wear were attributed to increased levels of fluoride content in<br />
vegetation and water within central Yellowstone’s geothermal areas (Shupe et al. 1984;<br />
Christianson et al. 2005)<br />
. Finally, the diverse historic origins of the Lamar Valley bison, relative to the<br />
Hayden Valley herd, may explain, in part, the differences in haplotype frequencies we<br />
observed here. By 1902, YNP’s wild bison herd had been reduced from 200-300, through<br />
illegal poaching, to about 25 animals that remained in Pelican Valley. This led to a<br />
decision to introduce 21 bison from other sources into Lamar Valley that same year<br />
(McHugh 1972; USDOI, NPS 2000; Gates et al. 2005). However, the Hayden Valley<br />
bison descended from a single translocation of 71 individuals from Lamar Valley in 1936<br />
that may not have captured the range of haplotype frequencies that were present in these<br />
bison during that time.<br />
We also observed differences in haplotype frequencies within Hayden Valley<br />
between two consecutive breeding seasons. However, we found strong differences<br />
between Hayden and Lamar breeding groups for both years (Table 3-2). A few radio-<br />
collared adult females have been observed to move between Hayden Valley and Pelican<br />
Creek during late summer and early fall (R. Wallen, Bison Ecologist, YNP, pers. comm.<br />
2007). Re-location data from YELL-024 (an adult female identified as haplotype 8),<br />
reveal movements between Hayden Valley and Pelican Creek during late summer and<br />
early fall (R. Wallen, pers. comm. 2007). The lower FST values between Mirror Plateau<br />
39
and Lamar Valley, in comparison to the higher values between these groups and Hayden<br />
Valley (2005 and 2006) suggest that genetic exchange between Mirror Plateau and Lamar<br />
Valley bison may occur more frequently than with central range animals (Table 3-2).<br />
These data suggest a possible stepping-stone pattern of gene flow within YNP,<br />
whereby genetic exchange is more likely to occur between adjacent subpopulations (or<br />
breeding groups) than geographically distant ones. Therefore, because adjacent<br />
subpopulations are more similar, genetic drift will have more of an effect and result in<br />
greater differentiation among breeding groups in this model of gene flow. This observed<br />
pattern of genetic differentiation is in contrast to the conclusions of Meagher et al. (2002)<br />
who suggested that bison that previously ranged between Mirror Plateau and Pelican<br />
Valley may have assimilated into the Hayden Valley bison after the mid to late 80’s.<br />
Their conclusions were based on observations of large congregations of bison within<br />
Hayden Valley during the rut, from air surveys conducted during 1983 to 2001. However,<br />
the possible pattern of gene flow among YNP breeding groups, as suggested by the<br />
observed haplotype frequencies, does appear to match closely with historic bison travel<br />
routes described by Meagher (Taper et al. 2000; Gates et al. 2005). Therefore, the current<br />
YNP bison population may be carrying on historical movement patterns of their<br />
ancestors, which in turn has contributed to the pattern of genetic differentiation we<br />
observed with mtDNA haplotypes.<br />
Significant genetic differentiation between GTNP and YNP was found<br />
previously by Halbert (2003) using 49 microsatellite loci (FST = 0.102). The FST (0.191)<br />
we found for mtDNA was only twice that estimated from Halbert’s microsatellite data.<br />
This difference is lower than would be expected, however, since mtDNA generally<br />
40
epresents only about 25% the effective population size of nuclear DNA (Birky et al.<br />
1983; Allendorf and Luikart 2007). Furthermore, the FST values within YNP among<br />
breeding groups, at a fine scale, were much higher (with the exception of Mirror Plateau<br />
and Lamar Valley, FST = 0.026) than between GTNP and YNP, which are approximately<br />
five times further apart (Table 3-2).<br />
The FST value (0.191, p < 0.001) between GTNP and YNP may be attributed to<br />
both the history of these populations and limited gene flow. There are isolated accounts<br />
of a few individual bison from YNP traveling to GTNP. During the winter of 1996/97,<br />
one adult female accompanied by two juvenile females from YNP were discovered on a<br />
groomed road heading toward GTNP (S. Cain pers. comm. 2006). These females were<br />
radio-collared to track their movements. They became permanent residents of the GTNP<br />
herd, and subsequently bred within this population. A single bull from YNP migrated<br />
between the parks outside of the breeding season (S. Cain pers. comm. 2006; R. Wallen<br />
pers. comm. 2006). No migration of bison from GTNP to YNP has been documented.<br />
The FST (0.191) value observed between YNP and GTNP, and the absence of haplotype 8<br />
within GTNP may be explained by the history of bottlenecks and supplementation<br />
experienced by these bison.<br />
The GTNP bison herd originated in 1948 from 20 animals brought in from<br />
Lamar Valley, YNP, which may have resulted in similar haplotype frequencies between<br />
GTNP and YNP. Furthermore, in 1963 when brucellosis was discovered, all 13 adults<br />
were destroyed, leaving only nine calves. The following year, GTNP received 12 adult<br />
bison from the TRNP bison herd, which originated from Ft. Niobrara National Wildlife<br />
Refuge (FNNWR) which contains only haplotype 6 (Ward et al. 1999).<br />
41
The differences in haplotype frequencies among YNP breeding groups may be<br />
attributed to both the natural biology of free ranging bison populations and the historical<br />
origins of these bison. However, the history of the GTNP herd may be playing a greater<br />
role than the natural ecology of wild bison in determining the genetic differences we<br />
observed between the YNP and GTNP populations. Additional sampling should be<br />
collected within the same locations for at least one more consecutive breeding season to<br />
further evaluate temporal stability of mtDNA haplotype and microsatellite allele<br />
frequencies among GYA breeding groups.<br />
Estimating the rate and direction of gene flow between YNP and GTNP may be<br />
especially important with respect to issues such as disease transmission, and the transfer<br />
cattle genes to a non-hybridized bison population. No evidence of hybridization with<br />
cattle has been found in either YNP or GTNP bison in other studies (Halbert and Derr<br />
2007). Also, we did not detect any cattle haplotype among the samples tested for this<br />
study. However, the GTNP bison originate, in part from herds where hybridization is<br />
known to exist. There is no way to know whether the bison translocated from TRNP in<br />
1964 were hybrids. Populations that show evidence of introgression can be considered<br />
hybrid swarms, the result of generations of backcrossings with parental types and matings<br />
among hybrids (Allendorf et al. 2001). The small sample size from GTNP (N = 39) may<br />
have limited the power to detect hybridization within this population (Halbert and Derr<br />
2007). The concern for possible introgression of cattle DNA into YNP warrants further<br />
investigation with the addition of microsatellite loci, for estimating the rate and direction<br />
of gene flow between GTNP and YNP.<br />
42
The preferred alternative proposed for managing the GTNP bison population to<br />
reduce disease risks and prevent habitat degradation from the rapidly growing herd, is to<br />
cull bison through hunting over several years to maintain a population of about 500<br />
individuals (USDOI-USFWS and NPS). The effects of this type of herd reduction to<br />
heterozygosity have not been evaluated. Gross and Wang (2005) demonstrated, through<br />
modeling of various management scenarios, that a population of 1000 animals would<br />
have a 90% probability of maintaining 90% allelic diversity for 200 years. However,<br />
these models were based on genetic data from YNP provided by Halbert (2003) without<br />
accounting for any existing population subdivision within this herd, and did not include<br />
data from GTNP.<br />
Genetic data collected from bison during the breeding season, and on winter<br />
ranges within YNP and outside park boundaries should be used to construct models under<br />
various management scenarios to evaluate effects of culling to existing genetic diversity.<br />
Modeling of various herd reduction scenarios for the GTNP bison population should be<br />
conducted as well. The output generated by these models would provide crucial<br />
information for agencies to evaluate the effects of current and proposed management<br />
regimes to the genetic diversity of the GYA bison populations.<br />
43
Figures:<br />
Figure 3-1. Approximate locations of GYA bison breeding groups, represented by the<br />
haplotype frequencies of bison sampled within each area.<br />
Hayden 2006<br />
Hayden 2005<br />
Antelope Flats<br />
Hap 6 Hap 8<br />
Lamar Valley<br />
Mirror Plateau<br />
Wolf Creek Road<br />
44
Tables:<br />
Table 3-1. Distribution and frequency of haplotype 6 among the GYA bison populations<br />
sampled over two consecutive breeding seasons, 2005 and 2006, and the total number of<br />
samples analyzed from each population per season.<br />
N Haplotype 6<br />
Park Breeding Group 2005 2006 Total 2005 2006<br />
YNP Hayden 59 35 94 0.898 1.000<br />
Lamar – 41 41 – 0.463<br />
Mirror Plateau – 16 16 – 0.625<br />
Total: 59 92 151 0.898 0.696<br />
GTNP Antelope Flats – 20 50 – 1.000<br />
Wolf Creek Road – 8 8 – 1.000<br />
Total: 0 28 58 – 1.000<br />
Table 3-2. FST values based on haplotype frequencies among GYA bison populations.<br />
LV HV-05 HV-06 MP YNP<br />
Lamar Valley (LV) –<br />
Hayden Valley (HV-05) 0.218** –<br />
Hayden Valley (HV-06) 0.367** 0.054* –<br />
Mirror Plateau (MP) 0.026 0.103** 0.231** – –<br />
GTNP 0.367** 0.054* 0.000 0.231** 0.191**<br />
*p = < 0.05, ** p = < 0.001<br />
45
Literature Cited<br />
Allendorf, F.W., R.F. Leary, P. Spruell, and J.K. Wenburg. 2001. The problems with<br />
hybrids: Setting conservation guidelines. Trends in Ecology and Evolution 16:<br />
613-622.<br />
Allendorf, F.W. and G. Luikart. 2007. Population subdivision. In Conservation and the<br />
Genetics of Populations. Blackwell Publishing, Inc. pp. 211-212.<br />
Archie E.A., Moss, C.J., and Alberts, S.C. 2006. The ties that bind: genetic relatedness<br />
predicts the fission and fusion of social groups in wild African elephants.<br />
Proceedings of the Royal Society B 273: 513-522.<br />
Barsness, L. 1985. Heads, Hides, and Horns; The Compleat <strong>Buffalo</strong> Book. Texas<br />
Christian University Press, Fort Worth, Texas.<br />
Bellemain, E. and P. Taberlet. 2004. Improved noninvasive genotyping method:<br />
application to brown bear (Ursus arctos) faeces. Molecular Ecology Notes 4: 519-<br />
522.<br />
Berger, J. and C. Cunningham. 1994. Bison: Mating and Conservation in Small<br />
Populations. Columbia University Press, New York.<br />
Birky, C.W., Maruyama, T. and P. Fuerst. 1983. An approach to population and<br />
evolutionary genetic theory for genes in mitochondria and chloroplasts, and some<br />
results. Genetics 103: 513-527.<br />
Bricker, J. 1996. Purification of high quality DNA from shed skins. Herpetological<br />
Review 27:133.<br />
Boyd, D.P. 2003. Conservation of North American bison: status and recommendations.<br />
Masters Thesis, University of Calgary, Calgary, Alberta, Canada.<br />
46
Broquet, T., N. Ménard, and E. Petit. 2007. Noninvasive population genetics: A review of<br />
sample source, diet, fragment length and microsatellite motif effects on<br />
amplification success and genotyping error rates. Conservation Genetics 8: 249-<br />
260.<br />
Buchan, J.C., E.A. Archie, R.C. Van Horn, C.J. Moss, and S.C. Albert. 2005. Locus<br />
specific effects and sources of error in noninvasive genotyping. Molecular<br />
Ecology. 5: 680-683.<br />
Cannon, K.P. 2001. What the past can provide: Contribution of prehistoric bison studies<br />
to modern bison management. Great Plains Research 11: 145-174.<br />
Cannon, K.P. 2007. “They went as high as they choose:” What an isolated skull can tell<br />
us about the biogeography of high-altitude bison. Arctic, Antarctic, and Alpine<br />
Research 39: 44-56.<br />
Carbyn, L.N. 1997. Unusual movement by Bison bison bison, in response to wolf, Canis<br />
lupus predation. Canadian <strong>Field</strong>-Naturalist 111: 461-462.<br />
Chesser, R.K. 1991. Gene diversity and female philopatry. Genetics 127: 437-447.<br />
Christianson, A., Gogan, P.J., Podruzny, KM.., Olexa, E.M. 2005. Incisor wear and age<br />
in Yellowstone bison. Wildlife Society Bulletin 33: 669-676.<br />
Coder, G. D. 1975. The national movement to preserve the American buffalo in the<br />
United States and Canada between 1880 and 1920. Ph.D. dissertation, Ohio State<br />
University.<br />
Coltman, D.W., J.G. Pilkington, and J.M. Pemberton. 2003. Fine-scale genetic structure<br />
in a free living ungulate population. Molecular Ecology 12: 733-742.<br />
47
Côté, S.D., F. Dallas, F. Marshall, R.J. Irvine, R. Langvatn, and S.D. Albon. 2002.<br />
Microsatellite DNA evidence for genetic drift and philopatry in Svalbard reindeer.<br />
Molecular Ecology 11: 1923-1930.<br />
Eggert, L.S., J.A. Eggert, and D.S. Woodruff. 2003. Estimating population sizes for<br />
elusive animals: the forest elephants of Kakum National Park, Ghana. Molecular<br />
Ecology 12: 1389-1402.<br />
Epps, C.W., P.J. Palsboll, J.D. Wehausen, G.K. Roderick, R.R. Ramey II, D.R.<br />
McCullough. 2005. Highways block gene flow and cause rapid decline in genetic<br />
diversity of desert bighorn sheep. Ecology Letters 8: 1029-1038.<br />
Erdoes, R. and A. Ortiz. 1984. American Indian Myths and Legends. Pantheon books,<br />
New York, New York.<br />
Frantz, A.C., L.C. Pope, P.J. Carpenter, T.J. Roper, G.J. Wilson, J. Delahays, and T.<br />
Burke. 2003. Reliable microsatellite genotyping of the Eurasian badger (Meles<br />
meles) using faecal DNA. Molecular Ecology Notes 12:1649-1661.<br />
Freese C.H., Aune, K.E., Boyd, D.P., Derr, J.N., Forrest, S.C., Gates, C.C., Gogan, P.J.,<br />
Grassel, S.M., Halbert, N.D., Kunkel, K., and Redford, K.H. 2007. Second chance<br />
for plains bison. Biological Conservation, in Press.<br />
Gates, C.C., B. Stelfox, T. Muhly, T. Chowns, and R.J. Hudson. 2005. The Ecology of<br />
Bison Movements and Distribution In and Beyond Yellowstone National Park.<br />
Faculty of Environmental Design, The University of Calgary, Calgary, Alberta.<br />
Geremia, C., T. Jones, R. Wallen, and J. Treanor. 2005. Yellowstone bison population<br />
estimate summer 2005. Unpublished report, Bison Ecology and Management<br />
Office, Yellowstone National Park, U.S. National Park Service.<br />
48
Gross, J.E. and G. Wang. 2005. Effects of population control strategies on retention of<br />
genetic diversity in National Park Service bison (Bison bison) herds. National<br />
Park Service, unpublished report.<br />
Halbert, N.D. 2003. The utilization of genetic markers to resolve modern management<br />
issues in historic bison populations: implications for species conservation. Ph.D.<br />
dissertation, Texas A&M University, College Station, Texas<br />
Halbert, N.D. and J.N. Derr. 2007. A comprehensive evaluation of cattle introgression<br />
into US federal bison herds. Journal of Heredity 98: 1-12.<br />
Hornaday, W.T. 2002. The Extermination of the American Bison. Smithsonian Institute<br />
Press, Washington and London.<br />
Jones, J., R. Wallen, C. Geremia, and D. Blanton. 2006. Yellowstone bison population<br />
estimate summer 2006. Unpublished report, Bison Ecology and Management<br />
Office, U.S. Yellowstone National Park, National Park Service.<br />
Knapp, A.K., J.M. Blair, J.M. Briggs, S.L. Collins, D.C. Hartnett, L.C. Johnson, and E.G.<br />
Towne. 1999. The keystone role of bison in North American tallgrass prairie.<br />
BioScience 49: 39-50.<br />
Kumar, S., K Tamura, and M. Nei. 2004. MEGA3: Integrated software for Molecular<br />
Evolutionary Genetics Analysis and sequence alignment. Briefings in<br />
Bioinformatics 5:150-163.<br />
Lott, D.F. 2002. American Bison: A Natural History. University of California Press,<br />
Berkeley, and Los Angeles, California.<br />
Luikart, G. and P.R. England. 1999. Statistical analysis of microsatellite DNA data.<br />
Trends in Ecology and Evolution 14:253-256.<br />
49
Luikart, G., S. Zundel, D. Rioux, C. Miguel, K.A. Keating, J.T. Hogg, B. Steele, K.<br />
Foresman, and P. Taberlet. 2007. Low genotyping error rates for microsatellite<br />
multiplexes and noninvasive fecal DNA samples from bighorn sheep. Journal of<br />
Wildlife Management, in Press.<br />
Maudet, C., G. Luikart, D. Dubray, A. Von Hardenberg, and P. Taberlet. 2004. Low<br />
genotyping error rates in wild ungulate faeces sampled in winter. Molecular<br />
Ecology Notes 4: 772-775.<br />
McHugh, T. 1972. The Time of the <strong>Buffalo</strong>. University of Nebraska Press, Lincoln,<br />
Nebraska.<br />
Meagher, M.M. 1973. The bison of Yellowstone National Park. National Park Service<br />
Science Monologue 1: 1-161.<br />
Meagher, M.M., M.L. Taper, and C.L. Jerde. 2002. Recent changes in population<br />
distribution: The Pelican bison and the domino effect. Proceedings of the 6 th<br />
Biennial Scientific Conference, Yellowstone National Park: pp. 135-147.<br />
Morin, P.A., K.E. Chambers, C. Boesch, and L. Viligant. 2001. Quantitative polymerase<br />
chain reaction of DNA from non-invasive samples for accurate microsatellite<br />
genotyping of wild chimpanzees (Pan troglodytes verus). Molecular Ecology 10:<br />
1835-1844.<br />
Morin, P.A. and D.S. Woodruff. 1996. Non-invasive genotyping for vertebrate<br />
conservation. In Molecular Genetic Approaches in Conservation. Edited by T.B.<br />
Smith and R.K. Wayne. Oxford University Press, New York, pp. 298-313.<br />
Nies, G. F.E. Zachos, and G.B. Hartl. 2005. The impact of female philopatry on<br />
population differentiation in the European roe deer (Capreolus capreolus) as<br />
50
evealed by mitochondrial DNA and allozymes. Mammalian Biology 70: 130-<br />
134.<br />
Nyakaana, S. P. Arctander, and H.R. Siegismund. 2002. Population structure of the<br />
African savannah elephant inferred from mitochondrial control region sequences<br />
and nuclear microsatellite loci. Heredity 89: 90-98.<br />
Parsons, K.M. 2001. Reliable microsatellite genotyping of dolphin DNA from faeces.<br />
Molecular Ecology 1: 341-344.<br />
Parsons, K.M., J.W. Durban, D.E. Claridge, D.I. Herzing, K.C. Balcomb, and L.R.<br />
Noble. 2006. Population genetic structure of coastal bottlenose dolphins (Tursiops<br />
truncates) in the Northern Bahamas. Marine Mammal Science 22: 276-298.<br />
Polziehn, R.O., C. Strobeck, J. Sheraton, R. Beech, J. 1995. Bovine mtDNA discovered<br />
in North American bison populations. Conservation Biology 9: 1638-1643.<br />
Polziehn, R.O., R. Beech, J. Sheraton, and C. Strobeck. 1996. Genetic relationships<br />
among North American bison populations. Canadian Journal of Zoology 74: 738-<br />
749.<br />
Pritchard, J.K., M. Stephens, and P. Donnelly. 2000. Inference of population structure<br />
using multilocus genotype data. Genetics 155: 945-959.<br />
Seton, E.T. 1937. Lives of Game Animals. Literary Guild of America, New York.<br />
Shapiro, B. A.J. <strong>Dr</strong>ummond, A. Rambaut, M.C. Wilson, P.E. Matheus, A.V. Sher, O.G.<br />
Pybus, MT.P. Gilbert, I. Barnes, J. Binladen, E. Willerslev, A.J. Hansen, G.F.<br />
Baryshnikov, J.A. Burns, S. Davydov, J.C. <strong>Dr</strong>iver, D.G. Froese, C.R. Harington,<br />
G. Keddie, P. Kosintev, M.L. Kunz, L.D. Martin, R.O. Stephenson, J. Storer, R.<br />
51
Tedford, S. Zimov, and A. Cooper. 2004. Rise and fall of the Beringian Steppe<br />
bison. Science 306: 1561-1565.<br />
Shupe, J.L., A.E. Olson, H.B. Peterson, and J.B. Low. 1984. Fluoride toxicosis in wild<br />
ungulates. Journal of the American Veterinary Medical Association 185: 1295-<br />
1300.<br />
Smits, D.D. 1994. The frontier army and the destruction of the buffalo: 1865-1883. The<br />
Western Historical Quarterly 25: 312-338.<br />
Steele, B.M. 1996. A modified EM algorithm for estimation in generalized mixed<br />
models. Biometrics 52: 1295-1310.<br />
Steele, B.M. and J.T Hogg. 2003. Measuring individual quality in conservation and<br />
behavior. In Animal Behavior and Wildlife Conservation. Edited by M. Festa-<br />
Bianchet and M. Appolonio. Island Press, Washington, D.C. pp. 243-269.<br />
Storz, J.F. 1999. Genetic consequences of mammalian social structure. Journal of<br />
Mammalogy 80: 553-569.<br />
Taberlet, P., and L. Fumagali. 1996. Owl pellets as a source of DNA for genetic studies<br />
of small mammals. Molecular Ecology Notes 5: 301-305.<br />
Taberlet, P., L.P. Waits, and G. Luikart. 1999. Non-invasive sampling: look before you<br />
leap. Trends in Ecology and Evolution 14: 323-327.<br />
Taper, M.L., M. Meagher, and C.L. Jerde. 2000. The phenology of space: Spatial aspects<br />
of bison density dependence in Yellowstone National Park. Montana State<br />
University, Bozeman, MT. Unpublished manuscript.<br />
Tindall, K.R. and T. A. Kunkel. 1988. Fidelity of DNA synthesis by the Thermus<br />
aquaticus DNA polymerase. Biochemistry 27: 6008-6013.<br />
52
United States Department of the Interior, National Park Service. 2000. Bison<br />
Management for the State of Montana and Yellowstone National Park; Final<br />
Environmental Impact Statement. U.S. Government Printing Office, Region 10.<br />
United States Department of the Interior, National Park Service. 2006. Management<br />
Policies. U.S. Government Printing Office.<br />
United States Department of the Interior, NPS-Grand Teton National Park, USFWS-<br />
National Elk Refuge, Wyoming Fish and Game, and Bridger-Teton National<br />
Forest. 1996. The Jackson Bison Herd; Long Term Management Plan and<br />
Environmental Assessment. Jackson, Wyoming. U.S. Government Printing<br />
Office.<br />
United States Department of the Interior, NPS-Grand Teton National Park, USFWS-<br />
National Elk Refuge. 2007. Summary of the Final Bison and Elk Management<br />
Plan and Environmental Impact Statement: National Elk Refuge, Grand Teton<br />
National Park. U.S. Government Printing Office.<br />
Vidya, T.N.C., P. Fernando D.J. Melnick, and R. Sukuman. 2005. Population<br />
differentiation within and among Asian elephant (Elephas maximus) populations<br />
in southern India. Heredity 94: 71-80.<br />
Vogel, A.B., S. Edmands, and D. Hedgecock. 2006. Introgression of cattle mtDNA into<br />
Santa Catalina Island American bison. Unpublished. GenBank accession<br />
numbers; DQ452027 to DQ452030.<br />
Ward, T.J., J.P. Bielawski, S.K. Davis, J.W. Templeton, and J.N. Derr. 1999.<br />
Identification of domestic cattle hybrids in wild cattle and bison species: a<br />
53
general approach using mtDNA markers and the parametric bootstrap. Animal<br />
Conservation 2: 51-57.<br />
Wronski, T. and A. Apio. 2006. Home-range overlap, social vicinity and agonistic<br />
interactions denoting matrilineal organization in bushbuck, Tragelaphus<br />
scriptus. Behavioral Ecology and Sociobiology 59: 819-828.<br />
54
MITOCH-00553; No of Pages 10<br />
Complete mitochondrial DNA sequence analysis of Bison bison and bison–cattle<br />
hybrids: Function and phylogeny<br />
Kory C. Douglas a,1 , Natalie D. Halbert b,1 , Claire Kolenda b,c , Christopher Childers a,d ,<br />
David L. Hunter e , James N. Derr b, ⁎<br />
a Department of Veterinary Integrative Biosciences, Texas A&M University, College Station, TX 77843-4458, USA<br />
b Department of Veterinary Pathobiology, Texas A&M University, College Station, TX 77843-4467, USA<br />
c Institute for Ageing and Health, Newcastle University Campus for Ageing and Vitality, Newcastle-upon-Tyne, NE4 5PL, England<br />
d Department of Biology, Georgetown University, Washington, DC 20057, USA<br />
e Turner Enterprises, Inc., 1123 Research <strong>Dr</strong>ive, Bozeman, MT 59718-6858, USA<br />
article info<br />
Article history:<br />
Received 5 March 2010<br />
Received in revised form 5 September 2010<br />
Accepted 14 September 2010<br />
Available online xxxx<br />
Keywords:<br />
Bison<br />
Bos<br />
Phylogenetics<br />
Hybridization<br />
Mitochondria<br />
1. Introduction<br />
abstract<br />
Due to the vital functions of the mitochondria, it is not surprising<br />
that many mitochondrial DNA (mtDNA) mutations have been<br />
identified that affect fitness, alter athletic performance, and cause a<br />
variety of diseases (Bortot et al., 2009; Florentz et al., 2003; Harrison<br />
and Burton, 2006; Tanaka et al., 2010; Wallace, 1994). Most<br />
mitochondrial studies have been limited to only a few genes or<br />
regions of the mitochondrial genome. However, with the advancement<br />
of sequencing technologies, it has become possible to sequence<br />
whole mtDNA genomes quickly and accurately. Whole mtDNA<br />
genome sequencing has recently revealed important insights into<br />
cellular metabolism, mitochondrial gene organization, and genome<br />
evolution (Boore et al., 2005). Additionally, whole mtDNA genome<br />
sequencing has drastically improved the power and resolution of<br />
phylogenetic analysis compared with single gene or single region<br />
studies (Santamaria et al., 2007; Simon et al., 2006; Zardoya and<br />
⁎ Corresponding author. Department of Veterinary Pathobiology, 4467 Texas A&M<br />
University, College Station, TX 77843-4467, USA. Tel.: +1 979 862 4774; fax: +1 979<br />
845 9972.<br />
E-mail addresses: kdouglas@cvm.tamu.edu (K.C. Douglas), nhalbert@cvm.tamu.edu<br />
(N.D. Halbert), claire.kolenda@newcastle.ac.uk (C. Kolenda), cpc26@georgetown.edu<br />
(C. Childers), dave.hunter@retranches.com (D.L. Hunter), jderr@cvm.tamu.edu (J.N. Derr).<br />
1 These authors contributed equally to this work.<br />
Mitochondrion xxx (2010) xxx–xxx<br />
Contents lists available at ScienceDirect<br />
Mitochondrion<br />
journal homepage: www.elsevier.com/locate/mito<br />
1567-7249/$ – see front matter © 2010 Elsevier B.V. and Mitochondria Research Society. All rights reserved.<br />
doi:10.1016/j.mito.2010.09.005<br />
Complete mitochondrial DNA (mtDNA) genomes from 43 bison and bison-cattle hybrids were sequenced and<br />
compared with other bovids. Selected animals reflect the historical range and current taxonomic structure of<br />
bison. This study identified regions of potential nuclear–mitochondrial incompatibilities in hybrids, provided<br />
a complete mtDNA phylogenetic tree for this species, and uncovered evidence of bison population<br />
substructure. Seventeen bison haplotypes defined by 66 polymorphic sites were discovered, whereas 728<br />
fixed differences and 86 non-synonymous mutations were identified between bison and bison–cattle hybrid<br />
sequences. The potential roles of the mtDNA genome in the function of hybrid animals and bison taxonomy<br />
are discussed.<br />
© 2010 Elsevier B.V. and Mitochondria Research Society. All rights reserved.<br />
Meyer, 1996), allowing for more accurate resolution of taxonomic<br />
relationships even at deep levels (Cao et al., 2006; Gissi et al., 2008).<br />
It has been estimated that 1500–2000 nuclear proteins are<br />
necessary for the numerous activities of the mitochondria, although<br />
only about half of these have been identified to date (Elstner et al.,<br />
2008; Prokisch et al., 2006). These nuclear proteins interact with<br />
mitochondrial proteins to form co-adapted gene complexes which<br />
must remain compatible to ensure mitochondrial function. Reduced<br />
fitness levels have been observed among the offspring of both<br />
interspecific and intraspecific crosses between populations with<br />
different mitochondrial types (Barrientos et al., 1998; Burton et al.,<br />
1999; Ellison and Burton, 2008; Liepins and Hennen, 1977; Yamaoka<br />
et al., 2000). Additionally, it appears that nuclear–mitochondrial<br />
incompatibilities may play an important role in reproductive isolation<br />
in fish (Bolnick et al., 2008); however, to date, a mammalian model<br />
system to study these effects is lacking.<br />
A well-documented example of interspecific hybridization between<br />
American bison (Bison bison) and domestic cattle (Bos taurus)<br />
presents a unique opportunity to examine the effects of mtDNA<br />
sequence on nuclear–mitochondrial protein interactions, and possibly<br />
on hybrid fitness. The two species, which are members of the same<br />
Bovinae subfamily, diverged around 1 million years ago and are<br />
largely incompatible: hybridization does not occur naturally and most<br />
F1 offspring are sterile (produced from domestic cow by bison bull<br />
crosses) (Goodnight, 1914; Hartl et al., 1988; Jones, 1907; Loftus et al.,<br />
Please cite this article as: Douglas, K.C., et al., Complete mitochondrial DNA sequence analysis of Bison bison and bison–cattle hybrids:<br />
Function and phylogeny, Mitochondrion (2010), doi:10.1016/j.mito.2010.09.005
2 K.C. Douglas et al. / Mitochondrion xxx (2010) xxx–xxx<br />
1994). However, a small number of viable bison–cattle hybrids, along<br />
with a larger number of purebred bison, were used in the establishment<br />
of several bison populations following a dramatic species<br />
bottleneck in the late 19th century (Coder, 1975; Garretson, 1938).<br />
Unlike first- or second-generation backcrosses, which commonly<br />
exhibit morphological characteristics of hybridization, most advanced<br />
generation backcrosses are morphologically indistinguishable from<br />
purebred bison. As a result, cattle introgression can be found in<br />
the nuclear DNA and/or mtDNA genomes of the large majority of<br />
bison populations (Halbert and Derr, 2007; Halbert et al., 2005; Vogel<br />
et al., 2007; Ward et al., 1999) with around 3.7% of all extant bison<br />
harboring cattle mtDNA (Halbert and Derr, unpublished data from<br />
more than 10,000 bison in 150 populations).<br />
The relationship between the genera of Bos and Bison has been a<br />
source of debate for decades. In 1758, Linneaus placed bison in the<br />
genus Bos (Bos bison), but bison were subsequently moved to a<br />
sister genus (Bison) during the 19th century (Wilson and Reeder,<br />
1993). Presently, there are two extant species within the Bison<br />
genus, the European (Bison bonasus) and American bison (Bison<br />
bison) (McDonald, 1981). The generic distinction of Bison has been<br />
historically supported by analysis of anatomical distinctiveness<br />
(McDonald, 1981; Meagher, 1986; van Zyll de Jong, 1986). However,<br />
both species are capable of producing fertile offspring through<br />
hybridization with domestic cattle and other members of the genus<br />
Bos (Boyd, 1908; Goodnight, 1914; Steklenev and Yasinetskaya, 1982)<br />
strongly supporting inclusion of Bison in the Bos genus. Further<br />
support for this classification comes from morphological data (Groves,<br />
1981), blood protein analysis (Stormont et al., 1961), phylogenetic<br />
analyses of single mitochondrial regions (Burzynska et al., 1999;<br />
Janecek et al., 1996; Miyamoto et al., 1989), nuclear ribosomal DNA<br />
(Wall et al., 1992), and single nucleotide polymorphism (SNP)<br />
analysis (Decker et al., 2009).<br />
Another contentious debate involves the separation of American<br />
bison into two subspecies: B. bison bison (plains bison) and B. bison<br />
athabascae (wood bison). The histories of the two lines are similar<br />
with extreme population bottlenecks due to environmental and<br />
human factors (Isenberg, 2000). In the late 19th century, the wood<br />
bison population declined in Canada to an estimated 300 individuals<br />
in a single region (now encompassed by Wood <strong>Buffalo</strong> National<br />
Park) (Soper, 1941). Following the enactment of anti-hunting laws,<br />
the population increased to 1500–2000 bison. From 1922–1928,<br />
approximately 6600 plains bison were imported into the population,<br />
leading to a mixture of the two lines (Banfield and Novakowski, 1960;<br />
Roe, 1970). Although still somewhat phenotypically distinct, the<br />
subspecies designation has been challenged by many (Burton, 1962;<br />
Corbet, 1978; van Gelder, 1977; Wilson and Reeder, 1993) and it has<br />
been argued that the two are merely ecotypes and not subspecies<br />
(Geist, 1991). Furthermore, blood typing, RFLP, and microsatellite<br />
DNA analysis have indicated that plains and wood bison are not<br />
distinct enough to be considered subspecies (Bork et al., 1991; Peden<br />
and Kraay, 1979; Wilson and Strobeck, 1999).<br />
In this study, we sequenced the entire mtDNA genome from 43<br />
American bison and domestic cattle to examine the effects of<br />
hybridization between the two species, analyze their phylogenetic<br />
relationships, and construct the first whole mtDNA phylogenetic tree<br />
of American bison to identify population substructure and subspecific<br />
relationships. Bison with native (bison) and non-native (cattle)<br />
mtDNA were sequenced to gain insights into differences between<br />
the mitochondrial genomes which may contribute to physiological<br />
changes in hybrid (bison/cattle) individuals. Synonymous and<br />
nonsynonymous differences between bison and hybrid animals,<br />
their locations within protein-coding genes, and possible effects on<br />
tRNA secondary structure were evaluated. This study is an important<br />
step in understanding the mitochondrial sequence diversity found in<br />
bison, the role of mitochondrial function in hybridized animals, and<br />
the phylogeny of bison in relation to the Bos genus.<br />
2. Materials and methods<br />
2.1. Sampling strategy<br />
Whole blood samples were collected between 1997 and 2006.<br />
Total genomic DNA was extracted from white blood cells by<br />
proteinase K treatment followed by phenol/chloroform extraction<br />
(Sambrook et al., 1989). Sample quantity and quality was determined<br />
via spectrophotometry (ND-1000; Nano<strong>Dr</strong>op Technologies, Inc.,<br />
Wilmington, DE). Samples were stored at −80 °C prior to use.<br />
Complete mtDNA sequences were obtained from 43 bison and 3<br />
cattle (Supplemental Materials Table 1) using the following methods<br />
described. Each of the bison samples were evaluated for the presence of<br />
domestic cattle mtDNA using a PCR-based assay as previously described<br />
(Ward et al., 1999). Based on historical records and previous genetic<br />
studies, all known extant bison are derived from a handful of foundation<br />
herds established in the late 19th and 20th centuries (Coder, 1975;<br />
Garretson, 1938; Soper, 1941). To maximize haplotype diversity, efforts<br />
were made to include representative haplotypes across 5 of the<br />
foundation herds including: Yellowstone National Park (Wyoming,<br />
USA), Fort Niobrara National Wildlife Refuge (Nebraska, USA), National<br />
Bison Range (Montana, USA), Texas State Bison Herd (Texas, USA), and<br />
Elk Island National Park (Alberta, Canada). From these herds, 5 plains<br />
bison (Bison bison bison) samples and 2 wood bison samples (Bison bison<br />
athabascae) determined to contain bison mtDNA were selected for<br />
sequencing. Additionally, 36 samples from a private bison population<br />
recently created from multiple sources were evaluated, including 24<br />
with bison mtDNA and 12 with domestic cattle mtDNA (hereafter<br />
referred to as “hybrids”) (Supplemental Materials Table 1).<br />
2.2. Sequencing strategy<br />
A rapid method for sequencing both cattle and bison complete<br />
mtDNA was developed using the following strategy. Complete mtDNA<br />
sequences from human, mouse, and cattle were downloaded from<br />
publicly available databases and aligned using Clustal X (Larkin et al.,<br />
2007). Primers were designed in highly conserved regions where<br />
possible. Pairs of primers were selected across the entire bovine<br />
mtDNA genome based on the following specifications: 1) amplified<br />
fragment size of 900–1000 base pairs (bp) to allow for direct sequencing<br />
using the same (PCR) primers; 2) at least 100 bp of overlap between<br />
adjacent pairs to ensure complete sequencing coverage; 3) optimal<br />
annealing temperature of 54 °C. These criteria were necessarily adjusted<br />
in regions of low conservation. A total of 24 primer pairs were selected<br />
(Supplemental Materials Table 2) with an average estimated fragment<br />
size of 905 bp (±125.5 bp) and an average overlap of 202 bp (±99.4 bp).<br />
A standard 25 μL PCR mixture was utilized for all primer pairs,<br />
including 100 ng template DNA, 1.5 mM MgCl2, 0.025 mM each dNTP,<br />
1× MasterAmp PCR Enhancer with betaine (Epicentre), 0.048 μM each<br />
primer, 1× GeneAmp PCR Buffer II and 0.2 μL AmpliTaq ® Gold DNA<br />
polymerase (Applied Biosystems). Touch-down PCR amplification was<br />
performed on a GeneAmp PCR System 9700 (Applied Biosystems) under<br />
the following conditions: initial denaturation for 3 min at 96 °C; 3 cycles<br />
of 96 °C for 20 s, 57 °C for 30 s, and 72 °C for 1 min with a decrease in<br />
annealing temperature of 1 °C during each cycle; 37 cycles of 96 °C for<br />
20 s, 54 °C for 30 s, and 72 °C for 1 min; final extension of 72 °C for<br />
10 min. Resultant amplicons were visualized on 1% agarose gels stained<br />
with ethidium bromide and purified with a QIAquick ® PCR purification<br />
kit following the manufacturer's recommendations (Qiagen).<br />
Bi-directional dye terminator (BigDye ® v1.1, Applied Biosystems)<br />
sequencing was performed in 10 μL reactions including 90 ng<br />
template and 10 pmol primer following the manufacturer's recommendations.<br />
Sequence products were purified using sephadex G-50<br />
columns (BioMax) and visualized on a 3130xl Genetic Analyzer<br />
(Applied Biosystems). Analyzed data was evaluated and assembled<br />
into contigs using Sequencher TM 4.9 (Gene Codes Corporation).<br />
Please cite this article as: Douglas, K.C., et al., Complete mitochondrial DNA sequence analysis of Bison bison and bison–cattle hybrids:<br />
Function and phylogeny, Mitochondrion (2010), doi:10.1016/j.mito.2010.09.005
2.3. mtDNA genome analysis<br />
The complete mitochondrial sequences of 30 Bos taurus (domestic<br />
cattle, hereafter “cattle”), 2 Bos indicus (zebu), 3 Bos grunniens (yak), 1<br />
Bison bison (American bison), and 1 Bubalus bubalis (water buffalo)<br />
were obtained from GenBank (Benson et al., 2005) (Supplemental<br />
Materials Table 1). The complete mitochondrial genome sequences<br />
were aligned using Clustal X (Larkin et al., 2007) in the MEGA 4.0<br />
phylogenetic package and corrected by hand when necessary. The<br />
genomes were parsed into the following data sets for functional and<br />
phylogenetic analyses: 1) bison only; 2) bison and hybrids and 3) Bos,<br />
bison, and hybrids. To investigate the variation among bison mtDNA<br />
genomes, an unrooted haplotype network (spring tree) was created<br />
using TCS v1.21 (Clement et al., 2000).<br />
2.4. Bison–cattle hybridization analysis parameters<br />
An alignment of bison and hybrid haplotypes was created to assess<br />
differences in the two genomes. A previously published cattle mtDNA<br />
sequence (AB074966.1) was used to identify putative gene boundaries<br />
and overlapping regions. Aligned files were analyzed gene-bygene<br />
in DnaSP v5 (Librado and Rozas, 2009) using the genetic code<br />
for mammalian mtDNA to assess the total numbers of polymorphic<br />
sites, synonymous changes, and non-synonymous changes. Nonsynonymous<br />
changes were then coded by amino acid class (nonpolar,<br />
uncharged polar, positive, negative) to evaluate the number<br />
of class-changing mutations between the bison and hybrid groups.<br />
Changes in tRNA structure due to sequence differences between<br />
the bison and hybrid groups were evaluated using the online<br />
program tRNAscan-SE (Lowe and Eddy, 1997; http://lowelab.ucsc.<br />
edu/tRNAscan-SE/). The cove only method (cut-off score=20 bits)<br />
and the mito/chloroplast source definition were used. Locations of<br />
changes were recorded in the following categories: D loop/stem, T C<br />
loop/stem, central loop, anticodon loop/stem, or acceptor arm stem.<br />
2.5. Phylogenetic analysis<br />
RAxML version 7.0.3 was used to generate unweighted maximum<br />
likelihood phylogenetic trees (Stamatakis, 2006). The GTRGAMMA<br />
model was utilized, and 1000 replicates were used to generate<br />
bootstrap values. To account for different nucleotide substitution<br />
rates across the mitochondrial genome, we partitioned the sequence<br />
as follows: each of the 13 protein-coding genes and the 2 rDNA genes<br />
were treated as independent regions (15 total); the 22 tDNA genes<br />
were grouped into one large region; and the D loop was defined as<br />
an independent region. For each partition, individual alpha-shape<br />
Table 1<br />
Annotation and gene organization of the Bison bison mitochondrial genome. Order, gene, strand (heavy or light), starting and ending nucleotide position, first and last ten bases, and<br />
intergenic/overlapping nucleotides (“–” indicates overlapping regions) are based on whole mtDNA genome alignment of all bison haplotypes and comparison with published cattle<br />
sequences.<br />
Order Gene Strand Start End Length (bp) First ten bases Last ten bases Intergenic nucleotides<br />
D loop 1 364 362–364 ACTAATGGCT CCCCCCCCCC 0<br />
1 tRNA-Phe Heavy 365 431 67 GTTGATGTAG TCCATAAACA 0<br />
2 12s-rRNA Heavy 432 1387 956 CATAGGTTTG TTGGATAAAT 0<br />
3 tRNA-Val Heavy 1388 1454 67 CAAGATATAG AATATCTTGA 0<br />
4 16S rRNA Heavy 1455 3025 1570–1571 d<br />
ACTAAATCTA ACAGGGCTTA 0<br />
5 tRNA-Leu Heavy 3026 3100 75 GTTAAGGTGG CTCCTTAACA 2 (AA)<br />
6 ND1 Heavy 3103 4058 956 ATGTTCATAA CGCAAACATA a<br />
0<br />
7 tRNA-Ile Heavy 4059 4127 69 AGAAATATGT CTTATTTCTA −3 (CTA)<br />
8 tRNA-Gln Light 4125 4196 72 CTAGAACTAT CCAAATTCTA 2 (TT)<br />
9 tRNA-Met Heavy 4199 4267 69 AGTAAGGTCA TCCCGTACTA 0<br />
10 ND2 Heavy 4268 5309 1042 ATAAATCCAA GTATTAGAAT a<br />
0<br />
11 tRNA-Trp Heavy 5310 5376 67 AGGAATTTAG TTAATTCCTG 1 (C)<br />
12 tRNA-Ala Light 5378 5446 69 TAAGGATTGC CTAAATCCTC 1 (A)<br />
13 tRNA-Asn Light 5448 5521 74 b<br />
CTAGACTGGT CTTCAATCTA 0<br />
L-strand ori. of rep. Light 5522 5553 32 CTTCTCCCGC AAGGCGGGAG 0<br />
14 tRNA-Cys Light 5554 5620 67 AAGCCCCGGC CCACAGGGCT 0<br />
15 tRNA-Tyr Light 5621 5688 68 TGGTAAAAAG CCATTTTACC 1 (C)<br />
16 COI Heavy 5690 7234 1545 ATGTTCATTA CCTAAAATAA −3 (TAA)<br />
17 tRNA-Ser Light 7232 7304 71–73 d<br />
TAAGAAAGGA TCTCTCTCAA 4 (TAAA)<br />
18 tRNA-Asp Heavy 7309 7377 69 CGAAGTGTTA GTACACCTCA 1 (T)<br />
19 COII Heavy 7379 8062 684 ATGGCATACC AATATTATAA 3 (AAT)<br />
20 tRNA-Lys Heavy 8066 8132 67 CACCAAGAAG TCCTTGGTGA 1 (C)<br />
21 ATP8 Heavy 8134 8334 201 ATGCCACAAC ACCCCTATAA −40<br />
22 ATP6 Heavy 8295 8975 681 ATGAACGAAA CAACACATAA −1 (A)<br />
23 COIII Heavy 8975 9755 781 ATGACACACC TGATGAGGCT a<br />
3 (CCT)<br />
24 tRNA-Gly Heavy 9759 9827 69 ATTCTTTTAG AAAAAGAATA 0<br />
25 ND3 Heavy 9828 10,174 346 ATAAATCTAA GAACCGAATA a<br />
0<br />
26 tRNA-Arg Heavy 10,175 10,243 69 TGGTACTTAG TAATTACCAA 0<br />
27 ND4 (L) Light 10,244 10,540 297 ATGTCTATAG CCAATGCTAA −7<br />
28 ND4 Heavy 10,534 11,911 1378 ATGCTAAAAT CCTCTATACT a<br />
0<br />
29 tRNA-His Heavy 11,912 11,981 70 GTAAATATAG CTTATTTACC 0<br />
30 tRNA-Ser2 Heavy 11,982 12,041 60 GAAAAAGTAT GGCTTTTTCG 1 (A)<br />
31 tRNA-Leu2 Heavy 12,043 12,112 70 c<br />
ACTTTTAAAG AATAAAAGTA 0<br />
32 ND5 Heavy 12,113 13,933 1821 ATAAACATAT CCACGAGTAA −17<br />
33 ND6 Light 13,917 14,444 528 TTAATTTCCA ATAGTATCAT 0<br />
34 tRNA-Glu Light 14,445 14,513 69 TATTCTTACA CTACAAGAAC 4 (ACTA)<br />
35 CYTB Heavy 14,518 15,657 1140 ATGACTARCC AAAATGAAGA 4 (CAGG)<br />
36 tRNA-Thr Heavy 15,662 15,730 69 TCTTTGTAGT CCCTAAGACT −1 (T)<br />
37 tRNA-Pro Light 15,730 15,795 66 TCAAGGAAGA CTATTCCCTG 0<br />
D loop 15,796 16,325 528–530 AACGCTATTA ATCTCGATGG 0<br />
a<br />
TAA stop codon completed by addition of 3' adenine residues to mRNA.<br />
b<br />
Region has a fixed insertion in bison as compared to cattle.<br />
c<br />
Region has a fixed deletion in bison as compared to cattle.<br />
d<br />
Indel present within gene.<br />
K.C. Douglas et al. / Mitochondrion xxx (2010) xxx–xxx<br />
Please cite this article as: Douglas, K.C., et al., Complete mitochondrial DNA sequence analysis of Bison bison and bison–cattle hybrids:<br />
Function and phylogeny, Mitochondrion (2010), doi:10.1016/j.mito.2010.09.005<br />
3
mitochondrial genome is 16318–16323 bp long (Supplemental<br />
Materials Table 1) consisting of 13 protein-coding genes, 22 tDNA<br />
genes, 2 rDNA genes, and the D-Loop region. The gene order, length,<br />
and gene coordinates for the mtDNA genome are presented in Table 1.<br />
The gene order is conserved between bison and cattle. Including both<br />
SNPs and insertion–deletion events (indels), there are 989–995<br />
differences between the bison haplotypes and the cattle genomic<br />
reference sequence. The length of the D-loop region varies by 4 bp<br />
across bison due to indels. Indels are also present in two genes within<br />
bison: 16s rRNA has a 1 bp indel at position 1880 and tRNA serine has<br />
a 2-bp variable indel at position 7301–7302. Furthermore, the stop<br />
codon for five protein-coding genes is completed by the addition of<br />
3′ adenine residues to the mRNA (Table 1) as previously reported in<br />
cattle and other species (Achilli et al., 2008; Boore et al., 2005). There<br />
are also several regions in the bison genome where intergenic<br />
nucleotides exist or where two genes overlap (Table 1). Whether<br />
these regions represent a biological phenomenon or annotation errors<br />
is unknown; however, intergenic nucleotides have been reported in<br />
other species (Achilli et al., 2008; Boore et al., 2005).<br />
In total, the 17 bison haplotypes included 66 polymorphic sites, 34<br />
singleton variable sites (SNP found in only one animal), and a pairwise<br />
average of 15.3 differences between any two sequences. For<br />
comparison, the 39 cattle haplotypes included 426 polymorphic sites,<br />
261 singleton sites, and a pair-wise average of 46.2 differences. These<br />
results lead to a 3-fold lower nucleotide diversity (π) value for the<br />
analyzed bison haplotypes (π=0.00094) than the cattle haplotypes<br />
(π=0.00283). To illustrate the total number of differences among<br />
bison haplotypes, an unrooted haplotype network was created to map<br />
the number and position of polymorphisms (Fig. 1).<br />
3.2. Bison–cattle hybridization analysis<br />
Sequence analysis of the 13 protein-coding genes in bison compared<br />
to their homologs in hybrid animals revealed a large amount<br />
of sequence variation (Table 2). A total of 777 polymorphic sites<br />
were identified between bison and hybrid sequences with 728 fixed<br />
differences between the two groups. Of the fixed mutations, 642<br />
synonymous and 86 non-synonymous mutations were identified.<br />
To further assess the potential effects of the non-synonymous<br />
mutations on protein structure, we identified a total of 40 mutations<br />
predicted to cause an amino acid class change. The remaining 46 nonsynonymous<br />
mutations result in amino acid substitutions within the<br />
same class (e.g., non-polar to non-polar).<br />
We also examined the effects of SNPs and indels on tRNA structures<br />
between bison and hybrid haplotypes (Table 3). Our analyses indicate<br />
that 16 of the 22 tRNA genes annotated have a predicted sequence<br />
change in the D loop, T C loop, central loop, or one of the stems of<br />
the tRNA and that 9 of these have a sequence change at more than one<br />
K.C. Douglas et al. / Mitochondrion xxx (2010) xxx–xxx<br />
of the stems and/or loops. A bulge or mis-pairing of nucleotides due<br />
to a 1 bp deletion in the hybrid haplotypes was predicted for tRNA-Asn<br />
(Fig. 2) and tRNA-Leu. All anticodon sequences were conserved<br />
between the bison and hybrid groups.<br />
3.3. Phylogenetic analysis<br />
Table 2<br />
Analysis of protein-coding genes. Sequence variations were recorded between bison and bison–cattle hybrid haplotypes.<br />
Phylogenetic analysis of the Bison and Bos lineages is presented in<br />
Fig. 3 (see Supplemental Materials Table 3 for complete SNP table).<br />
Two major clades were identified in this analysis: the indicus/taurus<br />
clade including Bos taurus, Bos indicus, and hybrids, and the bison/yak<br />
clade including bison (plains and wood) and Bos grunniens. Within the<br />
indicus/taurus clade, B. indicus and B. taurus form into separate subclades<br />
(Fig. 3, I and II, respectively). According to our analysis, cHap56,<br />
which was only defined as “‘Beef Cattle’, Korea” by Achilli et al. (2008),<br />
is in the B. indicus lineage rather than the B. taurus lineage.<br />
Within the taurus sub-clade, strong bootstrap values also support<br />
the grouping of cHap51–cHap54 (Chianina, Romagnola, Cinisara,<br />
and Agerolese cattle breeds) and cHap49, 50, and 55 (Romagnola,<br />
Chianina and Italian Red Pied cattle breeds) (Fig. 3, V and IV<br />
respectively). Another statistically significant branching event forms<br />
two sub-clades: one including three Angus haplotypes (cHap33,<br />
cHap35, and cHap19); and one including the Japanese Black, Angus,<br />
and all of the hybrid haplotypes (Fig. 3, III and II respectively). All the<br />
hybrid haplotypes group into one sub-clade although this branching<br />
pattern is not statistically significant.<br />
We also examined the phylogenetic differences between the<br />
mtDNA genome sequences of Bull 86 and its clone, Bull 86 2<br />
(Westhusin et al., 2007). Bull 86 2 harbors a mtDNA haplotype from<br />
the recipient egg cell used in the cloning procedure and therefore does<br />
not share the same mtDNA haplotype as the original Bull 86. In fact,<br />
the two genomes (cHap18 and cHap19 from Bull 86 and Bull 86 2 ,<br />
respectively) differ by 18 SNPs and 1 indel, and fall into two distinct<br />
cattle sub-clades (II and III, respectively). To our knowledge, this is<br />
the first mtDNA genome sequence and phylogenetic comparison of<br />
an animal and its clone. This type of information may prove valuable<br />
in understanding phenotypic variability among clones.<br />
The bison/yak clade consists of two sub-clades divided by species:<br />
Bison bison (plains and wood bison; Fig. 3, VI) and Bos grunniens (yak;<br />
Fig. 3, VII). The large amount of analyzed sequence and high bootstrap<br />
values support the inclusion of the Bison genus within the Bos genus,<br />
with yak being more closely related to bison than to Bos indicus or<br />
Bos taurus.<br />
A more detailed analysis of plains and wood bison lineages reveals<br />
significant population substructure with highly significant bootstrap<br />
values (Fig. 4; see Supplemental Materials Table 4 for complete<br />
SNP table). Using yak as an outgroup, we analyzed the substructure<br />
of the representative bison group. A previously published sequence<br />
Gene name Abbreviation Fixed synonymous Fixed non-synonymous Fixed total Amino acid class changes Total polymorphic sites<br />
ATPase 6 ATP6 28 7 35 3 39<br />
ATPase 8 ATP8 9 4 13 3 15<br />
Cytochrome oxidase I COI 74 1 75 0 78<br />
Cytochrome oxidase II COII 43 3 46 2 47<br />
Cytochrome oxidase III COIII 40 6 46 4 51<br />
Cytochrome b CYTB 67 11 78 4 85<br />
NADH dehydrogenase 1 ND1 56 5 61 3 63<br />
NADH dehydrogenase 2 ND2 64 6 70 3 74<br />
NADH dehydrogenase 3 ND3 17 1 18 1 18<br />
NADH dehydrogenase 4 ND4 85 10 95 3 104<br />
NADH dehydrogenase 4L ND4(L) 14 2 16 2 17<br />
NADH dehydrogenase 5 ND5 114 25 139 11 147<br />
NADH dehydrogenase 6 ND6(L) 31 5 36 1 39<br />
Total 642 86 728 40 777<br />
Please cite this article as: Douglas, K.C., et al., Complete mitochondrial DNA sequence analysis of Bison bison and bison–cattle hybrids:<br />
Function and phylogeny, Mitochondrion (2010), doi:10.1016/j.mito.2010.09.005<br />
5
6 K.C. Douglas et al. / Mitochondrion xxx (2010) xxx–xxx<br />
Table 3<br />
Predicted changes in tRNA structure between bison and bison–cattle hybrids. Gray-shaded squares indicate the predicted position of SNPs in the tRNA structure; black square<br />
indicates SNPs in both loop and stem structures.<br />
Order from<br />
Table 1 Gene<br />
Fixed<br />
differences a<br />
1 tRNA-Phe 0 0<br />
3 tRNA-Val 0 0<br />
5 tRNA-Leu 1 1<br />
7 tRNA-Ile 2 0<br />
8 tRNA-Gln 2 0<br />
9 tRNA-Met 2 0<br />
11 tRNA-Trp 0 0<br />
12 tRNA-Ala 0 1<br />
13 tRNA-Asn 6 0<br />
14 tRNA-Cys 1 0<br />
15 tRNA-Tyr 1 0<br />
17 tRNA-Ser 0 3<br />
18 tRNA-Asp 4 0<br />
20 tRNA-Lys 2 0<br />
24 tRNA-Gly 3 0<br />
26 tRNA-Arg 1 0<br />
29 tRNA-His 0 0<br />
30 tRNA-Ser2 4 0<br />
31 tRNA-Leu2 3 0<br />
34 tRNA-Glu 1 0<br />
36 tRNA-Thr 3 0<br />
37 tRNA-Pro 2 0<br />
a<br />
Indicates number of fixed differences between bison and hybrid groups.<br />
b<br />
Indicates number of polymorphic sites within bison.<br />
roots the bison clade (Achilli et al., 2008) and is divergent from the<br />
other bison haplotypes analyzed in this study (Fig. 4, III). Unfortunately,<br />
this sequence was obtained from a bison at the Antwerp<br />
Zoo in Belgium that was originally procured through the University<br />
of Utrecht with no data indicating ancestral geographical origins<br />
Polymorphic<br />
dites b D loop/stem TψC loop/Stem Central loop<br />
Anticodon<br />
loop/stem<br />
Acceptor<br />
arm stem<br />
(Antonio Torroni, personal communication). A major sub-clade<br />
(Fig. 4, I) is formed from haplotypes from Fort Niobrara National<br />
Wildlife Refuge (bHap10), Yellowstone National Park (bHap17), the<br />
National Bison Range (bHap2), and the private bison herd. Another<br />
major sub-clade (Fig. 4, II) includes sequences from the Texas State<br />
Fig. 2. DNA alignment and predicted tRNA secondary structures of bison and bison–cattle hybrid haplotypes for tRNA-asparagine (asn). The DNA alignment was created in Clustal X<br />
(Larkin et al., 2007) and the predicted tRNA secondary structures were created using tRNAscan-SE (Lowe and Eddy, 1997). Differences between the bison and bison–cattle hybrid<br />
haplotypes are indicated in bold typeface. An asterisk (*) in the bison–cattle hybrid tRNA structure indicates the location of the indel (missing A nucleotide).<br />
Please cite this article as: Douglas, K.C., et al., Complete mitochondrial DNA sequence analysis of Bison bison and bison–cattle hybrids:<br />
Function and phylogeny, Mitochondrion (2010), doi:10.1016/j.mito.2010.09.005
Bison Herd (bHap13 and bHap16), the private bison herd, and two<br />
wood bison from Elk Island National Park (wHap14 and wHap15),<br />
which form unique haplotypes but do not group together.<br />
4. Discussion<br />
Although the bison–cattle hybrids found in nearly all public and<br />
private herds are thought to have normal fertility (Halbert and Derr,<br />
2007; Halbert et al., 2005), there are a large number of differences<br />
between the mtDNA genomes of the two species (Bison bison and<br />
Bos taurus). By comparing sequences from bison and hybrid animals,<br />
we identified at least one non-synonymous mutation in each of the<br />
13 protein-coding genes, with NADH5, cytochrome b, and NADH4<br />
harboring the largest number of mutations (25, 11, and 10,<br />
respectively; Table 2). In fact, the seven subunits of mitochondrial<br />
NADH dehydrogenase, which interact to form one large protein<br />
complex, have a total of 54 non-synonymous mutations and 24 amino<br />
acid class changes among all 7 subunits. Furthermore, differences<br />
between bison and hybrids were identified for 16 of the 22 tRNAs,<br />
which may affect tRNA secondary structure and function.<br />
The critical nature of the mitochondria in cellular function and<br />
necessary interaction of multiple protein complexes for proper<br />
mitochondrial function suggest that the additive effects of such<br />
large numbers of non-synonymous mutations will likely affect<br />
mitochondrial function and the overall fitness of the organism. It<br />
has been demonstrated in species ranging from Mus musculus to<br />
K.C. Douglas et al. / Mitochondrion xxx (2010) xxx–xxx<br />
Fig. 3. Maximum likelihood phylogenetic tree of complete mtDNA haplotypes of plains bison B. bison bison (indicated with a “b” before haplotype number), wood bison, B. bison<br />
athabascae (indicated with a “w”), Bos taurus (indicated with a “c”), Bos indicus (indicated with a “bi”), Hybrid Bos/Bison (indicated with a “h”), Bos grunniens (Yak 1–3), and Bubalus<br />
bubalis (Bub1). Clades: I — Bos indicus; II— Bos taurus and hybrids; III — Bos taurus (Angus); IV — Bos taurus (Romagnola, Chianina, and Italian Pied); V — Bos taurus (Chianina,<br />
Romagnola, Cinisara, and Agerolese); VI — bison; and VII — yak. Bootstrap values were determined using 1000 replicates.<br />
Caenorhabditis elegans that mutations in single protein-coding genes<br />
that cause severe mitochondrial disease significantly decrease the<br />
fitness of offspring and are often eliminated in the germline. However,<br />
less severe mitochondrial gene mutations can be propagated through<br />
multiple generations despite negative effects on the organism's health<br />
(Fan et al., 2008; Liau et al., 2007). The effects of mutations in multiple<br />
protein-coding genes, rDNA genes, and tRNAs as well as their additive<br />
biological effects are currently unknown and additional studies are<br />
needed to fully understand the implications of these differences on<br />
fitness at individual and population levels.<br />
Whereas novel combinations of nuclear alleles have been widely<br />
cited as the most likely cause of hybrid vigor (Arnold, 1997; Barton,<br />
2001; Stebbins, 1959), reduced fitness or hybrid breakdown in interspecies<br />
hybrids may be explained by disruptions in mitochondrial<br />
function due to incompatibilities between the nuclear and mitochondrial<br />
genomes (Burton et al., 2006). These effects have been noted in<br />
an array of organisms including arthropods, plants, yeast, mice,<br />
insects, and birds (Ellison and Burton, 2008; Johansen-Morris et al.,<br />
2006; Lee et al., 2008; Nagao et al., 1998; Sackton et al., 2003;<br />
Tieleman et al., 2009). Bison–cattle hybrids are an excellent<br />
mammalian model to study these issues, since the large number of<br />
observed sequence differences — many of which presumably result<br />
in functional changes — likely affect nuclear–mitochondrial gene<br />
interactions and may also affect fitness.<br />
The data generated in this study is also valuable in understanding<br />
the taxonomic classification of American bison, which has been<br />
Please cite this article as: Douglas, K.C., et al., Complete mitochondrial DNA sequence analysis of Bison bison and bison–cattle hybrids:<br />
Function and phylogeny, Mitochondrion (2010), doi:10.1016/j.mito.2010.09.005<br />
7
8 K.C. Douglas et al. / Mitochondrion xxx (2010) xxx–xxx<br />
Fig. 4. Maximum likelihood phylogenetic tree of bison complete mtDNA haplotypes rooted by Bos grunniens (yak). Clades: I — plains bison (Fort Niobrara NWR, Yellowstone NP,<br />
National Bison Range, private herd); II — plains and wood bison (Texas State Bison Herd, private herd, Elk Island NP); III — previously published bison sequence (Achilli et al., 2008);<br />
IV — Yak. NP, National Park; NWR, National Wildlife Refuge. Bootstrap values generated by sampling 1000 replicates.<br />
debated at the genus, species, and subspecies level. The paraphyletic<br />
nature of the Bos and Bison lineages has been shown based on both<br />
nuclear polymorphisms and analysis of individual mitochondrial<br />
regions (Burzynska et al., 1999; Decker et al., 2009; Janecek et al.,<br />
1996; Miyamoto et al., 1989; Wall et al., 1992). We also identified<br />
paraphyly of the Bos genus with respect to Bison based on whole<br />
mtDNA genome analysis, with bison and Bos grunniens forming a<br />
distinct clade from Bos taurus and Bos indicus (Fig. 3). Our data do not<br />
support the genus designation of Bison. The recent accumulation of<br />
molecular data, together with the fact that members of Bison can<br />
produce viable offspring with several species of Bos (van Gelder,<br />
1977), indicate that the Bison and Bos genera should be reunited.<br />
We identified significant phylogenetic substructure among bison<br />
(Fig. 4), which can be used to assess the relationship between the<br />
currently recognized subspecies of American bison (wood and plains).<br />
The two wood bison haplotypes do not form a single clade (wHap 14,<br />
15) and are mixed with plains bison haplotypes (Figs. 1 and 4). The<br />
fact that both of these haplotypes fall into a clade with plains bison<br />
suggests that wood bison may never have been a genetically distinct<br />
subspecies, although it is also possible that one or both of these<br />
sequences are derived from the introduction of plains bison into wood<br />
bison herds in the 1920s (Banfield and Novakowski, 1960; Roe, 1970).<br />
Regardless of the source of these haplotypes, however, current<br />
populations of B. bison bison and B. bison athabascae are not<br />
significantly different with respect to their mitochondrial genomic<br />
sequences and should not be considered subspecies. It does appear,<br />
however, that the currently listed B. bison athabascae are an important<br />
source of genetic diversity for the species, since the two wood bison<br />
haplotypes were not identified in any of the plains bison populations<br />
(also see Wilson and Strobeck, 1999).<br />
Haplotype analysis reveals further insights into the history and<br />
population structure of the bison species. Given the severe bottleneck<br />
experienced by bison in the late 19th century, when the total number<br />
of individuals in the species declined from approximately 30 million<br />
(Flores, 1991; McHugh, 1972) to less than 1000 (Coder, 1975; Soper,<br />
1941), it was somewhat unexpected that 16 bison mtDNA haplotypes<br />
were identified in this study (Supplemental Materials Table 1; Fig. 1).<br />
Even excluding the haplotypes which differ by only 1–2 nucleotides<br />
(e.g., bHap12/bHap3), at least 10 distinct bison mtDNA types were<br />
identified in this study. Others have also identified high levels of<br />
genetic diversity in the bison nuclear genome (Halbert and Derr,<br />
2008; Wilson and Strobeck, 1999), which may be due to the wide-<br />
Please cite this article as: Douglas, K.C., et al., Complete mitochondrial DNA sequence analysis of Bison bison and bison–cattle hybrids:<br />
Function and phylogeny, Mitochondrion (2010), doi:10.1016/j.mito.2010.09.005
spread distribution of bison prior to and following the bottleneck,<br />
a short bottleneck length, and rapid population expansion following<br />
the bottleneck.<br />
In addition, the relationships among bison haplotypes (Fig. 1) are<br />
generally reflective of the historical records of population establishment<br />
and genetic distances based on nuclear data (Halbert and Derr,<br />
2008). For example, the close relationship of haplotypes identified<br />
at the National Bison Range (bHap2) and Yellowstone National Park<br />
(bHap17) is explained by the shared history of the herds (Halbert and<br />
Derr, 2007) and is also reflected in the nuclear genome (Halbert and<br />
Derr, 2008). Additionally, we found that the private bison herd<br />
sampled in this study harbors both unique haplotypes and haplotypes<br />
representative of several sources including Fort Niobrara National<br />
Wildlife Refuge (cHap10), the National Bison Range (cHap2), and the<br />
Texas State Bison Herd (cHap13) (Supplemental Materials Table 1).<br />
This finding is not surprising given the fact that, like many private<br />
herds, this herd was founded with bison from many sources.<br />
5. Conclusion<br />
By using modern sequencing technologies to obtain whole mtDNA<br />
genome sequences from several bison and bison–cattle hybrids in<br />
this study, we have examined the potential effects of hybridization<br />
between American bison and cattle, analyzed the phylogenetic<br />
relationship between Bison and Bos, constructed the first whole<br />
mtDNA phylogenetic tree of American bison, and identified population<br />
substructure and subspecific relationships among bison populations.<br />
Additional studies are now clearly needed to understand the effects<br />
of cattle mtDNA in bison on mitochondrial function and physiology,<br />
evaluate the potential for fitness differences due to cattle mtDNA in<br />
bison, and define the taxonomic relationship of European bison (Bison<br />
bonasus, the only other extant species in the Bison genus) to American<br />
bison and the Bos genus.<br />
Supplementary materials related to this article can be found online<br />
at doi:10.1016/j.mito.2010.09.005.<br />
Acknowledgements<br />
The authors thank <strong>Dr</strong>. Nicole Ramlachan for assistance with DNA<br />
extractions.<br />
References<br />
Achilli, A., Olivieri, A., Pellecchia, M., Uboldi, C., Colli, L., Al-Zahery, N., Accetturo, M.,<br />
Pala, M., Kashani, B.H., Perego, U.A., Battaglia, V., Fornarino, S., Kalamati, J.,<br />
Houshmand, M., Negrini, R., Semino, O., Richards, M., Macaulay, V., Ferretti, L.,<br />
Bandelt, H.J., Ajmone-Marsan, P., Torroni, A., 2008. Mitochondrial genomes of<br />
extinct aurochs survive in domestic cattle. Current Biology 18, R157–R158.<br />
Arnold, M.L., 1997. Natural Hybridization and Evolution. Oxford University Press,<br />
New York.<br />
Banfield, A.W.F., Novakowski, N.S., 1960. The survival of the wood bison (Bison bison<br />
athabascae Rhoads) in the northwest territories. Natural History Papers, National<br />
Museum of Canada 8, 1–6.<br />
Barrientos, A., Kenyon, L., Moraes, C.T., 1998. Human xenomitochondrial cybrids.<br />
Cellular models of mitochondrial complex I deficiency. Journal of Biological<br />
Chemistry 273, 14210–14217.<br />
Barton, N.H., 2001. The role of hybridization in evolution. Molecular Ecology 10,<br />
551–568.<br />
Benson, D.A., Karsch-Mizrachi, I., Lipman, D.J., Ostell, J., Wheeler, D.L., 2005. GenBank.<br />
Nucleic Acids Research 33, D34–D38.<br />
Bolnick, D.I., Turelli, M., Lopez-Fernandez, H., Wainwright, P.C., Near, T.J., 2008.<br />
Accelerated mitochondrial evolution and “Darwin's corollary”: asymmetric<br />
viability of reciprocal F1 hybrids in Centrarchid fishes. Genetics 178, 1037–1048.<br />
Boore, J.L., Macey, J.R., Medina, M., 2005. Sequencing and comparing whole<br />
mitochondrial genomes of animals. Methods in Enzymology 395, 311–348.<br />
Bork, A.M., Strobeck, C.M., Yeh, F.C., Hudson, R.J., Salmon, R.K., 1991. Genetic<br />
relationship of wood and plains bison based on restriction fragment length<br />
polymorphisms. Canadian Journal of Zoology 69, 43–48.<br />
Bortot, B., Barbi, E., Biffi, S., Angelini, C., Faleschini, E., Severini, G.M., Carrozzi, M., 2009.<br />
Two novel cosegregating mutations in tRNAMet and COX III, in a patient with<br />
exercise intolerance and autoimmune polyendocrinopathy. Mitochondrion 9,<br />
123–129.<br />
K.C. Douglas et al. / Mitochondrion xxx (2010) xxx–xxx<br />
Boyd, M.M., 1908. A short account of an experiment in crossing the American bison with<br />
domestic cattle. Annual Report of the American Breeders' Association, pp. 324–331.<br />
Burton, M., 1962. Systematic Dictionary of Mammals of the World. <strong>Thomas</strong> Y. Crowell<br />
Co., New York.<br />
Burton, R.S., Rawson, P.D., Edmands, S., 1999. Genetic architecture of physiological<br />
phenotypes: empirical evidence for coadapted gene complexes. American Zoologist<br />
39, 451–462.<br />
Burton, R.S., Ellison, C.K., Harrison, J.S., 2006. The sorry state of F2 hybrids: consequences<br />
of rapid mitochondrial DNA evolution in allopatric populations. The American<br />
Naturalist 168 (Suppl 6), S14–S24.<br />
Burzynska, B., Olech, W., Topczewski, J., 1999. Phylogeny and genetic variation of the<br />
European bison Bison bonasus based on mitochondrial DNA D-loop sequences. Acta<br />
Theriologica 44, 253–262.<br />
Cao, S.Y., Wu, X.B., Yan, P., Hu, Y.L., Su, X., Jiang, Z.G., 2006. Complete nucleotide<br />
sequences and gene organization of mitochondrial genome of Bufo gargarizans.<br />
Mitochondrion 6, 186–193.<br />
Clement, M., Posada, D., Crandall, K.A., 2000. TCS: a computer program to estimate gene<br />
genealogies. Molecular Ecology 9, 1657–1659.<br />
Coder, G.D., 1975. The national movement to preserve the American buffalo in the<br />
United States and Canada between 1880 and 1920, Ph.D. Dissertation (History).<br />
The Ohio State University, Columbus, p. 348.<br />
Corbet, G.B., 1978. The Mammals of the Paleoarctic Region: a Taxonomic Review. British<br />
Museum of Natural History, London.<br />
Decker, J.E., Pires, J.C., Conant, G.C., McKay, S.D., Heaton, M.P., Chen, K., Cooper, A., Vilkki,<br />
J., Seabury, C.M., Caetano, A.R., Johnson, G.S., Brenneman, R.A., Hanotte, O., Eggert,<br />
L.S., Wiener, P., Kim, J.J., Kim, K.S., Sonstegard, T.S., Van Tassell, C.P., Neibergs, H.L.,<br />
McEwan, J.C., Brauning, R., Coutinho, L.L., Babar, M.E., Wilson, G.A., McClure, M.C.,<br />
Rolf, M.M., Kim, J., Schnabel, R.D., Taylor, J.F., 2009. Resolving the evolution of<br />
extant and extinct ruminants with high-throughput phylogenomics. Proceedings<br />
of the National Academy of Sciences 106, 18644–18649.<br />
Ellison, C.K., Burton, R.S., 2008. Interpopulation hybrid breakdown maps to the<br />
mitochondrial genome. Evolution 62, 631–638.<br />
Elstner, M., Andreoli, C., Ahting, U., Tetko, I., Klopstock, T., Meitinger, T., Prokisch, H.,<br />
2008. MitoP2: an integrative tool for the analysis of the mitochondrial proteome.<br />
Molecular Biotechnology 40, 306–315.<br />
Fan, W., Waymire, K.G., Narula, N., Li, P., Rocher, C., Coskun, P.E., Vannan, M.A., Narula, J.,<br />
Macgregor, G.R., Wallace, D.C., 2008. A mouse model of mitochondrial disease<br />
reveals germline selection against severe mtDNA mutations. Science 319, 958–962.<br />
Florentz, C., Sohn, B., Tryeoen-Tóth, P., Pütz, J., Sissler, M., 2003. Human mitochondrial<br />
tRNAs in health and disease. Cellular and Molecular Life Sciences 60, 1356–1375.<br />
Flores, D., 1991. Bison ecology and bison diplomacy: the southern plains from 1800 to<br />
1850. Journal of American History 465–485.<br />
Garretson, M.S., 1938. The American Bison: The Story of its Extermination as a Wild<br />
Species and its Restoration under Federal Protection. New York Zoological Society,<br />
New York.<br />
Geist, V., 1991. Phantom subspecies: the wood bison Bison bison “athabascae” Rhoads<br />
1897 is not a valid taxon, but an ecotype. Arctic 44, 283–300.<br />
Gissi, C., Iannelli, F., Pesole, G., 2008. Evolution of the mitochondrial genome of Metazoa<br />
as exemplified by comparison of congeneric species. Heredity 101, 301–320.<br />
Goodnight, C., 1914. My experience with bison hybrids. Journal of Heredity 5, 197–199.<br />
Groves, C.P., 1981. Systematic relationships in the Bovini (Artiodactyla, Bovidae).<br />
Journal of Zoological Systematics and Evolutionary Research 19, 264–278.<br />
Halbert, N.D., Derr, J.N., 2007. A comprehensive evaluation of cattle introgression into<br />
US federal bison herds. Journal of Heredity 98, 1–12.<br />
Halbert, N.D., Derr, J.N., 2008. Patterns of genetic variation in US federal bison herds.<br />
Molecular Ecology 17, 4963–4977.<br />
Halbert, N.D., Ward, T.J., Schnabel, R.D., Taylor, J.F., Derr, J.N., 2005. Conservation<br />
genomics: disequilibrium mapping of domestic cattle chromosomal segments in<br />
North American bison populations. Molecular Ecology 14, 2343–2362.<br />
Harrison, J.S., Burton, R.S., 2006. Tracing hybrid incompatibilities to single amino acid<br />
substitutions. Molecular Biology and Evolution 23, 559–564.<br />
Hartl, G.B., Goltenboth, R., Grillitsch, M., Willing, R., 1988. On the biochemical<br />
systematics of the Bovini. Biochemical Systematics and Ecology 16, 575–579.<br />
Isenberg, A.C., 2000. The Destruction of the Bison: An Environmental History, 1750–1920.<br />
Cambridge University Press, New York.<br />
Janecek, L.L., Honeycutt, R.L., Adkins, R.M., Davis, S.K., 1996. Mitochondrial gene<br />
sequences and the molecular systematics of the Artiodactyl subfamily Bovinae.<br />
Molecular Phylogenetics and Evolution 6, 107–119.<br />
Johansen-Morris, A.D., Latta, R.G., Mauricio, R., 2006. Fitness consequences of<br />
hybridization between ecotypes of Avena barbata: hybrid breakdown, hybrid<br />
vigor, and transgressive segregation. Evolution 60, 1585–1595.<br />
Jones, C.J., 1907. Breeding cattelo. Annual Report of the American Breeders' Association<br />
3, 161–165.<br />
Larkin, M.A., Blackshields, G., Brown, N.P., Chenna, R., McGettigan, P.A., McWilliam, H.,<br />
Valentin, F., Wallace, I.M., Wilm, A., Lopez, R., Thompson, J.D., Gibson, T.J., Higgins,<br />
D.G., 2007. Clustal W and Clustal X version 2.0. Bioinformatics 23, 2947–2948.<br />
Lee, H.Y., Chou, J.Y., Cheong, L., Chang, N.H., Yang, S.Y., Leu, J.Y., 2008. Incompatibility of<br />
nuclear and mitochondrial genomes causes hybrid sterility between two yeast<br />
species. Cell 135, 1065–1073.<br />
Liau, W.S., Gonzalez-Serricchio, A.S., Deshommes, C., Chin, K., LaMunyon, C.W., 2007. A<br />
persistent mitochondrial deletion reduces fitness and sperm performance in<br />
heteroplasmic populations of C. elegans. BMC Genetics 8, 8.<br />
Librado, P., Rozas, J., 2009. DnaSP v5: a software for comprehensive analysis of DNA<br />
polymorphism data. Bioinformatics 25, 1451–1452.<br />
Liepins, A., Hennen, S., 1977. Cytochrome oxidase deficiency during development of<br />
amphibian nucleocytoplasmic hybrids. Developmental Biology 57, 284–292.<br />
Please cite this article as: Douglas, K.C., et al., Complete mitochondrial DNA sequence analysis of Bison bison and bison–cattle hybrids:<br />
Function and phylogeny, Mitochondrion (2010), doi:10.1016/j.mito.2010.09.005<br />
9
10 K.C. Douglas et al. / Mitochondrion xxx (2010) xxx–xxx<br />
Loftus, R.T., MacHugh, D.E., Bradley, D.G., Sharp, P.M., 1994. Evidence for two<br />
independent domestications of cattle. Proceedings of the National Academy of<br />
Sciences USA 91, 2757–2761.<br />
Lowe, T.M., Eddy, S.R., 1997. tRNAscan-SE: a program for improved detection of transfer<br />
RNA genes in genomic sequence. Nucleic Acids Research 25, 955–964.<br />
McDonald, J.N., 1981. North American Bison: Their Classification and Evolution. University<br />
of California Press, Berkeley.<br />
McHugh, T., 1972. The Time of the <strong>Buffalo</strong>. University of Nebraska Press, Lincoln.<br />
Meagher, M., 1986. Bison bison. Mammalian Species 266, 1–8.<br />
Miyamoto, M.M., Tanhauser, S.M., Laipis, P.J., 1989. Systematic relationships in the<br />
Artiodactyl tribe Bovini (family Bovidae), as determined from mitochondrial DNA<br />
sequences. Systematic Zoology 38, 342–349.<br />
Nagao, Y., Totsuka, Y., Atomi, Y., Kaneda, H., Lindahl, K.F., Imai, H., Yonekawa, H., 1998.<br />
Decreased physical performance of congenic mice with mismatch between the<br />
nuclear and the mitochondrial genome. Genes and Genetic Systems 73, 21–27.<br />
Peden, D.G., Kraay, G.J., 1979. Comparison of blood characteristics in plains bison, wood<br />
bison, and their hybrids. Canadian Journal of Zoology 57, 1778–1784.<br />
Prokisch, H., Andreoli, C., Ahting, U., Heiss, K., Ruepp, A., Scharfe, C., Meitinger, T., 2006.<br />
MitoP2: the mitochondrial proteome database—now including mouse data. Nucleic<br />
Acids Research 34, D705–D711.<br />
Roe, F.G., 1970. The North American <strong>Buffalo</strong>: A Critical Study of the Species in its Wild<br />
State, 2nd ed. University of Toronto Press, Toronto.<br />
Sackton, T.B., Haney, R.A., Rand, D.M., 2003. Cytonuclear coadaptation in <strong>Dr</strong>osophila:<br />
disruption of cytochrome c oxidase activity in backcross genotypes. Evolution 57,<br />
2315–2325.<br />
Sambrook, J., Fritsch, E.F., Maniatis, T., 1989. Molecular Cloning: A Laboratory Manual,<br />
2nd ed. Cold Spring Harbor Laboratory Press, Plainview, NY.<br />
Santamaria, M., Lanave, C., Vicario, S., Saccone, C., 2007. Variability of the mitochondrial<br />
genome in mammals at the inter-species/intra-species boundary. Journal of<br />
Biological Chemistry 388, 943–946.<br />
Simon, C., Buckley, T.R., Frati, F., Stewart, J.B., Beckenbach, A.T., 2006. Incorporating<br />
molecular evolution into phylogenetic analysis, and a new compilation of<br />
conserved polymerase chain reaction primers for animal mitochondrial DNA.<br />
Annual Review of Ecology, Evolution, and Systematics 545–579.<br />
Soper, J.D., 1941. History, range and home life of the northern bison. Ecological<br />
Monographs 11, 349–410.<br />
Stamatakis, A., 2006. RAxML-VI-HPC: maximum likelihood-based phylogenetic<br />
analyses with thousands of taxa and mixed models. Bioinformatics 22, 2688–2690.<br />
Stebbins, G.L., 1959. The role of hybridization in evolution. Proceedings of the American<br />
Philosophical Society 103, 231–251.<br />
Steklenev, E.P., Yasinetskaya, N.I., 1982. Results of crossing of the bison (Bison bison<br />
bison L.) with the domestic cow (Bos (Bos) taurus typicus) and characteristics<br />
of the chromosome complexes of the hybrid progeny. Tsitologiya i Genetika 16,<br />
28–33.<br />
Stormont, C., Miller, W.J., Suzuki, Y., 1961. Blood groups and the taxonomic status of<br />
American buffalo and domestic cattle. Evolution 15, 196–208.<br />
Tanaka, N., Goto, Y., Akanuma, J., Kato, M., Kinoshita, T., Yamashita, F., Tanaka, M., Asada,<br />
T., 2010. Mitochondrial DNA variants in a Japanese population of patients with<br />
Alzheimer's disease. Mitochondrion 10, 32–37.<br />
Tieleman, B.I., Versteegh, M.A., Fries, A., Helm, B., Dingemanse, N.J., Gibbs, H.L.,<br />
Williams, J.B., 2009. Genetic modulation of energy metabolism in birds through<br />
mitochondrial function. Proceedings of the Royal Society B-Biological Sciences 276,<br />
1685–1693.<br />
van Gelder, R.G., 1977. Mammalian hybrids and generic limits. American Museum<br />
Novitates 2635, 1–25.<br />
van Zyll de Jong, C.G., 1986. A systematic study of recent bison, with particular<br />
consideration of the wood bison (Bison bison athabascase Rhodes 1898).<br />
Publication in Natural Sciences No. 6. National Museums of Canada, Ottawa, ON.<br />
Vogel, A.B., Tenggardjaja, K., Edmands, S., Halbert, N.D., Derr, J.N., Hedgecock, D., 2007.<br />
Detection of mitochondrial DNA from domestic cattle in bison on Santa Catalina<br />
Island. Animal Genetics 38, 410–412.<br />
Wall, D.A., Davis, S.K., Read, B.M., 1992. Phylogenetic relationships in the subfamily<br />
Bovinae (Mammalia: Artiodactyla) based on ribosomal DNA. Journal of Mammalogy<br />
73, 262–275.<br />
Wallace, D.C., 1994. Mitochondrial DNA sequence variation in human evolution and<br />
disease. Proceedings of the National Academy of Science U S A 91, 8739–8746.<br />
Ward, T.J., Bielawski, J.P., Davis, S.K., Templeton, J.W., Derr, J.N., 1999. Identification of<br />
domestic cattle hybrids in wild cattle and bison species: a general approach using<br />
mtDNA markers and the parametric bootstrap. Animal Conservation 2, 51–57.<br />
Westhusin, M.E., Shin, T., Templeton, J.W., Burghardt, R.C., Adams, L.G., 2007. Rescuing<br />
valuable genomes by animal cloning: a case for natural disease resistance in cattle.<br />
Journal of Animal Science 85, 138–142.<br />
Wilson, D.E., Reeder, D.M., 1993. Mammal Species of the World: A Taxonomic and<br />
Geographic Reference, 2nd ed. Smithsonian Inst. Press, Washington, D.C, p. 1206.<br />
Wilson, G.A., Strobeck, C.M., 1999. Genetic variation within and relatedness among<br />
wood and plains bison populations. Genome 42, 483–496.<br />
Yamaoka, M., Isobe, K., Shitara, H., Yonekawa, H., Miyabayashi, S., Hayashi, J.I., 2000.<br />
Complete repopulation of mouse mitochondrial DNA-less cells with rat mitochondrial<br />
DNA restores mitochondrial translation but not mitochondrial respiratory<br />
function. Genetics 155, 301–307.<br />
Zardoya, R., Meyer, A., 1996. Phylogenetic performance of mitochondrial protein-coding<br />
genes in resolving relationships among vertebrates. Molecular Biology and<br />
Evolution 13, 933–942.<br />
Please cite this article as: Douglas, K.C., et al., Complete mitochondrial DNA sequence analysis of Bison bison and bison–cattle hybrids:<br />
Function and phylogeny, Mitochondrion (2010), doi:10.1016/j.mito.2010.09.005