Memorial AREA (HOUSTON TEXAS) _Demographic and Income Profile . City of Houston Super Neighborhood Demographic and Income Profile
Memorial AREA (HOUSTON TEXAS) _Demographic and Income Profile . City of Houston Super Neighborhood Demographic and Income Profile
Memorial AREA (HOUSTON TEXAS) _Demographic and Income Profile . City of Houston Super Neighborhood Demographic and Income Profile

You also want an ePaper? Increase the reach of your titles
YUMPU automatically turns print PDFs into web optimized ePapers that Google loves.
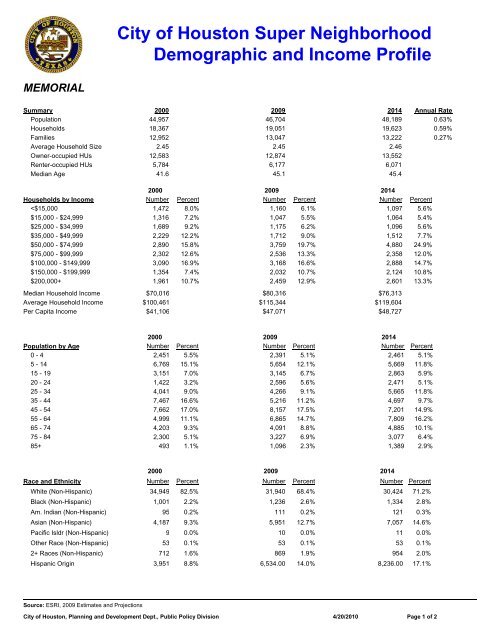
MEMORIAL<br />
<strong>City</strong> <strong>of</strong> <strong>Houston</strong> <strong>Super</strong> <strong>Neighborhood</strong><br />
<strong>Demographic</strong> <strong>and</strong> <strong>Income</strong> <strong>Pr<strong>of</strong>ile</strong><br />
Summary 2000 2009 2014 Annual Rate<br />
Population 44,957 46,704 48,189 0.63%<br />
Households 18,367 19,051 19,623 0.59%<br />
Families 12,952 13,047 13,222 0.27%<br />
Average Household Size 2.45 2.45 2.46<br />
Owner-occupied HUs 12,583 12,874 13,552<br />
Renter-occupied HUs 5,784 6,177 6,071<br />
Median Age 41.6 45.1 45.4<br />
2000 2009 2014<br />
Households by <strong>Income</strong> Number Percent Number Percent Number Percent<br />
MEMORIAL<br />
<strong>City</strong> <strong>of</strong> <strong>Houston</strong> <strong>Super</strong> <strong>Neighborhood</strong><br />
<strong>Demographic</strong> <strong>and</strong> <strong>Income</strong> <strong>Pr<strong>of</strong>ile</strong><br />
2000 2009<br />
Educational Attainment Number Percent Number Percent<br />
Less than 9th Grade 427 1.4% 462 22.0%<br />
Some High School 982 3.2% 898 22.0%<br />
High School Graduate 3,394 11.0% 3,987 22.0%<br />
Some College 5,922 19.1% 5,717 22.0%<br />
Associates Degree 1,250 4.0% 1,511 22.0%<br />
Bachelors Degree 12,288 39.7% 13,088 22.0%<br />
Graduate Degree 6,678 21.6% 7,256 22.0%<br />
Employment (age 16+) 2000 2009 2014<br />
Employed Civilian 20,355 19,498 20,932<br />
Unemployed 741 1,534 1,071<br />
Unemployment Rate 3.5 %<br />
7.3 %<br />
4.9%<br />
Percent<br />
Percent<br />
16<br />
14<br />
12<br />
10<br />
8<br />
6<br />
4<br />
2<br />
0<br />
60<br />
50<br />
40<br />
30<br />
20<br />
10<br />
0<br />
2009 Population by Age<br />
Age<br />
Age 0-4 Age 5-14 Age 15-19 Age 20-24 Age 25-34 Age 35-44<br />
Age 45-54 Age 55-64 Age 65-74 Age 75-84 Age 85+<br />
2009 Population by Race/Ethnicity<br />
Race/Ethnicity<br />
Non-Hispanic White Non-Hispanic Black Non-Hispanic Am. Indian<br />
Non-Hispanic Asian Non-Hispanic Pac. Islndr. Non-Hispanic Other Race<br />
Non-Hispanic 2+ Races Hispanic<br />
Source: ESRI, 2009 Estimates <strong>and</strong> Projections<br />
Percent<br />
18<br />
16<br />
14<br />
12<br />
10<br />
8<br />
6<br />
4<br />
2<br />
0<br />
16<br />
14<br />
12<br />
10<br />
8<br />
6<br />
4<br />
2<br />
0<br />
2014 Population by Age<br />
Age<br />
Age 0-4 Age 5-14 Age 15-19 Age 20-24 Age 25-34 Age 35-44<br />
Age 45-54 Age 55-64 Age 65-74 Age 75-84 Age 85+<br />
2009 Annual Average Household <strong>Income</strong><br />
Household <strong>Income</strong><br />
Less than $15K $15K - $25K $25K - $35K $35K - $50K $50K - $75K<br />
$75K - $100K $100K - $150K $150K - $200K $200K or More<br />
<strong>City</strong> <strong>of</strong> <strong>Houston</strong>, Planning <strong>and</strong> Development Dept., Public Policy Division 4/20/2010 Page 2 <strong>of</strong> 2