use of satellite images in meteorology - Frederick University
use of satellite images in meteorology - Frederick University
use of satellite images in meteorology - Frederick University

You also want an ePaper? Increase the reach of your titles
YUMPU automatically turns print PDFs into web optimized ePapers that Google loves.
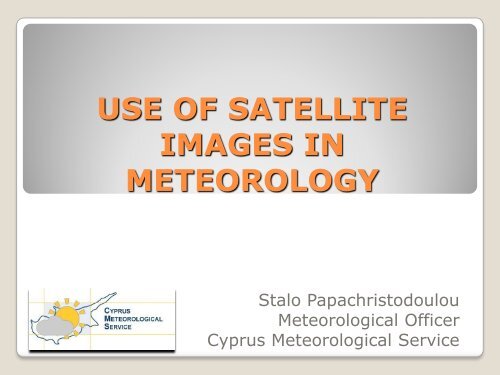
USE OF SATELLITE<br />
IMAGES IN<br />
METEOROLOGY<br />
Stalo Papachristodoulou<br />
Meteorological Officer<br />
Cyprus Meteorological Service
DEFINITIONS<br />
METEOROLOGY<br />
The scientific study <strong>of</strong> the atmosphere that foc<strong>use</strong>s on<br />
weather processes and forecast<strong>in</strong>g.<br />
SATELLITE METEOROLOGY<br />
The study <strong>of</strong> the earth's atmosphere and oceans us<strong>in</strong>g data<br />
obta<strong>in</strong>ed from remote sens<strong>in</strong>g devices from <strong>satellite</strong>s<br />
orbit<strong>in</strong>g the earth<br />
METEOROLOGICAL OR WEATHER SATELLITE<br />
A type <strong>of</strong> <strong>satellite</strong> that is primarily <strong>use</strong>d to monitor the<br />
weather and climate <strong>of</strong> the Earth<br />
Apart from meteorological, other types <strong>of</strong> environmental<br />
<strong>in</strong>formation collected us<strong>in</strong>g weather <strong>satellite</strong>s<br />
Can be polar orbit<strong>in</strong>g and geostationary<br />
2
DEFINITIONS<br />
METEOROLOGICAL SATELLITE:<br />
The geostationary <strong>satellite</strong>s<br />
Fly at an altitude <strong>of</strong> about 36,000km<br />
Each provides almost cont<strong>in</strong>uous imagery and<br />
communications support over a wide region <strong>of</strong> the planet<br />
Each can generate full earth disc <strong>images</strong> cover<strong>in</strong>g nearly<br />
one quarter <strong>of</strong> the Earth’s surface, day and night<br />
The polar orbit<strong>in</strong>g <strong>satellite</strong>s<br />
Fly <strong>in</strong> much lower orbits, at around 850km and less<br />
Each can observe the entire planet twice <strong>in</strong> each 24-hour<br />
period, with better resolution than the geostationary<br />
<strong>satellite</strong>s<br />
3
HISTORY<br />
Vanguard 2, the first Weather Sat, launched 17 Feb 1959 with no<br />
success. TIROS-1, the first successful weather Sat, launched 1 Apr<br />
1960.<br />
The first picture <strong>of</strong> Earth,<br />
taken by the polar orbit<strong>in</strong>g<br />
<strong>satellite</strong> TIROS-1, the first<br />
weather <strong>satellite</strong>, to be<br />
considered success.<br />
Launched by NASA on<br />
April 1, 1960. Although the<br />
spacecraft operated only<br />
78 days, meteorologists<br />
worldwide were ecstatic<br />
over the <strong>images</strong> <strong>of</strong> the<br />
Earth and its cloud cover<br />
that TIROS relayed back<br />
to the ground<br />
4
ELECTROMAGNETIC SPECTRUM -<br />
CHANNELS<br />
Meteorological <strong>satellite</strong>s can measure a wide spectrum <strong>of</strong><br />
electromagnetic radiation <strong>in</strong> real time, provid<strong>in</strong>g the<br />
meteorologist with a supplemental source <strong>of</strong> data for the<br />
whole globe<br />
Observation is typically made via different 'channels' <strong>of</strong> the<br />
Electromagnetic spectrum<br />
For Meteorology the Visible and Infrared portions are <strong>use</strong>d<br />
Some <strong>of</strong> these channels <strong>in</strong>clude:<br />
◦ Visible and Near Infrared: 0.6 μm - 1.6 μm<br />
For record<strong>in</strong>g cloud cover dur<strong>in</strong>g the day<br />
◦ Infrared: 3.9 μm - 7.3 μm (Water Vapour)<br />
8.7 μm, - 13.4 μm (Thermal imag<strong>in</strong>g)<br />
5
ELECTROMAGNETIC SPECTRUM -<br />
CHANNELS<br />
Visible (VIS) spectrum<br />
Visible-light <strong>images</strong> can be viewed only dur<strong>in</strong>g local daylight hours<br />
For Meteorological purposes Visible 0.6 and 0.8 microns are <strong>use</strong>d from Meteosat Sat<br />
Easy to <strong>in</strong>terpret clouds, cloud systems such as fronts and storms, lakes, forests,<br />
mounta<strong>in</strong>s, snow ice, fires, and pollution such as smoke, smog, volcanic ash, dust<br />
and haze are readily apparent. W<strong>in</strong>d can be determ<strong>in</strong>ed by cloud patterns,<br />
alignments and movement from successive photos<br />
Infrared (IR) spectrum<br />
A major advantage <strong>of</strong> IR is that it can be viewed 24 hours a day<br />
The <strong>in</strong>frared <strong>images</strong> enable a tra<strong>in</strong>ed analyst to determ<strong>in</strong>e cloud heights and types,<br />
to calculate land and surface water temperatures, and to locate ocean surface<br />
features<br />
For Meteorological purposes Infrared 10 to 12 microns are <strong>use</strong>d most widely<br />
Water vapor <strong>images</strong><br />
Is a slight modification <strong>of</strong> the IR <strong>images</strong> - return an <strong>in</strong>tegrated amount <strong>of</strong> water<br />
vapor <strong>in</strong> the atmosphere<br />
WV channel 6.2 and 7.3 microns - <strong>use</strong>d for the study <strong>of</strong> the upper atmosphere.<br />
Moist and dry areas identification<br />
6
VIS SAT IMAGE 05/04/2010<br />
1100UTC<br />
MET9 VIS006<br />
7
VIS SAT IMAGE WESTERN EUROPE<br />
05/04/2010 1100UTC<br />
MET9 VIS006 COLOURED<br />
8
IR SAT IMAGE WESTERN EUROPE<br />
05/04/2010 1200UTC<br />
MET9 IR108<br />
9
WV062 SAT IMAGE WESTERN<br />
EUROPE 05/04/2010 1200UTC<br />
MET9 WV6.2<br />
10
SAT IMAGES- MET9 WV062<br />
30/03/2010 0700UTC<br />
MET9 WV6.2 GLOBE MET9 WV6.2<br />
WESTERN ATLANTIC<br />
11
FROM IMAGES AND DATA PROCESSING<br />
NEW USEFUL IMAGES DERIVED<br />
Apart from the 12 Meteosat’s channels (IR, VIS, WV),<br />
most widely <strong>use</strong>d, other available Images are:<br />
RGB Composites: Airmass, Ash, Dust, Eview, Fog,<br />
Microphysics, Natural Colour and Snow Images<br />
Visualised Products: Some <strong>of</strong> these products are: AMV<br />
Atmospheric Motion Vectors, MPE Multi-sensor Precipitation<br />
Estimate, CDS Climate Data Set, CLA Cloud Analysis, SST<br />
Sea Surface Temperature, GII Global Instability Index, etc<br />
Images <strong>of</strong> RGBs and Visualized Products are available on<br />
EUMETSAT’s website http://www.eumetsat.<strong>in</strong>t/<br />
Images <strong>of</strong> RGBs and Visualized Products are shown <strong>in</strong> the<br />
follow<strong>in</strong>g slides<br />
12
RGB IMAGES WESTERN EUROPE<br />
05/04/2010 12UTC<br />
MET9 RGB-DUST<br />
CHANNEL<br />
MET9 RGB-<br />
MICRODAYSUMMER<br />
13
VISUALIZED PRODUCTS<br />
AMV 05/04/2010<br />
1045UTC<br />
MPE 05/04/2010<br />
1045UTC<br />
14
SATELLITE CONTRIBUTION TO<br />
METEOROLOGY<br />
Enormous improvements <strong>in</strong> the accuracy <strong>of</strong> weather<br />
forecast<strong>in</strong>g due to modern technology and the<br />
availability <strong>of</strong> data provided by coord<strong>in</strong>ated<br />
meteorological observ<strong>in</strong>g networks, <strong>in</strong>clud<strong>in</strong>g <strong>satellite</strong>s.<br />
Today, the global system <strong>of</strong> operational meteorological<br />
<strong>satellite</strong>s <strong>in</strong>cludes a constellation which is evenly spaced<br />
around the equator <strong>in</strong> geostationary orbit, and at least<br />
two further <strong>satellite</strong>s <strong>in</strong> near-polar orbits.<br />
Satellites monitor changes <strong>in</strong> surface conditions:<br />
Urban heat island<br />
Sea and land surface temperature<br />
Vegetation<br />
Snow and Ice cover<br />
15
SATELLITE CONTRIBUTION TO<br />
METEOROLOGY<br />
Satellite monitor changes <strong>in</strong> atmospheric<br />
conditions<br />
Ozone (and other trace gases) concentration<br />
Cloud cover and type<br />
Aerosols/Pollution<br />
Temperature structure<br />
Satellite monitor changes <strong>in</strong> Top <strong>of</strong> Atmosphere<br />
energy budget<br />
Incom<strong>in</strong>g and out go<strong>in</strong>g solar energy<br />
Outgo<strong>in</strong>g terrestrial energy<br />
16
SATELLITE CONTRIBUTION TO<br />
METEOROLOGY - more details<br />
Satellite missions provide a wide range <strong>of</strong> valuable data for<br />
weather monitor<strong>in</strong>g, forecast<strong>in</strong>g and warn<strong>in</strong>gs, <strong>in</strong>clud<strong>in</strong>g:<br />
Visible and Infra-red imagery <strong>of</strong> the Earth’s surface and<br />
atmosphere:<br />
such imagery is usually the only means <strong>of</strong> obta<strong>in</strong><strong>in</strong>g cont<strong>in</strong>ually<br />
updated quantitative <strong>in</strong>formation about cloud over a wide area<br />
are <strong>use</strong>d to determ<strong>in</strong>e the movement <strong>of</strong> the atmosphere –<br />
provid<strong>in</strong>g the ma<strong>in</strong> source <strong>of</strong> w<strong>in</strong>d <strong>in</strong>formation for NWP models<br />
<strong>in</strong>frared imagery is <strong>use</strong>d to determ<strong>in</strong>e cloud top temperature<br />
Atmospheric humidity and temperature pr<strong>of</strong>iles:<br />
vertical pr<strong>of</strong>iles <strong>of</strong> humidity and temperature can be obta<strong>in</strong>ed –<br />
which are at the heart <strong>of</strong> daily weather forecasts us<strong>in</strong>g NWP<br />
models and have improved forecasts significantly<br />
17
SATELLITE CONTRIBUTION TO<br />
METEOROLOGY-more details<br />
Ozone concentration pr<strong>of</strong>iles:<br />
Under developments to add <strong>satellite</strong> measurements <strong>of</strong> ozone (from<br />
sounder <strong>in</strong>struments) as a new NWP model variable;<br />
Sea surface temperature estimates:<br />
Are required for low level cloud diagnosis and<br />
For seasonal to <strong>in</strong>ter-annual forecasts – especially <strong>in</strong> the tropics;<br />
Precipitation and liquid water:<br />
Microwave imagers and sounders on <strong>satellite</strong>s provide <strong>in</strong>formation on<br />
precipitation, and their k<strong>in</strong>d over the oceans<br />
Sea surface w<strong>in</strong>ds: the strength, direction and circulation patterns <strong>of</strong><br />
the surface w<strong>in</strong>d is <strong>of</strong> great importance for <strong>meteorology</strong> and climate<br />
studies –<br />
help to def<strong>in</strong>e storm centers,<br />
detect patterns associated with <strong>in</strong>ter-seasonal climate variations such<br />
as the El Niño/Southern Oscillation (ENSO), which affects the weather<br />
over large parts <strong>of</strong> the planet<br />
18
The impact <strong>of</strong> <strong>satellite</strong> observations on weather forecast accuracies dur<strong>in</strong>g the<br />
1980’s and 1990’s is evident <strong>in</strong> this chart – particularly for the Southern<br />
hemisphere where weather stations are relatively sparse (% scale is the<br />
evolution <strong>of</strong> annual mean forecast skill for the European Centre or Medium<br />
Range Weather Forecast<strong>in</strong>g)<br />
19
WHY DO WE USE SATELLITES IN<br />
METEOROLOGY ?<br />
Meteorologists <strong>use</strong> Satellite<br />
<strong>images</strong> for:<br />
Weather monitor<strong>in</strong>g<br />
General weather forecast and Nowcast (up to 6h)<br />
Research purposes<br />
NWP Models (Data from <strong>satellite</strong>s are <strong>use</strong>d In Synoptic or<br />
Asynoptic mode <strong>in</strong> Numerical Weather Prediction models)<br />
20
WHAT WE DO AS METEOROLOGISTS IN<br />
CYPRUS METEOROLOGICAL SERVICE?<br />
Meteorologists <strong>in</strong> the Cyprus Meteorological Service<br />
Monitor the Weather<br />
Predict the Weather for today, (Nowcast<strong>in</strong>g-up to 6h) and<br />
the 5 next days, (Medium Range Forecast)<br />
Provide Weather Services-Weather forecast and a range <strong>of</strong><br />
Meteorological and Climatological <strong>in</strong>formation and<br />
Issue warn<strong>in</strong>gs <strong>of</strong> severe or hazardous weather<br />
for<br />
Safety, protection <strong>of</strong> life, property and Infrastructure,<br />
reliable and cost effective operations, decision mak<strong>in</strong>g<br />
about day-to-day activities, important operations or<br />
emergencies<br />
21
WHAT WE DO AS METEOROLOGISTS IN<br />
THE CYPRUS MET SERVICE?<br />
for customers such as<br />
Civil Aviation (Flight Operations and Crew members, to Air<br />
Traffic Controllers, to Flight Information Service, to Search<br />
and Rescue Units, to Airport Adm<strong>in</strong>istration), to Sport<br />
Agencies (Ballonists, Gliders, Sail<strong>in</strong>g, Cyprus Rally<br />
organizers), Private or Instructor Pilots, Public, Sea,<br />
Military, Shipp<strong>in</strong>g <strong>in</strong>dustry, Fishermen and Farmers,<br />
Multimedia, Agriculture, to Construction Companies and<br />
Research Organizations or Universities.<br />
Obviously, the safety <strong>of</strong> our customers is <strong>of</strong> crucial<br />
importance and then the prevention or the elim<strong>in</strong>ation <strong>of</strong><br />
any f<strong>in</strong>ancial devastation, loss <strong>of</strong> lives, properties damage<br />
and <strong>in</strong>frastructures due to Weather events.<br />
22
WHY DO WE USE SATELLITE<br />
IMAGES IN CYPRUS MET SERVICE?<br />
Monitor<strong>in</strong>g Weather:<br />
Correct weather forecasts start with accurate observations<br />
<strong>of</strong> all weather elements<br />
Meteorologists observe the evolution <strong>of</strong> all weather<br />
parameters such as temperature, air pressure, humidity,<br />
clouds and precipitation by means <strong>of</strong> high technological<br />
sensors either remotely via <strong>satellite</strong>s or radar or via direct<br />
<strong>in</strong>struments<br />
In the Cyprus Meteorological Service only <strong>satellite</strong> <strong>images</strong><br />
are <strong>use</strong>d and no Sat data process<strong>in</strong>g is made<br />
23
WHY DO WE USE SATELLITE<br />
IMAGES IN CYPRUS MET SERVICE?<br />
Weather Prediction, Nowcast<br />
From sat <strong>images</strong> meteorologists identify areas <strong>of</strong><br />
hazardous weather such as stormy systems or<br />
thunderstorms, hail, tornadoes, strong w<strong>in</strong>ds, low cloud or<br />
fog, fronts associated with heavy ra<strong>in</strong> and can ca<strong>use</strong><br />
floods, dust, volcanic ash, and other weather hazardous<br />
phenomena<br />
By look<strong>in</strong>g at a series <strong>of</strong> <strong>images</strong> and some additional<br />
<strong>in</strong>formation such as w<strong>in</strong>d speeds and directions or pressure<br />
patterns they can make a forecast for the direction and<br />
<strong>in</strong>tensity <strong>of</strong> the hazardous weather<br />
Be<strong>in</strong>g able to predict the above weather phenomena is vital<br />
for Nowcast<strong>in</strong>g beca<strong>use</strong> meteorologists will<br />
Issue Early Warn<strong>in</strong>gs to elim<strong>in</strong>ate properties damage and<br />
loss <strong>of</strong> lives<br />
24
WILD WEATHER IMAGES
SATELLITE IMAGES RECEIVED AT<br />
CYPRUS MET SERVICE<br />
Receive <strong>images</strong> from MSG-1 Meteosat-8, Meteosat Second<br />
Generation, (MSG), via a Satellite Receiver system and a s<strong>of</strong>tware<br />
Receive <strong>images</strong> from all the Meteosat 12 channels<br />
Unfortunately every 3 hours beca<strong>use</strong> we are not EUMETSAT’s member!<br />
MSG - A jo<strong>in</strong>t project between European Space Agency, (ESA), and<br />
European Organization for the Exploitation <strong>of</strong> Meteorological Satellites<br />
(EUMETSAT)<br />
Receiv<strong>in</strong>g <strong>images</strong> every 3h, obviously is not <strong>use</strong>ful<br />
Huge problem. Weather evolves with<strong>in</strong> m<strong>in</strong>utes and we lose <strong>use</strong>ful<br />
<strong>in</strong>formation. For example, a storm lasts between 30-45 m<strong>in</strong>utes. With<br />
an image available every 3h the storm will start and f<strong>in</strong>ish and we won’t<br />
be able to see it, especially <strong>in</strong> the absence <strong>of</strong> a weather radar!<br />
This elim<strong>in</strong>ates chances <strong>of</strong> a high quality and reliable Nowcast or<br />
Forecast<br />
Unable to provide sat data or <strong>images</strong> to local Universities and<br />
Research Organizations for research purposes<br />
26
SATELLITE IMAGES RECEIVED AT<br />
CYPRUS MET SERVICE<br />
Metshell<br />
Is another s<strong>of</strong>tware through which we receive Satellite<br />
<strong>images</strong> with a cooperation with the Greek National<br />
Meteorological Service<br />
Receive an image every 15m<strong>in</strong> <strong>in</strong> analogue form<br />
Unfortunately the most recent image comes with delay <strong>of</strong><br />
up to 45-60m<strong>in</strong><br />
In this case we do not receive any <strong>satellite</strong> data, only the<br />
image as such<br />
27
FUTURE NEEDS FOR THE CYPRUS<br />
METEOROLOGICAL SERVICE<br />
Co-operation with ESA, (European Space Agency)<br />
Cyprus is now a member <strong>of</strong> ESA<br />
Cyprus Met Service is <strong>in</strong>terested to cooperate <strong>in</strong> future projects with ESA<br />
and receive all type <strong>of</strong> Meteorological and Climatological data and Images<br />
from its <strong>satellite</strong>s<br />
MetOp-A, ESA’s <strong>satellite</strong>, is Europe's first polar-orbit<strong>in</strong>g <strong>satellite</strong> dedicated<br />
to operational Meteorology. It represents the European contribution to a<br />
new co-operative venture with the United States provid<strong>in</strong>g data to<br />
monitor climate and improve weather forecast<strong>in</strong>g.<br />
MetOp-A launched on 19 October 2006.<br />
Primal future need for CY Met Service is to become EUMETSAT’s<br />
member<br />
This will enable us to receive all type <strong>of</strong> EUMETSAT’s Meteorological and<br />
Climatological products, Images and Data, frequently, every 15 m<strong>in</strong>, (not<br />
every 3h)!<br />
Sat Data provision to the local NWP model will improve forecast<br />
significantly<br />
Hence, the quality <strong>of</strong> our services will be improved and Research can be<br />
promoted<br />
Eumetsat’s products are shown <strong>in</strong> the next slide<br />
28
FUTURE NEEDS FOR THE CYPRUS<br />
METEOROLOGICAL SERVICE<br />
EUMETSAT’s Products related to Meteorology<br />
1. Meteosat Image Services EUMETSAT provides image<br />
services <strong>in</strong> real-time from several <strong>satellite</strong>s, <strong>in</strong>clud<strong>in</strong>g the<br />
first generation Meteosat-7, and the second generation<br />
Meteosat-8 (for rapid scann<strong>in</strong>g) and Meteosat-9<br />
2. Meteosat Meteorological Products (Products from the<br />
Meteosat <strong>satellite</strong>s have many meteorological and<br />
research applications. They allow detailed monitor<strong>in</strong>g <strong>of</strong><br />
the state <strong>of</strong> the atmosphere, from which a predicted<br />
state may be <strong>in</strong>terpolated on the basis <strong>of</strong> physical<br />
understand<strong>in</strong>g and past experience <strong>of</strong> the way <strong>in</strong> which<br />
the atmosphere behaves<br />
3. Eumetsat Data Centre The EUMETSAT Data Centre<br />
receives and archives <strong>images</strong> and meteorological<br />
products from the <strong>satellite</strong>s. The archiv<strong>in</strong>g process is<br />
automated, and is carried out 24 hours a day, every day<br />
<strong>of</strong> the year<br />
29
FUTURE NEEDS FOR THE CYPRUS<br />
METEOROLOGICAL SERVICE<br />
EUMETSAT’s Products related to Meteorology<br />
4. Metop and NOOA Services The data services <strong>of</strong> the<br />
EUMETSAT Polar System (EPS) are generated from data<br />
provided by the Metop and NOAA polar orbit<strong>in</strong>g <strong>satellite</strong>s.<br />
These services <strong>in</strong>clude <strong>satellite</strong> <strong>in</strong>strument direct readout<br />
data and processed products generated from these data<br />
5. User Support Service The EUMETSAT User Service<br />
enables <strong>use</strong>rs to obta<strong>in</strong> the maximum benefit from the<br />
data, products and services <strong>of</strong> the current and future<br />
<strong>satellite</strong> systems<br />
6. Satellite Application Facilities (SAFs) SAFs are<br />
dedicated centres <strong>of</strong> excellence for process<strong>in</strong>g <strong>satellite</strong><br />
data and form an <strong>in</strong>tegral part <strong>of</strong> the distributed<br />
EUMETSAT Application Ground Segment)<br />
30
FUTURE NEEDS FOR THE CYPRUS<br />
METEOROLOGICAL SERVICE<br />
SAT APPLICATION FACILITIES (SAFs)<br />
There are currently seven SAFs provid<strong>in</strong>g products and<br />
services on an operational basis:<br />
SAF on Support to Nowcast<strong>in</strong>g and Very Short Range<br />
Forecast<strong>in</strong>g<br />
Ocean and Sea Ice SAF<br />
Climate Monitor<strong>in</strong>g SAF<br />
Numerical Weather Prediction SAF<br />
Land Surface Analysis SAF<br />
Ozone and Atmospheric Chemistry Monitor<strong>in</strong>g SAF<br />
GRAS Meteorology SAF<br />
One SAF is under development:<br />
Support to Operational Hydrology and Water Management<br />
31
FUTURE NEEDS FOR THE CYPRUS<br />
METEOROLOGICAL SERVICE<br />
The SAFs help deliver a variety <strong>of</strong> benefits <strong>in</strong><br />
Meteorology <strong>in</strong>clud<strong>in</strong>g:<br />
Improvements to short-range forecast <strong>of</strong> severe weather<br />
hazards<br />
Support to the aviation, agriculture, construction, gas, water<br />
and electricity <strong>in</strong>dustries<br />
Better understand<strong>in</strong>g <strong>of</strong> the ca<strong>use</strong>s and effects <strong>of</strong> pollution<br />
<strong>of</strong> the upper atmosphere and the depletion <strong>of</strong> ozone<br />
Early warn<strong>in</strong>g <strong>of</strong> hazards<br />
Better data for climate monitor<strong>in</strong>g<br />
Improved <strong>in</strong>formation for disaster monitor<strong>in</strong>g and<br />
agricultural forecast<strong>in</strong>g<br />
Improved data for <strong>in</strong>put to Numerical Weather Prediction<br />
and the availability <strong>of</strong> <strong>use</strong>r s<strong>of</strong>tware packages for operational<br />
applications<br />
32
THE END<br />
ANY<br />
QUESTIONS?<br />
33
All MSG channels<br />
Channel 01: VIS 0.6 <br />
Channel 02: VIS 0.8 <br />
Channel 03: NIR 1.6 <br />
Channel 04: MIR 3.9 <br />
Channel 05 WV 6.2 <br />
Channel 06: WV 7.3 <br />
Channel 07: IR 8.7 <br />
Channel 08: IR 9.7 („Ozon“)<br />
Channel 09: IR 10.8 <br />
Channel 10: IR 12.0 <br />
Channel 11: IR 13.4 „CO 2“)<br />
Channel 12: HRV (High Resolution vis)<br />
34