China Shipping Container Lines (2866.HK)
China Shipping Container Lines (2866.HK)
China Shipping Container Lines (2866.HK)

You also want an ePaper? Increase the reach of your titles
YUMPU automatically turns print PDFs into web optimized ePapers that Google loves.
Analyst Jay JH Ryu<br />
852-3653-8628<br />
jayryu@miraeasset.com<br />
Rating Downgrade<br />
<strong>China</strong> <strong>Shipping</strong> <strong>Container</strong> <strong>Lines</strong> (<strong>2866.HK</strong>)<br />
Hong Kong / <strong>Shipping</strong><br />
Aug 29, 2008<br />
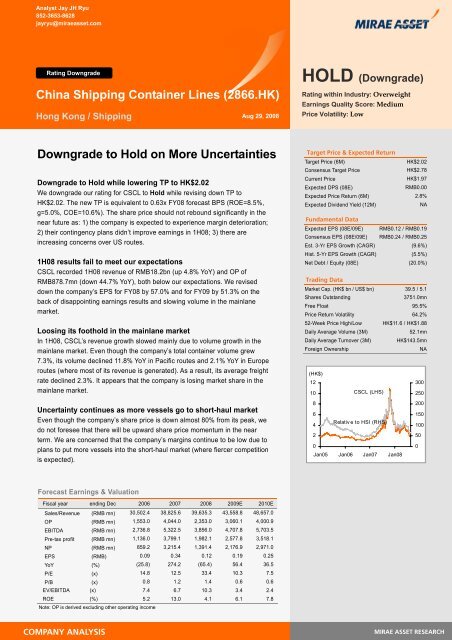
Downgrade to Hold on More Uncertainties<br />
Downgrade to Hold while lowering TP to HK$2.02<br />
We downgrade our rating for CSCL to Hold while revising down TP to<br />
HK$2.02. The new TP is equivalent to 0.63x FY08 forecast BPS (ROE=8.5%,<br />
g=5.0%, COE=10.6%). The share price should not rebound significantly in the<br />
near future as: 1) the company is expected to experience margin deterioration;<br />
2) their contingency plans didn’t improve earnings in 1H08; 3) there are<br />
increasing concerns over US routes.<br />
1H08 results fail to meet our expectations<br />
CSCL recorded 1H08 revenue of RMB18.2bn (up 4.8% YoY) and OP of<br />
RMB878.7mn (down 44.7% YoY), both below our expectations. We revised<br />
down the company’s EPS for FY08 by 57.0% and for FY09 by 51.3% on the<br />
back of disappointing earnings results and slowing volume in the mainlane<br />
market.<br />
Loosing its foothold in the mainlane market<br />
In 1H08, CSCL’s revenue growth slowed mainly due to volume growth in the<br />
mainlane market. Even though the company’s total container volume grew<br />
7.3%, its volume declined 11.8% YoY in Pacific routes and 2.1% YoY in Europe<br />
routes (where most of its revenue is generated). As a result, its average freight<br />
rate declined 2.3%. It appears that the company is losing market share in the<br />
mainlane market.<br />
Uncertainty continues as more vessels go to short-haul market<br />
Even though the company’s share price is down almost 80% from its peak, we<br />
do not foresee that there will be upward share price momentum in the near<br />
term. We are concerned that the company’s margins continue to be low due to<br />
plans to put more vessels into the short-haul market (where fiercer competition<br />
is expected).<br />
Forecast Earnings & Valuation<br />
Fiscal year ending Dec 2006 2007 2008 2009E 2010E<br />
Sales/Revenue (RMB mn) 30,502.4 38,825.6 39,635.3 43,558.8 48,657.0<br />
OP (RMB mn) 1,553.0 4,044.0 2,353.0 3,060.1 4,000.9<br />
EBITDA (RMB mn) 2,736.8 5,322.5 3,856.0 4,707.8 5,703.5<br />
Pre-tax profit (RMB mn) 1,136.0 3,799.1 1,982.1 2,577.8 3,518.1<br />
NP (RMB mn) 859.2 3,215.4 1,391.4 2,176.9 2,971.0<br />
EPS (RMB) 0.09 0.34 0.12 0.19 0.25<br />
YoY (%) (25.8) 274.2 (65.4) 56.4 36.5<br />
P/E (x) 14.8 12.5 33.4 10.3 7.5<br />
P/B (x) 0.8 1.2 1.4 0.6 0.6<br />
EV/EBITDA (x) 7.4 6.7 10.3 3.4 2.4<br />
ROE (%) 5.2 13.0 4.1 6.1 7.8<br />
Note: OP is derived excluding other operating income<br />
HOLD (Downgrade)<br />
Rating within Industry: Overweight<br />
Earnings Quality Score: Medium<br />
Price Volatility: Low<br />
Target Price & Expected Return<br />
Target Price (6M) HK$2.02<br />
Consensus Target Price HK$2.78<br />
Current Price HK$1.97<br />
Expected DPS (08E) RMB0.00<br />
Expected Price Return (6M) 2.8%<br />
Expected Dividend Yield (12M) NA<br />
Fundamental Data<br />
Expected EPS (08E/09E) RMB0.12 / RMB0.19<br />
Consensus EPS (08E/09E) RMB0.24 / RMB0.25<br />
Est. 3-Yr EPS Growth (CAGR) (9.6%)<br />
Hist. 5-Yr EPS Growth (CAGR) (5.5%)<br />
Net Debt / Equity (08E) (20.0%)<br />
Trading Data<br />
Market Cap. (HK$ bn / US$ bn) 39.5 / 5.1<br />
Shares Outstanding 3751.0mn<br />
Free Float 95.5%<br />
Price Return Volatility 64.2%<br />
52-Week Price High/Low HK$11.6 / HK$1.88<br />
Daily Average Volume (3M) 52.1mn<br />
Daily Average Turnover (3M) HK$143.5mn<br />
Foreign Ownership NA<br />
COMPANY ANALYSIS MIRAE ASSET RESEARCH<br />
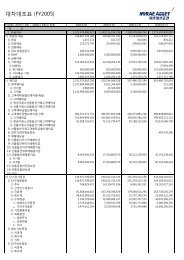
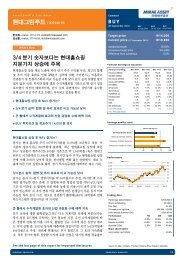
(HK$)<br />
12<br />
10<br />
8<br />
6<br />
4<br />
2<br />
0<br />
CSCL (LHS)<br />
Relative to HSI (RHS)<br />
Jan05 Jan06 Jan07 Jan08<br />
300<br />
250<br />
200<br />
150<br />
100<br />
50<br />
0
<strong>China</strong> <strong>Shipping</strong> <strong>Container</strong> <strong>Lines</strong> (<strong>2866.HK</strong>) Analyst Jay JH Ryu 852-3653-8628 jayryu@miraeasset.com<br />
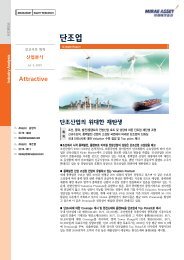
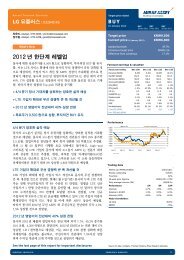
Key Sales Contributors<br />
As of end 1H08<br />
Chartering<br />
1%<br />
Major Shareholders<br />
Others<br />
48%<br />
As of Aug 28, 2008<br />
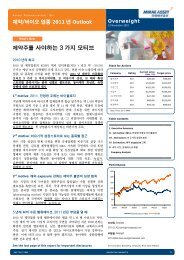
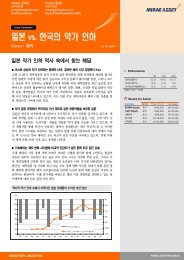
P/B Valuation<br />
(HK$)<br />
12<br />
10<br />
8<br />
6<br />
4<br />
2<br />
JP<br />
Morgan<br />
4%<br />
Liner<br />
99%<br />
<strong>China</strong><br />
<strong>Shipping</strong><br />
Group<br />
48%<br />
0<br />
Jan 05 Jan 06 Jan 07 Jan 08<br />
As of Aug 22, 2008<br />
Price 1.0<br />
1.5 2.0<br />
3.0<br />
Company Description<br />
Brief History<br />
<strong>China</strong> <strong>Shipping</strong> <strong>Container</strong> <strong>Lines</strong> (CSCL) was founded on April 5, 1997 in Shanghai,<br />
<strong>China</strong>. By the end of 1997, the company was operating 15 ships, 5 of which the<br />
company owned. CSCL went public in June 2004, raising HK$7.7bn to further<br />
finance its growth. Currently, CSCL operates 151 vessels with a total operating<br />
capacity of 446,037 TEU (64 ships have capacities over 4,000 TEU). The average<br />
age of vessels with a capacity of more than 4,000 TEU is 3.42 years.<br />
Business Operation<br />
The company’s core business is carried out through owning, chartering, and<br />
operating container ships to provide international and domestic shipping services.<br />
The liner segment, which is the single largest revenue source for the company,<br />
provides global shipping services with container ships in routes including Chinese<br />
costal areas and major trade regions in Asia, Europe, America, Africa, and the<br />
Persian Gulf. The chartering segment, which makes up less than 1% of total<br />
revenue, provides chartering of vessels under operating leases.<br />
Shareholder Structure<br />
<strong>China</strong> <strong>Shipping</strong> Group is the largest shareholder with a 47.9% stake. JP Morgan<br />
Chase is the second largest shareholder with a 3.9% stake.<br />
Key Drivers<br />
Freight rates for US routes continue to show signs of recovery. Shipment volume<br />
for Europe routes remains strong along with its rising freight rates. Despite the<br />
decreasing freight rates, CSCL managed to effectively generate revenue in the<br />
transpacific route. Increasing demand within Asia for container shipments offers<br />
another opportunity for the firm to grow.<br />
Risks<br />
A considerable portion of total revenue is generated from transpacific routes.<br />
Declining container demand in the US could limit the firm’s earnings potential.<br />
Efficient cost management amid rising fuel costs is vital for profitability in the long<br />
run.<br />
Aug 29, 2008 MIRAE ASSET RESEARCH 2
<strong>China</strong> <strong>Shipping</strong> <strong>Container</strong> <strong>Lines</strong> (<strong>2866.HK</strong>) Analyst Jay JH Ryu 852-3653-8628 jayryu@miraeasset.com<br />
Downgrade to Hold while lowering TP to HK$2.02<br />
We downgrade our rating for CSCL to Hold while revising down TP to HK$2.02.<br />
The new TP is equivalent to 0.63x FY08 forecast BPS (ROE=8.5%, g=5.0%,<br />
COE=10.6%).<br />
The share price should not rebound significantly as: 1) the company is expected to<br />
experience margin deterioration; 2) their contingency plans didn’t improve earnings<br />
in 1H08; 3) there are increasing concerns over US routes.<br />
Valuation<br />
Item Figure Remarks<br />
BPS (RMB, 08) 2.9<br />
ROE (08~12) 8.5<br />
G (%) 5.0<br />
COE (%) 10.6<br />
Risk Free Rate (%) 5.0 Up from 4.0%<br />
Risk Premium (%) 7.0<br />
Beta 1.80<br />
Target PBR (x) 0.63<br />
Target Price (RMB) 1.84<br />
Target Price (HK$) 2.02<br />
Source: CSCL, Mirae Asset Research<br />
We revised down the company’s EPS for FY08 by 57.0% and for FY09 by 51.3%<br />
on the back of the disappointing earnings results and slowing volume in the<br />
mainlane market.<br />
Revision of Annual Earnings Estimates<br />
(RMB mn, %)<br />
Before revision After revision Diff. (%,%p)<br />
2008E 2009E 2008E 2009E 2008E 2009E<br />
Revenue 46,921.2 51,708.8 39,635.3 43,558.8 (15.5) (15.8)<br />
OP 6,057.1 7,178.6 2,353.0 3,060.1 (61.2) (57.4)<br />
Pre-tax profit 5,396.7 6,503.2 1,982.1 2,577.8 (63.3) (60.4)<br />
NP 4,076.5 4,912.4 1,391.4 2,176.9 (65.9) (55.7)<br />
EPS (RMB) 0.43 0.52 0.19 0.25 (57.0) (51.3)<br />
Operating margin 12.9 13.9 5.9 7.0 (7.0) (6.9)<br />
Pre-tax margin 11.5 12.6 5.0 5.9 (6.5) (6.7)<br />
Net margin 8.7 9.5 3.5 5.0 (5.2) (4.5)<br />
Source: CSCL, Mirae Asset Research estimates<br />
Aug 29, 2008 MIRAE ASSET RESEARCH 3
<strong>China</strong> <strong>Shipping</strong> <strong>Container</strong> <strong>Lines</strong> (<strong>2866.HK</strong>) Analyst Jay JH Ryu 852-3653-8628 jayryu@miraeasset.com<br />
1H08 results: Failing to meet our expectations<br />
In 1H08, CSCL saw revenue increase to RMB18.2bn (up 4.8% YoY). OP was<br />
RMB878.7mn (down 44.7% YoY) and NP was RMB637mn (down 45.1% YoY), both<br />
below our expectations.<br />
Due to the sluggish global economy and world trade lanes, the growth of the<br />
<strong>China</strong>’s exports slowed last year, resulting in a decline in the volume of loaded<br />
cargoes to the European and American regions, thus hurting the container lines<br />
business.<br />
1H08 Earnings Review<br />
(RMB mn, %) 1H08P 1H07 (YoY)<br />
Revenue 18,231 17,389 4.8<br />
OP 879 1,589 (44.7)<br />
Pre-tax profit 748 1,374 (45.6)<br />
NP 637 1,161 (45.1)<br />
EPS (RMB) 0.05 0.12 (58.3)<br />
Operating margin 4.8 9.1 (4.3)<br />
Pre-tax margin 4.1 7.9 (3.8)<br />
Net margin<br />
Source: CSCL, Mirae Asset Research<br />
3.5 6.7 (3.2)<br />
CSCL’s 1H08 freight volume rose 7.3% YoY to 3,570,204 TEU. However, the<br />
freight volume declined for Pacific routes by 11.8% and for Europe routes by 2.1%.<br />
These routes are the largest revenue contributors for the company, amounting to<br />
63.8% of revenue for the group in 1H08. It appears the company is losing market<br />
share in the mainlane market.<br />
The cost of services increased to RMB17.1bn, up 9.5% YoY in 1H08. This was<br />
mainly driven by fuel costs which were 27% of total operating costs. The average<br />
purchasing price of fuel in 1H08 was US$540.61 per ton, up 67.1% YoY. In addition,<br />
CSCL incurred a significant F/X loss of RMB276mn for the full year ending Jun 30,<br />
2008, down from a gain of RMB11mn the year before (revenue and operating<br />
expenses are settled in US dollars and the dollar depreciated last year). In 1H08,<br />
OP decreased 44.7%YoY and operating margin decreased 4.3% points YoY.<br />
After experiencing deterioration in the US and Europe markets, CSCL wants to<br />
focus more on the Asia Pacific market including the intra-Asia market. We are<br />
concerned that the company’s margins continue to be low due to plans to put more<br />
vessels into the short-haul market (where fiercer competition is expected).<br />
Aug 29, 2008 MIRAE ASSET RESEARCH 4
<strong>China</strong> <strong>Shipping</strong> <strong>Container</strong> <strong>Lines</strong> (<strong>2866.HK</strong>) Analyst Jay JH Ryu 852-3653-8628 jayryu@miraeasset.com<br />
<strong>Container</strong> Operating Data by Year<br />
2006 2007 2008E 2009E 2010E<br />
Freight volume (1,000 TEU) 5,658 7,299 7,868 8,449 9,104<br />
Transpacific 1,433 1,628 1,498 1,543 1,620<br />
Asia-Europe 1,352 1,458 1,400 1,428 1,499<br />
Asia-Pacific 1,022 1,233 1,418 1,517 1,639<br />
<strong>China</strong> Domestic 1,713 2,749 3,299 3,695 4,064<br />
Others 139 231 254 266 282<br />
Freight rate (RMB/TEU) 676 703 700 735 782<br />
Transpacific 1,182 1,141 1,084 1,138 1,229<br />
Asia-Europe 798 1,161 1,253 1,354 1,462<br />
Asia-Pacific 488 593 641 673 707<br />
<strong>China</strong> Domestic 177 207 269 301 326<br />
Source: CSCL, Mirae Asset Research estimates<br />
1H08 <strong>Container</strong> Operating Results<br />
1H08P 2H07 HoH (%,%p) 1H07 YoY (%,%p)<br />
Freight volume (1,000 TEU) 3,570 3,970 (10.1) 3,328 7.3<br />
Transpacific 681 857 (20.6) 771 (11.8)<br />
Asia-Europe 701 742 (5.5) 716 (2.1)<br />
Asia-Pacific 834 605 37.8 628 32.8<br />
<strong>China</strong> Domestic 1,258 1,639 (23.3) 1,110 13.4<br />
Freight rate (RMB/TEU) 5,106 5,399 (5.4) 5,224 (2.3)<br />
Transpacific 8,315 8,465 (1.8) 8,826 (5.8)<br />
Asia-Europe 8,522 10,002 (14.8) 7,531 13.2<br />
Asia-Pacific 3,384 5,209 (35.0) 3,803 (11.0)<br />
<strong>China</strong> Domestic 2,179 1,479 47.3 1,699 28.2<br />
Source: CSCL, Mirae Asset Research<br />
Aug 29, 2008 MIRAE ASSET RESEARCH 5
<strong>China</strong> <strong>Shipping</strong> <strong>Container</strong> <strong>Lines</strong> (<strong>2866.HK</strong>) Analyst Jay JH Ryu 852-3653-8628 jayryu@miraeasset.com<br />
Summary Financial Statements<br />
Balance Sheet<br />
(RMB mn) 2006 2007 2008E 2009E 2010E<br />
Current assets 7,139.7 21,422.3 21,450.8 22,186.8 24,641.2<br />
Cash and equivalents 2,915.5 16,312.1 16,521.7 16,851.2 18,779.9<br />
Receivables 3,588.4 4,205.6 3,257.7 3,580.2 3,999.2<br />
Inventories 674.8 809.7 757.7 832.7 930.2<br />
Non-Current assets 23,604.4 26,112.5 27,711.6 30,370.2 31,378.7<br />
Investment assets 80.8 87.9 87.9 87.9 87.9<br />
Tangible assets 23,463.9 25,955.0 27,546.5 30,199.3 31,203.3<br />
Intangible assets 59.8 69.6 77.2 83.0 87.5<br />
Total assets 30,744.1 47,534.8 49,162.4 52,557.0 56,020.0<br />
Current liabilities 4,593.2 6,648.6 6,494.4 7,302.4 8,092.4<br />
Payables 2,205.1 3,208.0 2,763.0 3,036.5 3,391.9<br />
ST debt 1,803.3 1,501.5 1,501.5 1,701.5 1,751.5<br />
Other Current liabilities 584.8 1,939.0 2,229.9 2,564.3 2,949.0<br />
Non-Current liabilities 9,574.7 7,943.0 8,333.2 8,743.0 8,444.7<br />
LT debt 8,737.4 7,771.0 8,159.5 8,567.5 8,267.5<br />
Total liabilities 14,167.9 14,591.6 14,827.6 16,045.3 16,537.1<br />
Shareholders' equity 16,533.2 32,941.3 34,332.7 36,509.6 39,480.6<br />
Minorities 43.0 1.9 2.0 2.1 2.2<br />
Shareholders' equity 16,576.2 32,943.2 34,334.7 36,511.7 39,482.8<br />
Total debt 10,540.7 9,272.5 9,661.0 10,269.0 10,019.0<br />
Net debt 7,625.2 (7,039.6) (6,860.7) (6,582.2) (8,760.9)<br />
Cashflow Statement<br />
(RMB mn) 2006 2007 2008E 2009E 2010E<br />
Oprerating cash flow 2,210.4 5,167.6 1,531.7 3,850.8 2,918.6<br />
Net income 859.2 3,806.1 1,391.4 2,176.9 2,971.0<br />
Non-cash flow expenditure 866.7 1,113.0 (696.4) 1,472.6 (266.7)<br />
Depreciation & Amortization 1,183.8 1,278.5 1,503.0 1,647.7 1,702.5<br />
Net working capital 201.2 248.5 836.7 201.4 214.3<br />
Chg in receivables 688.2 (495.3) 947.9 (322.5) (419.0)<br />
Chg in inventories (121.7) (135.0) 52.0 (75.0) (97.5)<br />
Chg in payables (577.2) 1,013.7 (445.1) 273.5 355.4<br />
Investing Cash flow (3,766.9) (4,913.2) (3,102.1) (4,306.4) (2,711.0)<br />
Capital expenditure (3,671.9) (4,874.9) (3,093.7) (4,299.6) (2,705.6)<br />
Tangible asset disposal 15.5 6.1 0.0 0.0 0.0<br />
Intangible asset disposal (purchase) (78.5) (44.4) (8.4) (6.7) (5.4)<br />
Sale of investment securities quisition) (32.0) 0.0 0.0 0.0 0.0<br />
Financial Cash flow 1,048.6 13,120.4 1,780.0 2,784.9 2,721.1<br />
Debt raised (repaid) 422.6 (1,324.9) 388.5 608.0 (250.0)<br />
Capital raised (repaid) (723.6) 13,431.0 1,391.5 2,177.0 2,971.1<br />
* Cash Dividends Paid 723.6 1,790.9 0.0 0.0 0.0<br />
Net cash flow (507.8) 13,374.9 209.6 329.4 1,928.7<br />
Beginning cash 3,423.4 2,915.5 16,312.1 16,521.7 16,851.2<br />
Ending cash 2,915.5 16,312.1 16,521.7 16,851.2 18,779.9<br />
Gross cash flow 1,725.9 4,919.1 695.0 3,649.5 2,704.3<br />
Investment cash flow 3,565.7 4,664.6 2,265.4 4,105.0 2,496.7<br />
Free cash flow (1,839.8) 254.4 (1,570.4) (455.5) 207.6<br />
Source: FactSet, Mirae Asset estimates<br />
Income Statement<br />
(RMB mn, %) 2006 2007 2008E 2009E 2010E<br />
Net Sales 30,502.4 38,825.6 39,635.3 43,558.8 48,657.0<br />
growth, % 7.5 27.3 2.1 9.9 11.7<br />
Cost of sales 27,207.8 32,812.9 36,577.6 39,724.3 43,791.1<br />
Depreciation & Amortization 1,183.8 1,278.5 1,503.0 1,647.7 1,702.5<br />
Gross profit 2,110.8 4,734.2 3,057.6 3,834.5 4,866.0<br />
Gross margin, % 6.9 12.2 7.7 8.8 10.0<br />
SG&A 557.8 690.2 704.6 774.4 865.0<br />
Other Operating Expenses 0.0 0.0 0.0 0.0 0.0<br />
Op income 1,553.0 4,044.0 2,353.0 3,060.1 4,000.9<br />
EBITDA 2,736.8 5,322.5 3,856.0 4,707.8 5,703.5<br />
Non-opr income (540.7) (343.8) (370.9) (482.3) (482.9)<br />
Net financial income (582.9) (481.3) (543.0) (636.6) (655.2)<br />
Associate gain 0.0 0.0 0.0 0.0 0.0<br />
Others 42.2 137.5 172.2 154.2 172.3<br />
Pre-tax Income 1,136.0 3,799.1 1,982.1 2,577.8 3,518.1<br />
Tax 277.8 590.5 590.5 400.6 546.8<br />
Net income after tax 858.2 3,208.6 1,391.7 2,177.1 2,971.3<br />
Abnormal items 6.5 7.0 0.0 0.0 0.0<br />
Discontinued Operations 0.0 0.0 0.0 0.0 0.0<br />
Minorities / Pref dividends 5.5 0.2 0.2 0.3 0.3<br />
Net Income 859.2 3,215.4 1,391.4 2,176.9 2,971.0<br />
Key investment index<br />
(L/C, %, x) 2006 2007 2008E 2009E 2010E<br />
Per share data<br />
EPS 0.09 0.34 0.12 0.19 0.25<br />
BPS 1.77 3.52 2.93 3.12 3.37<br />
EBITDA per share 0.29 0.57 0.33 0.40 0.49<br />
DPS 0.03 0.21 0.00 0.00 0.00<br />
PER 14.8 12.5 33.4 10.3 7.5<br />
PBR 0.8 1.2 1.4 0.6 0.6<br />
EV/EBITDA 7.4 6.7 10.3 3.4 2.4<br />
Dividend Yield,%<br />
Profitability %<br />
1.9 4.8 0.0 0.0 0.0<br />
Operating margin 5.1 10.4 5.9 7.0 8.2<br />
EBITDA margin 9.0 13.7 9.7 10.8 11.7<br />
Net income margin 2.8 8.3 3.5 5.0 6.1<br />
ROE 5.2 13.0 4.1 6.1 7.8<br />
ROIC<br />
Stability %<br />
3.6 10.8 3.7 7.5 9.3<br />
Debt ratio 85.5 44.3 43.2 43.9 41.9<br />
Net debt ratio 46.0 (21.4) (20.0) (18.0) (22.2)<br />
Interest cover(x)<br />
Activity ratio(Turnover)<br />
2.7 8.4 4.3 4.8 6.1<br />
Receivables (x) 7.8 10.0 10.6 12.7 12.8<br />
Inventories (x) 49.7 52.3 50.6 54.8 55.2<br />
Payables (x) 12.3 14.3 13.3 15.0 15.1<br />
Source: FactSet, Mirae Asset estimates<br />
Aug 29, 2008 MIRAE ASSET RESEARCH 6
<strong>China</strong> <strong>Shipping</strong> <strong>Container</strong> <strong>Lines</strong> (<strong>2866.HK</strong>) Analyst Jay JH Ryu 852-3653-8628 jayryu@miraeasset.com<br />
Contact<br />
K. Y. Lee – Chief Executive Officer kyleehk@miraeasset.com<br />
Jung Ho Rhee – Managing Director jungho.rhee@miraeasset.com<br />
Ajay Singh Kapur – Chief Global and Asia Strategist ajay.kapur@miraeasset.com<br />
Rohan John Dalziell – Head of Research rohan.daiziell@miraeasset.com<br />
Priscilla Luk - Senior Anaylst priscilla.luk@miraeasset.com<br />
Ritesh Samadhiya - Research Analyst ritesh@miraeasset.com<br />
Jay JH Ryu - Senior Analyst jayryu@miraeasset.com<br />
Young Jean Hwang -Senior Analyst youngjean@miraeasset.com<br />
Il Hwa Lee -Research Associate ilhwa.lee@miraeasset.com<br />
Ji Hye Yoo -Research Associate jihye.yoo@miraeasset.com<br />
Kwan Hoi Cheung – Director kwanhc@miraeasset.com<br />
Kaiser Choi - Research Analyst kaiser.choi@miraeasset.com<br />
Patrick Pong - Senior Analyst patrick.pong@miraeasset.com<br />
Anita Hwang - Senior Analyst anita.hwang@miraeasset.com<br />
Edwin Lee - Research Associate edwin.lee@miraeasset.com<br />
Mirae Asset Hong Kong Ltd.<br />
Suite 3201, 32/F.,<br />
Tower Two, Lippo Centre,<br />
89 Queensway,<br />
Hong Kong.<br />
Tel: (852) 3653-8600<br />
Fax: (852) 2810-6390<br />
Compliance<br />
Mirae Asset Securities Co., Ltd.<br />
Headquarters<br />
Mirae Asset Building,<br />
45-1, Yoido-dong,<br />
Youngdeungpo-gu,<br />
Seoul, 150-944, Korea.<br />
Tel: (822) 3774-1700<br />
www.miraeasset.com<br />
Mirae Asset Securities Co., Ltd.<br />
Korea Research Center<br />
4/F., Sinsong Center Building,<br />
25-12, Yoido-dong,<br />
Youngdeungpo-gu,<br />
Seoul, 150-711, Korea.<br />
Tel: (822) 3774-1700<br />
Fax: (822) 3774-1558<br />
ANALYST CERTIFICATION<br />
THE RESEARCH ANALYST WHO IS PRIMARILY RESPONSIBLE FOR THE CONTENT OF THIS RESEARCH REPORT, IN WHOLE OR IN<br />
PART, CERTIFIES THAT WITH RESPECT TO THE SECURITIES OR ISSUER THAT THE ANALYST COVERED IN THIS REPORT: (1) ALL OF<br />
THE VIEWS EXPRESSED ACCURATELY REFLECT HIS OR HER PERSONAL VIEWS ABOUT THE SUBJECT SECURITIES OR ISSUER;<br />
AND (2) NO PART OF HIS OR HER COMPENSATION WAS, IS, OR WILL BE, DIRECTLY OR INDIRECTLY, RELATED TO THE SPECIFIC<br />
VIEWS EXPRESSED BY THE ANALYST IN THIS REPORT.<br />
IMPORTANT DISCLOSURES<br />
THIS DOCUMENT IS STRICTLY CONFIDENTIAL TO THE RECIPIENT, MAY NOT BE DISTRIBUTED TO THE PRESS OR OTHER MEDIA,<br />
AND MAY NOT BE REPRODUCED IN ANY FORM. THIS REPORT MAY NOT BE DISTRIBUTED OR PASSED TO ANY PERSON OTHER<br />
THAN A PERSON WHOSE ORDINARY BUSINESS IS TO BUY OR SELL SHARES OR DEBENTURES, WHETHER AS PRINCIPAL OR AS<br />
AGENT. THE DISTRIBUTION OF THIS REPORT IN OTHER JURISDICTIONS MAY BE RESTRICTED BY LAW, AND PERSONS INTO WHOSE<br />
POSSESSION THIS REPORT COMES SHOULD INFORM THEMSELVES ABOUT, AND OBSERVE, ANY SUCH RESTRICTIONS. BY<br />
ACCEPTING THIS REPORT, YOU AGREE TO BE BOUND BY THE FOREGOING LIMITATIONS.<br />
MIRAE ASSET HONG KONG LTD (“MAHK”) MAY PARTICIPATE IN OFFERINGS OF SECURITIES OF CHINA SHIPPING CONTAINER LINES<br />
(2866 HK) (THE “COMPANY”) FROM TIME TO TIME. THIS REPORT DOES NOT CONSTITUTE AN INVITATION OR SOLICITATION OF AN<br />
OFFER TO SUBSCRIBE FOR OR PURCHASE ANY SECURITIES AND NEITHER THIS DOCUMENT NOR ANYTHING CONTAINED HEREIN<br />
SHALL FORM THE BASIS FOR ANY CONTRACT OR COMMITMENT WHATSOEVER.<br />
MIRAE ASSET HK (MAHK) HAS NO FINANCIAL INTERESTS IN THE COMPANIES AS AT AUGUST 28, 2008.<br />
MAHK DOES NOT ACT AS A MARKET MAKER OF THE COMPANIES ON AUGUST 28, 2008.<br />
NO EMPLOYEES OF MAHK, SERVE AS AN OFFICER OF THE COMPANIES AS AT AUGUST 28, 2008.<br />
MAHK ACTS NO INVESTMENT BANKING ROLES FOR THE COMPANIES WITHIN PAST 12 MONTHS.<br />
THE READER IS CAUTIONED THAT ACTUAL RESULTS MAY DIFFER MATERIALLY FROM THOSE SET FORTH IN ANY FORWARD-<br />
LOOKING STATEMENTS HEREIN. WHILE ALL REASONABLE CARE HAS BEEN TAKEN TO ENSURE THAT THE FACTS STATED HEREIN<br />
ARE ACCURATE AND THAT THE FORWARD-LOOKING STATEMENTS, OPINIONS AND EXPECTATIONS CONTAINED HEREIN ARE<br />
BASED ON FAIR AND REASONABLE ASSUMPTIONS, NONE OF MAHK AND THE COMPANY HAS INDEPENDENTLY VERIFIED ANY OF<br />
THE INFORMATION HEREIN. BY ACCEPTING THIS REPORT, YOU AGREE TO BE BOUND BY THE FOREGOING LIMITATIONS. THIS IS<br />
NOT AND SHALL NOT BE TREATED AS AN OFFER (OR SOLICITATION OF AN OFFER) TO BUY OR SELL THE<br />
SECURITIES/INSTRUMENTS MENTIONED. MAHK DOES NOT REPRESENT THIS IS ACCURATE OR COMPLETE AND WE MAY NOT<br />
UPDATE THIS.<br />
OPINIONS AND INFORMATION PRESENTED IN THIS DOCUMENT HAVE BEEN OBTAINED OR DERIVED FROM SOURCES BELIEVED BY<br />
MAHK AS RELIABLE, BUT MAHK MAKES NO REPRESENTATION AS TO THEIR ACCURACY OR COMPLETENESS. MAHK ACCEPTS NO<br />
LIABILITY FOR LOSS ARISING FROM THE USE OF THIS DOCUMENT WHERE PERMITTED BY LAW AND/OR REGULATION.<br />
[Analyst: Jay JH Ryu]<br />
Aug 29, 2008 MIRAE ASSET RESEARCH 7
<strong>China</strong> <strong>Shipping</strong> <strong>Container</strong> <strong>Lines</strong> (<strong>2866.HK</strong>) Analyst Jay JH Ryu 852-3653-8628 jayryu@miraeasset.com<br />
Recommendation<br />
By item (six months)<br />
Buy: A target price of over + 20% of the current price,<br />
Hold: A target price of - 10% to +10% of the current price<br />
Reduce: A target price of –20% or less than the current price<br />
* Note: Correction of –10% to +10% is possible based on the<br />
investment recommendations by industry.<br />
Earnings Quality Score<br />
This report is distributed to our clients only, and none of the report material may be copied or distributed to any other party. While we have taken<br />
all reasonable care to ensure its reliability, we do not guarantee that it is accurate or complete. Therefore, Mirae Asset shall not be liable for any<br />
result from the use of this report. This report has never been provided to any institutional investor or third party. This report has been prepared<br />
without any undue external influence or interference, and accurately reflects the personal views of the analyst on the company herein.<br />
[Analyst: Jay JH Ryu]<br />
Item Analyst Type<br />
Securities Held by the Analyst<br />
Number of<br />
Shares<br />
Purchasing<br />
Price<br />
By industry<br />
Attractive: over +10% of the current industry index<br />
Neutral: -10% to +10% of the current industry index<br />
Cautious: -10% or less than the current industry index<br />
Terminology of Investment recommendation by industry has changed<br />
since August 3, 2005 as follows: Overweight Attractive /<br />
Underweight Cautious.<br />
Earnings Quality Score = 0.70*(Historical Earnings Stability) + 0.15*(Consensus Forecast Certainty) + 0.15*(Consensus Forecast<br />
Accuracy)<br />
1. Historical Earnings Stability<br />
- The variability of the net profit growth rate (YOY) over the last 20 quarters was translated into percentage terms.<br />
- Earnings growth variability was calculated based on MAD (Median Absolute Deviation), rather than SD (Standard Deviation) in order to<br />
minimize distortion from outliers.<br />
- The lower the earnings growth variability, the higher this indicator.<br />
2. Consensus Forecast Certainty<br />
- The gap between analysts' views on 12-month forward EPS was translated into percentage terms.<br />
- The gap is calculated by dividing the SD of 12-month forward EPS with the average value.<br />
- The narrower the gap is, the higher the indicator’s reliability.<br />
3. Consensus Forecast Accuracy<br />
- The median value of absolute EPS surprise over the last 3-year was translated into percentage terms.<br />
- EPS surprise was calculated based on 'the actual figure at the end of the year / the consensus estimate at the beginning of the year - 1'.<br />
- The lower the absolute EPS surprise, the higher this indicator.<br />
* Reference<br />
1) Consensus Forecast Certainty and Consensus Forecast Accuracy were applied only to companies with more than 5 years of EPS<br />
estimates.<br />
2) We gave the average score of 50 to cases in which the aforementioned indicators could not be produced.<br />
Compliance Notice<br />
Purchasing<br />
Date<br />
N/A<br />
Holdings of<br />
Shares over1%<br />
Participation in<br />
the Issuance of<br />
Securities<br />
Involvement<br />
with the<br />
Affiliates<br />
Treasury<br />
Stock<br />
Acquired<br />
Aug 29, 2008 MIRAE ASSET RESEARCH 8