Electricity Benchmarking Analysis Report (web only) - Forfás
Electricity Benchmarking Analysis Report (web only) - Forfás
Electricity Benchmarking Analysis Report (web only) - Forfás

You also want an ePaper? Increase the reach of your titles
YUMPU automatically turns print PDFs into web optimized ePapers that Google loves.
34<br />
Capacity margin as proportion of peak demand (%)<br />
40%<br />
20%<br />
0%<br />
41%<br />
38%<br />
22%<br />
25%<br />
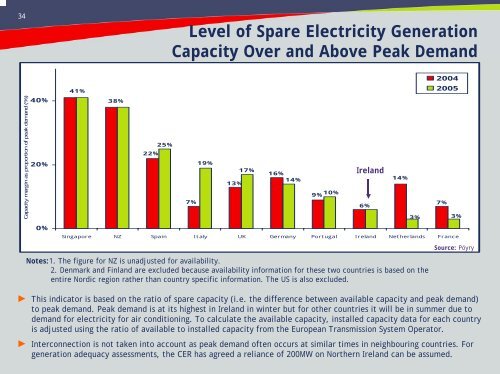
Level of Spare <strong>Electricity</strong> Generation<br />
Capacity Over and Above Peak Demand<br />
7%<br />
19%<br />
13%<br />
17%<br />
16%<br />
14%<br />
9%<br />
10%<br />
Ireland<br />
Singapore NZ Spain Italy UK Germany Portugal Ireland Netherlands France<br />
Notes:1. The figure for NZ is unadjusted for availability.<br />
2. Denmark and Finland are excluded because availability information for these two countries is based on the<br />
entire Nordic region rather than country specific information. The US is also excluded.<br />
6%<br />
14%<br />
3%<br />
2004<br />
2005<br />
7%<br />
3%<br />
Source: Pöyry<br />
► This indicator is based on the ratio of spare capacity (i.e. the difference between available capacity and peak demand)<br />
to peak demand. Peak demand is at its highest in Ireland in winter but for other countries it will be in summer due to<br />
demand for electricity for air conditioning. To calculate the available capacity, installed capacity data for each country<br />
is adjusted using the ratio of available to installed capacity from the European Transmission System Operator.<br />
► Interconnection is not taken into account as peak demand often occurs at similar times in neighbouring countries. For<br />
generation adequacy assessments, the CER has agreed a reliance of 200MW on Northern Ireland can be assumed.