Navigating the Chinese Wind Power Market
Navigating the Chinese Wind Power Market
Navigating the Chinese Wind Power Market

Create successful ePaper yourself
Turn your PDF publications into a flip-book with our unique Google optimized e-Paper software.
Global <strong>Wind</strong> <strong>Power</strong> 2008 l China <strong>Wind</strong> <strong>Power</strong> 2008<br />
<strong>Navigating</strong> <strong>the</strong> <strong>Chinese</strong> <strong>Market</strong> Place ‐ Manufacturers<br />
Paulo Fernando Soares<br />
Chief Executive Officer<br />
Suzlon Energy Ltd<br />
Beijing<br />
Oct 30, ,<br />
2008
<strong>Market</strong> Development East Asia Region<br />
Growth Forecast [MW]<br />
BTM <strong>Market</strong> Forecast 2008-12 Total [MW]<br />
12,000<br />
10,000<br />
8,000<br />
66,000 000<br />
4,000<br />
2,000<br />
0<br />
3,707<br />
3,303<br />
6,150<br />
5,500<br />
7,375<br />
66,500 500<br />
8,500<br />
7,500<br />
9,400<br />
8,000<br />
10,800<br />
9,000<br />
2007 2008 2009 2010 2011 2012<br />
RRoA A<br />
28 50 75 100 200 300<br />
Taiwan 106 150 200 200 300 500<br />
South Korea 41 150 250 300 400 500<br />
Suzlon l <strong>Navigating</strong> <strong>the</strong> <strong>Chinese</strong> <strong>Market</strong>place – Manufacturers l Oct 30, 08 ‐ Beijing<br />
Analysis<br />
China (app 87%) will be <strong>the</strong> most important<br />
market in <strong>the</strong> East Asian region. All o<strong>the</strong>r<br />
countries combines will account for only 13%<br />
of <strong>the</strong> total additions;<br />
Development in Countries such as Philippines<br />
(especially), Vietnam and Thailand is starting<br />
to accelerate; l however h level l lof f development<br />
d l<br />
of <strong>the</strong> grid, wea<strong>the</strong>r conditions (typhoon area<br />
in Vietnam and Philippines and lack of wind in<br />
Thailand), might affect market potential;<br />
China will be <strong>the</strong> backbone of <strong>the</strong> development of<br />
<strong>Wind</strong> Business in <strong>the</strong> East Asia region; however,<br />
Japan 229 300 350 400 500 500<br />
China 3,303 , 5,500 , 6,500 , 7,500 , 8,000 , 9,000 , competion has become very developed, rapid<br />
growth of <strong>the</strong> local companies and prefered<br />
policies toward local companies
<strong>Power</strong> Capacity Development<br />
Actual 2007 x Target in 2010 and 2020<br />
Suzlon l <strong>Navigating</strong> <strong>the</strong> <strong>Chinese</strong> <strong>Market</strong>place – Manufacturers l Oct 30, 08 ‐ Beijing<br />
Analysis<br />
Installed capacity growth Actual x Target Despite <strong>the</strong> fact that <strong>the</strong> government has set ambitious<br />
RE ex hydro: 0.64% 0.76% 1.12% 2.58% 8.83% 15.9%<br />
targets for 2010 and 2020, it is important to define<br />
whe<strong>the</strong>r Large Hydro is part of <strong>the</strong> target:<br />
1,800.0<br />
11,600.0 600 0<br />
1,400.0<br />
1,200.0<br />
1,000.0<br />
800.0<br />
600.0<br />
400.0<br />
200.0<br />
0.0<br />
RE cap. ex-hydro<br />
RE capacity p y<br />
Non RE Sources<br />
Incl. Nuclear – 2007: 8.8GW<br />
2006: 5.3GW<br />
517.2<br />
120.3<br />
396.9<br />
622.0<br />
132.7<br />
489.3<br />
713.0<br />
153 153.00<br />
561.0<br />
11,000.0 000 0<br />
215.8<br />
784.2<br />
1,493.7<br />
131.90<br />
431.9<br />
1,061.8<br />
779.5<br />
123.90<br />
278.9<br />
500.8<br />
05A 06A 07A 10E 20E 07A - '20E<br />
Inst. Capacity %RE ‐ Incl. Hydro %RE ‐ Excl. Hydro<br />
2006 A 21 21.33% 33% 00.76% 76%<br />
2007 A 21.43% 1.12%<br />
2010 E 21.58% 2.58%<br />
2020 F 28.91% 8.83%<br />
Considering <strong>the</strong> electricity generation profile in 07:<br />
<strong>Power</strong><br />
Generation<br />
2007<br />
Installed capacity <strong>Power</strong> Generation<br />
GW [%] TWh [%]<br />
Thermal 554.0 77.59 2,698.0 82.86<br />
Hydro 145.0 20.31 486.7 14.95<br />
Nuclear 8.8 1.23 62.6 1.92<br />
<strong>Wind</strong> 5.9 0.83 5.6 0.17<br />
O<strong>the</strong>rs ‐‐‐ ‐‐‐ 3.0 0.09<br />
Total 714.0 100.0 3,255.9 100.0<br />
The targets for RE (excluding Large Hydro) must be reviewed to more realistic numbers considering <strong>the</strong><br />
current development of <strong>the</strong> industry.<br />
Source: National Development & Reform Commission; "Renewable Energy Sources Medium to Long Term Development Plan" report published<br />
August 2007, released 4 September 2007. National capacity = Merrill Lynch AsiaPac Utilities Research Estimates 3
<strong>Power</strong> Capacity Development<br />
Renewable Energy Sources –Actual x Targets<br />
% H<br />
500.0<br />
450.0<br />
400.0<br />
350.0<br />
300.0<br />
250.0<br />
200 200.0 0<br />
150.0<br />
100.0<br />
50.0<br />
0.0<br />
Installed capacity growth Actual x Target<br />
97.3% 96.5% 94.6% 82.9% 75.7% 76.7%<br />
120.3<br />
117.0<br />
Solar<br />
<strong>Wind</strong><br />
Biomass<br />
Hydro<br />
153.0<br />
215.8<br />
20 20.00 00<br />
190.0<br />
431.9<br />
100.00<br />
278.9<br />
94.11<br />
Suzlon l <strong>Navigating</strong> <strong>the</strong> <strong>Chinese</strong> <strong>Market</strong>place – Manufacturers l Oct 30, 08 ‐ Beijing<br />
Analysis<br />
If we analyze <strong>the</strong> breakdown of <strong>the</strong> different<br />
Renewable Energy sources and its development<br />
forecast, we will clearly see that Large Hydro<br />
will be <strong>the</strong> main player p y , attracting g <strong>the</strong> bulk of<br />
<strong>the</strong> investments.<br />
The breakdown figures (in GW) for hydro is as<br />
follows:<br />
Hydro Capacity 2006A 2007A 2010F 2020F<br />
Large Hydro 72.0 NA 140.0 225.0<br />
Pumped Storage 7.0 NA NA NA<br />
Small Hydro 38.0 NA 50.0 75.0<br />
Total 117.0 145.0 190.0 300.0<br />
132.7 300.0<br />
Renewable energy sources not derived from<br />
128.0<br />
145.0<br />
155.0<br />
05A 06A 07A 10E 20E 07A - '20E<br />
Large Hydro schemes should have development<br />
priority in order to avoid <strong>the</strong> repetition of <strong>the</strong><br />
2007 situation, when droughts in <strong>the</strong> south<br />
pushed <strong>the</strong> consumption of eletricity generated<br />
by coal fired <strong>the</strong>rmo power plants<br />
Source: National Development & Reform Commission; "Renewable Energy Sources Medium to Long Term Development Plan" report published<br />
August 2007, released 4 September 2007. National capacity = Merrill Lynch AsiaPac Utilities Research Estimates<br />
4
<strong>Wind</strong> <strong>Power</strong> Development<br />
Renewable Portfolio Standard<br />
Renewable Portfolio Standard Guidelines<br />
Language directing <strong>the</strong> mechanism for a Renewables<br />
Portfolio Standard (RPS) was published in “Mid & Long‐<br />
term RE Implementation Plan (Jul 07). The formulation<br />
includes two sets of requirements ‐ one being<br />
generation & grid based, <strong>the</strong> o<strong>the</strong>r being a capacity‐<br />
based requirement levied on power producers. The<br />
requirements are listed below:<br />
The share of non‐hydro Renewables should reach<br />
1% of total power generation by 2010 and 3% by<br />
2020 for regions served by centralized power grids.<br />
Any power producer with cap > 5GW must increase<br />
its actual ownership of power capacity from non‐ non<br />
hydro Renewables to 3% by 2010 and 8% by 2020<br />
First of all, <strong>the</strong> requirements apply to non‐hydro<br />
Renewables. This exclusion of small hydro means that<br />
<strong>the</strong> RPS effectively applies only to wind, biomass, and<br />
solar generation and capacity. Of <strong>the</strong>se technologies,<br />
wind will be <strong>the</strong> predominant means of meeting<br />
requirements for reasons of scale and cost.<br />
Source: Azure International<br />
Suzlon l <strong>Navigating</strong> <strong>the</strong> <strong>Chinese</strong> <strong>Market</strong>place – Manufacturers l Oct 30, 08 ‐ Beijing<br />
Development targets at various levels: NDRC 10GW 2010,<br />
and 30GW 2020; announced provincial targets summing<br />
to over 24GW by 2010.<br />
<strong>Power</strong> generation companies establishing aggressive<br />
targets for wind, in‐line with RPS requirements, and<br />
actively developing pipelines (2010 targets and pipelines<br />
sum to over 16GW, and <strong>the</strong> new national capacity targets<br />
sum to 15.5GW (10GW wind, 5.5GW biomass <strong>the</strong>rmal) of<br />
“non‐hydro” renewable power generation capacity.<br />
National concession and policy‐directed projects now<br />
totaling 7.9GW of which 1GW installed primarily for <strong>the</strong><br />
benefit of domestic companies.<br />
Within <strong>the</strong> 35GW of incremental near‐term development,<br />
we find that SOE companies represent some 75% of<br />
pipeline and 88% of <strong>the</strong> ordered portion. Domestic private<br />
and international interests remain a small but potentially<br />
growing customer base.<br />
Existing wind pipeline identified suggests that most<br />
companies are reasonably well positioned already, already in terms<br />
of development pipeline to meet both <strong>the</strong> 2010 and 2020<br />
requirements.<br />
5
<strong>Market</strong> Development in China<br />
Growth Forecast [MW]<br />
35,000<br />
GWEC Growth<br />
Scenarios for China<br />
Total capacity in MW<br />
2007 2010 2020 2030<br />
Reference scenario 5,906 9,000 27,000 49,000<br />
Moderate 5,906 17,507 100,724 200,531<br />
Advanced 5,906 19,613 200,880 450,582<br />
30,000 CWEA Forecasts<br />
25,000<br />
20,000<br />
15,000<br />
10,000<br />
5,000<br />
0<br />
PG companies >5GW<br />
generating capacity<br />
Electricity generation<br />
from non non-hydro hydro<br />
Actual<br />
Yearly Installation<br />
MAKE<br />
BTM<br />
759<br />
1,257<br />
498<br />
1,337<br />
2010 2020<br />
Req. GW Req. GW<br />
3.0% 24.0 8.0% 96.0<br />
1.0% 20.0 3.0% 100.0<br />
5,500<br />
As of Jun 30, 08 about 2,000<br />
MW has been delivered<br />
22,594 594<br />
3,303<br />
5,897<br />
10,297<br />
4,400<br />
6,500<br />
15,297<br />
5,000<br />
Suzlon l <strong>Navigating</strong> <strong>the</strong> <strong>Chinese</strong> <strong>Market</strong>place – Manufacturers l Oct 30, 08 ‐ Beijing<br />
21,097<br />
7,500<br />
5,800<br />
8,000<br />
ERI – NDRC<br />
15GW<br />
6,500<br />
EER 2008 – 135,000<br />
Goldman Sachs 2008 – 108,000<br />
ERI l NDRC- 2008 – 120,000<br />
9,000<br />
7,200<br />
Goldwind<br />
65GW<br />
2004 2005 2006 2007 2008 2009 2010 2011 2012 2015 2020<br />
Source: Azure Suzlon Proprietaty Report / Azure International - CWEA statistics / Energy Research Institute from <strong>the</strong> NDRC<br />
30,000<br />
10,000<br />
9,000<br />
8,000<br />
7,000<br />
6,000<br />
5,000<br />
4,000<br />
3,000<br />
2,000<br />
1,000<br />
0<br />
6
<strong>Market</strong> Development China<br />
<strong>Market</strong> Share – 2004 to 2008H1<br />
100%<br />
90%<br />
80%<br />
70%<br />
60%<br />
Suzlon l <strong>Navigating</strong> <strong>the</strong> <strong>Chinese</strong> <strong>Market</strong>place – Manufacturers l Oct 30, 08 ‐ Beijing<br />
<strong>Market</strong> Share 2004 to 2008 Suppliers 2004 2005 2006 2007 2008 H1 Total 04‐08<br />
206<br />
33<br />
MW % MW % MW % MW % MW % MW %<br />
Sinovel 0 0% 0 0% 83 6% 680 21% 446 22% 1,208 16%<br />
Goldwind 40 20% 132 27% 441 33% 830 25% 354 17% 1,797 24%<br />
Vestas 60 31% 73 15% 318 24% 369 11% 291 14% 1,112 15%<br />
DFEM 0 0% 6 1% 9 1% 222 7% 287 14% 524 7%<br />
Gamesa 71 36% 179 37% 273 20% 560 17% 190 9% 1,274 17%<br />
Nordex 8 4% 8 2% 22 2% 56 2% 96 5% 190 3%<br />
Acciona 0 0% 0 0% 50 4% 51 2% 80 4% 180 2%<br />
50% O<strong>the</strong>rs h<br />
0 0% 3 1% 5 0% 15 0% 77 4% 99 1%<br />
40%<br />
30%<br />
20%<br />
10%<br />
0%<br />
2004 2005 2006 2007 2008 H1<br />
O<strong>the</strong>rs SE<strong>Wind</strong> Haizhuang Changzhou<br />
Acciona <strong>Wind</strong>ey Nordex Suzlon<br />
DFEM GE Gamesa Sinovel<br />
Vestas Goldwind<br />
Source: Azure International<br />
<strong>Wind</strong>ey 1 0% 7 1% 18 1% 65 2% 72 3% 163 2%<br />
Changzhou 0 0% 0 0% 0 0% 9 0% 65 3% 74 1%<br />
GE 17 8% 78 16% 116 9% 213 6% 39 2% 462 6%<br />
SEC 0 0% 0 0% 0 0% 23 1% 39 2% 61 1%<br />
Suzlon 0 0% 0 0% 13 1% 206 6% 33 2% 251 3%<br />
Haizhuang 0 0% 0 0% 0 0% 6 0% ‐ 0% 6 0%<br />
Total 197 100% 488 100% 1,347 100% 3,303 100% 2,066 100% 7,400 100%<br />
Suppliers 2004 2005 2006 2007 2008 H1 Total 04‐08<br />
MW % MW % MW % MW % MW % MW %<br />
International 157 80% 339 70% 791 59% 1,454 44% 729 35% 3,469 47%<br />
Locals 40 20% 149 30% 556 41% 1,849 56% 1,338 65% 3,931 53%<br />
Total 197 100% 488 100% 1,347 100% 3,303 100% 2,066 63% 7,400 100%<br />
7
<strong>Market</strong> Development in China<br />
Orders Backlog Development 2008 H1<br />
Acciona<br />
GE <strong>Wind</strong><br />
Yatu Guanzhou<br />
Changzhou<br />
CSIC Haizhuang<br />
SEC SE<strong>Wind</strong><br />
Gamesa<br />
Xiangdian<br />
Nordex<br />
Repower North<br />
<strong>Wind</strong>eyy<br />
Suzlon<br />
Mingyang<br />
O<strong>the</strong>rs<br />
Vestas<br />
DFEM<br />
Goldwind<br />
Sinovel<br />
Source: Azure International<br />
59<br />
143<br />
149<br />
170<br />
176<br />
268<br />
294<br />
306<br />
349<br />
350<br />
404<br />
637<br />
651<br />
693<br />
866<br />
Order Backlog Development as of Jun 08<br />
Order backlog has continued to increase at fast pace,<br />
and as off Jun 2008, accounted for about 20,000MW ‐<br />
Order visibility is about 3 years<br />
Top 3 companies (all local) shared 72% of all known<br />
orders (14,010 MW) at <strong>the</strong> end of Jun 2008;<br />
International companies, with production facilities in<br />
China are, in general, receiving an amount of orders<br />
which is significantly lower than <strong>the</strong> Local <strong>Chinese</strong><br />
partners;<br />
Strong increase in order for <strong>the</strong> 3 largest <strong>Chinese</strong> local<br />
manufacturers are mainly due to National Level<br />
Concession Projects and Special Order Award in<br />
Gansu Province as part of <strong>the</strong> <strong>Wind</strong> Base strategy ;<br />
National Level Concession Projects accounts for 2,714<br />
MW or 13.9% of <strong>the</strong> total backlog;<br />
Special Policy Orders, such as <strong>the</strong> Gansu <strong>Wind</strong> Base,<br />
accounts for 4,505 MW or 23.1% of <strong>the</strong> total backlog<br />
3,446<br />
3,998<br />
Backlog 2008 H1<br />
Backlog 2007<br />
Backlog 2006<br />
66,566 566<br />
0 1,000 2,000 3,000 4,000 5,000 6,000 7,000<br />
Suzlon l <strong>Navigating</strong> <strong>the</strong> <strong>Chinese</strong> <strong>Market</strong>place – Manufacturers l Oct 30, 08 ‐ Beijing<br />
Rank WTG Manufacturer<br />
2008 H1 Backlog<br />
MW %<br />
1 Sinovel 6,566.40 33.6%<br />
2 Goldwind 3,998.20 20.5%<br />
3 DFEM 3,445.50 17.6%<br />
4 Vestas 865.60 4.4%<br />
5 O<strong>the</strong>rs 693.00 3.5%<br />
6 Mingyang 651.00 3.3%<br />
7 Suzlon 636 636.50 50 33% 3.3%<br />
8 <strong>Wind</strong>ey 404.00 2.1%<br />
9 Repower North 350.00 1.8%<br />
10 Nordex 348.70 1.8%<br />
11 Xiangdian 306.00 1.6%<br />
12 Gamesa 294.10 1.5%<br />
13 SEC SE<strong>Wind</strong> 267.50 1.4%<br />
14 CSIC Haizhuang 176.00 0.9%<br />
15 Changzhou 169.50 0.9%<br />
16 Yatu Guanzhou 148.50 0.8%<br />
17 GE <strong>Wind</strong> 142 142.50 50 07% 0.7%<br />
18 Acciona 58.50 0.3%<br />
TOTAL 19,521 100.0%
<strong>Market</strong> Development China<br />
National Level Concession Projects<br />
Suzlon l <strong>Navigating</strong> <strong>the</strong> <strong>Chinese</strong> <strong>Market</strong>place – Manufacturers l Oct 30, 08 ‐ Beijing<br />
Project<br />
2004<br />
PPA<br />
RMB/kWh<br />
0.4917<br />
WTG<br />
Supplier<br />
Planned<br />
Capacity<br />
(MW)<br />
850.0<br />
Installed Capacity (MW)<br />
until<br />
Until<br />
%<br />
%<br />
2006<br />
2007<br />
316.2 37.2% 553.1 65.1%<br />
Low bidding with focus on acquiring pipeline ahead<br />
of profitability has been a noted problem with<br />
national level concession projects unitl 2007. This<br />
has happened despite <strong>the</strong> fact that selection criteria<br />
Huilai Shibeishan 0.50 Goldwind 100.0 100.0 100.0% 100.0 100.0% have officially shifted to lower weighting on price.<br />
Rudong I 0.44 Vestas 100.0 30.0 30.0% 100.0 100.0%<br />
Rudong II<br />
Tongyu<br />
052 0.52<br />
0.51<br />
GE<br />
Sinovel<br />
150 150.00 200.0<br />
87 87.00 22.5<br />
58 58.0% 0%<br />
11.3%<br />
127 127.55 27.0<br />
85 85.0% 0%<br />
14.0%<br />
In 2005 concessions, , <strong>the</strong> grid g pprice was weigthted g at<br />
40% of <strong>the</strong> full evaluation criteria, and for 2006 <strong>the</strong><br />
this was reduced to 25%. IN 2007, <strong>the</strong> criteria was<br />
Tongyu 0.51 Gamesa 200.0 20.4 10.2% 98.6 49.3% to select that tariff closest to <strong>the</strong> average<br />
Hutengxile 0.43 Goldwind 100.0 56.3 70.3% 100.0 100.0%<br />
2005<br />
Dafeng<br />
0.5021<br />
0.49 Goldwind<br />
600.0<br />
200.0<br />
0.0<br />
0.0<br />
0.0%<br />
0.0%<br />
133.0<br />
0.0<br />
22.17%<br />
0.0%<br />
All projects awarded before 2007 had a 3 year<br />
window for contruction, and <strong>the</strong> projects awarded<br />
in 2007, has a 4 year contruciton window.<br />
Anxi 0.46 Goldwind 100.0 0.0 0.0% 100.0 100.0%<br />
Dongtai 0.49 Sinovel 200.0 0.0 0.0% 33.0 16.0%<br />
Jimo 0.60 Sinovel 100.0 0.0 0.0% 0.0 0.0% 2,950.0 ,<br />
2006 0.4409 1,000.0 0.0 0.0% 0.0 0.0%<br />
Baotou Bayin 0.47 Goldwind 200.0 0.0 0.0% 0.0 0.0%<br />
Danjing 0.50 <strong>Wind</strong>ey 200.0 0.0 0.0% 0.0 0.0%<br />
Huitengliang I 0.41 Dongfang 300.0 0.0 0.0% 0.0 0.0%<br />
Huitengliang II 0.42 Sinovel 300.0 0.0 0.0% 0.0 0.0%<br />
2007 0.5153 950.0 0.0 0.0% 0.0 0.0%<br />
Wulangyiligeng 0.47 Goldwind 300.0 ‐‐‐ ‐‐‐ 0.0 0.0%<br />
Tongliao Beiqinghe 0.52 Sinovel 300.0 ‐‐‐ ‐‐‐ 0.0 0.0%<br />
Yodaokou 0.55 Sinovel 150.0 ‐‐‐ ‐‐‐ 0.0 0.0%<br />
Yumen Changma 0.52 Dongfang 200.0 ‐‐‐ ‐‐‐ 0.0 0.0%<br />
Total 0.4916 3,400.0 316.2 10.7% 686.1 20.2%<br />
Source: Azure International / Suzlon market research<br />
3,000<br />
2,500<br />
2,000<br />
1,500<br />
1,000<br />
500<br />
0<br />
89.3%<br />
360.0<br />
450 450.0 0<br />
27.6%<br />
Installed 2007<br />
Installed 2006<br />
Planned<br />
326.1<br />
181.2 188.7<br />
178.8 137.4<br />
Local Suppliers Installation International Installation<br />
9
Order from Special NDRC Policies<br />
Gansu Jiuqquan 10 GW <strong>Wind</strong> Base<br />
Suzlon l <strong>Navigating</strong> <strong>the</strong> <strong>Chinese</strong> <strong>Market</strong>place – Manufacturers l Oct 30, 08 ‐ Beijing<br />
In early May, <strong>the</strong> NDRC approved ‘Gansu Jiuquan 10 GW <strong>Wind</strong> Base Plan’ and <strong>the</strong> pre‐feasibility study for <strong>the</strong> first 3.8GW<br />
slated for development. By May 19 <strong>the</strong> NDRC approved “11th Five‐Year Construction Plan of Gansu Jiuquan <strong>Wind</strong> Base<br />
(DR Energy [2008]1135)” but <strong>the</strong> document has not been publicly released. On May 22Gansu Provincial Government held<br />
a press conference in Beijing in which <strong>the</strong> wind base was presented for <strong>the</strong> benefit of interested WTG manufacturers.<br />
The 3.8GW first phase project consist of twenty adjacent 100‐200MW projects to be developed by 2010. If successfully<br />
built and operating this should be <strong>the</strong> world’s largest “wind farm.<br />
Features of Gansu Jiuquan wind base development:<br />
1. The wind farm developers p were not chosen through g open p public p bidding. g<br />
2. No mention of wind resource measurement data available for WTG selection and micrositing.<br />
3. With one exception, no o<strong>the</strong>r private or non state or provincial government owned companies will participate in<br />
development.<br />
4. A single g feed‐in tariff, , set at RMB 0.5206 per p kWh has been applied pp as per p <strong>the</strong> latest Gansu National Concession pproject. j<br />
O<strong>the</strong>r basic conditions per <strong>the</strong> Gansu Yumen Changma<br />
5. The Gansu provincial DRC organized this development. On 16 March, <strong>the</strong> Gansu Provincial Government forbade lower‐<br />
level governments from participating in or approving wind farm developments signaling <strong>the</strong> province’s intention to<br />
manage its wind resource with a strong centralized approach.<br />
6. At <strong>the</strong> press conference, <strong>the</strong> Jiuquan Governor stated that turbine manufacturers with production in Gansu will be<br />
preferred as equipment suppliers. On 19 May, Jiuquan government signed an agreement with Sinovel to establish a<br />
manufacturing facility in Jiuquan. Goldwind already signed a similar contract in 2007 and already started constructing an<br />
assembly facility early this year to be completed by year‐end year‐end. Several o<strong>the</strong>r companies including Huiteng (blades) (blades), Sany<br />
(WTG), Dongjia, Huayi, are planning to locate in <strong>the</strong> vicinity according to <strong>the</strong> Jiuquan Government press release.<br />
Source: Azure International<br />
10
Order from Special NDRC Policies<br />
Gansu Jiuqquan 10 GW <strong>Wind</strong> Base ‐ Project Award Distribution<br />
Suzlon l <strong>Navigating</strong> <strong>the</strong> <strong>Chinese</strong> <strong>Market</strong>place – Manufacturers l Oct 30, 08 ‐ Beijing<br />
No Project Project Owner Project<br />
Awarded Volumes kW<br />
Capacity Sinovel DFEM Goldwind Haizhuang<br />
kW 1.5MW 1.5MW 1.5MW 2MW<br />
1 Yumen Changma No.1 Datang 201,000 201,000<br />
2 Yumen Changma No.2 CNOOC 199,500 199,500<br />
3 YumenChangmaNo.3 CECIC 199,500 199,500<br />
4 Guazhou Beidaqiao No.1 China Hydropower Engineering Consulting 199,500 100,500 99,000<br />
5 Guazhou Beidaqiao No.2 SDIC Huajing 199,500 199,500<br />
6 Guazhou Beidaqiao No.3 Longyuan 201,000 201,000<br />
7 Guazhou Beidaqiao No.4 Huineng (Gansu) New Energy 201,000 201,000<br />
8 Guazhou Beidaqiao No.5 China <strong>Power</strong> International 201,000 201,000<br />
9 Guazhou Ganhekou No.1 Guangdong (China) Nuclear <strong>Power</strong> 199,500 199,500<br />
10 Guazhou Ganhekou No.2 Huaneng <strong>Power</strong> international 199,500 199,500<br />
11 Guazhou Ganhekou No.3 State Grid Xin Yuan & Northwest <strong>Power</strong> 201,000 201,000<br />
12 Guazhou Ganhekou No.4 Sinohydro Corporation 199,500 90,000 109,500<br />
13 Guazhou Ganhekou No.5 Gansu <strong>Power</strong> Investment Group 201,000 150,000 51,000<br />
14 Guazhou Ganhekou No.6 China <strong>Power</strong> International & Xinmao 201,000 201,000<br />
15 Guazhou Ganhekou No.7 Huadian New Energy 201,000 201,000<br />
16 Guazhou Ganhekou No.8 Guohua Energy Investment 201,000 201,000<br />
17 Guazhou Qiaowan No.1 China Resources <strong>Power</strong> 201,000 150,000 51,000<br />
18 Guazhou Qiaowan No.2 Huaneng Renewable Energy 201,000 201,000<br />
199 Guazhou Gua hou Qiaowan No.3 North Longyuan ongyuan 101,000 0 ,000 51,000 5 ,000 50,000<br />
20 Guazhou Qiaowan No.3 Golden Concord 99,000 99,000<br />
Total 3,807,500 1,798,500 1,147,500 811,500 50,000<br />
[%] of <strong>the</strong> total orders available 47.2% 30.1% 21.3% 1.3%<br />
Source: Azure International<br />
11
Order from Special NDRC Policies<br />
Gansu Jiuqquan 10 GW <strong>Wind</strong> Base – Turbine Prices<br />
Suzlon l <strong>Navigating</strong> <strong>the</strong> <strong>Chinese</strong> <strong>Market</strong>place – Manufacturers l Oct 30, 08 ‐ Beijing<br />
No Project Project Owner Project<br />
Awarded Prices RMB/kW<br />
Capacity Sinovel DFEM Goldwind Haizhuang<br />
kW 1.5 MW 1.5MW 1.5MW 2MW<br />
1 Yumen Changma No.1 Datang 201,000 5,898<br />
2 Yumen Changma No.2 CNOOC 199,500 6,179<br />
3 YumenChangmaNo.3 CECIC 199,500 6,179<br />
4 Guazhou Beidaqiao No.1 China Hydropower Engineering Consulting 199,500 5,898 6,398<br />
5 Guazhou Beidaqiao No.2 SDIC Huajing 199,500 6,179<br />
6 Guazhou Beidaqiao No.3 Longyuan 201,000 5,898<br />
7 Guazhou Beidaqiao No.4 Huineng (Gansu) New Energy 201,000 6,398<br />
8 Guazhou Beidaqiao No.5 China <strong>Power</strong> International 201,000 5,898<br />
9 Guazhou Ganhekou No.1 Guangdong (China) Nuclear <strong>Power</strong> 199,500 6,149<br />
10 Guazhou Ganhekou No.2 Huaneng <strong>Power</strong> international 199,500 6,179<br />
11 Guazhou Ganhekou No.3 State Grid Xin Yuan & Northwest <strong>Power</strong> 201,000 5,898<br />
12 Guazhou Ganhekou No.4 Sinohydro Corporation 199,500 5,898 6,398<br />
13 Guazhou Ganhekou No.5 Gansu <strong>Power</strong> Investment Group 201,000 5,898 6,398<br />
14 Guazhou Ganhekou No.6 China <strong>Power</strong> International & Xinmao 201,000 6,398<br />
15 Guazhou Ganhekou No.7 Huadian New Energy 201,000 5,898<br />
16 Guazhou Ganhekou No.8 Guohua Energy Investment 201,000 5,898<br />
17 Guazhou Qiaowan No.1 China Resources <strong>Power</strong> 201,000 6,179 6,398<br />
18 Guazhou Qiaowan No.2 Huaneng Renewable Energy 201,000 5,898<br />
199 Guazhou Gua hou Qiaowan No.3 North Longyuan ongyuan 101,000 0 ,000 5,912 5,9 6,450<br />
20 Guazhou Qiaowan No.3 Golden Concord 99,000 6,413<br />
Total 3,807,500<br />
Source: Azure International<br />
12
Order from Special NDRC Policies<br />
The <strong>Wind</strong> Base Concept and its potential implications<br />
Suzlon l <strong>Navigating</strong> <strong>the</strong> <strong>Chinese</strong> <strong>Market</strong>place – Manufacturers l Oct 30, 08 ‐ Beijing<br />
The ‘wind base’ concept is meaningful in <strong>the</strong> scheme of continued <strong>Chinese</strong> wind project development. The concept of large<br />
‘wind bases’ in regions with solid resources and planned grid interconnection has appeared in key pieces of legislation related<br />
to <strong>the</strong> roll‐out of wind in China.<br />
The ‘Mid and Long‐term RE Implementation Plan’ from Jun 07, 07 planned for 3 x 1‐GW wind bases in Jiangsu, Hebei and<br />
IMAR by 2010. By 2020, 6 x 1‐GW wind bases are planned to be constructed in Xinjiang Dabancheng, Gansu Yumen,<br />
Jiangsu‐Shanghai coast, IMAR Huitengxile, Hebei Zhangbei and Jilin Baicheng, and o<strong>the</strong>r areas of proven wind resources.<br />
More recently, <strong>the</strong> ‘11th Five‐year RE Development Plan’ (Mar 03, 08) adjusted <strong>the</strong> 2010 wind target to 10GW mentioning<br />
5 x 1‐GW wind bases in Hebei, IMAR, Gansu, Jilin and Liaoning.<br />
Implications p for Project j Developers p<br />
For non‐SOE project wind project developers, this development sets a negative precedent. A similar approach may be<br />
adopted in <strong>the</strong> future development of Hebei, Liaoning, Jilin and IMAR which are also slated to have ‘wind bases’. By<br />
extension fur<strong>the</strong>r wind bases could also adopt conditions set via national concession projects.<br />
The ‘wind base’ mechanism does not appear pp to be a policy p ytool for provincial p DRCs to catch‐up p planning p g targets. g Gansu<br />
was on <strong>the</strong> way to achieve its 1GW target before <strong>the</strong> ‘wind base’ plan emerged. After publishing a 1GW by 2010 target in<br />
2006, 376.6MW had been installed by year‐end 2007, with a fur<strong>the</strong>r 669 MW of non wind‐base ‘near term’ pipeline<br />
existing.<br />
Implications for WTG manufacturers<br />
For WTG manufacturers, <strong>the</strong> wind bases will likely bring pressure to localize regionally. Governments in key wind provinces<br />
will all eye local manufacturing investment and jobs as a benefit not to be missed. Domestic WTG manufacturers are<br />
responding with de‐centralized assembly assembly. For example example, Goldwind is in <strong>the</strong> process or has already established<br />
manufacturing bases in Beijing, Hebei Chengde, Guangdong Huilai, Gansu Jiuquan (under construction), Xinjiang (under<br />
construction), IMAR Baotou (under construction), and Ningxia – closely following future likely wind base developments.<br />
Source: Azure International<br />
13
Order Book Breakdown – 2008 H1<br />
Order Breakdown Sinovel Goldwind DFEM Vestas<br />
Ming<br />
Yang<br />
Suzlon l <strong>Navigating</strong> <strong>the</strong> <strong>Chinese</strong> <strong>Market</strong>place – Manufacturers l Oct 30, 08 ‐ Beijing<br />
Suzlon Gamesa <strong>Wind</strong>ey REpower Nordex O<strong>the</strong>rs Total<br />
Order Book as of Jun 30, 08 6,716 3,968 3,446 816 681 637 491 404 350 349 1,953 19,811<br />
NDRC Concession Projects 1,190 700 500 0 0 0 101.5 200 0 22.5 2,714<br />
NDRC Special Policies 1,914 1,146 1,400 0 0 0 0 12 0 33 0 4,505<br />
Orders on Open <strong>Market</strong> 3,613 2,123 1,547 816 681 637 389.5 192 350 316 1,930 12,592<br />
% Open <strong>Market</strong> 53.8% 53.5% 44.9% 100.0% 100.0% 100.0% 79.3% 47.5% 100.0% 90.5% 98.8% 63.5%<br />
2933.1<br />
89%<br />
900<br />
800<br />
700<br />
600<br />
500<br />
400<br />
300<br />
200<br />
100<br />
0<br />
147.3<br />
682.7<br />
37.5<br />
642.5<br />
Installations 2007 Installation<br />
2008 (1) 2009 2010 (2) 2011 (3) 369.9<br />
In 2007, 11% of all<br />
11%<br />
installations (369.9 MW out<br />
of 3,303 MW) where<br />
Visibility<br />
NDRC<br />
Concession<br />
2008<br />
764<br />
2009<br />
1,000<br />
2010<br />
950<br />
2011<br />
1,000<br />
Total<br />
3,714<br />
National Level Concession Projects<br />
Projects, and International<br />
suppliers li installations<br />
i t ll ti<br />
accounted for 188.7MW of<br />
Special Policy<br />
Orders<br />
350 831 1,662 1,662 4,505<br />
NDRC orders<br />
this total; however, in <strong>the</strong><br />
future this figures are going<br />
to be much lower as <strong>the</strong><br />
Total<br />
Remarks:<br />
1,114 1,831 2,612 2,662 8,219<br />
Open <strong>Market</strong> Orders current existing backlog of 1. NDRC concession projects with expired window construction<br />
those order in <strong>the</strong><br />
awarded in 2004 and those expiring in 2008<br />
78.2<br />
International Company’s<br />
books is only 123.9 MW;<br />
2. For Special Policy Orders, we have assumed orders dated at <strong>the</strong><br />
defined date (350MW), and for o<strong>the</strong>rs (4,155 MW Incl. Gansu)<br />
481.8<br />
On <strong>the</strong> o<strong>the</strong>r hand, <strong>the</strong><br />
we have considered 20% in 2009, 40% in 2010 and 40% 2011<br />
70.0<br />
amount of installations by 3. For NDRC concession projects in 2011, we have considered <strong>the</strong><br />
299 299.00<br />
40.5<br />
172.5<br />
Local Companies coming<br />
from National Level<br />
concession projects and<br />
Special Policy Orders will<br />
increase substantially.<br />
same historic level which has been awarded in 2006 and 2007, 2007 or<br />
1,000MW<br />
Goldwind Sinovel Gamesa Vestas GE<br />
Source: Azure International / CWEA statistics 2007/ Suzlon market research<br />
14
Suzlon l <strong>Navigating</strong> <strong>the</strong> <strong>Chinese</strong> <strong>Market</strong>place – Manufacturers l Oct 30, 08 ‐ Beijing<br />
<strong>Market</strong> Development China<br />
Addressable <strong>Market</strong> Share – Excluding NDRC Concession Projects and Special Policy Orders<br />
The addressable market for International Turbine<br />
suppliers is significantly smaller than that of <strong>the</strong><br />
existing forecast, since those companies do not<br />
have fair access to all orders in <strong>the</strong> <strong>Market</strong>.<br />
If <strong>the</strong> contruction window of <strong>the</strong> National Level<br />
concession projects and Special Policy Orders<br />
(such as <strong>Wind</strong> Bases) is respected (it was not for<br />
contracts awarded in 2004) we can assume that<br />
<strong>the</strong> follwing Installations will need to be made:<br />
Addressable<br />
(1)<br />
<strong>Market</strong><br />
2008 2009 2010 2011 2012 (1)<br />
BTM Forecast 5,500 6,500 7,500 8,000 9,000<br />
Special Policy<br />
Od Orders<br />
1,114 , 1,831 , 2,612 , 2,662 , 2,800 ,<br />
Total 4,386 4,669 4,888 5,338 6,200<br />
<strong>Market</strong><br />
volume (%)<br />
79.8 71.2 65.2 66.8 68.8<br />
Remarks:<br />
1. For 2012 we have considered that:<br />
• Orders from national level concession projects will be<br />
at <strong>the</strong> same level of that awarded in 2006 and 2007,<br />
or 1,000MW;<br />
• Order from special policies will account to about<br />
1,800 MW, or about <strong>the</strong> same level we have for<br />
orders already awarded.<br />
Source: Azure International / CWEA statistics 2007/ Suzllon market research<br />
10,000<br />
99,000 000<br />
8,000<br />
7,000<br />
6,000<br />
5,000<br />
4,000<br />
3,000<br />
2,000<br />
1,000<br />
0<br />
Considering existing National Level<br />
Concession project construction window<br />
Actual Forecast BTM<br />
370<br />
2,933<br />
1,114<br />
4,386<br />
1,831<br />
4,669<br />
2,612<br />
4,888<br />
2,662<br />
5,338<br />
20%<br />
2,800<br />
66,200 200<br />
2007 2008 2009 2010 2011 2012<br />
NDRC Orders Open <strong>Market</strong><br />
All <strong>the</strong> figures suggests that in future , most likely, no<br />
International company producing in China will be able to reach<br />
20% market k share h llevel, l since a significant f amount of f <strong>the</strong> h<br />
installations will be made of orders already placed by <strong>the</strong><br />
government to Local suppliers;<br />
According g to our estimates, no more than 70% of <strong>the</strong> total<br />
market will be addressable to international companies<br />
producing in in China and from this total, Local companies with<br />
local brands, will still play an important role;<br />
15
<strong>Market</strong> Environment Project<br />
Development of <strong>Wind</strong> Farm Ownership<br />
Suzlon l <strong>Navigating</strong> <strong>the</strong> <strong>Chinese</strong> <strong>Market</strong>place – Manufacturers l Oct 30, 08 ‐ Beijing<br />
MW Installed Ownership, Pipeline Development There are about 200 players currently<br />
operating p gas developers p in <strong>the</strong> wind<br />
Goldwind<br />
Roaring 40s<br />
Three Gorges<br />
CWIC<br />
Huayi<br />
CNOOC<br />
CECIC<br />
China Resources<br />
Ningxia <strong>Power</strong><br />
100%<br />
80%<br />
60%<br />
40%<br />
20%<br />
5%<br />
9%<br />
86%<br />
7.40%<br />
9%<br />
20%<br />
64%<br />
7.40%<br />
19%<br />
22%<br />
53%<br />
business in China<br />
The top 25 companies in China have an<br />
total of 5,382 MW installed capacity,<br />
which represents 91% of <strong>the</strong> total<br />
Installations. They are responsible for<br />
76.4% of <strong>the</strong> Near Term development<br />
(32,478 MW of 42,490 MW), and 73.1%<br />
of <strong>the</strong> Long Term Development (107,586<br />
HK Construction<br />
0%<br />
MW of f 147 147,139 139 MW)<br />
Installed Cap Near Term Cap Long‐Term Cap<br />
Among <strong>the</strong> top 25 developers <strong>the</strong>re is an<br />
Unknown International<br />
current order backlog of about 16,594<br />
Private Companies State Owned Enterprises<br />
MW; however, 15,8840 MW worth of<br />
~Unkown~<br />
State Grid<br />
CPI<br />
Honiton Energy<br />
Built 2008 H1<br />
Near Term<br />
<br />
installations on a near term basis are still<br />
to be ordered!<br />
Government agencies / utilities will<br />
continue to be <strong>the</strong> biggest customer<br />
base but <strong>the</strong>ir domination will subside<br />
China <strong>Wind</strong> <strong>Power</strong><br />
Hebei Construction<br />
Beijing Energy Inv.<br />
Shandong Luneng<br />
Guodian<br />
Guangdong Nuclear<br />
Huadian<br />
Huaneng<br />
Shenhua<br />
Dt Datang<br />
Longyuan<br />
Long term<br />
0 2,000 4,000 6,000 8,000 10,000 12,000 14,000 16,000 18,000<br />
Traditional Players will still be <strong>the</strong> dominat<br />
force in <strong>the</strong> development of <strong>the</strong><br />
windbusiness in China; however, <strong>the</strong>re is a<br />
increasing number of Foreginer players<br />
activelly looking for options to participate<br />
in <strong>the</strong> market!<br />
Source: Azure International 16
China <strong>Wind</strong> <strong>Power</strong> Development footprint<br />
Analysis<br />
Suzlon l <strong>Navigating</strong> <strong>the</strong> <strong>Chinese</strong> <strong>Market</strong>place – Manufacturers l Oct 30, 08 ‐ Beijing<br />
<strong>Wind</strong> Farm development footprint / province [MW]<br />
Guangdong<br />
Ningxia<br />
Xinjiang<br />
Heilongjiang<br />
Jiangsu<br />
Shandong<br />
Gansu<br />
Liaoning<br />
The top p 11 provinces p in China in terms of <strong>Wind</strong>power p development p account Hebei ebe<br />
for 93% of all installations and 98% of <strong>the</strong> future pipeline; however:<br />
Inner Mongolia accounts for 43% of all future developments;<br />
Jilin<br />
The top three provinces (Inner Mongolia, Jilin and Hebei, where Beijing and<br />
Tianjin are located) accounts for 68% of <strong>the</strong> future project developments; Inner Mongolia<br />
Balance between Low and Standard temperature machines will become<br />
more difficult as STV areas represents only 14% of long term<br />
developments.<br />
Source: Azure International / Suzlon Proprietary Report / Emerging Energy Research<br />
‐<br />
5,000<br />
10,000<br />
15,000<br />
20,000<br />
Long Term Development<br />
Near Term Development<br />
Order Backlog<br />
Installad capacity<br />
25,000<br />
30,000<br />
35,000<br />
40,000<br />
45,000<br />
17
China <strong>Wind</strong> <strong>Power</strong> Development footprint<br />
Suzlon l <strong>Navigating</strong> <strong>the</strong> <strong>Chinese</strong> <strong>Market</strong>place – Manufacturers l Oct 30, 08 ‐ Beijing<br />
<strong>Wind</strong> Farm development –Temperature [LTV/STV] ‐ MW Standard Temperature Low Temperature<br />
4,900<br />
82%<br />
Installad Capacity<br />
Order Backlog<br />
Short Term Development<br />
Long Term Development<br />
297<br />
5%<br />
1,101<br />
18%<br />
Installad Capacity<br />
16,411<br />
87%<br />
88,463 463<br />
45%<br />
Order Backlog<br />
435<br />
2%<br />
2,553<br />
13%<br />
<strong>Wind</strong> Farm development –<strong>Wind</strong> Class [I / II / III] ‐ MW Class I Class II Class III<br />
2,385<br />
40%<br />
3,319<br />
55% 10 10,066 066<br />
53%<br />
28,591<br />
87%<br />
11 11,151 151<br />
34%<br />
4,145<br />
13%<br />
Short Term Development<br />
1,035<br />
3%<br />
86,383<br />
86%<br />
24,618<br />
24%<br />
44,798 798<br />
5%<br />
13,914<br />
14%<br />
Long Term Development<br />
20 20,551 551<br />
63% 70,881<br />
71%<br />
The <strong>Chinese</strong> <strong>Wind</strong> power business is clearly a Class II/III LTV predominant <strong>Market</strong>, and <strong>the</strong> future tendency<br />
shows an increased importance in LTV/Class II II, for what we will need larger and more competitive<br />
machines in terms RMB/MWh. Our current product portfolio is not sustainable on a medium/long term,<br />
and action must be taken immediately<br />
Source: Azure International / Suzlon Proprietary Report<br />
18
Competition Product Capabilities<br />
China<br />
Suzlon l <strong>Navigating</strong> <strong>the</strong> <strong>Chinese</strong> <strong>Market</strong>place – Manufacturers l Oct 30, 08 ‐ Beijing<br />
Companies 750 800 850 1250 1300 1500 2000 Total<br />
MW [%] MW [%] MW [%] MW [%] MW [%] MW [%] MW [%] MW<br />
InteernationalBrands<br />
Suzlon 100 100.0 0 15 15.7% 7% 535 535.5 5 84 84.3% 3% 635 635.5 5<br />
Vestas 455.6 52.6% 410.0 47.4% 865.6<br />
Repower 350.0 100.0% 350.0<br />
Nordex 5.2 1.5% 343.5 98.5% 348.7<br />
Acciona 58.5 100.0% 58.5<br />
GE Wi <strong>Wind</strong>d 142 142.5 5 100 100.0% 0% 142 142.5 5<br />
Gamesa 294.1 100.0% 294.1<br />
Total ‐ 0.0% ‐ 0.0% 749.7 27.8% 100.0 3.7% 5.2 0.2% 1,080.0 40.1% 760.0 28.2% 2,694.9<br />
Sinovel 6,565.5 100.0% 6,565.5<br />
DEC 3,445.5 100.0% 3,445.5<br />
Dommestic<br />
Established<br />
<strong>Wind</strong>ey 244.5 60.5% 80.0 79.5 19.7% 404.0<br />
Goldwind 1,178.3 29.5% 2,820.0 70.5% 3,998.3<br />
Total 1,422.8 9.9% 80.0 0.6% ‐ 0.0% ‐ 0.0% ‐ 0.0% 12,910.5 89.6% ‐ 0.0% 14,413.3<br />
Mingyang 651.0 100.0% 651.0<br />
Xiangdian 306.0 100.0% 306.0<br />
SEC 267.5 100.0% 267.5<br />
China Creative 220.5 100.0% 220.5<br />
Total ‐ 0.0% ‐ 0.0% ‐ 0.0% 267.5 18.5% ‐ 0.0% 871.5 60.3% 306.0 21.2% 1,445.0<br />
Grand Total 1,422.8 7.7% 80.0 0.4% 749.7 4.0% 367.5 2.0% 5.2 0.0% 14,862.0 80.1% 1,066.0 5.7% 18,553.2<br />
Neew<br />
Entrrants<br />
Analysis y<br />
WTG Size distribution – Order Book<br />
85% of all exiting orders are for machines ≥ 1500 kW, and with exception<br />
of Gamesa, all suppliers have an product available ≥ 1500 kW<br />
International Customers are starting to source WTGs from local<br />
suppliers, provided <strong>the</strong>re is a qualified license provider and WTG is cost<br />
effective (Mingyang has a 400MW order with Datang Jilin/R40s);<br />
SEC is in discussions with Siemens to forma New JV in China, but <strong>the</strong>y<br />
already have two o<strong>the</strong>r license agreements with Dewind (1250KW) and<br />
Aerodyn (2000 K)<br />
Source: Azure International / Suzlon Proprietary Report<br />
1,066.0<br />
6%<br />
2,252.5<br />
12%<br />
372.7<br />
2%<br />
14,862.0<br />
80%<br />
< 1000 kW<br />
>1000 kW<br />
≥1500 kW<br />
≥2000 kW<br />
19
Competition: Manufacturing Buildup – Industry Plans<br />
25,000 New Entrants<br />
20,000<br />
15,000<br />
10 10,000 000<br />
5,000<br />
0<br />
EEstablished t bli h d DDomestic ti<br />
Established International<br />
1,404<br />
3,322<br />
1,830<br />
1,478<br />
14<br />
24+ companies with technology or license agreement and<br />
detailed BP for WTG manufacturing<br />
Sinovel, <strong>Wind</strong>ey, DFEM, Goldwind<br />
Suzlon, GE, Gamesa, Acciona,<br />
Vestas, Nordex<br />
11,377<br />
1,502<br />
6,204<br />
16,671<br />
4,322<br />
7,572<br />
19,446<br />
6,195<br />
8,599<br />
Suzlon l <strong>Navigating</strong> <strong>the</strong> <strong>Chinese</strong> <strong>Market</strong>place – Manufacturers l Oct 30, 08 ‐ Beijing<br />
20,971<br />
6,520<br />
9,799<br />
3,672 4,377 4,652 4,652<br />
2006 2007 2008 2009 2010 2011<br />
Analysis<br />
Th There is i a significant i ifi tmismatch i t h<br />
between capacity build‐up and<br />
market forecast<br />
If plans are fully implemented,<br />
local companies will be able,<br />
alone, to handle <strong>the</strong> market<br />
Foreigner players will face a very<br />
stiff price competition and will<br />
need to develop export plans<br />
Capacity is supposed to be even<br />
higher, if smaller players are<br />
considered id d<br />
Of late late, <strong>the</strong>re has been a trend of Large <strong>Chinese</strong> <strong>Power</strong> getting into <strong>Wind</strong> turbine manufacturing manufacturing. This may<br />
take away significant volume from <strong>the</strong> open market and fur<strong>the</strong>r intensifies <strong>the</strong> competition<br />
Source: Azure International / Suzlon Proprietary Report<br />
20
Macro Economic Conditions
Macro Economic Indicators<br />
Banking Condition in China<br />
In June 2008, China’s central bank announced that <strong>the</strong><br />
commercial bank reserve requirement ratio would be raised by<br />
100 bbasis i point i ttto 17 17.5%. 5% ( in i year 2006 RRR was 75%& 7.5% & iin Q1<br />
2007 it was 10%). This requirement was reduced on Oct 15 to<br />
16.0%; however ,reserve ratio levels at still at historic highs<br />
Early reports which stated that <strong>the</strong> RRR could reach to 19% by<br />
<strong>the</strong> end of 2008 2008, are no longer correct due to <strong>the</strong> current<br />
global and <strong>Chinese</strong> financial situation.<br />
Bank’s lending reduced by quarterly limits (Quota) imposed by<br />
Central bank this year. It aimed to cap new Yuan lending in<br />
2008 at about last year's year s level of RMB 3.63 363trillion trillion.<br />
Suzlon l <strong>Navigating</strong> <strong>the</strong> <strong>Chinese</strong> <strong>Market</strong>place – Manufacturers l Oct 30, 08 ‐ Beijing<br />
8.0% 20.0%<br />
7.8%<br />
7.6%<br />
7.4%<br />
7.2%<br />
Drastic liquidity change since late 2007 – especially driven by<br />
USD liquidity issues since Central Bank requires all <strong>the</strong> reserve<br />
7.0%<br />
by banks to be made in USD 6.8%<br />
Banks funding cost is much higher than 2007. Inter‐bank rates<br />
increased sharply in <strong>the</strong> first 9 months of 2008. However, this<br />
tendency has been somewhat reversed when The People's<br />
Bank of China reduced <strong>the</strong> benchmark one‐ year lending<br />
interest rate by 27 basis points to 72percent 7.2 percent with effect from<br />
September 16. This is understood to help spur <strong>the</strong> sentiment in<br />
real estate market as well as cut some real estate developers'<br />
financing costs<br />
In <strong>the</strong> increasing credit market tightening tightening, banks are more<br />
cautious which makes financing difficult for <strong>the</strong> developers and<br />
delays in <strong>the</strong> project.<br />
Source: Azure International<br />
6.6%<br />
6.4%<br />
6.2%<br />
6.0%<br />
Reserve Ratio<br />
5 year interaste rate<br />
Jun 05, 06 0<br />
Aug 05, 06 0<br />
Oct 05, 06 0<br />
Dec 05, 06 0<br />
Feb 05, 07 0<br />
Apr 05, 07 0<br />
Jun 05, 07 0<br />
Aug 05, 07 0<br />
Oct 05, 07 0<br />
Dec 05, 07 0<br />
Feb 05, 08 0<br />
Apr 05, 08 0<br />
Jun 05, 08 0<br />
Aug 05, 08 0<br />
Oct 05, 08 0<br />
18.0%<br />
16.0%<br />
14 14.0% 0%<br />
12.0%<br />
10.0%<br />
8.0%<br />
6.0%<br />
22
Renewable Energy Financing<br />
New guidelines have been introduced for<br />
<strong>the</strong> approval process<br />
Detailed project review process is in place, linking <strong>the</strong><br />
disbursements to specific projects. This eliminates<br />
flexibility for <strong>the</strong> developers to use <strong>the</strong> funding for<br />
o<strong>the</strong>r th projects. j t<br />
Banks take greater responsibility for <strong>the</strong> due diligence<br />
Investment Considerations<br />
Only <strong>Chinese</strong> majority owned JV is entitled for CDM<br />
registration<br />
51% <strong>Chinese</strong> shareholding critical for CER revenues<br />
Debt/Equity ratio<br />
<strong>Chinese</strong> companies 80:20<br />
Foreign companies maximum 2:1<br />
Foreign developers to be adversely effected<br />
Regulations restrict carbon credit revenues<br />
Source: Azure International<br />
Suzlon l <strong>Navigating</strong> <strong>the</strong> <strong>Chinese</strong> <strong>Market</strong>place – Manufacturers l Oct 30, 08 ‐ Beijing<br />
Case Study: Huaneng Fuxin Gaoshanzhi<br />
Project Name: Huaneng Fuxin Gaoshanzhi I<br />
Capacity: 100MW<br />
Location: Liaoning<br />
Borrower: Huaneng New Energy<br />
Debt Provider: China Development Bank<br />
Equity Provider: Huaneng Group (Parent)<br />
Data of Financing Closure: Mar 2008<br />
Total Project Cost: USD 145 .0 million<br />
Total Debt USD 115.9 million<br />
Total Equity: USD 29.1 million<br />
Gearing: 80% (as % total project cost)<br />
Debt Interest: 6.84 % per year<br />
Loan Term: N/A<br />
Project Lifetime: 21 years<br />
Description: Huaneng is building a 100.5 MW windfarm<br />
in Lioaning province due for completion in Sep 2008. The<br />
1.5MW WTGs will be supplied by Sinovel. The project is<br />
applying li ffor CDM and d iit is i expected d to achieve hi an IRR of f<br />
8.85% with CDM credits<br />
23
<strong>Wind</strong> <strong>Power</strong> Development in China<br />
Conclusions<br />
Suzlon l <strong>Navigating</strong> <strong>the</strong> <strong>Chinese</strong> <strong>Market</strong>place – Manufacturers l Oct 30, 08 ‐ Beijing<br />
The Financial Crisis we are facing at <strong>the</strong> moment my slowdown <strong>the</strong> development of <strong>the</strong> market, but <strong>the</strong> installed capacity<br />
will still be higher than that of 2007; however, bottleneck issues are not fully solved<br />
Supply Chain (which also plays an important role in <strong>the</strong> global business);<br />
Qualified personnel –The established companies will have problems to build‐up capability, especially in <strong>the</strong><br />
technical side.<br />
Fur<strong>the</strong>rmore:<br />
All indications shows that <strong>the</strong>re will be overcapacity in manufacturing of wind turbines; however current financial<br />
environment may delay expansion plan from small players;<br />
Price pressure will most likely increase, specially for <strong>the</strong> international suppliers (due to low PPAs, competition<br />
from local players, and overcapacity);<br />
International project developers and turbine suppliers established in China must be granted access to compete on<br />
equal terms with local players on National Level Concession Projects and NDRC special policy projects (such as <strong>the</strong><br />
<strong>Wind</strong> base scheme);<br />
Intention of local project developers to produce its own WTG<br />
Establishment of a “<strong>Chinese</strong> certification requirement”, when <strong>the</strong>re is an alredy existing and worldwide recognized<br />
certification in place.
Suzlon Manufacturing Facilities
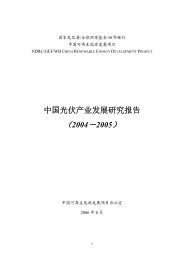
Suzlon Manufacturing Facility – Tianjin<br />
Aerial View<br />
Total Area: 250,000 m2 Total Built Area: 58,500 m 2<br />
Suzlon l <strong>Navigating</strong> <strong>the</strong> <strong>Chinese</strong> <strong>Market</strong>place – Manufacturers l Oct 30, 08 ‐ Beijing
Suzlon Energy Tianjin Ltd<br />
Manufacturing Capabilities<br />
Weiihai Rongcheng <strong>Wind</strong> Farm – Guohua l R40s<br />
Shandong Province<br />
39 x S66 1.25 MW<br />
Suzlon l <strong>Navigating</strong> <strong>the</strong> <strong>Chinese</strong> <strong>Market</strong>place – Manufacturers l Oct 30, 08 ‐ Beijing<br />
Suzlon Energy Tianjin Ltd<br />
Beijiing Office<br />
Employees : 125<br />
Sales Sales, PM, PM Site installation and OMS, OMS Financial<br />
Services<br />
Tianjin Factory:<br />
EEmployees: l 11,100 100<br />
Manufacturing Capabilities<br />
Rotor Blade Unit (RBU)<br />
Nacelle Cover Unit (NCU)<br />
Wi <strong>Wind</strong> d TTurbine bi GGenerator UUnit i (WTG)<br />
Control Panel Unit (CPU)<br />
Generator Unit<br />
Support Infrastructure and facilities<br />
Center for Research& Development<br />
Training Center<br />
Deliveries in 2007: 206 MW
Thank you<br />
This presentation and <strong>the</strong> accompanying slides (<strong>the</strong> “Presentation”), which have been prepared by Suzlon Energy Limited (<strong>the</strong> “Company”), have been prepared solely for information<br />
purposes and do not constitute any offer, recommendation or invitation to purchase or subscribe for any securities, and shall not form <strong>the</strong> basis or be relied on in connection with any<br />
contract or binding commitment whatsoever. No offering of securities of <strong>the</strong> Company will be made except by means of a statutory offering document containing detailed information<br />
about <strong>the</strong> Company.<br />
This Presentation has been prepared by <strong>the</strong> Company based on information and data which <strong>the</strong> Company considers reliable, but <strong>the</strong> Company makes no representation or warranty,<br />
express or implied, whatsoever, and no reliance shall be placed on, <strong>the</strong> truth, accuracy, completeness, fairness and reasonableness of <strong>the</strong> contents of this Presentation. This<br />
Presentation may not be all inclusive and may not contain all of <strong>the</strong> information that you may consider material. Any liability in respect of <strong>the</strong> contents of, or any omission from, this<br />
Presentation is expressly excluded.<br />
Certain matters discussed in this Presentation may contain statements regarding <strong>the</strong> Company’s Company s market opportunity and business prospects that are individually and collectively<br />
forward‐looking statements. Such forward‐looking statements are not guarantees of future performance and are subject to known and unknown risks, uncertainties and assumptions<br />
that are difficult to predict. These risks and uncertainties include, but are not limited to, <strong>the</strong> performance of <strong>the</strong> Indian economy and of <strong>the</strong> economies of various international markets,<br />
<strong>the</strong> performance of <strong>the</strong> wind power industry in India and world‐wide, competition, <strong>the</strong> company’s ability to successfully implement its strategy, <strong>the</strong> Company’s future levels of growth<br />
and expansion, technological implementation, changes and advancements, changes in revenue, income or cash flows, <strong>the</strong> Company’s market preferences and its exposure to market<br />
risks, as well as o<strong>the</strong>r risks. The Company’s actual results, levels of activity, performance or achievements could differ materially and adversely from results expressed in or implied by<br />
this Presentation. The Company assumes no obligation to update any forward‐looking information contained in this Presentation. Any forward‐looking statements and projections<br />
made by y third pparties included in this Presentation are not adopted p by y <strong>the</strong> Company p yand <strong>the</strong> Company p yis not responsible p for such third party p ystatements and pprojections j<br />
No offering of <strong>the</strong> Company’s securities will be registered under <strong>the</strong> U.S. Securities Act of 1933, as amended (<strong>the</strong> “Securities Act”). Accordingly, unless an exemption from registration<br />
under <strong>the</strong> Securities Act is available, <strong>the</strong> Company’s securities may not be offered, sold, resold, delivered or distributed, directly or indirectly, into <strong>the</strong> United States or to, or for <strong>the</strong><br />
account or benefit of, any U.S. Person (as defined in regulation S under <strong>the</strong> Securities Act).<br />
The distribution of this document in certain jurisdictions may be restricted by law and persons into whose possession this presentation comes should inform <strong>the</strong>mselves about and<br />
observe any such restrictions.