Wetlands in SW Uganda, NWP 99. - Foodnet
Wetlands in SW Uganda, NWP 99. - Foodnet
Wetlands in SW Uganda, NWP 99. - Foodnet

You also want an ePaper? Increase the reach of your titles
YUMPU automatically turns print PDFs into web optimized ePapers that Google loves.
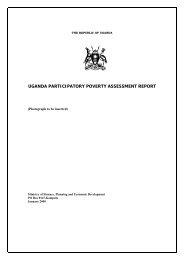
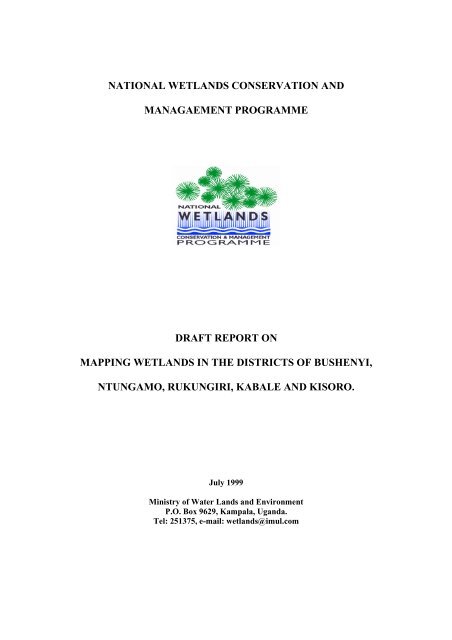
NATIONAL WETLANDS CONSERVATION AND<br />
MANAGAEMENT PROGRAMME<br />
DRAFT REPORT ON<br />
MAPPING WETLANDS IN THE DISTRICTS OF BUSHENYI,<br />
NTUNGAMO, RUKUNGIRI, KABALE AND KISORO.<br />
July 1999<br />
M<strong>in</strong>istry of Water Lands and Environment<br />
P.O. Box 9629, Kampala, <strong>Uganda</strong>.<br />
Tel: 251375, e-mail: wetlands@imul.com
ACKNOWLEDGEMENTS<br />
The work conta<strong>in</strong>ed <strong>in</strong> this report is a comb<strong>in</strong>ed effort of the members of staff of the National<br />
Biomass Study Project. All the members played their parts diligently to see that the work is<br />
successfully completed. Nevertheless it would be unfair not to mention a few. The Project<br />
would like to recognise the contribution by Mr. John Diisi who spearheaded the plann<strong>in</strong>g of<br />
the whole exercise. Specifically we thank him for the work on field data collection and data<br />
capture. Recognition also goes to Mr. John Begumana for the role he played <strong>in</strong> data<br />
collection, and spatial and edit<strong>in</strong>g. Thanks also go to Mr. Karatunga Ali and Mr. Amadra Ori-<br />
Okido who did all the work of map design<strong>in</strong>g and production.<br />
The Project is also grateful to the staff of the National <strong>Wetlands</strong> Conservation and<br />
management Programme for their co-operation dur<strong>in</strong>g the entire period of the study. Special<br />
recognition goes to Ms. Norah Namakambo who was the ma<strong>in</strong> player from the <strong>Wetlands</strong><br />
Programme.<br />
We can not forget the contribution by the local staff at district level who did their best to<br />
assist field teams dur<strong>in</strong>g data collection. In particular thanks go to the District Environment<br />
Officers and/or District Forest Officers of Bushenyi, Rukungiri, Ntungamo, Kabale and<br />
Kisoro.<br />
ii
EXCECUTIVE SUMMARY<br />
The National Biomass Study (NBS) mapped wetlands <strong>in</strong> south-western <strong>Uganda</strong> <strong>in</strong> the districts<br />
of Bushenyi, Rukungiri, Ntungamo, Kabale and Kisoro. The objective of the exercise was to<br />
survey, describe, quantify and map wetlands <strong>in</strong> these districts.<br />
In collaboration with the National <strong>Wetlands</strong> Programme, a classification system was<br />
developed to enable detailed description of the wetlands. The classification makes it possible<br />
to describe wetlands accord<strong>in</strong>g to their status and type. Is the wetland natural or modified? Is<br />
the cover of the wetland grass, papyrus, or forest?<br />
The NBS field teams visited all accessible wetlands <strong>in</strong> the mentioned districts for data<br />
collection. Materials used <strong>in</strong>cluded exist<strong>in</strong>g SPOT satellite imagery, land cover/use maps and<br />
topographic maps. These items were used <strong>in</strong> locat<strong>in</strong>g and assess<strong>in</strong>g the status and type of<br />
wetlands. The data collected was recorded while <strong>in</strong> the field and later <strong>in</strong> the office, entered<br />
<strong>in</strong>to a Geographical Information System (GIS) for analysis and mapp<strong>in</strong>g.<br />
Hav<strong>in</strong>g done spatial and attribute edit<strong>in</strong>g and analysis, it was found out that substantial areas<br />
of wetlands have been converted <strong>in</strong>to other types for various uses. In Bushenyi district there is<br />
a wetland area of 250skm. Of these, 13% has been converted to subsistence farmland, and<br />
14% <strong>in</strong>to improved pasture. Papyrus and other sedges constitute 40%. 53% of the wetlands<br />
are permanent while 47% are seasonal.<br />
In Kabale district, wetlands cover 97skm of which 42% are seasonal and 58% are<br />
permanently wet. Grasslands cover 20.3%, subsistence farmland 60.4% while Papyrus and<br />
other sedges cover 16%. Woodlots <strong>in</strong> wet areas cover about 3%.<br />
In Kisoro district wetlands cover 25skm of which 12% are seasonal and 88% permanently<br />
wet. Grasslands constitute 11%, Cyperus species 32% and subsistence farmland 57%.<br />
Ntungamo district has 101skm of wetlands of which 62% are permanently wet and 38% are<br />
seasonally wet. All the permanent wetlands are under Papyrus or sedges. The rest of the<br />
wetlands <strong>in</strong>clude grasslands and traces of swamp forest and subsistence farmland.<br />
Rukungiri district has 154skm of wetlands, 76% of which are permanent and 24% are<br />
seasonally wet. Swamp forests cover 30%, grasslands 15% and subsistence farmland 40%.<br />
The rest of the wetlands are Cyperus spp, bushes and thickets.<br />
Accord<strong>in</strong>g to percentages, and not the physical area of wetlands per district, wetland<br />
modification was found to be most <strong>in</strong>tensive <strong>in</strong> Kabale and Kisoro districts. They have the<br />
smallest area of wetlands and more than half of their wetland estate has been modified.<br />
iii
TABLE OF CONTENTS<br />
TABLE OF CONTENTS IV<br />
INTRODUCTION 1<br />
METHODOLOGY 1<br />
CLASSIFICATION 1<br />
FIELDWORK 2<br />
PREPARATION AND MATERIALS USED FOR FIELDWORK 2<br />
DATA COLLECTED 3<br />
OFFICE WORK 3<br />
GEO-REFERENCING SPOT IMAGERY 3<br />
VECTORISING / UPDATING LUC LAYERS 3<br />
ENTERING FIELD DATA INTO A GIS 3<br />
ENTERING DATA FROM WETLANDS PROGRAM 4<br />
DATA VERIFICATION 4<br />
DATA ANALYSIS 5<br />
MAP PRODUCTION 5<br />
RESULTS AND DISCUSSION 6<br />
BUSHENYI DISTRICT 6<br />
KABALE DISTRICT 8<br />
KISORO DISTRICT 11<br />
NTUNGAMO DISTRICT 14<br />
RUKUNGIRI DISTRICT 15<br />
CONCLUSION 18<br />
THE STATUS OF WETLANDS 18<br />
MAPPING 19<br />
APPENDIX 1 20<br />
TERMS OF REFERENCE 20<br />
ALL WETLANDS 24<br />
iv
LIST OF TABLES<br />
TABLE 1 CODES OF LAND COVER CLASSES ...................................................................................................... 3<br />
TABLE 2 CODES OF WETLAND TYPES............................................................................................................... 4<br />
TABLE 3 WETLAND TYPES OF BUSHENYI DISTRICT ......................................................................................... 6<br />
TABLE 4 WETLAND SYSTEMS OF BUSHENYI DISTRICT .................................................................................... 7<br />
TABLE 5 WETLAND TYPES OF KABALE DISTRICT ............................................................................................ 9<br />
TABLE 6 WETLAND SYSTEMS OF KABALE DISTRICT ..................................................................................... 10<br />
TABLE 7 WETLAND TYPES OF KISORO DISTRICT ........................................................................................... 11<br />
TABLE 8 WETLAND SYSTEMS OF KISORO DISTRICT ...................................................................................... 11<br />
TABLE 9 WETLAND TYPES OF NTUNGAMO DISTRICT..................................................................................... 15<br />
TABLE 10 WETLAND SYSTEMS OF NTUNGAMO DISTRICT.............................................................................. 15<br />
TABLE 11 WETLAND TYPES OF RUKUNGIRI DISTRICT ................................................................................... 16<br />
TABLE 12 WETLAND SYSTEMS OF RUKYNGIRI DISTRICT .............................................................................. 16<br />
TABLE 13 AREA OF WETLANDS BY DISTRICT AND DRAINAGE SYSTEM .......................................................... 20<br />
TABLE 14 SUMMARY OF MODIFIED WETLANDS PER DISTRICT ....................................................................... 20<br />
TABLE 15 MODIFIED WETLANDS PER DISTRICT ............................................................................................. 21<br />
LIST OF FIGURES<br />
FIGURE 1 BUSHENYI DISTRICT........................................................................................................................ 7<br />
FIGURE 2 KABLE DISTRICT ............................................................................................................................. 9<br />
FIGURE 3 KISORO DISTRICT .......................................................................................................................... 13<br />
FIGURE 4 NTUNGAMO DISTRICT.................................................................................................................... 14<br />
FIGURE 5 RUKUNGIRI DISTRICT .................................................................................................................... 17<br />
v
Introduction<br />
The goal of The National <strong>Wetlands</strong> Conservation and Management Programme is to susta<strong>in</strong><br />
the biophysical and economic values of wetlands for present and future generations. One of<br />
its ma<strong>in</strong> objectives is to develop capacity for wetland conservation and management at district<br />
level. This <strong>in</strong>volves develop<strong>in</strong>g the capacity of district adm<strong>in</strong>istrations to assess wetland<br />
resources and plan their management through their <strong>in</strong>volvement <strong>in</strong> <strong>in</strong>ventory work. The task<br />
at hand is to survey, describe quantify and map wetlands <strong>in</strong> districts of Bushenyi, Kabale,<br />
Kisoro, Ntungamo, and Rukungiri.<br />
<strong>Wetlands</strong> have always existed and known by traditional names by the people around them.<br />
Surveys on fauna, flora, water flow and quality have been done on some wetlands <strong>in</strong> the<br />
country. Physical locations were also mapped <strong>in</strong> the 1950s and 1960s by the Surveys and<br />
Mapp<strong>in</strong>g Department as can be seen from the Y732 Topographic maps of <strong>Uganda</strong>. The<br />
National biomass Study mapped land cover <strong>in</strong>clud<strong>in</strong>g wetlands for the whole country <strong>in</strong> 1994.<br />
Before the mapp<strong>in</strong>g by the NBS, there was no database that one could use to readily<br />
determ<strong>in</strong>e areas of wetlands. Even with the NBS mapp<strong>in</strong>g, some <strong>in</strong>formation on wetlands was<br />
still lack<strong>in</strong>g. The objective of land cover/use mapp<strong>in</strong>g by NBS was the general land cover and<br />
not directed at wetland <strong>in</strong>ventory. This is why the NBS was asked to map wetlands <strong>in</strong> greater<br />
detail to provide the hitherto miss<strong>in</strong>g <strong>in</strong>formation.<br />
Field teams visited wetlands <strong>in</strong> the five districts and collected data on wetlands and recorded<br />
it accord<strong>in</strong>g to a classification agreed upon by the <strong>Wetlands</strong> Programme and NBS. The data<br />
was later captured <strong>in</strong>to a Geographical Information system for analysis and map production.<br />
Maps show<strong>in</strong>g the status and types of wetlands per district were produced <strong>in</strong> large scale and<br />
presented. Other outcomes are conta<strong>in</strong>ed <strong>in</strong> this report.<br />
This report gives a chronology of the whole exercise of mapp<strong>in</strong>g the wetlands <strong>in</strong> the<br />
mentioned districts. The first part gives the details of preparations done for the study and the<br />
methodology used. It also expla<strong>in</strong>s the steps gone through dur<strong>in</strong>g data capture, edit<strong>in</strong>g of<br />
physical maps and the <strong>in</strong>formation they conta<strong>in</strong> (spatial and attribute data) and the process of<br />
map production. The second part conta<strong>in</strong>s results of the study presented as tables and<br />
descriptions. The tables show wetlands organised by districts, dra<strong>in</strong>age systems, and wetland<br />
systems.<br />
Methodology<br />
Classification<br />
Whereas district officers were assigned to carry out wetland <strong>in</strong>ventories, the classification and<br />
mapp<strong>in</strong>g was contracted to the National Biomass Study (NBS), Forest Department as<br />
consultants. The NBS was to carry out this task <strong>in</strong> close collaboration with the <strong>Wetlands</strong> Unit<br />
and offer backstopp<strong>in</strong>g services to district officers while collect<strong>in</strong>g data <strong>in</strong> the field.<br />
While mapp<strong>in</strong>g the land cover of the country, the NBS gradually developed a classification<br />
system of 13 classes and this is the one that is currently be<strong>in</strong>g used. One of the major classes<br />
is wetland. In this class, the ground is permanently wet and the vegetation grow<strong>in</strong>g there had<br />
to be papyrus or other sedges, float<strong>in</strong>g plants like Pistia spp, or reeds like Phragmites spp. In<br />
other major land cover classes with wet areas, classes were qualified with a sub-class<br />
depend<strong>in</strong>g on the wetness of the ground i.e. seasonally wet (s) and permanently wet (p).<br />
1
S<strong>in</strong>ce the objective of NBS was determ<strong>in</strong><strong>in</strong>g the quantity and distribution of woody biomass,<br />
data collected <strong>in</strong> wetland areas was not sufficient for the objectives of the Wetland<br />
Programme. It was therefore necessary to develop a classification that would take care of<br />
details as required by the <strong>Wetlands</strong> Programme.<br />
The <strong>Wetlands</strong> Programme and the NBS agreed on the follow<strong>in</strong>g classification:<br />
Seasonal wetlands:<br />
• Swamp forest<br />
• Palms and thickets<br />
• Grassland<br />
• Modified<br />
Permanent wetlands:<br />
• Swamp forest<br />
• Papyrus<br />
• Non-papyrus<br />
• Modified<br />
• Open water<br />
Swamp forest, whether seasonal or permanent, can consist of vegetation cover rang<strong>in</strong>g from<br />
thick closed canopy forests, to open canopy forests and woodlands. Palms and thickets consist<br />
of thick or sparse palm trees and or scattered trees and shrubs. Grassland wetlands are<br />
dom<strong>in</strong>ated by grass while modified wetlands are those that have been converted to pasture,<br />
farmland or built up. The modified wetland is represented by the use it has been converted to.<br />
Fieldwork<br />
Preparation and Materials used for fieldwork<br />
Mapp<strong>in</strong>g was done at a scale of 1:50,000. Land use/cover (LUC) map sheets cover<strong>in</strong>g the five<br />
districts were plotted for use as base maps dur<strong>in</strong>g fieldwork. These maps show land cover as<br />
mapped previously by the NBS. They were to be used as base maps for detailed updat<strong>in</strong>g of<br />
the wetlands.<br />
Multi-spectral SPOT satellite imagery were used as a reference to show locations and shapes<br />
of wetlands. The imagery could show small wetlands, natural or converted, which had been<br />
neglected or ignored dur<strong>in</strong>g the <strong>in</strong>itial mapp<strong>in</strong>g. Wetness of the ground can be directly<br />
<strong>in</strong>terpreted from the imagery.<br />
The imagery used were taken <strong>in</strong> 1992/93 because there are no very recent imagery cover<strong>in</strong>g<br />
that region. The latest imagery that cover a few parts of <strong>Uganda</strong> were taken <strong>in</strong> 1995. Changes<br />
on the ground between 1993 and 1995 were presumed to be <strong>in</strong>significant compared to the<br />
thousands of dollars needed to acquire a new set of imagery. The fact that the imagery were 4<br />
to 5 years old at the time of do<strong>in</strong>g this study did not have a significant impact on mapp<strong>in</strong>g<br />
because wetlands are partly natural physical features <strong>in</strong> valleys that don’t change quickly and<br />
secondly due to <strong>in</strong>tensive ground truth<strong>in</strong>g done.<br />
GPS units were used for navigation purposes. They helped <strong>in</strong> locat<strong>in</strong>g positions of changed or<br />
modified wetlands on the map for del<strong>in</strong>eat<strong>in</strong>g. They also helped <strong>in</strong> locat<strong>in</strong>g and determ<strong>in</strong><strong>in</strong>g<br />
extents of wetlands, which were be<strong>in</strong>g mapped for the first time.<br />
Topographic Y732 maps cover<strong>in</strong>g the five districts were also carried along for navigational<br />
purposes.<br />
2
Data collected<br />
Field teams were dispatched to cover the districts <strong>in</strong> question. All the accessible wetlands<br />
were visited and observed. Data was collected for the follow<strong>in</strong>g aspects:<br />
• Whether the size and shape are <strong>in</strong>tact <strong>in</strong> relation to the NBS LUC maps and satellite<br />
imagery<br />
• Whether the wetland has been modified and if so the modified area was del<strong>in</strong>eated on the<br />
LUC base map and the class and type noted. Detailed del<strong>in</strong>eation was to be done later on<br />
the computer.<br />
• Dur<strong>in</strong>g the <strong>in</strong>itial national mapp<strong>in</strong>g exercise by the NBS, some wet areas had been<br />
disregarded due to their small sizes and were just generalised <strong>in</strong>to the neighbour<strong>in</strong>g land<br />
cover class. This time such previously omitted wetlands were isolated and del<strong>in</strong>eated.<br />
• The class and wetness of the wetland accord<strong>in</strong>g to the developed classification above was<br />
noted and recorded<br />
Office work<br />
Geo-referenc<strong>in</strong>g spot imagery<br />
When all the fieldwork was completed, the data was taken to the office for entry <strong>in</strong>to a predesigned<br />
database.<br />
A satellite image for a particular map sheet was geo-referenced so that it could exactly fit<br />
geometrically its correspond<strong>in</strong>g land use layer <strong>in</strong> the NBS database. For example, satellite<br />
image number 85/2 was geo-referenced to fit LUC layer number 85/2. This was done <strong>in</strong> order<br />
to overlay the LUC layer onto the image so that the layer could be edited directly referr<strong>in</strong>g to<br />
the imagery <strong>in</strong> the background.<br />
Vectoris<strong>in</strong>g / updat<strong>in</strong>g LUC layers<br />
After geo-referenc<strong>in</strong>g the image, the LUC layer was loaded for edit<strong>in</strong>g. Del<strong>in</strong>eations of<br />
modified wetlands that were made <strong>in</strong> the field and recorded on base maps were transferred to<br />
the digital LUC layer. In cases where the edges of exist<strong>in</strong>g mapped wetlands had changed, the<br />
boarders of the same polygons on the digital layer were correspond<strong>in</strong>gly modified. Where<br />
some wetlands were be<strong>in</strong>g mapped for the first time, new polygons were digitised. These<br />
represented the current shapes and sizes of wetlands on the ground.<br />
Enter<strong>in</strong>g field data <strong>in</strong>to a GIS<br />
Enter<strong>in</strong>g attributes collected from the field <strong>in</strong>to the modified polygons followed spatial<br />
edit<strong>in</strong>g. Data entered would be the cover class of the wetland such as grassland, and then the<br />
type of wetness such as seasonal or permanent.<br />
Codes were used to represent the land cover or use of the wetland. The classes and their codes<br />
are shown <strong>in</strong> Table 1<br />
Table 1 Codes of land cover classes<br />
Class Code<br />
Broad-leaved woodlots 1<br />
Swamp forest 5<br />
Thickets 6<br />
Grasslands 7<br />
Papyrus and other sedges 8<br />
Farmland 9<br />
Built up area 11<br />
Open water 12<br />
3
In addition to codes represent<strong>in</strong>g cover/use, two extra codes were used <strong>in</strong>dicate the degree of<br />
wetness. This was to dist<strong>in</strong>guish the seasonally wet from the permanently wet one. The codes<br />
used are:<br />
• Seasonally wet s<br />
• Permanently wet p<br />
Additional <strong>in</strong>formation collected on wetlands was the status. This was particularly so with<br />
grasslands that were converted <strong>in</strong>to improved pasture. In addition, wetlands under papyrus<br />
and other sedges were s<strong>in</strong>gled out because of their importance. These codes are:<br />
• Papyrus and sedges a<br />
• Improved pasture i<br />
For example, a seasonal wetland that has been modified <strong>in</strong>to grassland pasture would be<br />
coded as 7si.<br />
The types of wetlands encountered <strong>in</strong> the mapped region are shown <strong>in</strong> Table 2. Codes will be<br />
used <strong>in</strong> subsequent tables to save space.<br />
Table 2 Codes of wetland types<br />
1s Broad-leaved woodlots e.g. Eucalyptus<br />
5s Swamp forest<br />
6s Seasonal wetland dom<strong>in</strong>ated by bushes and thickets<br />
7s Seasonally wet grassland<br />
7si Seasonally wet grassland modified <strong>in</strong>to pasture<br />
9s Seasonal wetland modified <strong>in</strong>to farmland<br />
11s Seasonally wet built up area<br />
8a Permanent wetland with papyrus and/or other sedges<br />
7p Permanent wetland dom<strong>in</strong>ated by grasses<br />
7pi Permanently wet grassland modified <strong>in</strong>to pasture<br />
9p Permanent wetland modified <strong>in</strong>to farmland<br />
Enter<strong>in</strong>g data from <strong>Wetlands</strong> program<br />
The <strong>Wetlands</strong> Programme provided data on the names of wetland systems and dra<strong>in</strong>age<br />
systems. Different parts of the same wetland system are normally called different names. So<br />
the polygon of such a wetland system was split and each piece given its local name. Not all<br />
names for the <strong>in</strong>dividual wetland units were available.<br />
Data verification<br />
When all the data was entered <strong>in</strong>to the database, queries were used to check if there were any<br />
polygons without data that they should conta<strong>in</strong>. Queries were also used to search for data that<br />
could be <strong>in</strong> a wrong place. If found such errors were promptly corrected. Secondly draft<br />
copies on the maps were plotted so that they could be visually checked for any errors. The<br />
<strong>Wetlands</strong> Programme staff also checked the draft maps for a second op<strong>in</strong>ion.<br />
4
Data analysis<br />
Data analysis was ma<strong>in</strong>ly <strong>in</strong> creat<strong>in</strong>g summaries for area statements for:<br />
I. Area of each wetland system<br />
II. Area of wetlands <strong>in</strong> each district<br />
III. Area of each wetland unit<br />
IV. Description of wetland distribution<br />
V. Dra<strong>in</strong>age systems per district<br />
Although map production was done to a great extent us<strong>in</strong>g ArcView and ArcInfo, analysis<br />
was done us<strong>in</strong>g MS Access, which is more flexible and powerful <strong>in</strong> data analysis. Attribute<br />
files <strong>in</strong> ArcView are <strong>in</strong> dbase format and can be l<strong>in</strong>ked to a database <strong>in</strong> Access directly.<br />
A database was created <strong>in</strong> Access and a l<strong>in</strong>k was created to the attribute table of wetlands of<br />
each district. This means if changes or updates are made <strong>in</strong> the attribute table of wetlands of a<br />
particular district, they can be viewed directly <strong>in</strong> Access. In other words you don’t have to<br />
copy the tables from ArcView to Access every time an update is made. For easy summaries,<br />
one table (Allwet) was created and all the l<strong>in</strong>ked tables were appended to it. Allwet table can<br />
however not be directly be updated from ArcView s<strong>in</strong>ce it resides <strong>in</strong> Access and not<br />
ArcView. In case of updates or changes <strong>in</strong> wetland attribute files, update queries were created<br />
to empty the Allwet file and copy data from l<strong>in</strong>ked district wetland attribute tables to update<br />
the Allwet file. All the queries to perform this task are executed through a macro so that you<br />
don’t have to append data from each district <strong>in</strong>dividually.<br />
Areas of wetland systems <strong>in</strong> each district were calculated us<strong>in</strong>g a query. It groups dra<strong>in</strong>age<br />
systems, then groups all wetlands <strong>in</strong> each dra<strong>in</strong>age system, then groups the classes or types of<br />
wetlands <strong>in</strong> each wetland system and then calculates the area of each class <strong>in</strong> hectares and<br />
square kilometres.<br />
Another query summarises the areas <strong>in</strong> hectares and square kilometres for each wetland type<br />
for a district. Results of these queries are found <strong>in</strong> the section of Results and Appendix.<br />
Map production<br />
F<strong>in</strong>al maps for the five districts were produced <strong>in</strong> colour on A0 paper. The ma<strong>in</strong> theme of the<br />
district maps was the wetland layer. Other layers were added to enhance the legibility of the<br />
maps. Other layers added were:<br />
• the <strong>in</strong>frastructure layer show<strong>in</strong>g roads rang<strong>in</strong>g from tarmac down to motorable trucks,<br />
• adm<strong>in</strong>istrative layer show<strong>in</strong>g <strong>in</strong>ternational to sub-county level. Counties are written <strong>in</strong> a<br />
font lager than sub-county names. Some urban centres are also shown.<br />
• gazetted layer show<strong>in</strong>g forest reserves and national parks<br />
• Rivers layer show<strong>in</strong>g major and m<strong>in</strong>or rivers<br />
In addition to the legend, each map has a pie chart, which summarises the area percentage<br />
covered by each wetland type.<br />
<strong>Wetlands</strong> are symbolised accord<strong>in</strong>g to their types such as grasslands, swamp forest etc., and<br />
also on wetness that is seasonally or permanently wet. For example, grasslands <strong>in</strong> Kabale fall<br />
<strong>in</strong> for categories namely seasonally wet, seasonally wet improved pasture, permanently wet,<br />
and permanently wet improved pasture. All are symbolised by different colours.<br />
5
Results and Discussion<br />
Bushenyi District<br />
Bushenyi district has a total area of 4,287skm. Dry land is 3,668skm and open water is<br />
369skm. It has a total of 250 square km of wetlands, constitut<strong>in</strong>g 5.8% of the district area.<br />
52.8% are permanently wet while 47.2% are seasonally wet. Papyrus constitutes the largest<br />
part of the wetlands. They cover about 100skm or 40% followed by seasonally wet grasslands<br />
that constitute 32% (see Table 3). 14% of the wetlands have been converted to improved<br />
pasture for diary cattle. Some of the wet grasslands (permanent and seasonal) mapped as<br />
<strong>in</strong>tact also are used for graz<strong>in</strong>g cattle but it was not possible to <strong>in</strong>clude them <strong>in</strong>to the improved<br />
pasture class with certa<strong>in</strong>ty. Cultivation has claimed 13% of the wetlands.<br />
<strong>Wetlands</strong> are wider <strong>in</strong> the lower half of the district <strong>in</strong> the counties of Sheema and Ruh<strong>in</strong>da.<br />
Their relief is a transition from rift valley ranges <strong>in</strong>to pla<strong>in</strong>s of Mbarara and Ntungamo<br />
districts. In these counties it is common to f<strong>in</strong>d that seasonal wetlands have been converted<br />
<strong>in</strong>to improved pasture.<br />
Table 3 Wetland types of Bushenyi district<br />
Class Area-ha Area-skm Proportion<br />
5s 2948.86 29.49 11.8%<br />
6s 171.68 1.72 0.7%<br />
7p 600.04 6.00 2.4%<br />
7s 4500.44 45.00 18.0%<br />
7sI 3574.96 35.75 14.3%<br />
8a 9972.28 <strong>99.</strong>72 39.9%<br />
8b 4.95 0.05 0.0%<br />
8p 28.09 0.28 0.1%<br />
9p 2588.27 25.88 10.4%<br />
9s 615.83 6.16 2.5%<br />
Total 25005.40 250.05 100.0%<br />
Dra<strong>in</strong>age valleys <strong>in</strong> Ruh<strong>in</strong>da, Bunyaruguru, Igara and Buhweju counties are narrow as they<br />
are squeezed between steep slopes. In most cases, terra<strong>in</strong> starts ris<strong>in</strong>g right from the<br />
riverbanks and leave no room for wetlands. Where terra<strong>in</strong> allows a wetland to exist, the<br />
wetland is permanently wet. This condition contributed most <strong>in</strong> protect<strong>in</strong>g the exist<strong>in</strong>g unmodified<br />
wetlands. It can be noted that <strong>in</strong> Ruh<strong>in</strong>da for example, valleys have been modified<br />
<strong>in</strong>to agricultural subsistence farmland. Attempts to convert them <strong>in</strong>to pasture have failed due<br />
to permanent wetness.<br />
<strong>Wetlands</strong> <strong>in</strong> the rift valley are wide and benefit from the protection of the national park. These<br />
are the only places that still have swamp forests <strong>in</strong> Bushenyi district.<br />
6
Figure 1 Bushenyi District<br />
LEGEND<br />
GAZETTED AREA<br />
ROAD S<br />
Forest Reserve<br />
National Park<br />
Wildlife R eserve<br />
Lake Edward<br />
Tarmac road<br />
Murram road (all w eather)<br />
Murram road (dry w eather )<br />
Motorable track<br />
ADMI NI STR ATI VE BOUN DA RIES<br />
National<br />
District<br />
County<br />
Sub-County<br />
RIV ER<br />
Major River<br />
M<strong>in</strong>or R iver<br />
SEASONAL WETLANDS<br />
Thi ckets<br />
Swamp F orest<br />
Grassland (Natural)<br />
Farmland<br />
PERMANENT WET LANDS<br />
Grassland (Natural)<br />
Farmland<br />
Papyrus & other sedges<br />
OTHER S<br />
Open Water<br />
Built-up Area<br />
KISENYI<br />
BUNYARUGURU<br />
North Maramagambo CFR (DJM)<br />
Kigezi GR<br />
KANYABWANGA<br />
NATIONAL WETLANDS CONSERVATION AND<br />
MANAGEMENT PROGRAMME<br />
BUSHENYI DISTRICT WETLANDS<br />
KI CH WAM BA<br />
BIT EREKO<br />
Kaz<strong>in</strong>ga Ch ann el<br />
L. Nyamus<strong>in</strong>gire<br />
RUHINDA<br />
KASHENSHERO<br />
Queen Elizabe th NP<br />
KY AMUHUNG A<br />
NYABUBARE<br />
MITOOMA<br />
L. Kat<strong>in</strong>da KATERERA<br />
L. Mirambi<br />
RUBIRIZI<br />
L. Che ma<br />
L. Kariya<br />
L. Kabarongi<br />
BIH ANGA<br />
L. Luijongo<br />
L. Kamunzuka<br />
L. Kyasanduka<br />
Lake Nkugute<br />
L. Kaguba Lake Murabyo<br />
North Maramagambo CFR<br />
Queen Elizabeth NP<br />
Kal<strong>in</strong>zu CF R<br />
MITOMA<br />
Nyamuhizi<br />
MUKIBIRIZ I<br />
7<br />
L. Chibwera<br />
RYE RU<br />
KABIRA KITAGATA<br />
MUTARA<br />
L. Ma sec he<br />
L.Bagusa<br />
Chambura GR<br />
L. Nshenyi<br />
L. Mugogo<br />
MASHONG A<br />
IGARA<br />
KYAMUHUNGA<br />
Kyamuhunga L FR<br />
ISHAKA<br />
L. Kyamwiga<br />
KA KANJU<br />
Kasyoha-Kitomi CFR<br />
BUSHENYI T.C.<br />
BURERE<br />
KY ABU GIMBI<br />
BUM BE IRE<br />
KY EIZO BA<br />
Kyamugambira<br />
Kandekye<br />
KITAGATA<br />
L. Bugwagi<br />
Kashewanzi<br />
BUGO NGI<br />
KITEMBE<br />
SHUUKU<br />
BUHWEJU<br />
KY ANGENYI<br />
KAGUNGO KABWOHE<br />
KA RUNGU<br />
NSIKA<br />
RWENGWE<br />
MASHERUK A<br />
KIGARAMA<br />
KIBINGO<br />
Ka bwohe LFR Ko og a L FR<br />
KA GANGO<br />
SHEEMA<br />
Kakorogoto<br />
Kabura<br />
Rugasha<br />
Koga<br />
Migyera-Kisenyi<br />
N<br />
Scale 1:15 0,00 0<br />
Bushenyi district has three dra<strong>in</strong>age systems; the closed, L. Edward/L. George and L. Victoria<br />
systems. The wetland systems that make these dra<strong>in</strong>age systems are shown <strong>in</strong> Table 4. The<br />
closed systems are <strong>in</strong> the rift valley-land-formations <strong>in</strong> Bunyaruguru county. They are located<br />
on the shores of crater lakes. The L. Victoria system is <strong>in</strong> the east of the district <strong>in</strong> Sheema<br />
county and flow south <strong>in</strong>to river Rwizi. Most of the district is dra<strong>in</strong>ed by the L. Edward/L.<br />
George dra<strong>in</strong>age system, which eventually end <strong>in</strong> L. Edward, Kaz<strong>in</strong>ga channel and L. George.<br />
Table 4 Wetland Systems of Bushenyi district<br />
Dra<strong>in</strong>age System Wetland System Hectares Skm Sub-Total<br />
Closed<br />
Bugasa 20.73 0.21<br />
L. Kyamwongo 8.70 0.09<br />
L. Nyamus<strong>in</strong>gire 11.59 0.12<br />
Maseche 15.45 0.15<br />
Nyabutare 46.55 0.47
Dra<strong>in</strong>age System Wetland System Hectares Skm Sub-Total<br />
Rugazi-Omukas<strong>in</strong>ga 39.00 0.39 1.42<br />
Edward/George<br />
Victoria<br />
Buh<strong>in</strong>dagi 701.23 7.01<br />
Chambura 512.50 5.12<br />
Kafu-Mpanga 278.75 2.79<br />
Kakari-Katerera 322.03 3.22<br />
Kandekye-Ruhorobero 2977.37 29.77<br />
Kanyara-Nyampimbi 284.11 2.84<br />
Karujugo 226.33 2.26<br />
Kasharara 450.72 4.51<br />
Katarimwa(Katarimu) 2<strong>99.</strong>23 2.99<br />
Katereza 264.79 2.65<br />
Kifuka-Kibare 150.86 1.51<br />
Kitarema 36.36 0.36<br />
Kyamugambira-Kitimbi-Kyarwigi-Kitagata 1642.28 16.42<br />
L. Edward Marg<strong>in</strong>s 639.72 6.40<br />
Mbika 94.75 0.95<br />
Nchwera 584.65 5.85<br />
Ntungu 230.58 2.31<br />
Nyamahizi-Kateizi-Kasere 540.69 5.41<br />
Nyamirembe-Katoma-Kabushoro 770.77 7.71<br />
Nyamweru 703.88 7.04<br />
Nyaruteme 31.04 0.31<br />
Nyaruz<strong>in</strong>ga 16.64 0.17<br />
Rushisha 76.49 0.76<br />
Rutanda 1306.26 13.06<br />
Rwabanjeri-Karugorora 815.69 8.16<br />
Tiguhonoka 148.88 1.49<br />
Warugo 146.10 1.46 142.53<br />
Kabiso 22.96 0.23<br />
Kabura 741.32 7.41<br />
Kakorogoto 975.37 9.75<br />
Kamira 122.98 1.23<br />
Katara 194.50 1.95<br />
Koga 42<strong>99.</strong>31 42.99<br />
Mijera-Kishenyi 3074.48 30.74<br />
Nchwezi-Runy<strong>in</strong>ya 337.54 3.38<br />
Nyakishana 10.07 0.10<br />
Nyangoma 302.93 3.03<br />
Rugasha 419.49 4.19<br />
Rwizi 109.69 1.10 106.11<br />
Kabale District<br />
Kabale district has a total area of 1,729.6skm. A total of about 97 square km or 5.6% of the<br />
district area is under wetlands. Dry land constitutes 1,582skm while open water is 50skm.<br />
Woodlots are about 3%, grasslands 20%, papyrus and other sedge wetlands about 16%, and<br />
subsistence 60%<br />
8
Figure 2 Kabale District<br />
Kiririma<br />
K abaya<br />
Mul <strong>in</strong> di<br />
Kan yamu ab o<br />
IK UM BA<br />
N<br />
Rwe sanziro<br />
MUK O<br />
Kisoro<br />
Scale 1:100,000<br />
Nyakal anga<br />
Ruhuma<br />
M urub ut i<br />
Kigyeyo<br />
Ruhuhuma<br />
5 0 5 10 Kilom eter s<br />
Ishasha<br />
Kash asha<br />
Ch ar a<br />
RUBANDA<br />
BUFUNDI<br />
Vig ag a or K iru ruma<br />
Rute nga<br />
La ke Bunyonyi<br />
Mug ye ra<br />
Lubaya<br />
HAMUR WA<br />
Kiru ruma<br />
Bisur a<br />
RUBAYA<br />
Gweru bay<br />
NATIONAL WETLANDS CONSERVATION AND<br />
MANAGEMENT PROGRAMME<br />
KABALE DISTRICT WETLANDS<br />
Kisizi<br />
Rush om a<br />
Kiruruma Norht<br />
KITUMBA<br />
Rushama<br />
G w amauru<br />
KAS HAMBYA<br />
BUBALE<br />
KABALE M.C.<br />
Niach at i<br />
KAMUGANGUZI<br />
Katuna<br />
9<br />
Ni mparo<br />
Kach enag a<br />
KYANAMIRA<br />
Nyab usab i<br />
Ka nzok o<br />
RWAMUCUCU<br />
Kanyabaha<br />
NDORWA<br />
Kiruruma South<br />
BUHARA<br />
Nakabi mbi<br />
RUKIG A<br />
Kabizi<br />
Ka lweru<br />
RWANDA<br />
KAHARO<br />
Mu n ciro<br />
BUKINDA<br />
Kabizi<br />
Mivum ba<br />
Kabi gondo<br />
MAZIBA<br />
Ka hon do<br />
Ch og o<br />
KAMWEZI<br />
Area d istri bu t io n pe r Wetl an d ty pe<br />
(<strong>in</strong> square kilometers)<br />
15.2(10.3% )<br />
26.5(18.8%)<br />
3.6 (2. 4%)<br />
3.7(2.5 %)<br />
31.9(21.7%)<br />
5.7( 3.9%)<br />
6.7( 4.6%)<br />
0.9(0.6<br />
2 .6(1.7%)<br />
L ubi rizi<br />
LEGEND<br />
ROADS<br />
Tarmac road<br />
Murram road (all weather)<br />
Murram road (dry weather)<br />
Motorable trac k<br />
ADMINISTRATIVE BO UNDARIES<br />
In te rn at io na l<br />
Di stric t<br />
County<br />
Sub-County<br />
GAZETTED AREA<br />
Forest Re serve<br />
Na ti on al Park<br />
RIVERS<br />
Ma jo r Ri ve r<br />
Mi no r R iv er<br />
SEASONAL WETLANDS<br />
Thickets<br />
Grassland (Natural)<br />
Grass land (Pasture)<br />
Fa rml an d<br />
Woodlots<br />
PERMANENT WETLANDS<br />
Grassland (Natural)<br />
Grass land (Pasture)<br />
Fa rml an d<br />
Papyrus & other sedges<br />
Woodlots<br />
OTHERS<br />
Op en Wa ter<br />
Buil t-up Area<br />
Most of the wetlands have been modified. Of the 96.8 skm of wetlands <strong>in</strong> Kabale, 71.4skm or<br />
73.7% have been converted and put to various uses (see Table 5). About 10skm (about 11%)<br />
have been converted <strong>in</strong>to improved grassland for pasture while 58.5skm have been converted<br />
<strong>in</strong>to subsistence agricultural farmland. Some wetlands like the one along Katuna road switch<br />
between graz<strong>in</strong>g and cultivation periodically probably depend<strong>in</strong>g on seasons and level of<br />
wetness. Some parts of Kabale town are on wetlands.<br />
Table 5 Wetland types of Kabale district<br />
Class Area-ha Area-skm Proportion<br />
1p 209.91 2.10 2.2%<br />
1s 53.76 0.54 0.6%<br />
6s 87.60 0.88 0.9%<br />
7p 566.24 5.66 5.9%<br />
7pI 668.72 6.69 6.9%<br />
7s 367.94 3.68 3.8%<br />
7sI 358.63 3.59 3.7%
Class Area-ha Area-skm Proportion<br />
8a 1521.52 15.22 15.7%<br />
9p 2650.25 26.50 27.4%<br />
9s 3194.50 31.95 33.0%<br />
Total 9679.06 96.79 100.0%<br />
Other wetlands have been planted with eucalyptus but the extent was not possible to establish.<br />
Many wood lots of Eucalyptus have been planted <strong>in</strong> or at the fr<strong>in</strong>ges of both seasonal and<br />
permanent wetlands. Most of the <strong>in</strong>dividual wood lots are too small to be mapped as polygon<br />
features at the scale used. Small wood lots have been represented by squares. Mapped wood<br />
lots <strong>in</strong> wetlands total 2.6skm (see Table 5).<br />
The degree of wetland reclamation <strong>in</strong> Kabale is unrivalled <strong>in</strong> the region. The largest wetland<br />
units i.e. the Kiruruma south and Kiruruma north are permanently wet but this did not h<strong>in</strong>der<br />
those determ<strong>in</strong>ed to reclaim them. Even today, much effort has to be put <strong>in</strong> to keep the<br />
dra<strong>in</strong>age channels open otherwise the reclaimed wetlands can be too water logged for the<br />
current use. Kanyabaha-Kanyamagogo-Kitaraka-Nomuremu wetland system<br />
Although situated <strong>in</strong> hilly terra<strong>in</strong>, these wetland systems are wide and permanently wet. They<br />
are similar to U glacier valleys <strong>in</strong> temperate regions. Many rivers and streams flow through<br />
narrow V valleys that don’t allow wetland formation. Such cases are evident along the<br />
northern parts of Ishasha River or <strong>in</strong> Kamwezi along Chogo and Bugaga streams.<br />
Kabale district has three dra<strong>in</strong>age systems; the L. Victoria, L. Edward/L. George and L.<br />
Bunyonyi. L. Victoria and L. Bunyonyi are the biggest cover<strong>in</strong>g 42.32skm and 39.36skm<br />
respectively. As the name suggests, the L. Bunyonyi dra<strong>in</strong>age system is composed of<br />
wetlands <strong>in</strong> the fjords of the lake, and those along rivers that dra<strong>in</strong> <strong>in</strong>to the lake. Details of<br />
wetland systems, wetland types and areas are shown <strong>in</strong> Table 6<br />
Table 6 Wetland Systems of Kabale district<br />
Dra<strong>in</strong>age System<br />
L.Bunyonyi<br />
Wetland System Area-ha Area-skm Sub-Total<br />
Bugoroba 72.01 0.72<br />
L. Edward<br />
Bulimba bay 9.80 0.10<br />
Bunyonyi marg<strong>in</strong>s 67.75 0.68<br />
Gweru bay 872.82 8.73<br />
Kagoma 220.82 2.21<br />
Kaliba 7.18 0.07<br />
Kamiro 36.33 0.36<br />
Katenga 4.28 0.04<br />
Kigyeyo-Ruhuhuma 2372.99 23.73<br />
Kyabah<strong>in</strong>ga-Kacwekano 38.70 0.39<br />
Kyeni 54.56 0.55<br />
Kyogo 46.64 0.47<br />
Niombe 21.29 0.21<br />
Nyabitabe 16.00 0.16<br />
Sanja 94.72 0.95 39.36<br />
Kanyabaha-Kanyamagogo-Kitaraka-Nomuremu 1132.60 11.33<br />
Muchoya 266.03 2.66<br />
Ntungu 23.78 0.24<br />
Nyakasa 88.66 0.89 15.11<br />
10
Dra<strong>in</strong>age System Wetland System Area-ha Area-skm Sub-Total<br />
L. Victoria<br />
Ikona 23.06 0.23<br />
Kabizi 115.82 1.16<br />
Kachwamba-Kakitumba 117.81 1.18<br />
Kiruruma Norht-Ishasha 1755.47 17.55<br />
Kiruruma South 2219.95 22.20 42.32<br />
Kisoro District<br />
Kisoro district has a total area of 729.7skm. Of these, wetlands cover 25skm or 3.4% of the<br />
district area, open water covers 28skm and dry land is 677skm. Wet grasslands constitute<br />
about 11% of the wetland area, Cyperus species constitute 32% and subsistence farmland<br />
constitutes 57% (see Table 7). 12.1% of the wet areas are seasonally wet and the rest is<br />
permanently wet.<br />
The major part of the wetlands is located <strong>in</strong> the centre of the district, and <strong>in</strong> the south-west<br />
and east of L. Mutanda. Apart from this area, most of the district has sharp V valleys that do<br />
not allow formation of wetlands.<br />
There has been major wetland modification <strong>in</strong> Kisoro district. About 57%, of the wetland area<br />
has been converted <strong>in</strong>to subsistence farmland most of it located on the eastern fr<strong>in</strong>ges of L.<br />
Mutanda.<br />
Table 7 Wetland types of Kisoro district<br />
Class Area-Ha Area-skm Proportion<br />
7p 197.8 1.98 7.9%<br />
7s 76.23 0.76 3.0%<br />
8a 807.87 8.08 32.1%<br />
9p 1204.78 12.05 47.9%<br />
9s 228.26 2.28 9.1%<br />
Total 2514.94 25.15 100.0%<br />
Almost all the wetland systems <strong>in</strong> the district are <strong>in</strong> the L. Edward dra<strong>in</strong>age system. Only a<br />
very small part of Kigyeyo-Ruhuhuma wetland system, which belongs to the L.Bunyonyi,<br />
falls <strong>in</strong> Kisoro. The wetland systems and their areas are shown <strong>in</strong> Table 8<br />
Table 8 Wetland Systems of Kisoro district<br />
Dra<strong>in</strong>age System Wetland System Hectares Skm Sub-Total<br />
Name not available 31.81 0.32<br />
Edward<br />
Chahafi 11.83 0.12<br />
Chosa Bay 147.85 1.48<br />
Gitundwe 783.66 7.84<br />
Kabande 15.52 0.16<br />
Kakangaga 10.44 0.10<br />
Kaku-Nyabikoni 390.72 3.91<br />
Karwa 20.81 0.21<br />
Kiwomba 53.93 0.54<br />
Kyarero 6.12 0.06<br />
L. Chazenji (Kyajenge) 11.83 0.12<br />
11
L.Bunyonyi<br />
Maserere 114.34 1.14<br />
Muchoya 76.23 0.76<br />
Mukirumbi 27.39 0.27<br />
Mulehe 0.72 0.01<br />
Mul<strong>in</strong>di 114.09 1.14<br />
Murugyegye 262.82 2.63<br />
Mutanda 0.99 0.01<br />
Ndibahera-Kabaya 23.25 0.23<br />
Nkanka 18.60 0.19<br />
Nyabiha 23.46 0.23<br />
Nyakisozi 26.76 0.27<br />
Nyarutovu 172.96 1.73<br />
Ruhezam<strong>in</strong>da 168.06 1.68 25.14<br />
Kigyeyo-Ruhuhuma 0.75 0.01 0.01<br />
12
Figure 3 Kisoro District<br />
KINANIRA<br />
D. R. CONGO<br />
N<br />
Rushuru<br />
NYABWISHENYA<br />
BUSANZA<br />
KIRAMBO<br />
Nkanka Nyakisozi<br />
Kabande<br />
RUKUNGIRI DISTRICT<br />
NYARUBUYE<br />
MAZIBA<br />
BUNAGANA<br />
Kaku<br />
Bw<strong>in</strong>di Impenetrable NP<br />
Nyabikoni<br />
NYAKABANDE<br />
Chosa Bay<br />
MUTOLERE<br />
NYAKINAMA<br />
NYAKINAAMA<br />
KISORO T.C.<br />
GASAVE<br />
MURAMBA<br />
NATIONAL WETLANDS CONSERVATION AND<br />
MANAGEMENT PROGRAMME<br />
KISORO DISTRICT WETLANDS<br />
Mgah<strong>in</strong>ga Gorilla NP<br />
Ruhezam<strong>in</strong>da<br />
Nyarutovu<br />
Lake Mutanda<br />
Gitundwe<br />
NYARUSIZA<br />
13<br />
Kakangaga<br />
KIRUNDO BUKIMBIRI<br />
Nyabiha<br />
Kyarero<br />
Lake Mulehe<br />
Mul<strong>in</strong>di<br />
NYUNDO<br />
NYABIHUNIKO<br />
RWANDA<br />
Murugyegye<br />
NYAKABANDE<br />
CHAHI<br />
Scale 1:60,000<br />
KYANIKA<br />
Ruhengeri<br />
Kabaya<br />
ROADS<br />
PERMANENT WETLANDS<br />
OTHE RS<br />
Ndibahera<br />
Chazenji<br />
Karwa<br />
KANABA<br />
Ta rm ac road<br />
Murram road (al l weat her)<br />
Murram road (dry weather)<br />
Mot orable truck<br />
ADMINISTRATIVE BOUNDARIE<br />
International<br />
Dist rict<br />
County<br />
Sub-County<br />
GAZETT ED AREA<br />
Forest Reserve<br />
National Park<br />
RIVE R<br />
Major River<br />
M<strong>in</strong>or River<br />
SEASONAL WETLANDS<br />
Grass land (Natural)<br />
Farmland<br />
Grass land (Natural)<br />
Farmland<br />
Papyrus & other sedges<br />
Open Water<br />
Built-up Area<br />
Maserere<br />
Echuya CFR<br />
Kiwomba<br />
MURORA<br />
Lake Kayumbu<br />
Chahafi<br />
Lake Cyahafi<br />
Mukirumbi<br />
Area distribution pe<br />
Wetland type<br />
(<strong>in</strong> square kilometer<br />
(See legend above)<br />
8.08 (32.13%)<br />
12.05 (47.91%)<br />
KABALE DISTRICT<br />
5 0 5 Kilometers<br />
Muko<br />
Kabale<br />
Muchoya<br />
0.76 (3.02<br />
1.98 (7.87<br />
2.28 (9.0
Ntungamo District<br />
Ntungamo district covers a total area of 1917.7skm. Some records have shown that the total<br />
area was 2,055skm. This could have been due to an error of tak<strong>in</strong>g Buhanama parish of<br />
Mbarara district as part of Ntungamo district. <strong>Wetlands</strong> <strong>in</strong> Ntungamo district cover a total<br />
area of 101skm of which 61.6% are permanently wet and 38.4% are seasonally wet. All <strong>in</strong> all<br />
wetlands constitute 5.3% of the district area. Papyrus and other sedges cover 62skm or 61.6%<br />
of the wetland area as shown <strong>in</strong> Table 9. This is followed by seasonally wet grasslands, which<br />
cover 32skm or 32% of the wetland area.<br />
The counties of Rushenyi and Ruhama are mostly cattle graz<strong>in</strong>g areas as such, most of the<br />
wet grasslands are used for graz<strong>in</strong>g cattle but about 2% could be classified as improved<br />
pasture. In the south of the district, <strong>in</strong> Rufuha and Kachwamba-Kakitumba wetland systems,<br />
some wetlands are covered by swamp forest and others bushes and thickets.<br />
Figure 4 Ntungamo District<br />
Rukungiri<br />
Ka kono<br />
Ka hengye<br />
Ny am ugo ye<br />
BWONGYERA<br />
Scale 1:100,000<br />
0 5 Kilometers<br />
N<br />
L. Ny ak i yanja<br />
NYABIHOKO<br />
L. Nyabihok o<br />
RUGARAMA<br />
Dam<br />
Kasharara Kashewanzi<br />
KIBAT SI<br />
Kyo bugo mbe<br />
Kabale<br />
Rwamunaba<br />
KAJ ARA<br />
KAYONZA<br />
K itagata<br />
Rwamabondo<br />
RUBAARE<br />
IHUNGA<br />
Nyabugongi<br />
Kyangara<br />
Kamira<br />
NTUNGAMO<br />
Ahanko ndo<br />
RUSH ENYI<br />
Kiyanja<br />
Ka shojwa<br />
Rufuha<br />
Ibumba<br />
NATIONAL WETLANDS CONSERVATION AND<br />
MANAGEMENT PROGRAMME<br />
NTUNGAMO DISTRICT WETLANDS<br />
NGO MA<br />
Mbarara<br />
Kak<strong>in</strong>gu<br />
Kak<strong>in</strong>gora<br />
Ntungam o CFR<br />
Kyarub ota<br />
Keitant uregye<br />
Kamikyeno<br />
14<br />
RWEKIN IR O<br />
KIZIN GA<br />
Rutembe<br />
RUHAAMA<br />
Ruterana<br />
NYAKYERA<br />
RUHAAMA<br />
Mati mba<br />
M U N Y E R E<br />
Ka shanda<br />
Kafunjo<br />
Munyere<br />
RUKONI<br />
Kijurira-Nyarubira<br />
Kikagati<br />
Riero<br />
Kabobo Kyamwasha<br />
Kamusenene<br />
Bizi (Nshenyi-Kibutamo)<br />
Ar ea distributi on pe r Wetl and type<br />
(<strong>in</strong> square kilometers)<br />
30.83 (30.51%)<br />
62.24 (61 .59% )<br />
(See leg e n d)<br />
3.46 (3.43%)<br />
1.62 (1. 60%)<br />
1.43 (1. 42 %)<br />
1.47 (1. 45%)<br />
Rwoho CFR<br />
LEGEND<br />
ROADS<br />
Tarmac road<br />
Murram road (all weather)<br />
Murram road (dry weather)<br />
Motorable trac k<br />
ADMINISTRATIVE BO UNDARIES<br />
RIVE R<br />
In te rn at io na l<br />
Di stric t<br />
Co unty<br />
Sub-County<br />
Ma jor Ri ve r<br />
Mi nor R iv er<br />
GAZETTED AREA<br />
Forest Reserve<br />
SEASONAL WETLANDS<br />
Thicket<br />
Swa mp Fo rest<br />
Grass land (Na tural)<br />
Grass land (Pasture)<br />
Fa rml an d<br />
PERMANENT WETLANDS<br />
Papyrus & other sedges<br />
OTHERS<br />
Open Wa ter<br />
Buil t-up Area<br />
Only less than 2% of the wetlands have been converted <strong>in</strong>to subsistence farmland.<br />
Modification of wetlands has been aimed at creat<strong>in</strong>g graz<strong>in</strong>g rather than agricultural land, as<br />
is the case <strong>in</strong> neighbour<strong>in</strong>g Kabale district. Nyabugongyi-Kamira and Rufuha wetland<br />
systems constitute half of the Ntungamo wetlands.<br />
The southern parts of the district are pla<strong>in</strong>s with wide depressions and this is one of the<br />
reasons for the existence of wide wetlands <strong>in</strong> that area. The slow rate of flow due to low
gradients promote water abundance. This <strong>in</strong> turn discourages reclaim<strong>in</strong>g of permanently wet<br />
wetlands. As a matter of fact, about 62% of the wetlands are permanent and not converted to<br />
other uses.<br />
Table 9 Wetland types of Ntungamo district<br />
Class Area-ha Area-km Proportion<br />
5s 346.11 3.46 3.4%<br />
6s 162.12 1.62 1.6%<br />
7s 3083.35 30.83 30.5%<br />
7sI 146.53 1.47 1.5%<br />
8a 6223.87 62.24 61.6%<br />
9s 143.35 1.43 1.4%<br />
Total 10105.33 101.05 100.0%<br />
The district has two dra<strong>in</strong>age systems; the L. Victoria and L. Edward. There is a reversal<br />
dra<strong>in</strong>age phenomenon <strong>in</strong> the north-east of the district. Kakono-Kahengye wetland system<br />
belongs to L. Edward dra<strong>in</strong>age system and flows to the west, while Nyabugongyi-Kamira to<br />
which it is connected belongs to the L. Victoria and flows to the west. Areas of the various<br />
systems are shown <strong>in</strong> Table 10.<br />
Table 10 Wetland Systems of Ntungamo district<br />
Dra<strong>in</strong>age System Wetland System Hectares Skm Sub-total<br />
L. Edward<br />
Kakono-Kahengye 569.77 5.70<br />
Kashewanzi-Kasharara 540.10 5.40<br />
Kyengu 32.76 0.33<br />
Rwamabondo 278.32 2.78 14.21<br />
L. Victoria<br />
Charubuta-Kashojwa 93.47 0.93<br />
Chigaaga(Kigaaga) 302.30 3.02<br />
Kacwamba-Kakitumba 213.38 2.13<br />
Kakura-Evisivikatura 32.34 0.32<br />
Kiyanja 29.33 0.29<br />
Kyamwasha-Kabobo-Riero-Bizi 751.39 7.51<br />
Kyangara-Kamira 205.64 2.06<br />
Lutembe-Kasanda-Kafunzho-Dwimaguru (Rwamwire) 215.96 2.16<br />
Matimba-Kasanda 85.73 0.86<br />
Munyere 1064.00 10.64<br />
Nseko-Nyakacwamba-Kyobugombe 53.93 0.54<br />
Nyabugongi-Kamira 1062.16 10.62<br />
Omianza-Kibona 81.43 0.81<br />
Rufuha 3344.21 33.44<br />
Rwamunaba 65.05 0.65<br />
Rwentango-Ibumba 588.29 5.88<br />
Rwentobo-Kak<strong>in</strong>gora-Ahankondo 495.76 4.96 86.84<br />
Rukungiri District<br />
Rukungiri district covers a total area or 2,858.9skm. <strong>Wetlands</strong> cover an area of 154skm or 5.4<br />
of the district area. The wetlands are under various cover or use. Of the wetland area, swamp<br />
forests cover 46.8skm or 30.4 percent (see Table 11), grasslands cover 24skm or 15.5%, bush<br />
and thickets cover 4.4skm about or 3% while open water covers 136.9skm. 76% of the<br />
wetlands are seasonal while 24% are permanently wet.<br />
15
More than three quarters of the wetlands have been converted <strong>in</strong>to subsistence agriculture.<br />
This land use covers 62.4skm or 40.5% of the wetland area. On the other hand less than 1% of<br />
the wetlands have been modified for graz<strong>in</strong>g. About one tenth (16.5skm) of the wetlands still<br />
survive as papyrus and other sedges.<br />
It should be noted that the northern part of the district is with<strong>in</strong> Queen Elizabeth National<br />
Park. Most of the unmodified wetlands are with<strong>in</strong> or close to the Park.<br />
The southern part of the district characterised by hilly terra<strong>in</strong> of the rift valley ranges. As such<br />
the valleys are narrow and don’t allow formation of wetlands. The biggest proportion of<br />
Rukungiri wetlands is found <strong>in</strong> the northern half of the district. In the north, the valleys are<br />
wide and supplied by rivers flow<strong>in</strong>g down from the south.<br />
Table 11 Wetland types of Rukungiri district<br />
Class Area-Ha Area-Km Proportion<br />
1s 9.15 0.09 0.1%<br />
5s 4679.59 46.8 30.4%<br />
6s 441.91 4.42 2.9%<br />
7p 1890.82 18.91 12.3%<br />
7pI 31.09 0.31 0.2%<br />
7s 420.16 4.2 2.7%<br />
7sI 49.79 0.5 0.3%<br />
8a 1647.12 16.47 10.7%<br />
9p 1<strong>99.</strong>57 2 1.3%<br />
9s 6037.83 60.38 39.2%<br />
Total 15407.03 154.08 100.0%<br />
All the wetlands <strong>in</strong> the district belong to the L. Edward dra<strong>in</strong>age system. The names and areas<br />
of the wetland systems are shown <strong>in</strong> Table 12.<br />
Table 12 Wetland Systems of Rukungiri district<br />
Dra<strong>in</strong>age System<br />
L. Edward<br />
Wetland System Hectares Skm Sub-total<br />
Ishasha 2557.68 25.58<br />
L. Edward marg<strong>in</strong>s 585.90 5.86<br />
Nchwera 647.41 6.47<br />
Ntungu 11616.05 116.16 154.07<br />
16
Figure 5 Rukungiri District<br />
N<br />
KISORO<br />
D.R. CONGO<br />
D. Rep. of Co ngo<br />
I shas ha<br />
I shas ha<br />
KINKIIZI<br />
KAYONZA<br />
Isha sha<br />
Lak e E dwar d Rwe nsha m a<br />
K as <strong>in</strong>g a I<br />
KIHIIH I<br />
Ntung u<br />
KIHIHI<br />
KIRIMA<br />
C hir ur uma<br />
Ntungu<br />
Ib alya<br />
KANUNGU<br />
Ng oto Ka ba s h ak i<br />
Rusha mba<br />
Kakangaga<br />
KASESE<br />
NYAMIRAMA<br />
Mas haku<br />
Nchwera<br />
KAMBUGA<br />
NATIONAL WETLANDS CONSERVATION AND<br />
MANAGEMENT PROGRAMME<br />
RWENSHAMA<br />
BWAMBARA<br />
Rusha y a<br />
Mitano<br />
K a k<strong>in</strong> do II<br />
(Ka ya ga)<br />
BUGANGARI<br />
RUTENGA<br />
Rushay a C FR<br />
RUJUMBURA<br />
Runyamunyu Rugand o<br />
NYAKAGYEME<br />
RUGYEYO<br />
K<strong>in</strong>uk a<br />
RUKUNGIRI DISTRICT WETLANDS<br />
Katung uru<br />
Kab alang a<br />
17<br />
Ka k<strong>in</strong>d o I<br />
(Njoro r o)<br />
Ny ak y er a<br />
RUHINDA<br />
RUHINDA<br />
Ny aruz <strong>in</strong>ga<br />
KAGUNGA<br />
RUKUNGIRI T.C.<br />
Ntarago<br />
Ki hu tu<br />
Kishe nyi<br />
K ate nga Ka tenga<br />
Ka te ng a<br />
Birira<br />
Chyogo<br />
BUYANJA<br />
NYAKISHENYI<br />
Bikongozo<br />
Mit oma &<br />
B usheny i<br />
KLAIZI<br />
Rusho m a<br />
Ruh<strong>in</strong>do<br />
BUHUNGA<br />
KEB ISONI<br />
KEBISONI<br />
Birira<br />
RUBA BO<br />
R washama ire<br />
K ahengye<br />
NYARUSHANJE<br />
NYARUSHANJE<br />
KABALE<br />
Scale 1:11 0,00 0<br />
10 0 10 Kilometers<br />
LEGEND<br />
GA ZETTED AREA<br />
Forest Reserve<br />
National P ark<br />
Wildlife R eserve<br />
ROAD S<br />
Tarmac road<br />
Murram road (all weather)<br />
Murram road (dry weather)<br />
Motorable track<br />
ADMINI STR ATIVE BOUN DA RI ES<br />
In ternational<br />
District<br />
County<br />
Sub-County<br />
RIV ER<br />
Major River<br />
M<strong>in</strong>or R iver<br />
SEASONAL WETLANDS<br />
Thicket<br />
Swamp Forest<br />
Grassland (Natural)<br />
Grassland (Pasture)<br />
Farmland<br />
PERMANENT WET LANDS<br />
Grassland (Natural)<br />
Grassland (Pasture)<br />
Farmland<br />
Papyrus & other sedges<br />
OTH ER S<br />
Open Water<br />
Built-up Area<br />
Area distribution per Wetland type<br />
(<strong>in</strong> square kilometers)<br />
Ot he r<br />
1 0. 6 2 (6. 9 7%)<br />
18.91 (1 2.42% )<br />
16 .47 (1 0.81 % )<br />
46.80 ( 30.73%)<br />
59.49 ( 39.07%)<br />
(See legend)<br />
NB: O ther <strong>in</strong>cludes<br />
-Thickets (Seasonal) : 4.42 sq. km, 2.90%<br />
-Grassland (Pastur e-Permanent) : 0.31 sq. km, 0.20%<br />
-Grassland (Pastur e-Seasonal) : 0.50 sq. km, 0.33%<br />
-Grassland (Natural-Seasonal) : 3.38 sq. km, 2.22%<br />
-Farmland (Permanent) : 2.00 sq. km. 1.32%<br />
NTUN GAMO
Conclusion<br />
The status of wetlands<br />
With exception of a few areas, evidence has shown that there is widespread wetland<br />
modification <strong>in</strong> the south-western region of the country. Of the mapped districts, Kabale has<br />
the highest <strong>in</strong>tensity of wetland modification or reclamation. It has 97skm of wetlands and<br />
71.4skm or 73.6% has been modified. There is hardly a chance that the modified wetlands<br />
will ever revert to their orig<strong>in</strong>al state due many socio-economic reasons. Some of the reasons<br />
that make it hard for people to leave wetlands are lack of alternative land for liv<strong>in</strong>g on and<br />
generat<strong>in</strong>g <strong>in</strong>come, <strong>in</strong>creas<strong>in</strong>g population, and political implications.<br />
The functions of wetlands <strong>in</strong> water control and purification are well known and will not be<br />
repeated here. Suffice it to say that wetlands act as a natural sponge that controls the flow and<br />
quality of water. Unfortunately, this resource is now be<strong>in</strong>g modified. At the same time, steep<br />
slopes are extensively cultivated annually lead<strong>in</strong>g to massive soil erosion. Worse still, contour<br />
bands, which used to control run-off, are cultivated too. This scenario is def<strong>in</strong>itely chang<strong>in</strong>g<br />
the environment towards the wrong end.<br />
It was noted that most of the wetlands <strong>in</strong> Kabale are permanently wet and many of them <strong>in</strong><br />
wide valleys. These factors make wetland conversion quite difficult. Despite this, 73.6% of<br />
the wetlands have been reclaimed and it appears that, left at will, people are ready and capable<br />
of convert<strong>in</strong>g close to 100% of the wetlands. This is an <strong>in</strong>dicator of the serious of the reasons<br />
lead<strong>in</strong>g to wetland reclamation. Any attempts to reverse or even halt wetland conversion<br />
should take this fact <strong>in</strong>to account.<br />
Kisoro follows Kabale district <strong>in</strong> the vigour of wetland reclamation. The district has only<br />
25skm or 3.4% of its area as wetlands. Already, 57% of the wetlands have been modified. The<br />
bulk of the modified wetlands are around L. Mutanda and L. Mulehe. This <strong>in</strong>terrupts the<br />
natural filter that cleans water as it enters these lakes. Kisoro has a similar problem as that of<br />
Kabale. Catchment areas for the water bodies are characterised by steep slopes that are<br />
extensively cultivated every year lead<strong>in</strong>g to soil erosion and silt<strong>in</strong>g. The whole scenario is<br />
conducive to eutrophication of the lakes.<br />
In Rukungiri district, of the 63skm of wetlands, 41% has been modified. Almost all the<br />
modified wetlands have been devoted to subsistence agriculture. Most of the wetlands <strong>in</strong><br />
central and south of the district have been modified. the un-modified wetlands are situated <strong>in</strong><br />
or near the National Park.<br />
Of the five districts mapped, Rukungiri is the only one that boasts of a high percentage of<br />
swamp forest. However, these are located <strong>in</strong> or near Queen Elizabeth National Park.<br />
The study has shown that Ntungamo district has much of its wetlands undisturbed. There are<br />
several small pockets where wetlands have been converted for agriculture but these are<br />
sometimes too small to map on the 1:50,000 scale. Of the 101skm of wetlands, only 3% have<br />
been visibly modified.<br />
Little activity <strong>in</strong> wetland reclamation <strong>in</strong> Ntungamo could be attributed to the high quantity of<br />
water that exists <strong>in</strong> the major wetlands namely the Rufuha, Nyabugongyi-Kamira and<br />
Munyere wetland systems. The first two wetland systems exist <strong>in</strong> a traditionally cattle graz<strong>in</strong>g<br />
areas. Reclaim<strong>in</strong>g wetlands for pasture does not seem economically attractive when dry land<br />
is not yet <strong>in</strong> acute shortage.<br />
It should not be taken for granted that the status quo will always reign. Attempts <strong>in</strong><br />
reclamation were observed <strong>in</strong> Rweik<strong>in</strong>iro. There is a possibility that this practice can easily<br />
spread because Ntungamo can be very dry dur<strong>in</strong>g the dry season and wetlands might be the<br />
18
most obvious alternative for dry season agriculture. Many future problems would be avoided<br />
if measures were put <strong>in</strong> place early enough to stop proliferation of wetland reclamation.<br />
Mapp<strong>in</strong>g<br />
Mapp<strong>in</strong>g of the wetlands was done at 1:50,000 scale. This means that features on the ground<br />
that are less than 4 hectares (or 2mm by 2mm on the map) <strong>in</strong> area are very difficult to map.<br />
As a result some important or <strong>in</strong>dicative features may not be mapped. These <strong>in</strong>clude<br />
<strong>in</strong>cidences of <strong>in</strong>itial wetland reclamation where the opened up areas still small and scattered<br />
as <strong>in</strong> Rweik<strong>in</strong>iro, or Eucalyptus woodlots <strong>in</strong> wetlands of Kabale.<br />
In Ntungamo district, especially <strong>in</strong> Rushenyi and Ruhama counties there are vast grasslands<br />
that stretch over both dry ground and valleys. Due to edaphic factors, seasonally wet valleys<br />
normally are entirely covered by grass with no or few bushes. It therefore makes it difficult to<br />
tell whether the seasonally wet grassland <strong>in</strong> the valley is an improved pasture or its part of the<br />
general grass cover. This could have accounted for low improved grassland percentage <strong>in</strong><br />
Ntungamo and hence the low percentage of modified wetlands.<br />
A wetland system can be known by different names by people liv<strong>in</strong>g <strong>in</strong> different areas. It is<br />
not uncommon to f<strong>in</strong>d a wetland called by three or more names by different people. This is<br />
more pronounced when it comes to wetlands which cross district boarders. As a result, most<br />
wetland systems’ names are unique to districts <strong>in</strong>stead of be<strong>in</strong>g common if a wetland system<br />
is astride tow districts. It would have been <strong>in</strong>terest<strong>in</strong>g and useful to have a common name for<br />
each major wetland system.<br />
19
APPENDIX 1<br />
Terms of reference<br />
The NBS was specifically contracted to do the follow<strong>in</strong>g:<br />
• Development of a suitable classification for wetlands <strong>in</strong> collaboration with <strong>Wetlands</strong><br />
Programme. This <strong>in</strong>volves liaison meet<strong>in</strong>g with <strong>Wetlands</strong> Programme staff, field<br />
reconnaissance, f<strong>in</strong>al classification design, and database design.<br />
• Data collection from the field for check<strong>in</strong>g out discrepancies on <strong>in</strong>terpreted satellite data<br />
and to up-date wetland outl<strong>in</strong>e maps <strong>in</strong> the districts of Bushenyi, Kabale, Kisoro,<br />
Ntungamo and Rukungiri.<br />
• Carry out data capture and process<strong>in</strong>g; both descriptive and spatial.<br />
• Produce updated maps for the five districts<br />
Outputs of this contract would be:<br />
• Maps for the five districts<br />
• Descriptive and spatial database<br />
• A report<br />
Table 13 Area of wetlands by district and dra<strong>in</strong>age system<br />
District Dra<strong>in</strong>age System Area_Ha Area_skm<br />
Bushenyi Closed 142.04 1.42<br />
Bushenyi Edward/George 14252.7 142.53<br />
Bushenyi Victoria 10610.66 106.11<br />
Bushenyi Total 250.06<br />
Kabale L.Bunyonyi 3935.88 39.36<br />
Kabale L. Edward 1511.07 15.11<br />
Kabale L. Victoria 4232.11 42.32<br />
Kabale Total 96.79<br />
Kisoro Edward 2514.19 25.14<br />
Kisoro L.Bunyonyi 0.75 0.01<br />
Kisoro Total 25.15<br />
Ntungamo L. Edward 1420.95 14.21<br />
Ntungamo L. Victoria 8684.37 86.84<br />
Ntungamo Total 101.05<br />
Rukungiri L. Edward 15407.04 154.07<br />
Rukungiri Total 154.07<br />
Grand Total 627.12<br />
Table 14 Summary of modified wetlands per district<br />
DISTRICT Class Area-ha Area-skm<br />
Bushenyi 7sI 3574.96 35.75<br />
Bushenyi 9p 2588.27 25.88<br />
Bushenyi 9s 615.83 6.16<br />
Kabale 1p 209.91 2.10<br />
Kabale 1s 53.76 0.54<br />
Kabale 7pI 668.72 6.69<br />
Kabale 7sI 358.63 3.59<br />
20
Kabale 9p 2650.25 26.50<br />
Kabale 9s 3194.50 31.95<br />
Kisoro 9p 1204.78 12.05<br />
Kisoro 9s 228.26 2.28<br />
Ntungamo 7sI 146.53 1.47<br />
Ntungamo 9s 143.35 1.43<br />
Rukungiri 7pI 31.09 0.31<br />
Rukungiri 7sI 49.79 0.50<br />
Rukungiri 9p 1<strong>99.</strong>57 2.00<br />
Rukungiri 9s 6037.83 60.38<br />
Table 15 Modified wetlands per district<br />
District Dra<strong>in</strong>age System Wetland System Class Area-Ha Area-skm<br />
Bushenyi<br />
Edward/George<br />
Victoria<br />
Kandekye-Ruhorobero 7sI 656.62 6.57<br />
Kandekye-Ruhorobero 9p 607.22 6.07<br />
Kandekye-Ruhorobero 9s 168.55 1.69<br />
Kandekye-Ruhorobero Total 14.32<br />
Karujugo 9p 125.46 1.25<br />
Karujugo Total 1.25<br />
Katereza 9p 84.06 0.84<br />
Katereza 9s 34.26 0.34<br />
Katereza Total 1.18<br />
Kifuka-Kibare 9p 80.92 0.81<br />
Kifuka-Kibare Total 0.81<br />
Kyamugambira-Kitimbi-Kyarwigi-Kitagata 9p 450.66 4.51<br />
Kyamugambira-Kitimbi-Kyarwigi-Kitagata<br />
Total<br />
4.51<br />
Nchwera 9p 392.23 3.92<br />
Nchwera 9s 31.32 0.31<br />
Nchwera Total 4.24<br />
Ntungu 9p 230.58 2.31<br />
Ntungu Total 2.31<br />
Nyamahizi-Kateizi-Kasere 9p 44.94 0.45<br />
Nyamahizi-Kateizi-Kasere Total 0.45<br />
Nyamirembe-Katoma-Kabushoro 9p 442.70 4.43<br />
Nyamirembe-Katoma-Kabushoro Total 4.43<br />
Rwabanjeri-Karugorora 9p 67.91 0.68<br />
Rwabanjeri-Karugorora Total 0.68<br />
Warugo 9p 21.78 0.22<br />
Warugo Total 0.22<br />
Kabura 9p 9.98 0.10<br />
Kabura Total 0.10<br />
Kakorogoto 7sI 49.32 0.49<br />
Kakorogoto 9p 5.73 0.06<br />
Kakorogoto Total 0.55<br />
Katara 9s 45.46 0.45<br />
Katara Total 0.45<br />
Koga 7sI 1641.78 16.42<br />
21
District Dra<strong>in</strong>age System Wetland System Class Area-Ha Area-skm<br />
Koga 9p 24.12 0.24<br />
Koga 9s 111.58 1.12<br />
Koga Total 17.77<br />
Mijera-Kishenyi 7sI 1175.73 11.76<br />
Mijera-Kishenyi 9s 24.15 0.24<br />
Mijera-Kishenyi Total 12.00<br />
Nchwezi-Runy<strong>in</strong>ya 7sI 51.50 0.51<br />
Nchwezi-Runy<strong>in</strong>ya Total 0.51<br />
Nyangoma 9s 44.77 0.45<br />
Nyangoma Total 0.45<br />
Rugasha 9s 155.74 1.56<br />
Rugasha Total 1.56<br />
Kabale<br />
L.Bunyonyi<br />
L. Edward<br />
L. Victoria<br />
Bunyonyi marg<strong>in</strong>s 9s 34.83 0.35<br />
Bunyonyi marg<strong>in</strong>s Total 0.35<br />
Gweru bay 1p 8.36 0.08<br />
Gweru bay 7sI 9.21 0.09<br />
Gweru bay 9p 163.30 1.63<br />
Gweru bay 9s 60.03 0.60<br />
Gweru bay Total 2.41<br />
Kagoma 9s 74.32 0.74<br />
Kagoma Total 0.74<br />
Kigyeyo-Ruhuhuma 1p 6.23 0.06<br />
Kigyeyo-Ruhuhuma 9p 178.89 1.79<br />
Kigyeyo-Ruhuhuma 9s 1758.48 17.58<br />
Kigyeyo-Ruhuhuma Total 19.44<br />
Kyabah<strong>in</strong>ga-Kacwekano 9s 38.70 0.39<br />
Kyabah<strong>in</strong>ga-Kacwekano Total 0.39<br />
Kyeni 1p 0.78 0.01<br />
Kyeni 9s 53.78 0.54<br />
Kyeni Total 0.55<br />
Sanja 1p 0.78 0.01<br />
Sanja 7sI 4.82 0.05<br />
Sanja 9s 83.92 0.84<br />
Sanja Total 0.90<br />
Kanyabaha-Kanyamagogo-Kitaraka-Nomuremu 1p 6.37 0.06<br />
Kanyabaha-Kanyamagogo-Kitaraka-Nomuremu 1s 22.93 0.23<br />
Kanyabaha-Kanyamagogo-Kitaraka-Nomuremu 9p 278.32 2.78<br />
Kanyabaha-Kanyamagogo-Kitaraka-Nomuremu 9s 338.04 3.38<br />
Kanyabaha-Kanyamagogo-Kitaraka-<br />
Nomuremu Total<br />
6.46<br />
Ntungu 9s 23.78 0.24<br />
Ntungu Total 0.24<br />
Nyakasa 1p 0.52 0.01<br />
Nyakasa 9s 68.41 0.68<br />
Nyakasa Total 0.69<br />
Ikona 1p 4.67 0.05<br />
Ikona 1s 14.60 0.15<br />
Ikona 9s 3.79 0.04<br />
Ikona Total 0.23<br />
22
District Dra<strong>in</strong>age System Wetland System Class Area-Ha Area-skm<br />
Kabizi 1s 13.06 0.13<br />
Kabizi 9p <strong>99.</strong>34 0.99<br />
Kabizi 9s 3.43 0.03<br />
Kabizi Total 1.16<br />
Kachwamba-Kakitumba 1s 3.17 0.03<br />
Kachwamba-Kakitumba 9s 14.14 0.14<br />
Kachwamba-Kakitumba Total 0.17<br />
Kiruruma Norht-Ishasha 1p 126.31 1.26<br />
Kiruruma Norht-Ishasha 7pI 524.58 5.25<br />
Kiruruma Norht-Ishasha 7sI 110.65 1.11<br />
Kiruruma Norht-Ishasha 9p 392.75 3.93<br />
Kiruruma Norht-Ishasha 9s 508.35 5.08<br />
Kiruruma Norht-Ishasha Total 16.63<br />
Kiruruma South 1p 55.88 0.56<br />
Kiruruma South 7pI 144.14 1.44<br />
Kiruruma South 7sI 233.95 2.34<br />
Kiruruma South 9p 1537.64 15.38<br />
Kiruruma South 9s 130.51 1.31<br />
Kiruruma South Total 21.02<br />
Kisoro<br />
Ntungamo<br />
Edward<br />
L. Edward<br />
L. Victoria<br />
Gitundwe 9p 783.66 7.84<br />
Gitundwe Total 7.84<br />
Kaku-Nyabikoni 9s 201.50 2.02<br />
Kaku-Nyabikoni Total 2.02<br />
Mul<strong>in</strong>di 9p 114.09 1.14<br />
Mul<strong>in</strong>di Total 1.14<br />
Murugyegye 9p 262.82 2.63<br />
Murugyegye Total 2.63<br />
Ndibahera-Kabaya 9p 20.74 0.21<br />
Ndibahera-Kabaya Total 0.21<br />
Nyabiha 9p 23.46 0.23<br />
Nyabiha Total 0.23<br />
Nyakisozi 9s 26.76 0.27<br />
Nyakisozi Total 0.27<br />
Kakono-Kahengye 7sI 95.16 0.95<br />
Kakono-Kahengye Total 0.95<br />
Rwamabondo 7sI 11.66 0.12<br />
Rwamabondo 9s 18.39 0.18<br />
Rwamabondo Total 0.30<br />
Charubuta-Kashojwa 9s 14.87 0.15<br />
Charubuta-Kashojwa Total 0.15<br />
Kyangara-Kamira 7sI 10.15 0.10<br />
Kyangara-Kamira 9s 26.83 0.27<br />
Kyangara-Kamira Total 0.37<br />
Lutembe-Kasanda-Kafunzho-Dwimaguru<br />
(Rwamwire)<br />
9s 24.22 0.24<br />
Lutembe-Kasanda-Kafunzho-Dwimaguru (Rwamwire) Total 0.24<br />
Nyabugongi-Kamira 7sI 28.10 0.28<br />
Nyabugongi-Kamira Total 0.28<br />
23
District Dra<strong>in</strong>age System Wetland System Class Area-Ha Area-skm<br />
Omianza-Kibona 9s 56.59 0.57<br />
Omianza-Kibona Total 0.57<br />
Rwamunaba 9s 2.44 0.02<br />
Rwamunaba Total 0.02<br />
Rwentobo-Kak<strong>in</strong>gora-Ahankondo 7sI 1.47 0.01<br />
Rwentobo-Kak<strong>in</strong>gora-Ahankondo Total 0.01<br />
Rukungiri<br />
L. Edward<br />
Ishasha 9s 1120.66 11.21<br />
Ishasha Total 11.21<br />
Ntungu 1s 9.15 0.09<br />
Ntungu 7pI 31.09 0.31<br />
Ntungu 7sI 49.79 0.50<br />
Ntungu 9p 1<strong>99.</strong>57 2.00<br />
Ntungu 9s 4917.17 49.17<br />
Ntungu Total 52.07<br />
Grand Total 219.65<br />
All <strong>Wetlands</strong><br />
This table shows details of all the wetlands; both modified and natural. The class and type of<br />
the wetland is <strong>in</strong> the class column. The area is shown as hectares and <strong>in</strong> square kilometres.<br />
Wetland systems are organised by district and by the dra<strong>in</strong>age system they belong to.<br />
District Dra<strong>in</strong>age System Wetland System Class Area-Ha Area-skm<br />
Bushenyi<br />
Closed<br />
Bugasa 5s 20.73 0.21<br />
Bugasa Total 0.21<br />
L. Kyamwongo 8a 8.70 0.09<br />
L. Kyamwongo Total 0.09<br />
L. Nyamus<strong>in</strong>gire 8a 11.59 0.12<br />
L. Nyamus<strong>in</strong>gire Total 0.12<br />
Maseche 5s 15.45 0.15<br />
Maseche Total 0.15<br />
Nyabutare 8a 46.55 0.47<br />
Nyabutare Total 0.47<br />
Rugazi-Omukas<strong>in</strong>ga 8a 39.00 0.39<br />
Rugazi-Omukas<strong>in</strong>ga Total 0.39<br />
Edward/George<br />
Buh<strong>in</strong>dagi 5s 327.60 3.28<br />
Buh<strong>in</strong>dagi 8a 373.63 3.74<br />
Buh<strong>in</strong>dagi Total 7.01<br />
Chambura 5s 209.37 2.09<br />
Chambura 8a 303.12 3.03<br />
Chambura Total 5.12<br />
Kafu-Mpanga 5s 264.64 2.65<br />
Kafu-Mpanga 8a 14.10 0.14<br />
Kafu-Mpanga Total 2.79<br />
Kakari-Katerera 5s 317.08 3.17<br />
Kakari-Katerera 8b 4.95 0.05<br />
Kakari-Katerera Total 3.22<br />
Kandekye-Ruhorobero 5s 26.72 0.27<br />
Kandekye-Ruhorobero 7s 4.38 0.04<br />
Kandekye-Ruhorobero 7sI 656.62 6.57<br />
Kandekye-Ruhorobero 8a 1485.79 14.86<br />
Kandekye-Ruhorobero 8p 28.09 0.28<br />
Kandekye-Ruhorobero 9p 607.22 6.07<br />
Kandekye-Ruhorobero 9s 168.55 1.69<br />
Kandekye-Ruhorobero Total 29.77<br />
Kanyara-Nyampimbi 7p 24.63 0.25<br />
Kanyara-Nyampimbi 8a 259.49 2.59<br />
Kanyara-Nyampimbi Total 2.84<br />
Karujugo 7p 29.73 0.30<br />
24
District Dra<strong>in</strong>age System Wetland System Class Area-Ha Area-skm<br />
Karujugo 8a 71.14 0.71<br />
Karujugo 9p 125.46 1.25<br />
Karujugo Total 2.26<br />
Kasharara 8a 450.72 4.51<br />
Kasharara Total 4.51<br />
Katarimwa(Katarimu) 7p 151.65 1.52<br />
Katarimwa(Katarimu) 7s 21.43 0.21<br />
Katarimwa(Katarimu) 8a 126.15 1.26<br />
Katarimwa(Katarimu) Total 2.99<br />
Katereza 8a 146.47 1.46<br />
Katereza 9p 84.06 0.84<br />
Katereza 9s 34.26 0.34<br />
Katereza Total 2.65<br />
Kifuka-Kibare 8a 69.94 0.70<br />
Kifuka-Kibare 9p 80.92 0.81<br />
Kifuka-Kibare Total 1.51<br />
Kitarema 8a 36.36 0.36<br />
Kitarema Total 0.36<br />
Kyamugambira-Kitimbi-Kyarwigi-Kitagata 7p 38.71 0.39<br />
Kyamugambira-Kitimbi-Kyarwigi-Kitagata 7s 16.13 0.16<br />
Kyamugambira-Kitimbi-Kyarwigi-Kitagata 8a 1136.78 11.37<br />
Kyamugambira-Kitimbi-Kyarwigi-Kitagata 9p 450.66 4.51<br />
Kyamugambira-Kitimbi-Kyarwigi-Kitagata Total 16.42<br />
L. Edward Marg<strong>in</strong>s 8a 639.72 6.40<br />
L. Edward Marg<strong>in</strong>s Total 6.40<br />
Mbika 6s 25.38 0.25<br />
Mbika 8a 69.37 0.69<br />
Mbika Total 0.95<br />
Nchwera 8a 161.10 1.61<br />
Nchwera 9p 392.23 3.92<br />
Nchwera 9s 31.32 0.31<br />
Nchwera Total 5.85<br />
Ntungu 9p 230.58 2.31<br />
Ntungu Total 2.31<br />
Nyamahizi-Kateizi-Kasere 8a 495.75 4.96<br />
Nyamahizi-Kateizi-Kasere 9p 44.94 0.45<br />
Nyamahizi-Kateizi-Kasere Total 5.41<br />
Nyamirembe-Katoma-Kabushoro 8a 328.07 3.28<br />
Nyamirembe-Katoma-Kabushoro 9p 442.70 4.43<br />
Nyamirembe-Katoma-Kabushoro Total 7.71<br />
Nyamweru 5s 383.11 3.83<br />
Nyamweru 8a 320.77 3.21<br />
Nyamweru Total 7.04<br />
Nyaruteme 8a 31.04 0.31<br />
Nyaruteme Total 0.31<br />
Nyaruz<strong>in</strong>ga 8a 16.64 0.17<br />
Nyaruz<strong>in</strong>ga Total 0.17<br />
Rushisha 6s 76.49 0.76<br />
Rushisha Total 0.76<br />
Rutanda 5s 1186.19 11.86<br />
Rutanda 7p 120.06 1.20<br />
Rutanda Total 13.06<br />
Rwabanjeri-Karugorora 7p 235.26 2.35<br />
Rwabanjeri-Karugorora 8a 512.52 5.13<br />
Rwabanjeri-Karugorora 9p 67.91 0.68<br />
Rwabanjeri-Karugorora Total 8.16<br />
Tiguhonoka 5s 126.61 1.27<br />
Tiguhonoka 8a 22.27 0.22<br />
Tiguhonoka Total 1.49<br />
Warugo 8a 124.32 1.24<br />
Warugo 9p 21.78 0.22<br />
Warugo Total 1.46<br />
Victoria<br />
Kabiso 8a 22.96 0.23<br />
Kabiso Total 0.23<br />
Kabura 7s 530.71 5.31<br />
Kabura 8a 200.63 2.01<br />
Kabura 9p 9.98 0.10<br />
Kabura Total 7.41<br />
Kakorogoto 7s 688.90 6.89<br />
Kakorogoto 7sI 49.32 0.49<br />
Kakorogoto 8a 231.42 2.31<br />
Kakorogoto 9p 5.73 0.06<br />
Kakorogoto Total 9.75<br />
25
District Dra<strong>in</strong>age System Wetland System Class Area-Ha Area-skm<br />
Kamira 5s 5.61 0.06<br />
Kamira 8a 117.37 1.17<br />
Kamira Total 1.23<br />
Katara 5s 27.85 0.28<br />
Katara 8a 121.19 1.21<br />
Katara 9s 45.46 0.45<br />
Katara Total 1.95<br />
Koga 5s 9.80 0.10<br />
Koga 6s 3.57 0.04<br />
Koga 7s 1291.38 12.91<br />
Koga 7sI 1641.78 16.42<br />
Koga 8a 1217.09 12.17<br />
Koga 9p 24.12 0.24<br />
Koga 9s 111.58 1.12<br />
Koga Total 42.99<br />
Mijera-Kishenyi 7s 1397.71 13.98<br />
Mijera-Kishenyi 7sI 1175.73 11.76<br />
Mijera-Kishenyi 8a 476.89 4.77<br />
Mijera-Kishenyi 9s 24.15 0.24<br />
Mijera-Kishenyi Total 30.74<br />
Nchwezi-Runy<strong>in</strong>ya 7s 286.05 2.86<br />
Nchwezi-Runy<strong>in</strong>ya 7sI 51.50 0.51<br />
Nchwezi-Runy<strong>in</strong>ya Total 3.38<br />
Nyakishana 5s 10.07 0.10<br />
Nyakishana Total 0.10<br />
Nyangoma 5s 18.01 0.18<br />
Nyangoma 6s 66.24 0.66<br />
Nyangoma 8a 173.91 1.74<br />
Nyangoma 9s 44.77 0.45<br />
Nyangoma Total 3.03<br />
Rugasha 7s 263.75 2.64<br />
Rugasha 9s 155.74 1.56<br />
Rugasha Total 4.19<br />
Rwizi 8a 109.69 1.10<br />
Rwizi Total 1.10<br />
Kabale<br />
L.Bunyonyi<br />
Bugoroba 8a 72.01 0.72<br />
Bugoroba Total 0.72<br />
Bulimba bay 8a 9.80 0.10<br />
Bulimba bay Total 0.10<br />
Bunyonyi marg<strong>in</strong>s 8a 32.92 0.33<br />
Bunyonyi marg<strong>in</strong>s 9s 34.83 0.35<br />
Bunyonyi marg<strong>in</strong>s Total 0.68<br />
Gweru bay 1p 8.36 0.08<br />
Gweru bay 7p 513.02 5.13<br />
Gweru bay 7sI 9.21 0.09<br />
Gweru bay 8a 118.89 1.19<br />
Gweru bay 9p 163.30 1.63<br />
Gweru bay 9s 60.03 0.60<br />
Gweru bay Total 8.73<br />
Kagoma 8a 146.50 1.47<br />
Kagoma 9s 74.32 0.74<br />
Kagoma Total 2.21<br />
Kaliba 8a 7.18 0.07<br />
Kaliba Total 0.07<br />
Kamiro 8a 36.33 0.36<br />
Kamiro Total 0.36<br />
Katenga 8a 4.28 0.04<br />
Katenga Total 0.04<br />
Kigyeyo-Ruhuhuma 1p 6.23 0.06<br />
Kigyeyo-Ruhuhuma 7p 40.32 0.40<br />
Kigyeyo-Ruhuhuma 8a 389.07 3.89<br />
Kigyeyo-Ruhuhuma 9p 178.89 1.79<br />
Kigyeyo-Ruhuhuma 9s 1758.48 17.58<br />
Kigyeyo-Ruhuhuma Total 23.73<br />
Kyabah<strong>in</strong>ga-Kacwekano 9s 38.70 0.39<br />
Kyabah<strong>in</strong>ga-Kacwekano Total 0.39<br />
Kyeni 1p 0.78 0.01<br />
Kyeni 9s 53.78 0.54<br />
Kyeni Total 0.55<br />
Kyogo 8a 46.64 0.47<br />
Kyogo Total 0.47<br />
Niombe 8a 21.29 0.21<br />
26
District Dra<strong>in</strong>age System Wetland System Class Area-Ha Area-skm<br />
Niombe Total 0.21<br />
Nyabitabe 8a 16.00 0.16<br />
Nyabitabe Total 0.16<br />
Sanja 1p 0.78 0.01<br />
Sanja 7s 5.20 0.05<br />
Sanja 7sI 4.82 0.05<br />
Sanja 9s 83.92 0.84<br />
L. Edward<br />
Sanja Total 0.95<br />
Kanyabaha-Kanyamagogo-Kitaraka-Nomuremu 1p 6.37 0.06<br />
Kanyabaha-Kanyamagogo-Kitaraka-Nomuremu 1s 22.93 0.23<br />
Kanyabaha-Kanyamagogo-Kitaraka-Nomuremu 7s 15.75 0.16<br />
Kanyabaha-Kanyamagogo-Kitaraka-Nomuremu 8a 471.19 4.71<br />
Kanyabaha-Kanyamagogo-Kitaraka-Nomuremu 9p 278.32 2.78<br />
Kanyabaha-Kanyamagogo-Kitaraka-Nomuremu 9s 338.04 3.38<br />
Kanyabaha-Kanyamagogo-Kitaraka-Nomuremu<br />
11.33<br />
Kisoro<br />
L. Victoria<br />
Edward<br />
Total<br />
Muchoya 7s 266.03 2.66<br />
Muchoya Total 2.66<br />
Ntungu 9s 23.78 0.24<br />
Ntungu Total 0.24<br />
Nyakasa 1p 0.52 0.01<br />
Nyakasa 8a 19.73 0.20<br />
Nyakasa 9s 68.41 0.68<br />
Nyakasa Total 0.89<br />
Ikona 1p 4.67 0.05<br />
Ikona 1s 14.60 0.15<br />
Ikona 9s 3.79 0.04<br />
Ikona Total 0.23<br />
Kabizi 1s 13.06 0.13<br />
Kabizi 9p <strong>99.</strong>34 0.99<br />
Kabizi 9s 3.43 0.03<br />
Kabizi Total 1.16<br />
Kachwamba-Kakitumba 1s 3.17 0.03<br />
Kachwamba-Kakitumba 6s 87.60 0.88<br />
Kachwamba-Kakitumba 7p 12.90 0.13<br />
Kachwamba-Kakitumba 9s 14.14 0.14<br />
Kachwamba-Kakitumba Total 1.18<br />
Kiruruma Norht-Ishasha 1p 126.31 1.26<br />
Kiruruma Norht-Ishasha 7pI 524.58 5.25<br />
Kiruruma Norht-Ishasha 7sI 110.65 1.11<br />
Kiruruma Norht-Ishasha 8a 92.82 0.93<br />
Kiruruma Norht-Ishasha 9p 392.75 3.93<br />
Kiruruma Norht-Ishasha 9s 508.35 5.08<br />
Kiruruma Norht-Ishasha Total 17.55<br />
Kiruruma South 1p 55.88 0.56<br />
Kiruruma South 7pI 144.14 1.44<br />
Kiruruma South 7s 80.96 0.81<br />
Kiruruma South 7sI 233.95 2.34<br />
Kiruruma South 8a 36.86 0.37<br />
Kiruruma South 9p 1537.64 15.38<br />
Kiruruma South 9s 130.51 1.31<br />
Kiruruma South Total 22.20<br />
Chahafi 8a 11.83 0.12<br />
Chahafi Total 0.12<br />
Chosa Bay 7p 147.85 1.48<br />
Chosa Bay Total 1.48<br />
Gitundwe 9p 783.66 7.84<br />
Gitundwe Total 7.84<br />
Kabande 8a 15.52 0.16<br />
Kabande Total 0.16<br />
Kakangaga 7p 10.44 0.10<br />
Kakangaga Total 0.10<br />
Kaku-Nyabikoni 8a 189.22 1.89<br />
Kaku-Nyabikoni 9s 201.50 2.02<br />
Kaku-Nyabikoni Total 3.91<br />
Karwa 7p 20.81 0.21<br />
Karwa Total 0.21<br />
Kiwomba 8a 53.93 0.54<br />
Kiwomba Total 0.54<br />
Kyarero 7p 6.12 0.06<br />
27
District Dra<strong>in</strong>age System Wetland System Class Area-Ha Area-skm<br />
Kyarero Total 0.06<br />
L. Chazenji (Kyajenge) 7p 11.83 0.12<br />
L. Chazenji (Kyajenge) Total 0.12<br />
Maserere 8a 114.34 1.14<br />
Maserere Total 1.14<br />
Muchoya 7s 76.23 0.76<br />
Muchoya Total 0.76<br />
Mukirumbi 8a 27.39 0.27<br />
Mukirumbi Total 0.27<br />
Mulehe 8a 0.72 0.01<br />
Mulehe Total 0.01<br />
Mul<strong>in</strong>di 9p 114.09 1.14<br />
Mul<strong>in</strong>di Total 1.14<br />
Murugyegye 9p 262.82 2.63<br />
Murugyegye Total 2.63<br />
Mutanda 8a 0.99 0.01<br />
Mutanda Total 0.01<br />
Name not available 8a 31.81 0.32<br />
Name not available Total 0.32<br />
Ndibahera-Kabaya 8a 2.50 0.03<br />
Ndibahera-Kabaya 9p 20.74 0.21<br />
Ndibahera-Kabaya Total 0.23<br />
Nkanka 8a 18.60 0.19<br />
Nkanka Total 0.19<br />
Nyabiha 9p 23.46 0.23<br />
Nyabiha Total 0.23<br />
Nyakisozi 9s 26.76 0.27<br />
Nyakisozi Total 0.27<br />
Nyarutovu 8a 172.96 1.73<br />
Nyarutovu Total 1.73<br />
Ruhezam<strong>in</strong>da 8a 168.06 1.68<br />
Ruhezam<strong>in</strong>da Total 1.68<br />
L.Bunyonyi<br />
Kigyeyo-Ruhuhuma 7p 0.75 0.01<br />
Kigyeyo-Ruhuhuma Total 0.01<br />
Ntungamo<br />
L. Edward<br />
Kakono-Kahengye 7s 33.36 0.33<br />
Kakono-Kahengye 7sI 95.16 0.95<br />
Kakono-Kahengye 8a 441.25 4.41<br />
Kakono-Kahengye Total 5.70<br />
Kashewanzi-Kasharara 8a 540.10 5.40<br />
Kashewanzi-Kasharara Total 5.40<br />
Kyengu 8a 32.76 0.33<br />
Kyengu Total 0.33<br />
Rwamabondo 7sI 11.66 0.12<br />
Rwamabondo 8a 248.28 2.48<br />
Rwamabondo 9s 18.39 0.18<br />
Rwamabondo Total 2.78<br />
L. Victoria<br />
Charubuta-Kashojwa 7s 40.78 0.41<br />
Charubuta-Kashojwa 8a 37.82 0.38<br />
Charubuta-Kashojwa 9s 14.87 0.15<br />
Charubuta-Kashojwa Total 0.93<br />
Chigaaga(Kigaaga) 7s 302.30 3.02<br />
Chigaaga(Kigaaga) Total 3.02<br />
Kacwamba-Kakitumba 5s 180.85 1.81<br />
Kacwamba-Kakitumba 6s 32.52 0.33<br />
Kacwamba-Kakitumba Total 2.13<br />
Kakura-Evisivikatura 5s 20.59 0.21<br />
Kakura-Evisivikatura 6s 11.75 0.12<br />
Kakura-Evisivikatura Total 0.32<br />
Kiyanja 8a 29.33 0.29<br />
Kiyanja Total 0.29<br />
Kyamwasha-Kabobo-Riero-Bizi 6s 23.49 0.23<br />
Kyamwasha-Kabobo-Riero-Bizi 8a 727.90 7.28<br />
Kyamwasha-Kabobo-Riero-Bizi Total 7.51<br />
Kyangara-Kamira 7s 7.51 0.08<br />
Kyangara-Kamira 7sI 10.15 0.10<br />
Kyangara-Kamira 8a 161.14 1.61<br />
Kyangara-Kamira 9s 26.83 0.27<br />
Kyangara-Kamira Total 2.06<br />
Lutembe-Kasanda-Kafunzho-Dwimaguru (Rwamwire) 8a 191.74 1.92<br />
Lutembe-Kasanda-Kafunzho-Dwimaguru (Rwamwire) 9s 24.22 0.24<br />
28
District Dra<strong>in</strong>age System Wetland System Class Area-Ha Area-skm<br />
Lutembe-Kasanda-Kafunzho-Dwimaguru<br />
(Rwamwire) Total<br />
2.16<br />
Matimba-Kasanda 8a 85.73 0.86<br />
Matimba-Kasanda Total 0.86<br />
Munyere 8a 1064.00 10.64<br />
Munyere Total 10.64<br />
Nseko-Nyakacwamba-Kyobugombe 8a 53.93 0.54<br />
Nseko-Nyakacwamba-Kyobugombe Total 0.54<br />
Nyabugongi-Kamira 7sI 28.10 0.28<br />
Nyabugongi-Kamira 8a 1034.07 10.34<br />
Nyabugongi-Kamira Total 10.62<br />
Omianza-Kibona 8a 24.84 0.25<br />
Omianza-Kibona 9s 56.59 0.57<br />
Omianza-Kibona Total 0.81<br />
Rufuha 5s 144.67 1.45<br />
Rufuha 7s 2226.68 22.27<br />
Rufuha 8a 972.86 9.73<br />
Rufuha Total 33.44<br />
Rwamunaba 8a 62.60 0.63<br />
Rwamunaba 9s 2.44 0.02<br />
Rwamunaba Total 0.65<br />
Rwentango-Ibumba 6s 72.67 0.73<br />
Rwentango-Ibumba 7s 472.70 4.73<br />
Rwentango-Ibumba 8a 42.92 0.43<br />
Rwentango-Ibumba Total 5.88<br />
Rwentobo-Kak<strong>in</strong>gora-Ahankondo 6s 21.70 0.22<br />
Rwentobo-Kak<strong>in</strong>gora-Ahankondo 7sI 1.47 0.01<br />
Rwentobo-Kak<strong>in</strong>gora-Ahankondo 8a 472.60 4.73<br />
Rukungiri<br />
L. Edward<br />
Rwentobo-Kak<strong>in</strong>gora-Ahankondo Total 4.96<br />
Ishasha 5s 537.75 5.38<br />
Ishasha 6s 128.86 1.29<br />
Ishasha 7p 91.69 0.92<br />
Ishasha 8a 678.71 6.79<br />
Ishasha 9s 1120.66 11.21<br />
Ishasha Total 25.58<br />
L. Edward marg<strong>in</strong>s 7s 180.25 1.80<br />
L. Edward marg<strong>in</strong>s 8a 405.66 4.06<br />
L. Edward marg<strong>in</strong>s Total 5.86<br />
Nchwera 5s 126.42 1.26<br />
Nchwera 6s 313.05 3.13<br />
Nchwera 7p 143.43 1.43<br />
Nchwera 7s 64.51 0.65<br />
Nchwera Total 6.47<br />
Ntungu 1s 9.15 0.09<br />
Ntungu 5s 4015.42 40.15<br />
Ntungu 7p 1655.70 16.56<br />
Ntungu 7pI 31.09 0.31<br />
Ntungu 7s 175.41 1.75<br />
Ntungu 7sI 49.79 0.50<br />
Ntungu 8a 562.75 5.63<br />
Ntungu 9p 1<strong>99.</strong>57 2.00<br />
Ntungu 9s 4917.17 49.17<br />
Ntungu Total 116.16<br />
Grand Total 627.12<br />
29