Predicting the water-use of Eucalyptus nitens plantations in ...
Predicting the water-use of Eucalyptus nitens plantations in ...
Predicting the water-use of Eucalyptus nitens plantations in ...

You also want an ePaper? Increase the reach of your titles
YUMPU automatically turns print PDFs into web optimized ePapers that Google loves.
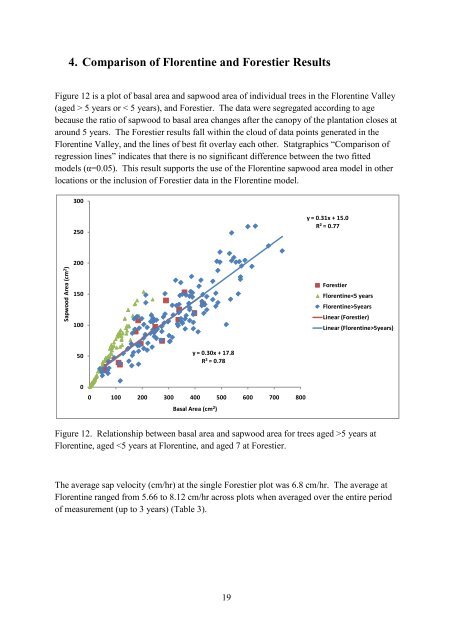
4. Comparison <strong>of</strong> Florent<strong>in</strong>e and Forestier Results<br />
Figure 12 is a plot <strong>of</strong> basal area and sapwood area <strong>of</strong> <strong>in</strong>dividual trees <strong>in</strong> <strong>the</strong> Florent<strong>in</strong>e Valley<br />
(aged > 5 years or < 5 years), and Forestier. The data were segregated accord<strong>in</strong>g to age<br />
beca<strong>use</strong> <strong>the</strong> ratio <strong>of</strong> sapwood to basal area changes after <strong>the</strong> canopy <strong>of</strong> <strong>the</strong> plantation closes at<br />
around 5 years. The Forestier results fall with<strong>in</strong> <strong>the</strong> cloud <strong>of</strong> data po<strong>in</strong>ts generated <strong>in</strong> <strong>the</strong><br />
Florent<strong>in</strong>e Valley, and <strong>the</strong> l<strong>in</strong>es <strong>of</strong> best fit overlay each o<strong>the</strong>r. Statgraphics “Comparison <strong>of</strong><br />
regression l<strong>in</strong>es” <strong>in</strong>dicates that <strong>the</strong>re is no significant difference between <strong>the</strong> two fitted<br />
models (α=0.05). This result supports <strong>the</strong> <strong>use</strong> <strong>of</strong> <strong>the</strong> Florent<strong>in</strong>e sapwood area model <strong>in</strong> o<strong>the</strong>r<br />
locations or <strong>the</strong> <strong>in</strong>clusion <strong>of</strong> Forestier data <strong>in</strong> <strong>the</strong> Florent<strong>in</strong>e model.<br />
Sapwood Area (cm 2 )<br />
300<br />
250<br />
200<br />
150<br />
100<br />
50<br />
0<br />
y = 0.30x + 17.8<br />
R² = 0.78<br />
0 100 200 300 400 500 600 700 800<br />
Basal Area (cm 2 )<br />
Figure 12. Relationship between basal area and sapwood area for trees aged >5 years at<br />
Florent<strong>in</strong>e, aged 5years)