Estimation of the total fertility rates and proximate determinants of ...
Estimation of the total fertility rates and proximate determinants of ...
Estimation of the total fertility rates and proximate determinants of ...

Create successful ePaper yourself
Turn your PDF publications into a flip-book with our unique Google optimized e-Paper software.
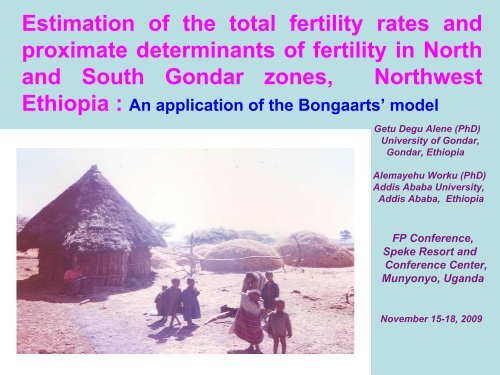
<strong>Estimation</strong> <strong>of</strong> <strong>the</strong> <strong>total</strong> <strong>fertility</strong> <strong>rates</strong> <strong>and</strong><br />
<strong>proximate</strong> <strong>determinants</strong> <strong>of</strong> <strong>fertility</strong> in North<br />
<strong>and</strong> South Gondar zones, Northwest<br />
Ethiopia : An application <strong>of</strong> <strong>the</strong> Bongaarts’ model<br />
Getu Degu Alene (PhD)<br />
University <strong>of</strong> Gondar,<br />
Gondar, Ethiopia<br />
Alemayehu Worku (PhD)<br />
Addis Ababa University,<br />
Addis Ababa, Ethiopia<br />
FP Conference,<br />
Speke Resort <strong>and</strong><br />
Conference Center,<br />
Munyonyo, Ug<strong>and</strong>a<br />
November 15-18, 2009
♣<br />
♣<br />
♣<br />
♣<br />
♣<br />
Introduction: Global situation<br />
Fertility refers to <strong>the</strong> actual number <strong>of</strong> births in a population. It<br />
is one <strong>of</strong> <strong>the</strong> three principal components (births, deaths <strong>and</strong><br />
migration) <strong>of</strong> population dynamics that determine <strong>the</strong> size <strong>and</strong><br />
structure <strong>of</strong> <strong>the</strong> population <strong>of</strong> a country.<br />
Among <strong>the</strong> various measures <strong>of</strong> <strong>fertility</strong>, <strong>the</strong> <strong>total</strong> <strong>fertility</strong> rate<br />
(TFR), is a common measure <strong>of</strong> <strong>fertility</strong> <strong>and</strong> is defined as <strong>the</strong><br />
<strong>total</strong> number <strong>of</strong> births a woman would have by <strong>the</strong> end <strong>of</strong><br />
her childbearing period if she were to pass through those<br />
years bearing children at <strong>the</strong> currently observed age<br />
specific <strong>fertility</strong> <strong>rates</strong>.<br />
Each year, about 80 million new people join <strong>the</strong> human<br />
race. This is roughly equivalent to adding <strong>the</strong> size <strong>of</strong> <strong>the</strong><br />
Ethiopian population to <strong>the</strong> world annually.<br />
A rate <strong>of</strong> growth that will swell human numbers from<br />
today's (mid-2009) 6.8 billion to about 8.1 billion by 2025<br />
<strong>and</strong> to 9.4 billion by 2050.<br />
Developing countries will account for about 90% <strong>of</strong> <strong>the</strong><br />
increase in world population projected by 2050, while <strong>the</strong><br />
populations <strong>of</strong> most developed countries will decrease.<br />
2
♣<br />
♣<br />
♣<br />
♣<br />
♣<br />
Introduction: The Ethiopian situation<br />
It ranks 2nd only to Nigeria with a projected population <strong>of</strong> 82.5 million in<br />
mid-2009 (PRB, 2009). The same source indicates that <strong>the</strong> TFR <strong>of</strong><br />
Ethiopia is 5.3 with a 2.7% rate <strong>of</strong> natural increase.<br />
Nearly two million people are added to <strong>the</strong> country's population<br />
each year.<br />
The population <strong>of</strong> Ethiopia in 1900<br />
It took 60 years<br />
After 28 years<br />
for this figure to double to 23.6<br />
was estimated at 11.8 million.<br />
million in 1960.<br />
(i.e., in 1988), <strong>the</strong> population doubled to 47.3<br />
♣ In about 10 years, <strong>the</strong> country will hit <strong>the</strong> 100-million mark.<br />
million.<br />
3
♣<br />
♣<br />
♣<br />
Introduction: The<br />
Ethiopian situation<br />
Proportion <strong>of</strong> persons
•<br />
•<br />
•<br />
•<br />
•<br />
•<br />
•<br />
Introduction: Amhara region / North<br />
<strong>and</strong> south Gondar zones<br />
The Amhara region had a population estimated at 20 million in mid-2008. The<br />
population increases on <strong>the</strong> average by 500,000 every year.<br />
About 85% <strong>of</strong> <strong>the</strong> population lives in rural areas.<br />
The infant <strong>and</strong> under5 mortality <strong>rates</strong> are estimated to be 94 <strong>and</strong> 154 per 1000<br />
live births, respectively (EDHS, 2005).<br />
The <strong>total</strong> <strong>fertility</strong> rate <strong>of</strong> this region was estimated at 5.1 children per woman<br />
(EDHS 2005).<br />
The population <strong>of</strong> North <strong>and</strong> South Gondar Zones (5.6 million) where <strong>the</strong> present<br />
study was conducted is about 28% <strong>of</strong> <strong>the</strong> population <strong>of</strong> <strong>the</strong> Amhara region <strong>and</strong><br />
account about 40% <strong>of</strong> <strong>the</strong> area <strong>of</strong> <strong>the</strong> region.<br />
The population <strong>of</strong> <strong>the</strong>se zones has increased by about 45% in <strong>the</strong> last<br />
fourteen years (from 1994 to 2008).<br />
Many studies including that <strong>of</strong> <strong>the</strong> world bank strongly argue that rapid<br />
population growth acts as a brake on development among poor<br />
developing countries<br />
5
Map <strong>of</strong> Africa highlighting Ethiopia<br />
Map <strong>of</strong> Ethiopia highlighting <strong>the</strong> Amhara region.<br />
Map <strong>of</strong> Amhara region highlighting <strong>the</strong><br />
two Gondar zones<br />
6
♣<br />
♣<br />
♣<br />
♣<br />
♣<br />
Methods<br />
A cross-sectional study (undertaken in North <strong>and</strong> South Gondar zones<br />
from mid October to mid December, 2007 )<br />
A multi-stage cluster sampling technique was applied to select <strong>the</strong><br />
required study units from <strong>the</strong> urban <strong>and</strong> rural areas <strong>of</strong> <strong>the</strong> study<br />
zones.<br />
From <strong>the</strong> twenty rural Woredas (districts) <strong>of</strong> North Gondar, five<br />
Woredas were selected by simple r<strong>and</strong>om sampling technique.<br />
Toge<strong>the</strong>r with <strong>the</strong> town <strong>of</strong> Gondar, a <strong>total</strong> <strong>of</strong> six Woredas were<br />
considered in North Gondar.<br />
Similarly, from <strong>the</strong> ten rural Woredas <strong>of</strong> South Gondar, three Woredas<br />
were selected by simple r<strong>and</strong>om sampling technique. Toge<strong>the</strong>r with<br />
<strong>the</strong> town <strong>of</strong> Debre Tabour, a <strong>total</strong> <strong>of</strong> four Woredas were considered in<br />
South Gondar.<br />
Consequently, a <strong>total</strong> <strong>of</strong> eight rural Woredas <strong>and</strong> two big urban centers<br />
(having <strong>the</strong> status <strong>of</strong> Woreda administration) were included in <strong>the</strong><br />
present study.<br />
7
♣<br />
♣<br />
♣<br />
Methods<br />
A <strong>total</strong> <strong>of</strong> 3547 women aged 15 to 49 years residing in both<br />
urban <strong>and</strong> rural areas <strong>of</strong> <strong>the</strong> r<strong>and</strong>omly selected clusters <strong>and</strong><br />
kebeles were registered <strong>and</strong> data were collected from 3512 <strong>of</strong><br />
<strong>the</strong>m.<br />
Data collection was carried out by twenty health<br />
pr<strong>of</strong>essionals who were given a three-day intensive training<br />
with practical exercises. Five health <strong>of</strong>ficers/sanitarians were<br />
assigned to supervise <strong>the</strong> data collection process.<br />
Data entry into <strong>the</strong> computer was carried out using <strong>the</strong><br />
Statistical Package for Social Sciences (SPSS) for Windows<br />
version 15. The Bongaarts’ model was applied to analyze <strong>the</strong><br />
given data <strong>and</strong> to estimate <strong>the</strong> required <strong>fertility</strong> <strong>rates</strong> <strong>and</strong><br />
8<br />
<strong>proximate</strong> <strong>determinants</strong> <strong>of</strong> <strong>fertility</strong>.
•<br />
Methods:<br />
According to <strong>the</strong> Bongaarts’ model, <strong>fertility</strong> differences<br />
among populations <strong>and</strong> trends in <strong>fertility</strong> over time can<br />
always be traced to variations in four <strong>of</strong> <strong>the</strong> intermediate<br />
<strong>fertility</strong> variables.<br />
TFR = TF x Cm x Cc x Ca x Ci Indirect<br />
<strong>determinants</strong><br />
(Socio-economic,<br />
cultural, environmental<br />
variables – education,<br />
health, etc.)<br />
Direct<br />
<strong>determinants</strong><br />
(e.g.,<br />
contraception, age<br />
at first marriage)<br />
Fertility<br />
Schematic presentation showing <strong>the</strong> <strong>determinants</strong> <strong>of</strong> <strong>fertility</strong><br />
9
Results <strong>and</strong> Discussion<br />
Table 1: Socio-demographic characteristics <strong>of</strong> <strong>the</strong> study subjects distributed by type <strong>of</strong> living place (big<br />
towns/small towns/rural villages), North <strong>and</strong> South Gondar zones, Northwest Ethiopia, 2007<br />
Characteristics<br />
15 – 19<br />
20 – 24<br />
Age 25 – 29<br />
(years) 30 – 34<br />
35 – 39<br />
40 – 44<br />
45 – 49<br />
Educational status<br />
No education<br />
Primary<br />
Secondary <strong>and</strong> above<br />
Marital status<br />
Never married<br />
Married<br />
Divorced<br />
Widowed<br />
Separated<br />
Religion<br />
Orthodox Christian<br />
Muslim<br />
Protestant<br />
Big towns<br />
(n=756)<br />
Small towns<br />
(n=479)<br />
Rural areas<br />
(2277)<br />
Total<br />
(n=3512)<br />
Freq. % Freq. % Freq. % Freq. %<br />
115<br />
168<br />
189<br />
99<br />
95<br />
51<br />
39<br />
259<br />
207<br />
290<br />
136<br />
461<br />
108<br />
41<br />
10<br />
677<br />
72<br />
4<br />
15.2<br />
22.2<br />
25.0<br />
13.1<br />
12.6<br />
6.7<br />
5.2<br />
34.3<br />
27.4<br />
38.3<br />
18.0<br />
61.0<br />
14.3<br />
5.4<br />
1.3<br />
89.6<br />
9.5<br />
0.5<br />
87<br />
83<br />
94<br />
72<br />
75<br />
41<br />
27<br />
191<br />
145<br />
143<br />
76<br />
310<br />
60<br />
30<br />
3<br />
385<br />
93<br />
1<br />
18.2<br />
17.3<br />
19.6<br />
15.0<br />
15.7<br />
8.6<br />
5.6<br />
39.9<br />
30.3<br />
29.8<br />
15.9<br />
64.7<br />
12.5<br />
6.3<br />
0.6<br />
80.4<br />
19.4<br />
0.2<br />
285<br />
350<br />
475<br />
435<br />
381<br />
217<br />
134<br />
1950<br />
279<br />
48<br />
146<br />
1875<br />
162<br />
82<br />
12<br />
2217<br />
57<br />
1<br />
12.5<br />
15.4<br />
20.9<br />
19.1<br />
16.7<br />
9.5<br />
5.9<br />
85.6<br />
12.3<br />
2.1<br />
6.4<br />
82.4<br />
7.1<br />
3.6<br />
0.5<br />
97.4<br />
2.5<br />
0.0<br />
487<br />
601<br />
758<br />
606<br />
551<br />
309<br />
200<br />
2400<br />
631<br />
481<br />
358<br />
2646<br />
330<br />
153<br />
25<br />
3279<br />
222<br />
6<br />
13.9<br />
17.1<br />
21.6<br />
17.2<br />
15.7<br />
8.8<br />
5.7<br />
68.3<br />
18.0<br />
13.7<br />
10.2<br />
75.3<br />
9.4<br />
4.4<br />
0.7<br />
93.4<br />
6.310<br />
0.2
Results <strong>and</strong> Discussion<br />
Table 2: The socio-economic characteristics <strong>of</strong> <strong>the</strong> households from which <strong>the</strong> study subjects had come from<br />
distributed by type <strong>of</strong> living place (big towns/small towns/rural villages), North <strong>and</strong> South Gondar zones,<br />
Northwest Ethiopia, 2007<br />
Big towns Small towns Rural areas<br />
Total<br />
Characteristics<br />
(n=659)<br />
(n=422)<br />
(2097)<br />
(n=3178)<br />
Monthly expenditure <strong>of</strong> <strong>the</strong> HH<br />
≤ 320<br />
321-500<br />
501- 999<br />
≥1000<br />
Source <strong>of</strong> drinking water<br />
Pipe<br />
Protected spring/well<br />
Unprotected spring/well<br />
River water<br />
Availability <strong>of</strong> toilet facilities<br />
Yes <strong>and</strong> use it<br />
Yes, but don’t use it<br />
No<br />
Availability <strong>of</strong> radio in <strong>the</strong> HH<br />
Yes, functional<br />
Yes, but non-functional<br />
No<br />
Availability <strong>of</strong> farm l<strong>and</strong><br />
Yes<br />
No<br />
Freq. % Freq. % Freq. % Freq. %<br />
189<br />
209<br />
182<br />
79<br />
609<br />
43<br />
7<br />
0<br />
584<br />
0<br />
75<br />
536<br />
40<br />
83<br />
17<br />
642<br />
28.7<br />
31.7<br />
27.6<br />
12.0<br />
92.4<br />
6.5<br />
1.1<br />
0.0<br />
88.6<br />
0.0<br />
11.4<br />
81.3<br />
6.1<br />
12.6<br />
2.6<br />
97.4<br />
122<br />
156<br />
110<br />
34<br />
394<br />
23<br />
3<br />
2<br />
289<br />
6<br />
127<br />
315<br />
24<br />
83<br />
52<br />
370<br />
28.9<br />
37.0<br />
26.1<br />
8.0<br />
93.4<br />
5.4<br />
0.7<br />
0.5<br />
68.5<br />
1.4<br />
30.1<br />
74.6<br />
5.7<br />
19.7<br />
12.3<br />
87.7<br />
901<br />
663<br />
425<br />
108<br />
527<br />
459<br />
514<br />
597<br />
602<br />
170<br />
1325<br />
543<br />
265<br />
1289<br />
1960<br />
137<br />
43.0<br />
31.6<br />
20.3<br />
5.1<br />
25.1<br />
21.9<br />
24.5<br />
28.5<br />
28.7<br />
8.1<br />
63.2<br />
25.9<br />
12.6<br />
61.5<br />
93.5<br />
6.5<br />
1212<br />
1028<br />
717<br />
221<br />
1530<br />
525<br />
524<br />
599<br />
1475<br />
176<br />
1527<br />
1394<br />
329<br />
1455<br />
2029<br />
1149<br />
38.1<br />
32.3<br />
22.6<br />
7.0<br />
48.1<br />
16.5<br />
16.5<br />
18.9<br />
46.4<br />
5.5<br />
48.1<br />
43.9<br />
10.3<br />
45.8<br />
63.8<br />
36.2<br />
11
►<br />
►<br />
►<br />
►<br />
Results <strong>and</strong> Discussion<br />
The emergence <strong>of</strong> households with no farml<strong>and</strong> in <strong>the</strong> typical rural areas is<br />
indicative <strong>of</strong> <strong>the</strong> seriousness <strong>of</strong> <strong>the</strong> population pressure <strong>and</strong> its adverse effect<br />
on <strong>the</strong> local environment <strong>of</strong> <strong>the</strong> Amhara region in general <strong>and</strong> <strong>the</strong> two Gondar<br />
zones in particular.<br />
The current use <strong>of</strong> family planning methods (27.3% among married women)<br />
<strong>and</strong> <strong>the</strong> intentions to use in <strong>the</strong> future are appreciably higher than <strong>the</strong><br />
findings <strong>of</strong> earlier studies undertaken in <strong>the</strong> Amhara region (2005 EDHS,<br />
Amhara region, CPR =15.7% among married women).<br />
On <strong>the</strong> o<strong>the</strong>r h<strong>and</strong>, an unmet need <strong>of</strong> 38% obtained in <strong>the</strong> present study<br />
toge<strong>the</strong>r with <strong>the</strong> relatively low level <strong>of</strong> contraceptive use is indicative <strong>of</strong> <strong>the</strong><br />
fact that <strong>the</strong> family planning program in <strong>the</strong> two Gondar zones is lagging<br />
behind.<br />
In this regard, in order to achieve significant changes in <strong>the</strong> demographic<br />
transition (such as, replacement level) <strong>the</strong>re appears a need to increase <strong>the</strong><br />
current CPR by nearly 3 times among married women.<br />
12
Results <strong>and</strong> Discussion<br />
Table 3: Indices for <strong>proximate</strong> <strong>determinants</strong> <strong>of</strong> <strong>fertility</strong>, North <strong>and</strong><br />
South Gondar zones, Northwest Ethiopia, 2007<br />
Index/Measure North <strong>and</strong><br />
South<br />
Gondar<br />
zones<br />
C m<br />
C c<br />
C i<br />
Predicted TFR 1<br />
Observed TFR 2<br />
0.83<br />
0.75<br />
0.55<br />
5.24<br />
5.34<br />
Gondar <strong>and</strong><br />
Debre Tabour<br />
towns<br />
0.72<br />
0.53<br />
0.59<br />
3.44<br />
2.93<br />
All<br />
towns<br />
0.75<br />
0.56<br />
0.58<br />
3.73<br />
3.52<br />
1 Predicted by Bongaarts formula<br />
2 Estimated using births in <strong>the</strong> last 3 years preceding <strong>the</strong> survey<br />
Rural<br />
areas<br />
0.88<br />
0.83<br />
0.54<br />
6.03<br />
6.31<br />
13
♣<br />
♣<br />
♣<br />
Results <strong>and</strong> Discussion<br />
The observed <strong>total</strong> <strong>fertility</strong> rate estimated for <strong>the</strong> rural areas<br />
was about twice <strong>of</strong> that <strong>of</strong> <strong>the</strong> big towns (Gondar <strong>and</strong> /Tabour<br />
towns).<br />
The observed <strong>rates</strong> were very close<br />
<strong>the</strong> Bongaarts’ formula.<br />
to <strong>the</strong> ones predicted using<br />
However, <strong>the</strong> predicted <strong>rates</strong> in urban centers were relatively<br />
higher than <strong>the</strong> observed ones indicating <strong>the</strong> absence <strong>of</strong> an<br />
intermediate <strong>fertility</strong> variable (most probably, induced abortion)<br />
♣ Overall, <strong>the</strong> <strong>total</strong> <strong>fertility</strong> <strong>rates</strong> obtained in this study were<br />
relatively higher than <strong>the</strong> ones estimated by <strong>the</strong> 2005 EDHS for<br />
14<br />
<strong>the</strong> Amhara region.
♣<br />
♣<br />
♣<br />
Results <strong>and</strong> discussion<br />
In <strong>the</strong> present study <strong>the</strong> dependency ratio was observed to be 100% <strong>and</strong><br />
<strong>the</strong> illiteracy rate was 68.3%. Early marriage was a typical phenomenon<br />
in <strong>the</strong> study areas (mean age at first marriage – in urban centers, 17<br />
years; rural areas, 14 years)<br />
The immediate effect <strong>of</strong> a successful population program should be to<br />
reduce this dependency ratio. The problem with this kind <strong>of</strong> situation is<br />
reflected both on <strong>the</strong> deterioration <strong>of</strong> quality <strong>of</strong> life <strong>and</strong> constrained capacity<br />
for saving <strong>and</strong> investment at <strong>the</strong> household <strong>and</strong> national levels.<br />
An excellent example, in this regard is, <strong>the</strong> “Asian Miracle”. According to<br />
<strong>the</strong> reports <strong>of</strong> World Bank (April 2008), <strong>the</strong> “Asian miracle” is attributable to a<br />
large extent (40%) to rapid declines in <strong>fertility</strong> <strong>and</strong> dramatic changes in<br />
<strong>the</strong> age structure.<br />
► Melakehiwot M. (Menelikism, 2007) suggests a maximum <strong>of</strong> two children<br />
for Ethiopian couples in <strong>the</strong>ir lifetimes.<br />
15
♣<br />
♣<br />
♣<br />
♣<br />
Recommendations<br />
The promotion <strong>of</strong> breastfeeding should continue by all concerned<br />
bodies.<br />
The implementation <strong>of</strong> <strong>the</strong> family law <strong>of</strong> <strong>the</strong> region which asserts <strong>the</strong><br />
minimum age as 18 years should be ensured particularly in rural areas.<br />
Those parents who break or individuals who break this marriage law should<br />
be fined.<br />
Use <strong>of</strong> contraception among women (particularly, married women) was<br />
encouraging. However, <strong>the</strong> CPR among <strong>the</strong> rural women is still very low.<br />
Therefore, <strong>the</strong> family planning programs <strong>of</strong> <strong>the</strong> two Zones should be<br />
streng<strong>the</strong>ned in such areas where over 85% <strong>of</strong> <strong>the</strong> population lives.<br />
The existing monitoring <strong>and</strong> evaluation systems (if any) aimed at<br />
assessing <strong>the</strong> on-going opulation-related activities need to be<br />
activated <strong>and</strong> streng<strong>the</strong>ned. Particularly, <strong>the</strong> 1993 population policy <strong>of</strong><br />
<strong>the</strong> country needs evaluation.<br />
16
Some facts<br />
“...we have not so much inherited <strong>the</strong> earth from<br />
our gr<strong>and</strong>parents, we have borrowed it from our<br />
gr<strong>and</strong>children....”<br />
(John Guillebaud :Pr<strong>of</strong>essor <strong>of</strong> Family Planning <strong>and</strong> Reproductive Health,<br />
University College, London , 1994)<br />
“The Millennium Development Goals, particularly<br />
<strong>the</strong> eradication <strong>of</strong> extreme poverty <strong>and</strong> hunger,<br />
cannot be achieved if questions <strong>of</strong> population <strong>and</strong><br />
reproductive health are not squarely addressed”<br />
(K<strong>of</strong>i Annan, UN Secretary General, 2001)<br />
17
THANK YOU<br />
18