MANUAL No - Forest and Wood Products Australia
MANUAL No - Forest and Wood Products Australia
MANUAL No - Forest and Wood Products Australia

You also want an ePaper? Increase the reach of your titles
YUMPU automatically turns print PDFs into web optimized ePapers that Google loves.
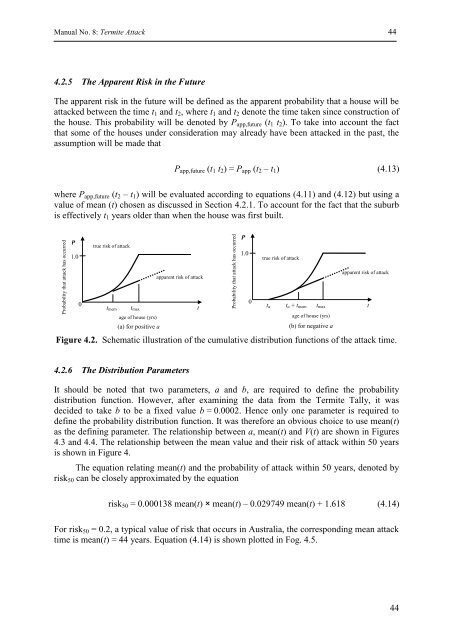
Manual <strong>No</strong>. 8: Termite Attack 44<br />
4.2.5 The Apparent Risk in the Future<br />
The apparent risk in the future will be defined as the apparent probability that a house will be<br />
attacked between the time t1 <strong>and</strong> t2, where t1 <strong>and</strong> t2 denote the time taken since construction of<br />
the house. This probability will be denoted by Papp,future (t1 t2). To take into account the fact<br />
P<br />
that some of the houses under consideration may already true have risk of attack been attacked in the past, the<br />
assumption will be made that<br />
1.0<br />
Papp,future (t1 t2) = Papp (t2 – t1) (4.13)<br />
where Papp,future (t2 – t1) will be evaluated according to equations tmem (4.11) tmax <strong>and</strong> (4.12) but t using a<br />
age of house (yrs)<br />
value of mean (t) chosen as discussed in Section 4.2.1. To account for the fact that the suburb<br />
(a) for positive a<br />
is effectively t1 years older than when the house was first built.<br />
Probability of attack Probability that attack has occurred<br />
P<br />
1.0<br />
P<br />
1.0<br />
0<br />
0<br />
true risk of attack<br />
tmem<br />
tmax<br />
true risk of attack<br />
P(house, attack, true, t)<br />
age of house (yrs)<br />
(a) for positive a<br />
apparent risk of attack<br />
t<br />
P = A + Bt<br />
Probability that attack has occurred<br />
ta ta + tM tmax<br />
define the probability distribution function. t It was therefore an obvious choice to use mean(t)<br />
age of house (yrs)<br />
(ii) for negative a<br />
4.3 <strong>and</strong> 4.4. The relationship between the mean value <strong>and</strong> their risk of attack within 50 years<br />
Probability that attack has occurred<br />
P<br />
1.0<br />
0<br />
0<br />
true risk of attack<br />
ta<br />
ta + tmem<br />
tmax<br />
age of house (yrs)<br />
(b) for negative a<br />
apparent risk of attack<br />
apparent risk of attack<br />
Figure 4.2. Schematic illustration of the cumulative distribution functions of the attack time.<br />
4.2.6 The Distribution Parameters<br />
apparent risk of attack<br />
It should be noted that two parameters, P(house, attack, obsv, a t) <strong>and</strong> b, are required to define the probability<br />
distribution function. However, after examining the data from the Termite Tally, it was<br />
decided to take b to be a fixed value b = 0.0002. Hence only one parameter is required to<br />
as the defining parameter. The relationship between a, mean(t) <strong>and</strong> V(t) are shown in Figures<br />
is shown in Figure 4.<br />
The equation relating mean(t) <strong>and</strong> the probability of attack within 50 years, denoted by<br />
risk50 can be closely approximated by the equation<br />
risk50 = 0.000138 mean(t) × mean(t) – 0.029749 mean(t) + 1.618 (4.14)<br />
For risk50 = 0.2, a typical value of risk that occurs in <strong>Australia</strong>, the corresponding mean attack<br />
time is mean(t) = 44 years. Equation (4.14) is shown plotted in Fog. 4.5.<br />
t<br />
44