MANUAL No - Forest and Wood Products Australia
MANUAL No - Forest and Wood Products Australia
MANUAL No - Forest and Wood Products Australia

Create successful ePaper yourself
Turn your PDF publications into a flip-book with our unique Google optimized e-Paper software.
Manual <strong>No</strong>. 8: Termite Attack 50<br />
data for Zone 2 may be considered to be average <strong>and</strong> the values of the constants A <strong>and</strong> B used<br />
in equations (4.12) are 0.08 <strong>and</strong> 0.004 respectively. This leads to a value of mean(tmodel) =<br />
44.1 years.<br />
A second estimate of a typical mean(tmodel) can be obtained from the Termite Tally<br />
where the data is grouped according to agro-ecological zones. For this case, the data for the<br />
combined Zones 2 <strong>and</strong> 3 may be taken as average. For this case, the values of A <strong>and</strong> B are<br />
found to be 0.04 <strong>and</strong> 0.004 respectively. This leads to a value of mean(tmodel) = 50.2 years.<br />
The data from the Termite Tally also indicates that for the probability distribution<br />
function of attack times, suitable calibration choices are for a parameter b = 0.0002.<br />
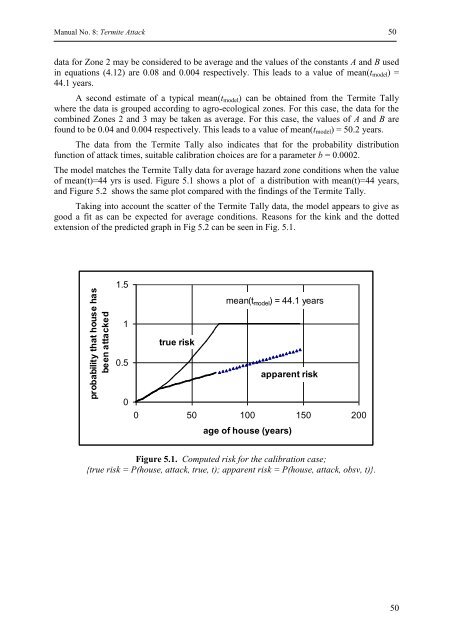
The model matches the Termite Tally data for average hazard zone conditions when the value<br />
of mean(t)=44 yrs is used. Figure 5.1 shows a plot of a distribution with mean(t)=44 years,<br />
<strong>and</strong> Figure 5.2 shows the same plot compared with the findings of the Termite Tally.<br />
Taking into account the scatter of the Termite Tally data, the model appears to give as<br />
good a fit as can be expected for average conditions. Reasons for the kink <strong>and</strong> the dotted<br />
extension of the predicted graph in Fig 5.2 can be seen in Fig. 5.1.<br />
probability that house has<br />
been attacked<br />
1.5<br />
1<br />
0.5<br />
0<br />
true risk<br />
mean(t model) = 44.1 years<br />
apparent risk<br />
0 50 100 150 200<br />
age of house (years)<br />
Figure 5.1. Computed risk for the calibration case;<br />
{true risk = P(house, attack, true, t); apparent risk = P(house, attack, obsv, t)}.<br />
50