Executive summary - BearingPoint
Executive summary - BearingPoint
Executive summary - BearingPoint

Create successful ePaper yourself
Turn your PDF publications into a flip-book with our unique Google optimized e-Paper software.
4 th Supply Chain Monitor<br />
<strong>BearingPoint</strong><br />
Study…methodology<br />
<strong>BearingPoint</strong> has led the Supply Chain Monitor for the fourth consecutive year. Thanks to these initiatives, the<br />
following themes have been approached:<br />
• 2010-2011: Green Supply Chain, from awareness to action;<br />
• 2009: Risks management;<br />
• 2008: Green Supply Chain, companies’ stakes and maturity;<br />
• 2007: Sourcing in Low Cost countries.<br />
There are numerous objectives of the Monitor:<br />
• Make available a long-term reflection plan for Supply Chain;<br />
• Provide the results of a European poll;<br />
• Write a white paper to record the trends, the actions to be pursued and the related analysis;<br />
• Share the results during an event gathering leaders of the field.<br />
To reach these objectives, a three-step approach was introduced for this edition:<br />
1. Conduct a quantitative study among about 600 European decision-makers with a position within Supply Chain,<br />
Sustainable Development or Industrial Divisions (Novamétrie study);<br />
2. Improve the investigation through about forty interviews with managers of big and innovative companies;<br />
3. Bring a complementary perspective integrating feedbacks from our recent missions.<br />
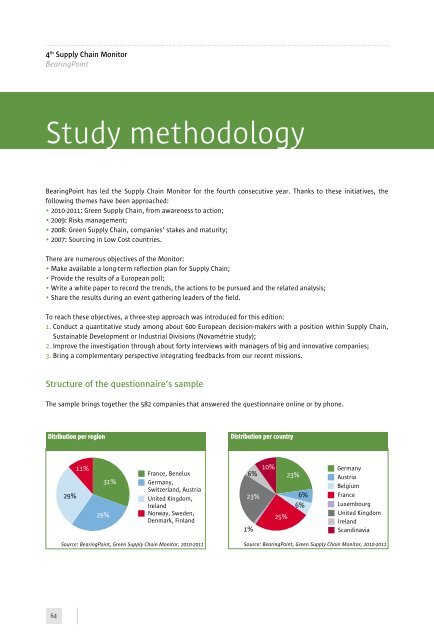
Structure of the questionnaire’s sample<br />
The sample brings together the 582 companies that answered the questionnaire online or by phone.<br />
Ditribution per region<br />
29%<br />
11%<br />
29%<br />
31%<br />
France, Benelux<br />
Germany,<br />
Switzerland, Austria<br />
United Kingdom,<br />
Ireland<br />
Norway, Sweden,<br />
Denmark, Finland<br />
Source: <strong>BearingPoint</strong>, Green Supply Chain Monitor, 2010-2011<br />
Distribution per country<br />
6%<br />
23%<br />
1%<br />
10%<br />
25%<br />
23%<br />
6%<br />
6%<br />
Germany<br />
Austria<br />
Belgium<br />
France<br />
Luxembourg<br />
United Kingdom<br />
Ireland<br />
Scandinavia<br />
Source: <strong>BearingPoint</strong>, Green Supply Chain Monitor, 2010-2011<br />
We have succeeded in maintaining a sample group of answerers equally distributed in the different economic sectors.<br />
We were thus able to have more representative results of the global situation and to focus on some business sectors.<br />
Distribution per sector<br />
Consumer goods, FMCG<br />
Transports<br />
Metallurgy<br />
Construction<br />
Automotive<br />
Retail/Specialised distribution<br />
Industrial goods<br />
Energy and utilities<br />
Chemicals<br />
IT/Electronics<br />
Pharmaceuticals<br />
Aeronautics/Defense<br />
Textile<br />
Telecommunications<br />
Financial services<br />
Public sector<br />
0% 2% 4% 6% 8%<br />
10% 12% 14% 16% 18%<br />
Source: <strong>BearingPoint</strong>, Green Supply Chain Monitor, 2010-2011<br />
A good proof of the companie's growing interest in Sustainable Development is that Sustainable Development<br />
departments are structured. They are now the main answerers, in front of the Supply Chain departments.<br />
Distribution per department<br />
Sustainable Development<br />
Supply Chain<br />
COO<br />
Quality<br />
Purchasing<br />
CEO<br />
Other<br />
0% 5% 10% 15% 20% 25%<br />
Green…Supply…Chain:…from…awareness…to…action…<br />
30% 35% 40%<br />
Source: <strong>BearingPoint</strong>, Green Supply Chain Monitor, 2010-2011<br />
64 65