Putting the economy back on track Crimes Against Business
Putting the economy back on track Crimes Against Business
Putting the economy back on track Crimes Against Business

Create successful ePaper yourself
Turn your PDF publications into a flip-book with our unique Google optimized e-Paper software.
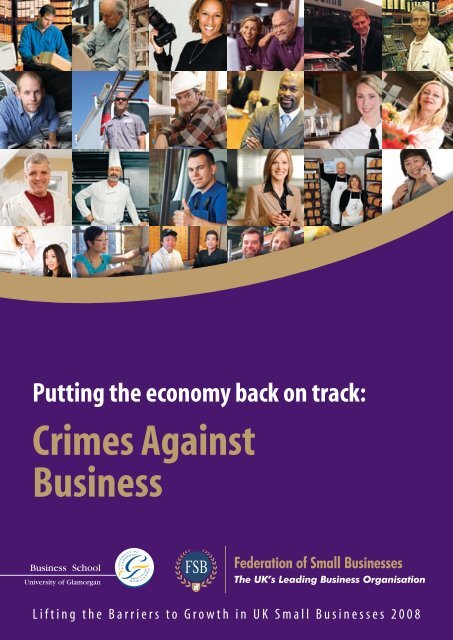
<str<strong>on</strong>g>Putting</str<strong>on</strong>g> <str<strong>on</strong>g>the</str<strong>on</strong>g> <str<strong>on</strong>g>ec<strong>on</strong>omy</str<strong>on</strong>g> <str<strong>on</strong>g>back</str<strong>on</strong>g> <strong>on</strong> <strong>track</strong>:<br />
<strong>Crimes</strong> <strong>Against</strong><br />
<strong>Business</strong><br />
Lifting <str<strong>on</strong>g>the</str<strong>on</strong>g> Barriers to Growth in UK Small <strong>Business</strong>es 2008
‘The crimes most<br />
frequntly reported<br />
by members were<br />
vandalism (26.6%),<br />
burglary (24.7%),<br />
vehicle damage<br />
(22.1%) and vehicle<br />
<str<strong>on</strong>g>the</str<strong>on</strong>g>ft (15.2%)’.<br />
page 2 lifting <str<strong>on</strong>g>the</str<strong>on</strong>g> barriers to growth in UK small businesses 2008
<str<strong>on</strong>g>Putting</str<strong>on</strong>g> <str<strong>on</strong>g>the</str<strong>on</strong>g> <str<strong>on</strong>g>ec<strong>on</strong>omy</str<strong>on</strong>g> <str<strong>on</strong>g>back</str<strong>on</strong>g> <strong>on</strong> <strong>track</strong> <strong>Crimes</strong> <strong>Against</strong> <strong>Business</strong><br />
c<strong>on</strong>tents<br />
Acknowledgements .........................................................................................................................................................Page 4<br />
Foreword ...............................................................................................................................................................................Page 5<br />
Executive Summary .........................................................................................................................................................Page 6<br />
Methodology and Background ..................................................................................................................................Page 7<br />
<strong>Business</strong>es Experiencing Crime – By Sector .........................................................................................................Page 9<br />
<strong>Business</strong>es Experiencing Crime – By English Regi<strong>on</strong>s and Countries .................................................. Page 10<br />
<strong>Business</strong>es Experiencing Crime – Urban/Rural ................................................................................................ Page 11<br />
<strong>Business</strong>es Experiencing Crime – By Types of Premises.............................................................................. Page 11<br />
Reporting Crime – By Sector ................................................................................................................................... Page 12<br />
Reporting Crime – By English Regi<strong>on</strong>s and Countries ................................................................................ Page 13<br />
Reporting Crime – Urban/Rural .............................................................................................................................. Page 14<br />
The Cost and Effect of Crime .................................................................................................................................... Page 15<br />
The Effectiveness of Crime – Reducti<strong>on</strong> Methods .......................................................................................... Page 16<br />
Special Focus: Neighbourhood Policing Units ................................................................................................. Page 17<br />
C<strong>on</strong>clusi<strong>on</strong>s ....................................................................................................................................................................... Page 18<br />
Key Policy Recommendati<strong>on</strong>s ................................................................................................................................. Page 19<br />
Annex of Tables ............................................................................................................................................................... Page 20<br />
lifting <str<strong>on</strong>g>the</str<strong>on</strong>g> barriers to growth in UK small businesses 2008 page 3
<str<strong>on</strong>g>Putting</str<strong>on</strong>g> <str<strong>on</strong>g>the</str<strong>on</strong>g> <str<strong>on</strong>g>ec<strong>on</strong>omy</str<strong>on</strong>g> <str<strong>on</strong>g>back</str<strong>on</strong>g> <strong>on</strong> <strong>track</strong> <strong>Crimes</strong> <strong>Against</strong> <strong>Business</strong><br />
acknowledgements<br />
This report was produced for <str<strong>on</strong>g>the</str<strong>on</strong>g> Federati<strong>on</strong> of Small <strong>Business</strong>es by <str<strong>on</strong>g>the</str<strong>on</strong>g> Welsh Enterprise Institute, which<br />
is part of <str<strong>on</strong>g>the</str<strong>on</strong>g> <strong>Business</strong> School at <str<strong>on</strong>g>the</str<strong>on</strong>g> University of Glamorgan. The project also included expert input from<br />
four external c<strong>on</strong>sultants. The Project Team was as follows:<br />
University of Glamorgan<br />
Dr Gary Packham Head of Enterprise, Centre for Enterprise<br />
University of Glamorgan<br />
Dr David Pickernell Head of The Welsh Enterprise Institute<br />
Glamorgan <strong>Business</strong> School, University of Glamorgan<br />
Dr Christopher Miller Deputy Head of The Welsh Enterprise Institute<br />
External C<strong>on</strong>sultants<br />
Glamorgan <strong>Business</strong> School, University of Glamorgan<br />
Professor David Brooksbank Director of Enterprise, Cardiff School of Management<br />
University of Wales Institute Cardiff<br />
Professor Oswald J<strong>on</strong>es Centre for Enterprise and Entrepreneurial Leadership<br />
Management School, University of Liverpool<br />
Professor David Smallb<strong>on</strong>e Associate Director, Small <strong>Business</strong> Research Centre<br />
Kingst<strong>on</strong> University L<strong>on</strong>d<strong>on</strong><br />
Dr Piers Thomps<strong>on</strong> Senior Lecturer, in Ec<strong>on</strong>omics, Cardiff School of Management<br />
University of Wales Institute Cardiff<br />
Acknowledgements<br />
The project team would like to thank <str<strong>on</strong>g>the</str<strong>on</strong>g> FSB Project<br />
Working Group for <str<strong>on</strong>g>the</str<strong>on</strong>g>ir guidance in producing <str<strong>on</strong>g>the</str<strong>on</strong>g>se<br />
reports. The team would also like to acknowledge <str<strong>on</strong>g>the</str<strong>on</strong>g><br />
assistance provided by Alex Bakos, Martyn Jarvis and<br />
Dr Brychan Thomas in producing <str<strong>on</strong>g>the</str<strong>on</strong>g> regi<strong>on</strong>al data<br />
tables that supplement <str<strong>on</strong>g>the</str<strong>on</strong>g>se reports.<br />
page 4 lifting <str<strong>on</strong>g>the</str<strong>on</strong>g> barriers to growth in UK small businesses 2008
<str<strong>on</strong>g>Putting</str<strong>on</strong>g> <str<strong>on</strong>g>the</str<strong>on</strong>g> <str<strong>on</strong>g>ec<strong>on</strong>omy</str<strong>on</strong>g> <str<strong>on</strong>g>back</str<strong>on</strong>g> <strong>on</strong> <strong>track</strong> <strong>Crimes</strong> <strong>Against</strong> <strong>Business</strong><br />
foreword<br />
The stark reality is that 64% of businesses fell victim to crime over a twelve-m<strong>on</strong>th period, and crime<br />
costs each business an average of £13,354 a year. The uncertainty in <str<strong>on</strong>g>the</str<strong>on</strong>g> fi nancial markets is a<br />
c<strong>on</strong>cern for many small businesses, and an effective resp<strong>on</strong>se to tackle crimes that are eating away<br />
at our local communities and nati<strong>on</strong>al <str<strong>on</strong>g>ec<strong>on</strong>omy</str<strong>on</strong>g> is now more important than ever.<br />
The survey results show that crimes targeted against small business are <strong>on</strong> <str<strong>on</strong>g>the</str<strong>on</strong>g> rise. Crime affects a<br />
business’ ability to meet customer deadlines and attract customers and adversely affects its profi tability,<br />
ultimately resulting in businesses closing down and jobs and local ec<strong>on</strong>omies being put at risk. Valuable<br />
time and resources are spent dealing with <str<strong>on</strong>g>the</str<strong>on</strong>g> aftermath of a crime and businesses are feeling <str<strong>on</strong>g>the</str<strong>on</strong>g><br />
squeeze of narrowing profi t margins and rising insurance premiums.<br />
<strong>Business</strong>es, and <str<strong>on</strong>g>the</str<strong>on</strong>g>ir staff in <str<strong>on</strong>g>the</str<strong>on</strong>g> local community, are victims of repeat crime in <str<strong>on</strong>g>the</str<strong>on</strong>g> form of vandalism,<br />
vehicle damage and threatening behaviour. <strong>Crimes</strong> against business make up a signifi cant 20%, or <str<strong>on</strong>g>the</str<strong>on</strong>g><br />
‘Forgotten Fifth’, of all recorded crime in <str<strong>on</strong>g>the</str<strong>on</strong>g> UK. An effective resp<strong>on</strong>se at a nati<strong>on</strong>al, regi<strong>on</strong>al and local<br />
level is necessary for <str<strong>on</strong>g>the</str<strong>on</strong>g> sustainability of our local communities and <str<strong>on</strong>g>the</str<strong>on</strong>g> nati<strong>on</strong>al <str<strong>on</strong>g>ec<strong>on</strong>omy</str<strong>on</strong>g>.<br />
Neighbourhood Policing Units (NPUs) are hailed as <str<strong>on</strong>g>the</str<strong>on</strong>g> answer to local crime problems. <strong>Business</strong>es<br />
<str<strong>on</strong>g>the</str<strong>on</strong>g>mselves have some faith in NPUs as an effective resp<strong>on</strong>se to crime at a local level. However, far fewer<br />
businesses have had any direct c<strong>on</strong>tact with <str<strong>on</strong>g>the</str<strong>on</strong>g>ir local unit. This needs to change, especially when it is<br />
claimed that businesses are a ‘strategic partner’. NPUs should be engaging directly with <str<strong>on</strong>g>the</str<strong>on</strong>g> business<br />
community and making it a priority to factor <str<strong>on</strong>g>the</str<strong>on</strong>g>ir views and interests into local strategies to tackle crime<br />
against business.<br />
At a time of such ec<strong>on</strong>omic uncertainty, businesses need increased support from police and local<br />
authorities in dealing with crime issues that are a major c<strong>on</strong>cern to <str<strong>on</strong>g>the</str<strong>on</strong>g>m. This is <str<strong>on</strong>g>the</str<strong>on</strong>g> fourth in a series of<br />
reports setting out positive proposals for putting <str<strong>on</strong>g>the</str<strong>on</strong>g> <str<strong>on</strong>g>ec<strong>on</strong>omy</str<strong>on</strong>g> <str<strong>on</strong>g>back</str<strong>on</strong>g> <strong>on</strong> <strong>track</strong>.<br />
John Walker<br />
John Walker<br />
Policy Chairman<br />
lifting <str<strong>on</strong>g>the</str<strong>on</strong>g> barriers to growth in UK small businesses 2008 page 5
1 This compares with <str<strong>on</strong>g>the</str<strong>on</strong>g><br />
FSB surveys of 2004=58%<br />
and 2006: 57% when <str<strong>on</strong>g>the</str<strong>on</strong>g><br />
statistics were calculated<br />
from a slightly different<br />
questi<strong>on</strong><br />
2 i.e. <str<strong>on</strong>g>the</str<strong>on</strong>g>se sectors had <str<strong>on</strong>g>the</str<strong>on</strong>g><br />
highest percentages of<br />
firms experiencing crime<br />
in <str<strong>on</strong>g>the</str<strong>on</strong>g> greatest numbers of<br />
crime types<br />
3 See Tables 1 and 2 in<br />
appendix<br />
<str<strong>on</strong>g>Putting</str<strong>on</strong>g> <str<strong>on</strong>g>the</str<strong>on</strong>g> <str<strong>on</strong>g>ec<strong>on</strong>omy</str<strong>on</strong>g> <str<strong>on</strong>g>back</str<strong>on</strong>g> <strong>on</strong> <strong>track</strong> <strong>Crimes</strong> <strong>Against</strong> <strong>Business</strong><br />
executive summary<br />
• The total percentage of businesses that have experienced crime, according to <str<strong>on</strong>g>the</str<strong>on</strong>g> FSB survey, was 63.5%. 1<br />
The most frequent crimes experienced by UK businesses overall in 2008 were vandalism (which dominated<br />
<str<strong>on</strong>g>the</str<strong>on</strong>g> findings), vehicle damage, threatening behaviour, graffiti, shoplifting and burglary. In additi<strong>on</strong>, fly tipping,<br />
credit card fraud, vehicle <str<strong>on</strong>g>the</str<strong>on</strong>g>ft and employee <str<strong>on</strong>g>the</str<strong>on</strong>g>ft also affected almost <strong>on</strong>e in three businesses.<br />
• Hotel and restaurants and motor vehicle sales and repair sectors were <str<strong>on</strong>g>the</str<strong>on</strong>g> sectors experiencing crime<br />
to <str<strong>on</strong>g>the</str<strong>on</strong>g> greatest extent. 2 These were closely followed by <str<strong>on</strong>g>the</str<strong>on</strong>g> mining and c<strong>on</strong>structi<strong>on</strong> sector and transport,<br />
communicati<strong>on</strong>s and utilities.<br />
• In respect of vandalism specifically, hotels and restaurants experienced <str<strong>on</strong>g>the</str<strong>on</strong>g> most vandalism with <str<strong>on</strong>g>the</str<strong>on</strong>g> lowest<br />
level reported by <str<strong>on</strong>g>the</str<strong>on</strong>g> business services sector. With regard to regi<strong>on</strong>al data <str<strong>on</strong>g>the</str<strong>on</strong>g> highest level of vandalism was<br />
experienced in Nor<str<strong>on</strong>g>the</str<strong>on</strong>g>rn Ireland (45.9%), closely followed by Scotland (44.7%) and Yorkshire and Humberside<br />
(44.6%). The lowest incidence was in <str<strong>on</strong>g>the</str<strong>on</strong>g> East of England (35.6%).<br />
• There was also c<strong>on</strong>siderable difference in <str<strong>on</strong>g>the</str<strong>on</strong>g> incidences of certain types of crime occurring in different<br />
types of business. The highest levels of credit card fraud, e-crime and identity fraud occurred in warehouse/<br />
factory businesses. These businesses also experienced <str<strong>on</strong>g>the</str<strong>on</strong>g> highest levels of most o<str<strong>on</strong>g>the</str<strong>on</strong>g>r crimes. The highest levels of<br />
shoplifting, vandalism, threatening behaviour and graffiti were experienced by retail/shop businesses.<br />
• A dichotomy was also found to exist between <str<strong>on</strong>g>the</str<strong>on</strong>g> incidence and <str<strong>on</strong>g>the</str<strong>on</strong>g> reporting of crime. The survey results<br />
indicate that <strong>on</strong>ly around 45% of firms that experienced a crime actually reported at least <strong>on</strong>e of <str<strong>on</strong>g>the</str<strong>on</strong>g>se<br />
instances. The results from rural and urban businesses also revealed that urban businesses experiencing crime<br />
reported it more often than rural businesses (47.1% compared with 40.5%).<br />
• Certain types of crime were perceived to be more important and taken more seriously in relati<strong>on</strong> to businesses<br />
actually reporting <str<strong>on</strong>g>the</str<strong>on</strong>g>m. Of all <str<strong>on</strong>g>the</str<strong>on</strong>g> crimes reported by resp<strong>on</strong>dents, <strong>on</strong>ly vandalism and burglary were<br />
c<strong>on</strong>sistently reported to <str<strong>on</strong>g>the</str<strong>on</strong>g> police. In respect of policy this may be important, given that shoplifting is often<br />
‘punished’ with a cauti<strong>on</strong>. Repeated small losses from shoplifting can actually close a shop down, as small<br />
businesses still have to pay <str<strong>on</strong>g>the</str<strong>on</strong>g> VAT <strong>on</strong> losses, unless <str<strong>on</strong>g>the</str<strong>on</strong>g> losses can be quantified and substantiated in some way.<br />
• Unsurprisingly, retail/shop-located businesses were <str<strong>on</strong>g>the</str<strong>on</strong>g> most likely to report <str<strong>on</strong>g>the</str<strong>on</strong>g> crimes that <str<strong>on</strong>g>the</str<strong>on</strong>g>y suffered.<br />
The reporting of crime also varied quite c<strong>on</strong>siderably across all business sectors but, again unsurprisingly <str<strong>on</strong>g>the</str<strong>on</strong>g><br />
wholesale and retail areas reported crime above <str<strong>on</strong>g>the</str<strong>on</strong>g> UK average, followed closely by hotels and restaurants.<br />
• The British Chambers of Commerce (BCC) report (2008) highlights that UK businesses experience a £12.6 billi<strong>on</strong><br />
annual cost of crime. The average level of crime in financial terms was £13,354 per small business. 3 The highest<br />
average cost of crime was found in Nor<str<strong>on</strong>g>the</str<strong>on</strong>g>rn Ireland, and <str<strong>on</strong>g>the</str<strong>on</strong>g>re were large regi<strong>on</strong>al differences in relati<strong>on</strong> to <str<strong>on</strong>g>the</str<strong>on</strong>g><br />
direct cost of crime, though <str<strong>on</strong>g>the</str<strong>on</strong>g>se differences were often accounted for by a small number of highly problematic<br />
crimes. There are also, however, indirect costs, which have an impact <strong>on</strong> firms experiencing crime generally, in<br />
terms of staff time, increased insurance premiums, and increased security measures. Across <str<strong>on</strong>g>the</str<strong>on</strong>g> UK over a quarter<br />
of businesses installed extra security alarms. In resp<strong>on</strong>se to <str<strong>on</strong>g>the</str<strong>on</strong>g> often increased levels of crime many businesses<br />
also increased <str<strong>on</strong>g>the</str<strong>on</strong>g>ir level of CCTV security. Only <str<strong>on</strong>g>the</str<strong>on</strong>g> hotel and restaurant and wholesale and retail sectors, however,<br />
seemed to be using, or setting up, <strong>Business</strong> Watch schemes to any effective extent. The overall cost of crime to <str<strong>on</strong>g>the</str<strong>on</strong>g><br />
UK <str<strong>on</strong>g>ec<strong>on</strong>omy</str<strong>on</strong>g> can <str<strong>on</strong>g>the</str<strong>on</strong>g>refore be c<strong>on</strong>sidered to be an important issue.<br />
• Crime-reducti<strong>on</strong> methods were not perceived to be tackling <str<strong>on</strong>g>the</str<strong>on</strong>g> problem to any significant degree. Across<br />
<str<strong>on</strong>g>the</str<strong>on</strong>g> majority of sectors <str<strong>on</strong>g>the</str<strong>on</strong>g> issues of faster police resp<strong>on</strong>se and tougher sentencing were perceived to be <str<strong>on</strong>g>the</str<strong>on</strong>g> most<br />
effective method of tackling crime. Increased levels of CCTV were also c<strong>on</strong>sidered to be an effective measure in<br />
reducing crime levels.<br />
• In additi<strong>on</strong>, most sectors also c<strong>on</strong>sidered Neighbourhood Policing Units to be a fairly effective method of<br />
tackling crime. The results in respect of Neighbourhood Policing Units (NPUs) also showed, however, that around<br />
67% of <str<strong>on</strong>g>the</str<strong>on</strong>g> businesses surveyed were not aware that NPUs exist. This lack of profile with small businesses is<br />
<str<strong>on</strong>g>the</str<strong>on</strong>g>refore a problem that needs to be addressed.<br />
page 6 lifting <str<strong>on</strong>g>the</str<strong>on</strong>g> barriers to growth in UK small businesses 2008
4 Firm growth orientati<strong>on</strong><br />
is broken up into four<br />
categories using answers<br />
to questi<strong>on</strong>s in <str<strong>on</strong>g>the</str<strong>on</strong>g><br />
questi<strong>on</strong>naire. Sustainedgrowth<br />
fi rms are defi ned as<br />
both having grown in <str<strong>on</strong>g>the</str<strong>on</strong>g><br />
last two years and aiming<br />
for growth in <str<strong>on</strong>g>the</str<strong>on</strong>g> next two.<br />
New-growth fi rms have<br />
not grown in <str<strong>on</strong>g>the</str<strong>on</strong>g> previous<br />
two years but are aiming<br />
for growth in <str<strong>on</strong>g>the</str<strong>on</strong>g> next<br />
two. C<strong>on</strong>tained-growth<br />
fi rms have grown in <str<strong>on</strong>g>the</str<strong>on</strong>g><br />
previous two years but are<br />
not aiming to do so in <str<strong>on</strong>g>the</str<strong>on</strong>g><br />
next two. Finally, No-growth<br />
fi rms have not grown in <str<strong>on</strong>g>the</str<strong>on</strong>g><br />
previous two years and do<br />
not intend to in <str<strong>on</strong>g>the</str<strong>on</strong>g> next<br />
two years<br />
5 This compares with <str<strong>on</strong>g>the</str<strong>on</strong>g><br />
FSB surveys of 2004 = 58%<br />
and 2006: 57%, when <str<strong>on</strong>g>the</str<strong>on</strong>g><br />
statistics were calculated<br />
from a slightly different<br />
questi<strong>on</strong><br />
<str<strong>on</strong>g>Putting</str<strong>on</strong>g> <str<strong>on</strong>g>the</str<strong>on</strong>g> <str<strong>on</strong>g>ec<strong>on</strong>omy</str<strong>on</strong>g> <str<strong>on</strong>g>back</str<strong>on</strong>g> <strong>on</strong> <strong>track</strong> <strong>Crimes</strong> <strong>Against</strong> <strong>Business</strong><br />
methodology & <str<strong>on</strong>g>back</str<strong>on</strong>g>ground<br />
Survey Methodology<br />
This report presents part of <str<strong>on</strong>g>the</str<strong>on</strong>g> results of <str<strong>on</strong>g>the</str<strong>on</strong>g> fi fth biennial survey of <str<strong>on</strong>g>the</str<strong>on</strong>g> FSB membership.<br />
The data for <str<strong>on</strong>g>the</str<strong>on</strong>g> reports were ga<str<strong>on</strong>g>the</str<strong>on</strong>g>red using a single questi<strong>on</strong>naire of around 100 questi<strong>on</strong>s that was<br />
sent to members in England, Nor<str<strong>on</strong>g>the</str<strong>on</strong>g>rn Ireland, Scotland and Wales. The questi<strong>on</strong>s were divided into a<br />
range of topics covering <str<strong>on</strong>g>the</str<strong>on</strong>g> following areas: business <str<strong>on</strong>g>back</str<strong>on</strong>g>ground; locati<strong>on</strong> and premises; home-based<br />
enterprises; past performance; suppliers, customers and markets; fi nance; employment; skills and training;<br />
business advice and services; crime; <str<strong>on</strong>g>the</str<strong>on</strong>g> envir<strong>on</strong>ment; transport; business c<strong>on</strong>tinuity; insurance; patents and<br />
intellectual property; future business aspirati<strong>on</strong>s; and characteristics of <str<strong>on</strong>g>the</str<strong>on</strong>g> business and its owners, al<strong>on</strong>g<br />
with supplementary nati<strong>on</strong>-specifi c questi<strong>on</strong>s.<br />
The questi<strong>on</strong>naire was <str<strong>on</strong>g>the</str<strong>on</strong>g>n publicised via <str<strong>on</strong>g>the</str<strong>on</strong>g> FSB website and by e-mailing <str<strong>on</strong>g>the</str<strong>on</strong>g> FSB membership at<br />
<str<strong>on</strong>g>the</str<strong>on</strong>g> beginning of March 2008. Printed copies of <str<strong>on</strong>g>the</str<strong>on</strong>g> questi<strong>on</strong>naire were sent out in <str<strong>on</strong>g>the</str<strong>on</strong>g> post and <str<strong>on</strong>g>the</str<strong>on</strong>g><br />
questi<strong>on</strong>naire was also made available electr<strong>on</strong>ically <strong>on</strong> <str<strong>on</strong>g>the</str<strong>on</strong>g> FSB website. From this process, a total of 8,742<br />
questi<strong>on</strong>naires were obtained.<br />
From an initial analysis of <str<strong>on</strong>g>the</str<strong>on</strong>g> data, fi ve topics were identifi ed as requiring specifi c focus:<br />
• <strong>Business</strong> Support and Finance<br />
• Skills and Training<br />
• Infrastructure (Transport, Envir<strong>on</strong>ment and ICT)<br />
• <strong>Crimes</strong> against <strong>Business</strong><br />
• Work–Life Balance<br />
The survey questi<strong>on</strong>s were analysed against a number of issues, such as industry, regi<strong>on</strong> (including urbanrural<br />
differences), fi rm growth intenti<strong>on</strong>s4 , fi rm size, and fi rm age. Where applicable, gender, owner age,<br />
owner educati<strong>on</strong> level and type of premises were also factors against which <str<strong>on</strong>g>the</str<strong>on</strong>g> data were evaluated.<br />
Background<br />
The extent of business crime in <str<strong>on</strong>g>the</str<strong>on</strong>g> United Kingdom (UK) c<strong>on</strong>tinues to be a growing c<strong>on</strong>cern. AxA<br />
Insurance reported a 10% increase in <str<strong>on</strong>g>the</str<strong>on</strong>g> fi rst half of 2008 and an increase of 18% in <str<strong>on</strong>g>the</str<strong>on</strong>g> cost of crime. A<br />
report published by <str<strong>on</strong>g>the</str<strong>on</strong>g> British Chambers of Commerce (BCC) (2008) also highlighted that UK business<br />
experiences a £12.6 billi<strong>on</strong> annual cost of crime. This fi gure has increased by 20% since <str<strong>on</strong>g>the</str<strong>on</strong>g> BCC’s last survey<br />
<strong>on</strong> business crime in 2004, and now equates to over a sixth of <str<strong>on</strong>g>the</str<strong>on</strong>g> total cost of all crime in <str<strong>on</strong>g>the</str<strong>on</strong>g> UK.<br />
The FSB looked at <str<strong>on</strong>g>the</str<strong>on</strong>g> broad issue of crime in its 2002 survey. It reported at <str<strong>on</strong>g>the</str<strong>on</strong>g> time that <str<strong>on</strong>g>the</str<strong>on</strong>g>re were<br />
insuffi cient data to examine <str<strong>on</strong>g>the</str<strong>on</strong>g> incidence and effect of crime <strong>on</strong> small businesses in any depth. The 2004<br />
and 2006 surveys took <str<strong>on</strong>g>the</str<strong>on</strong>g> opportunity to explore <str<strong>on</strong>g>the</str<strong>on</strong>g> extent to which businesses had been <str<strong>on</strong>g>the</str<strong>on</strong>g> victims<br />
of crime, <str<strong>on</strong>g>the</str<strong>on</strong>g> types of crime experienced, <str<strong>on</strong>g>the</str<strong>on</strong>g> types of business most affected, and <str<strong>on</strong>g>the</str<strong>on</strong>g> impact of crime <strong>on</strong><br />
<str<strong>on</strong>g>the</str<strong>on</strong>g> small-business sector. This report takes a fur<str<strong>on</strong>g>the</str<strong>on</strong>g>r look at <str<strong>on</strong>g>the</str<strong>on</strong>g>se topics, as well as comparing <str<strong>on</strong>g>the</str<strong>on</strong>g> levels of<br />
crime affecting urban and rural businesses.<br />
<strong>Business</strong>es Experiencing Crime<br />
In respect of <str<strong>on</strong>g>the</str<strong>on</strong>g> broad results, <str<strong>on</strong>g>the</str<strong>on</strong>g> 2008 survey found that <str<strong>on</strong>g>the</str<strong>on</strong>g> total percentage of businesses<br />
having experienced crime to at least some extent was 63.5%. 5 The most frequent crimes experienced<br />
by UK businesses in 2008 were vandalism, experienced by (40.8%) of businesses, vehicle damage (35.7%),<br />
threatening behaviour (34.1%), graffi ti (32.7%), shoplifting (32.1%) and burglary (30.8%). Fly tipping and<br />
credit card fraud was experienced by almost <strong>on</strong>e in three businesses (29.6%). Vehicle <str<strong>on</strong>g>the</str<strong>on</strong>g>ft and employee<br />
<str<strong>on</strong>g>the</str<strong>on</strong>g>ft also affected almost <strong>on</strong>e in three in <str<strong>on</strong>g>the</str<strong>on</strong>g> UK (29.2%) with cheque fraud at 29% also being signifi cant.<br />
Robbery and employee fraud were also of c<strong>on</strong>cern to 27.4% and 27.3% of businesses. Over <str<strong>on</strong>g>the</str<strong>on</strong>g> past two<br />
years, <strong>on</strong>e in four businesses experienced e-crime, assaults <strong>on</strong> owners and staff, identity fraud and ars<strong>on</strong>.<br />
lifting <str<strong>on</strong>g>the</str<strong>on</strong>g> barriers to growth in UK small businesses 2008 page 7
‘The average cost of<br />
crime was £13,354<br />
per UK business.<br />
There are very large<br />
differences in <str<strong>on</strong>g>the</str<strong>on</strong>g><br />
average cost of<br />
crime for businesses<br />
in different regi<strong>on</strong>s’.<br />
page 8 lifting <str<strong>on</strong>g>the</str<strong>on</strong>g> barriers to growth in UK small businesses 2008
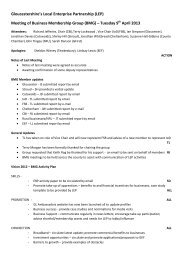
Figure 1<br />
Experiencing<br />
crime by sector<br />
6 See Tables 3 and 4 in<br />
appendix. Percentages<br />
c<strong>on</strong>veyed in <str<strong>on</strong>g>the</str<strong>on</strong>g> tables<br />
measure <str<strong>on</strong>g>the</str<strong>on</strong>g> percentage of<br />
businesses in a particular<br />
sector experiencing a<br />
particular crime to at least<br />
some extent<br />
<str<strong>on</strong>g>Putting</str<strong>on</strong>g> <str<strong>on</strong>g>the</str<strong>on</strong>g> <str<strong>on</strong>g>ec<strong>on</strong>omy</str<strong>on</strong>g> <str<strong>on</strong>g>back</str<strong>on</strong>g> <strong>on</strong> <strong>track</strong> <strong>Crimes</strong> <strong>Against</strong> <strong>Business</strong><br />
<strong>Business</strong>es Experiencing Crime – By Sector<br />
% of industry resp<strong>on</strong>dents<br />
80<br />
70<br />
60<br />
50<br />
40<br />
30<br />
20<br />
10<br />
0<br />
Agriculture, forestry & fi shing<br />
Mining & c<strong>on</strong>structi<strong>on</strong><br />
Manufacturing<br />
Transport, communicati<strong>on</strong>s & utilities<br />
Motor vehicle sales and repair<br />
Hotels & restaurants<br />
As Figure 1 indicates, <str<strong>on</strong>g>the</str<strong>on</strong>g> hotel and restaurant and motor vehicle sales and repair sectors had <str<strong>on</strong>g>the</str<strong>on</strong>g> greatest<br />
percentage of resp<strong>on</strong>dents experiencing crime to at least some extent. These were followed by <str<strong>on</strong>g>the</str<strong>on</strong>g><br />
wholesale and retail, and transport, communicati<strong>on</strong>s and utilities sectors.<br />
The specifi c types of crime experienced by business in <str<strong>on</strong>g>the</str<strong>on</strong>g> 2008 survey of FSB members varied<br />
c<strong>on</strong>siderably across sectors. 6 Vandalism dominated <str<strong>on</strong>g>the</str<strong>on</strong>g> 2008 survey, with all sectors stating that<br />
<str<strong>on</strong>g>the</str<strong>on</strong>g>y suffered from this crime above almost all o<str<strong>on</strong>g>the</str<strong>on</strong>g>r. Hotels and restaurants experienced <str<strong>on</strong>g>the</str<strong>on</strong>g> most<br />
vandalism (53%). Motor vehicle sales and repair (48.7%) and transport, communicati<strong>on</strong>s and utilities<br />
(46.7%) also reported c<strong>on</strong>siderable levels of vandalism. It is also worth noting that businesses in <str<strong>on</strong>g>the</str<strong>on</strong>g><br />
wholesale and retail (43.8%), c<strong>on</strong>sumer & pers<strong>on</strong>al services (42.3%), manufacturing (41.6%) and mining<br />
and c<strong>on</strong>structi<strong>on</strong> (41.8%) sectors experienced vandalism to a signifi cant degree. The lowest level of<br />
vandalism was reported by <str<strong>on</strong>g>the</str<strong>on</strong>g> business services sector (30.1%).<br />
Graffi ti was mostly a problem for <str<strong>on</strong>g>the</str<strong>on</strong>g> hotels and restaurants (36.9%), mining and c<strong>on</strong>structi<strong>on</strong> (35.3%)<br />
and manufacturing (33%) sectors. Remaining sectors also experienced substantial incidences, with <str<strong>on</strong>g>the</str<strong>on</strong>g><br />
business services sector again experiencing <str<strong>on</strong>g>the</str<strong>on</strong>g> lowest level of this type of crime (26.6%). Vehicle <str<strong>on</strong>g>the</str<strong>on</strong>g>ft<br />
and vehicle damage were experienced mostly by transport, communicati<strong>on</strong>s and utilities (35.3% and<br />
47.4%) and motor vehicles sales and repairs (41.6% and 47.8%). The results indicate that this seems to<br />
be a comm<strong>on</strong> area of c<strong>on</strong>cern for all small businesses, with <str<strong>on</strong>g>the</str<strong>on</strong>g> lowest levels of this type of crime still<br />
experienced by at least <strong>on</strong>e in fi ve businesses in each sector.<br />
C<strong>on</strong>siderable incidences of threatening behaviour occurred in <str<strong>on</strong>g>the</str<strong>on</strong>g> hotels and restaurants sector<br />
(45.3%). The results indicate that across most o<str<strong>on</strong>g>the</str<strong>on</strong>g>r sectors this was a problem for more than 30%<br />
of businesses. The wholesale and retail sector suffered c<strong>on</strong>siderable levels of shoplifting (49.1%) with<br />
almost <strong>on</strong>e in two businesses in this sector having experienced this form of crime. Signifi cant levels were<br />
also reported by motor vehicle sales and repairs (36.3%) and hotels and restaurants (33.6%). The highest<br />
incidences of fl y tipping were in <str<strong>on</strong>g>the</str<strong>on</strong>g> agriculture, forestry and fi shing (37.2%), and motor vehicle sales and<br />
repair (35%) sectors, with over 30% of <str<strong>on</strong>g>the</str<strong>on</strong>g> manufacturing, transport, communicati<strong>on</strong>s and utilities, and<br />
hotel and restaurant businesses reporting this type of crime.<br />
lifting <str<strong>on</strong>g>the</str<strong>on</strong>g> barriers to growth in UK small businesses 2008 page 9<br />
Financial, insurance & real estate<br />
<strong>Business</strong> services<br />
Health, educati<strong>on</strong> & social services<br />
C<strong>on</strong>sumer & pers<strong>on</strong>al services<br />
Wholesale & retail<br />
O<str<strong>on</strong>g>the</str<strong>on</strong>g>r/uncodeable
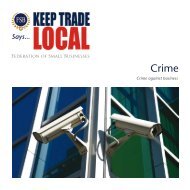
Figure 2<br />
Experiencing<br />
crime by<br />
regi<strong>on</strong> /<br />
country of<br />
<str<strong>on</strong>g>the</str<strong>on</strong>g> UK<br />
7 See Tables 5 and 6<br />
in appendix<br />
<str<strong>on</strong>g>Putting</str<strong>on</strong>g> <str<strong>on</strong>g>the</str<strong>on</strong>g> <str<strong>on</strong>g>ec<strong>on</strong>omy</str<strong>on</strong>g> <str<strong>on</strong>g>back</str<strong>on</strong>g> <strong>on</strong> <strong>track</strong> <strong>Crimes</strong> <strong>Against</strong> <strong>Business</strong><br />
Ars<strong>on</strong> was experienced by more than 20% of businesses in all sectors, and burglary was a<br />
problem for almost <strong>on</strong>e in three in all business sectors. Motor vehicle sales and repair (32.7%),<br />
mining and c<strong>on</strong>structi<strong>on</strong> (32.7%), agriculture, forestry and fi shing (31.4%) and hotels and restaurants<br />
(30.6) experienced <str<strong>on</strong>g>the</str<strong>on</strong>g> highest levels of robbery. This particular problem was of great c<strong>on</strong>cern for all<br />
remaining sectors, affecting over <strong>on</strong>e in fi ve businesses. Assault <strong>on</strong> owners and staff was more likely to be<br />
experienced by hotels and restaurants (31.8%) and mining and c<strong>on</strong>structi<strong>on</strong> sectors (29.4%). Hotels and<br />
restaurants also experienced <str<strong>on</strong>g>the</str<strong>on</strong>g> highest level of employee fraud (32.5%) and employee <str<strong>on</strong>g>the</str<strong>on</strong>g>ft (36.6%).<br />
Cheque fraud was experienced mostly by motor vehicle sales and repair (35.8%) whilst credit card fraud<br />
mainly affected mining and c<strong>on</strong>structi<strong>on</strong> (33.4%) and transport, communicati<strong>on</strong>s and utilities (32.3%).<br />
Episodes of e-crime (29.8%) and identity fraud (30.5%) were mostly experienced by <str<strong>on</strong>g>the</str<strong>on</strong>g> mining and<br />
c<strong>on</strong>structi<strong>on</strong> sector, possibly <str<strong>on</strong>g>the</str<strong>on</strong>g> because of <str<strong>on</strong>g>the</str<strong>on</strong>g> transient nature of <str<strong>on</strong>g>the</str<strong>on</strong>g> employment in <str<strong>on</strong>g>the</str<strong>on</strong>g> c<strong>on</strong>structi<strong>on</strong><br />
industry.<br />
<strong>Business</strong>es Experiencing Crime – By English Regi<strong>on</strong>s and Countries<br />
% of industry resp<strong>on</strong>dents<br />
70<br />
68<br />
66<br />
64<br />
62<br />
60<br />
58<br />
56<br />
54<br />
North East<br />
North West<br />
Yorkshire & Humber<br />
East Midlands<br />
West Midlands<br />
East of England<br />
Figure 2 shows that, overall, Nor<str<strong>on</strong>g>the</str<strong>on</strong>g>rn Ireland and L<strong>on</strong>d<strong>on</strong> had <str<strong>on</strong>g>the</str<strong>on</strong>g> highest percentage of fi rms<br />
indicating that <str<strong>on</strong>g>the</str<strong>on</strong>g>y had experienced crime to at least some extent. Different crimes were more<br />
prevalent in different regi<strong>on</strong>s and countries, however. 7 The highest level of vandalism, for example,<br />
was experienced in Nor<str<strong>on</strong>g>the</str<strong>on</strong>g>rn Ireland (45.9%), closely followed by Scotland (44.7%) and Yorkshire and<br />
Humberside (44.6%). The lowest incidence was in <str<strong>on</strong>g>the</str<strong>on</strong>g> East of England (35.6%). Graffi ti was a problem in<br />
all regi<strong>on</strong>s, especially in L<strong>on</strong>d<strong>on</strong> (38.8%), Nor<str<strong>on</strong>g>the</str<strong>on</strong>g>rn Ireland (38.1%) and Scotland (37.7%). All o<str<strong>on</strong>g>the</str<strong>on</strong>g>r regi<strong>on</strong>s<br />
experienced around <str<strong>on</strong>g>the</str<strong>on</strong>g> UK average of 32.5%. Vehicle <str<strong>on</strong>g>the</str<strong>on</strong>g>ft and vehicle damage were experienced by<br />
growing numbers of resp<strong>on</strong>dents in all geographical areas, with Scotland, L<strong>on</strong>d<strong>on</strong> and Yorkshire and<br />
Humberside all experiencing above-average occurrences of vehicle damage.<br />
L<strong>on</strong>d<strong>on</strong> experienced <str<strong>on</strong>g>the</str<strong>on</strong>g> greatest level of threatening behaviour (41.3%), whilst Nor<str<strong>on</strong>g>the</str<strong>on</strong>g>rn Ireland and<br />
Scotland also experienced episodes above <str<strong>on</strong>g>the</str<strong>on</strong>g> UK average. High levels of shoplifting affected businesses<br />
in Nor<str<strong>on</strong>g>the</str<strong>on</strong>g>rn Ireland (39.8%) and Scotland (37.9%). All o<str<strong>on</strong>g>the</str<strong>on</strong>g>r regi<strong>on</strong>s showed much lower occurrences,<br />
around <str<strong>on</strong>g>the</str<strong>on</strong>g> UK average. Fly tipping was particularly troublesome in <str<strong>on</strong>g>the</str<strong>on</strong>g> North East (34%) and Scotland<br />
(33%). Ars<strong>on</strong> was a problem for around 25% of all businesses, with Scotland scoring <str<strong>on</strong>g>the</str<strong>on</strong>g> highest (29.1%)<br />
and <str<strong>on</strong>g>the</str<strong>on</strong>g> East of England <str<strong>on</strong>g>the</str<strong>on</strong>g> lowest (22.3%). Around a third of businesses in each regi<strong>on</strong> were victims of<br />
burglary. Only three areas registered c<strong>on</strong>siderably lower amounts, <str<strong>on</strong>g>the</str<strong>on</strong>g>se being <str<strong>on</strong>g>the</str<strong>on</strong>g> South East (28.2), <str<strong>on</strong>g>the</str<strong>on</strong>g><br />
East of England (28.8) and <str<strong>on</strong>g>the</str<strong>on</strong>g> South West (29.8).<br />
page 10 lifting <str<strong>on</strong>g>the</str<strong>on</strong>g> barriers to growth in UK small businesses 2008<br />
L<strong>on</strong>d<strong>on</strong><br />
South East<br />
South West<br />
England<br />
Wales<br />
Scotland<br />
Nor<str<strong>on</strong>g>the</str<strong>on</strong>g>rn Ireland
Figure 3<br />
Crime<br />
experienced<br />
urban/rural<br />
■ Urban<br />
■ Rural<br />
<str<strong>on</strong>g>Putting</str<strong>on</strong>g> <str<strong>on</strong>g>the</str<strong>on</strong>g> <str<strong>on</strong>g>ec<strong>on</strong>omy</str<strong>on</strong>g> <str<strong>on</strong>g>back</str<strong>on</strong>g> <strong>on</strong> <strong>track</strong> <strong>Crimes</strong> <strong>Against</strong> <strong>Business</strong><br />
The East of England experienced signifi cantly lower levels of robbery (23.6%) than <str<strong>on</strong>g>the</str<strong>on</strong>g> UK average<br />
(27.1%), with Scotland having <str<strong>on</strong>g>the</str<strong>on</strong>g> highest number of incidences (30.9%), as well as <str<strong>on</strong>g>the</str<strong>on</strong>g> most assaults <strong>on</strong><br />
owners/staff (29.1%). The least incidences of this type of crime were in <str<strong>on</strong>g>the</str<strong>on</strong>g> South East (23.7%). Nor<str<strong>on</strong>g>the</str<strong>on</strong>g>rn<br />
Ireland showed high levels of employee fraud ( 30.3%), employee <str<strong>on</strong>g>the</str<strong>on</strong>g>ft (32.9%) and cheque fraud (36.8%),<br />
whilst credit card fraud(33.4%), e-crime (30.2%) and identity fraud (29.9%) were most prevalent in<br />
Scotland.<br />
<strong>Business</strong>es Experiencing Crime – Urban/Rural<br />
Vandalism<br />
Graffi ti<br />
Vehicle <str<strong>on</strong>g>the</str<strong>on</strong>g>ft<br />
Vehicle damage<br />
Threatening behaviour/intimidati<strong>on</strong><br />
Shoplifting<br />
Fly tipping<br />
Ars<strong>on</strong><br />
Burglary<br />
Robbery<br />
Assault <strong>on</strong> owners/staff<br />
Employee fraud<br />
Employee <str<strong>on</strong>g>the</str<strong>on</strong>g>ft<br />
Cheque fraud<br />
Credit card fraud<br />
E-crime<br />
Identity fraud<br />
O<str<strong>on</strong>g>the</str<strong>on</strong>g>r<br />
0.0% 5.0% 10.0% 15.0% 20.0% 25.0% 30.0% 35.0% 40.0% 45.0%<br />
In comparing <str<strong>on</strong>g>the</str<strong>on</strong>g> incidence of crime in urban and rural businesses, <str<strong>on</strong>g>the</str<strong>on</strong>g>re was a higher level of<br />
‘some experience of crime’ for urban businesses (65%) than for rural businesses (59%). There was<br />
also, however, a great difference in <str<strong>on</strong>g>the</str<strong>on</strong>g> incidence of certain crimes (see Figure 3) .The most signifi cant<br />
difference can be seen with regard to vandalism, which was experienced by 42.8% of urban businesses,<br />
but <strong>on</strong>ly 36.7% of rural businesses. A c<strong>on</strong>siderable variati<strong>on</strong> also occurred with graffi ti, vehicle damage<br />
and threatening behaviour, with differences of more than 3%. The results indicate that all o<str<strong>on</strong>g>the</str<strong>on</strong>g>r crimes<br />
showed a lesser variati<strong>on</strong>.<br />
<strong>Business</strong>es Experiencing Crime – By Types of Premises<br />
There is a c<strong>on</strong>siderable difference in <str<strong>on</strong>g>the</str<strong>on</strong>g> incidences of certain types of crime occurring in different<br />
types of business. It is worthy of note, though perhaps unsurprising, that businesses operating from<br />
home experienced <str<strong>on</strong>g>the</str<strong>on</strong>g> lowest levels of all crimes except for e-crime and identity fraud. These crimes were<br />
least experienced by retail/shops. C<strong>on</strong>versely, <str<strong>on</strong>g>the</str<strong>on</strong>g> highest levels of credit card fraud, e-crime and identity<br />
fraud occurred in warehouse/factory businesses. These businesses also experienced <str<strong>on</strong>g>the</str<strong>on</strong>g> highest levels<br />
of o<str<strong>on</strong>g>the</str<strong>on</strong>g>r crimes such as vehicle <str<strong>on</strong>g>the</str<strong>on</strong>g>ft (34.3%), vehicle damage (41.3%), fl y tipping (36.2%), ars<strong>on</strong> (28.3%),<br />
burglary (38.4%), robbery (31.3%), assault <strong>on</strong> owners and staff and employee fraud. The highest levels of<br />
shoplifting (51.5%), vandalism (49%), threatening behaviour (41%) and graffi ti (38.5%) were experienced<br />
by retail/shop businesses.<br />
lifting <str<strong>on</strong>g>the</str<strong>on</strong>g> barriers to growth in UK small businesses 2008 page 11
Figure 4<br />
% reporting<br />
at least <strong>on</strong>e<br />
crime that was<br />
experienced<br />
by sector<br />
8 See Tables 7 and 8 in<br />
appendix. Percentages<br />
c<strong>on</strong>veyed in <str<strong>on</strong>g>the</str<strong>on</strong>g>se tables<br />
measure <str<strong>on</strong>g>the</str<strong>on</strong>g> percentage of<br />
businesses in a particular<br />
sector that experienced a<br />
particular crime to at least<br />
some extent and actually<br />
reported this to <str<strong>on</strong>g>the</str<strong>on</strong>g> police<br />
<str<strong>on</strong>g>Putting</str<strong>on</strong>g> <str<strong>on</strong>g>the</str<strong>on</strong>g> <str<strong>on</strong>g>ec<strong>on</strong>omy</str<strong>on</strong>g> <str<strong>on</strong>g>back</str<strong>on</strong>g> <strong>on</strong> <strong>track</strong> <strong>Crimes</strong> <strong>Against</strong> <strong>Business</strong><br />
Reporting Crime<br />
Offi cial crime statistics may understate <str<strong>on</strong>g>the</str<strong>on</strong>g> true incidence of business-related crime in <str<strong>on</strong>g>the</str<strong>on</strong>g> UK. The FSB<br />
initiative Every Crime Every Time (ECET) (www.fsb.org.uk/ecet) advises businesses to report crimes. The<br />
results of <str<strong>on</strong>g>the</str<strong>on</strong>g> 2008 FSB survey, however, indicate that many crimes against businesses were still not<br />
reported. More specifi cally, <strong>on</strong>ly around 45% of fi rms that experienced a crime actually reported<br />
at least <strong>on</strong>e of <str<strong>on</strong>g>the</str<strong>on</strong>g>se instances. Reporting levels differed, however, by crime type, sector and regi<strong>on</strong> /<br />
nati<strong>on</strong>.<br />
Reporting Crime – By Sector<br />
60<br />
50<br />
40<br />
30<br />
20<br />
10<br />
0<br />
Agriculture, forestry & fi shing<br />
Mining & c<strong>on</strong>structi<strong>on</strong><br />
Manufacturing<br />
Transport, communicati<strong>on</strong>s & utilities<br />
Motor vehicle sales and repair<br />
Hotels & restaurants<br />
The sectors that were most likely to report any crime <str<strong>on</strong>g>the</str<strong>on</strong>g>y experienced were, as Figure 4 indicates,<br />
motor vehicles, sales and repair, followed by <str<strong>on</strong>g>the</str<strong>on</strong>g> hotel and restaurant and wholesale and retail<br />
sectors. The reporting of types of crime also varied quite c<strong>on</strong>siderably across business sectors. 8<br />
With regard to individual crimes, less than 20% of <str<strong>on</strong>g>the</str<strong>on</strong>g> businesses in <str<strong>on</strong>g>the</str<strong>on</strong>g> mining and c<strong>on</strong>structi<strong>on</strong> and<br />
business services sectors reported vandalism. All o<str<strong>on</strong>g>the</str<strong>on</strong>g>r sectors reported it to a greater degree, with<br />
<str<strong>on</strong>g>the</str<strong>on</strong>g> highest being hotels and restaurants (35.4%), motor vehicle sales and repair (32.7%), c<strong>on</strong>sumer<br />
and pers<strong>on</strong>al services (30.5%) and wholesale and retail (32.1%). Transport businesses were most likely<br />
page 12 lifting <str<strong>on</strong>g>the</str<strong>on</strong>g> barriers to growth in UK small businesses 2008<br />
Financial, insurance & real estate<br />
<strong>Business</strong> services<br />
Health, educati<strong>on</strong> & social services<br />
C<strong>on</strong>sumer & pers<strong>on</strong>al services<br />
Wholesale & retail<br />
O<str<strong>on</strong>g>the</str<strong>on</strong>g>r/uncodeable
Figure 5<br />
% reported at<br />
least <strong>on</strong>e crime<br />
experienced<br />
by regi<strong>on</strong> /<br />
country<br />
9 See Tables 9 and 10<br />
in appendix<br />
<str<strong>on</strong>g>Putting</str<strong>on</strong>g> <str<strong>on</strong>g>the</str<strong>on</strong>g> <str<strong>on</strong>g>ec<strong>on</strong>omy</str<strong>on</strong>g> <str<strong>on</strong>g>back</str<strong>on</strong>g> <strong>on</strong> <strong>track</strong> <strong>Crimes</strong> <strong>Against</strong> <strong>Business</strong><br />
to report vehicle damage. Motor vehicle sales and repair were most likely to report vehicle <str<strong>on</strong>g>the</str<strong>on</strong>g>ft but<br />
agriculture, forestry and fi shing, mining and c<strong>on</strong>structi<strong>on</strong> and transport communicati<strong>on</strong>s and utilities<br />
were still experiencing diffi culties in this area. Financial insurance and real estate, c<strong>on</strong>sumer and pers<strong>on</strong>al<br />
services and wholesale and retail reported graffi ti-related crime more than o<str<strong>on</strong>g>the</str<strong>on</strong>g>r sectors. Wholesale<br />
and retail businesses reported shoplifting and e-related crime. Threatening behaviour was mostly<br />
encountered and reported to <str<strong>on</strong>g>the</str<strong>on</strong>g> police in <str<strong>on</strong>g>the</str<strong>on</strong>g> hotel and restaurant and c<strong>on</strong>sumer and pers<strong>on</strong>al services<br />
sectors, with over <strong>on</strong>e in fi ve businesses reporting such behaviour when it occurred.<br />
Assaults <strong>on</strong> owners and staff were also reported more often by hotels and restaurants than o<str<strong>on</strong>g>the</str<strong>on</strong>g>r sectors.<br />
Shoplifting was mainly reported by those businesses in <str<strong>on</strong>g>the</str<strong>on</strong>g> wholesale and retail sector (22.7%). Burglary<br />
was reported by over 30% of those in agriculture, forestry and fi shing, manufacturing and <str<strong>on</strong>g>the</str<strong>on</strong>g> transport<br />
businesses. All remaining sectors also reported a high degree of burglary (over 20%), with <str<strong>on</strong>g>the</str<strong>on</strong>g> excepti<strong>on</strong><br />
of business services and health, educati<strong>on</strong> and social services. Robbery was reported by all sectors, with<br />
motor vehicle sales and repair, agriculture, forestry and fi shing and hotels and restaurants most likely to<br />
report it. Hotels and restaurants and business services reported <str<strong>on</strong>g>the</str<strong>on</strong>g> most employee fraud. Hotels and<br />
restaurants, c<strong>on</strong>sumer and pers<strong>on</strong>al services businesses, transport, communicati<strong>on</strong>s and utilities and<br />
fi nancial insurance and real estate also reported incidences of employee <str<strong>on</strong>g>the</str<strong>on</strong>g>ft. Wholesale and retail<br />
businesses reported <str<strong>on</strong>g>the</str<strong>on</strong>g> most signifi cant levels of cheque fraud and, al<strong>on</strong>g with hotels and restaurants,<br />
credit card fraud. <strong>Business</strong> services were also pr<strong>on</strong>e to report credit card fraud, with almost <strong>on</strong>e in ten<br />
businesses reporting such crime. Financial, insurance and real estate businesses reported <str<strong>on</strong>g>the</str<strong>on</strong>g> highest<br />
levels of identity fraud, with almost <strong>on</strong>e in ten advising <str<strong>on</strong>g>the</str<strong>on</strong>g> police.<br />
Reporting Crime – By English Regi<strong>on</strong>s and Countries<br />
60<br />
50<br />
40<br />
30<br />
20<br />
10<br />
0<br />
North East<br />
North West<br />
Yorkshire & Humber<br />
East Midlands<br />
West Midlands<br />
East of England<br />
L<strong>on</strong>d<strong>on</strong><br />
As Figure 5 indicates, <str<strong>on</strong>g>the</str<strong>on</strong>g> reporting of crime was fairly c<strong>on</strong>sistent across regi<strong>on</strong>s and countries of <str<strong>on</strong>g>the</str<strong>on</strong>g> UK,<br />
with fi rms in Yorkshire and Humberside most likely to report and those in Nor<str<strong>on</strong>g>the</str<strong>on</strong>g>rn Ireland least likely<br />
to do so. In respect of <str<strong>on</strong>g>the</str<strong>on</strong>g> specifi c crimes reported by resp<strong>on</strong>dents in this survey, 9 <strong>on</strong>ly vandalism and<br />
burglary were fairly c<strong>on</strong>sistently reported to <str<strong>on</strong>g>the</str<strong>on</strong>g> police. With regard to <str<strong>on</strong>g>the</str<strong>on</strong>g> crimes reported, fi rms in <str<strong>on</strong>g>the</str<strong>on</strong>g><br />
North East were particularly hesitant about reporting vandalism and graffi ti. Graffi ti, however, was rarely<br />
reported across all regi<strong>on</strong>s. Burglary was more likely to be reported in <str<strong>on</strong>g>the</str<strong>on</strong>g> West Midlands, <str<strong>on</strong>g>the</str<strong>on</strong>g> North West<br />
and L<strong>on</strong>d<strong>on</strong>. It is worthy of note that <str<strong>on</strong>g>the</str<strong>on</strong>g>re were relatively few regi<strong>on</strong>al variati<strong>on</strong>s in reported crime.<br />
The crimes most frequently reported by members were vandalism (26.6%), burglary (24.7%),<br />
vehicle damage (22.1%) and vehicle <str<strong>on</strong>g>the</str<strong>on</strong>g>ft (15.2%). Robbery was reported to <str<strong>on</strong>g>the</str<strong>on</strong>g> police by <strong>on</strong>ly just<br />
lifting <str<strong>on</strong>g>the</str<strong>on</strong>g> barriers to growth in UK small businesses 2008 page 13<br />
South East<br />
South West<br />
England<br />
Wales<br />
Scotland<br />
Nor<str<strong>on</strong>g>the</str<strong>on</strong>g>rn Ireland
Figure 6<br />
Types of crime<br />
reported<br />
urban/rural<br />
■ Urban<br />
■ Rural<br />
<str<strong>on</strong>g>Putting</str<strong>on</strong>g> <str<strong>on</strong>g>the</str<strong>on</strong>g> <str<strong>on</strong>g>ec<strong>on</strong>omy</str<strong>on</strong>g> <str<strong>on</strong>g>back</str<strong>on</strong>g> <strong>on</strong> <strong>track</strong> <strong>Crimes</strong> <strong>Against</strong> <strong>Business</strong><br />
over <strong>on</strong>e in eight (12.5%) of resp<strong>on</strong>ding businesses. Many small businesses were reluctant to report crime<br />
and <str<strong>on</strong>g>the</str<strong>on</strong>g> 2008 survey provides similar results to <str<strong>on</strong>g>the</str<strong>on</strong>g> 2006 survey in relati<strong>on</strong> to <str<strong>on</strong>g>the</str<strong>on</strong>g> resp<strong>on</strong>dents’ view that<br />
reporting crime would achieve very little. The results of <str<strong>on</strong>g>the</str<strong>on</strong>g> 2008 survey indicate that almost 30%<br />
of resp<strong>on</strong>dents doubt <str<strong>on</strong>g>the</str<strong>on</strong>g> ability of <str<strong>on</strong>g>the</str<strong>on</strong>g> police to solve <str<strong>on</strong>g>the</str<strong>on</strong>g> crime, especially those from <str<strong>on</strong>g>the</str<strong>on</strong>g> West<br />
Midlands (37.5%) and Scotland (36.3%). Almost <strong>on</strong>e-quarter of businesses resp<strong>on</strong>ding did not feel that<br />
<str<strong>on</strong>g>the</str<strong>on</strong>g> crime committed was serious enough (24.4%) and a signifi cant number felt that <str<strong>on</strong>g>the</str<strong>on</strong>g> police would<br />
not take <str<strong>on</strong>g>the</str<strong>on</strong>g> issue seriously (22.9%). Almost <strong>on</strong>e in fi ve of resp<strong>on</strong>dents felt that <str<strong>on</strong>g>the</str<strong>on</strong>g>y would not make an<br />
insurance claim (19.5%) in regard to <str<strong>on</strong>g>the</str<strong>on</strong>g> crime committed.<br />
Reporting Crime – Urban/Rural<br />
Vandalism<br />
Graffi ti<br />
Vehicle <str<strong>on</strong>g>the</str<strong>on</strong>g>ft<br />
Vehicle damage<br />
Threatening behaviour/intimidati<strong>on</strong><br />
Shoplifting<br />
Fly tipping<br />
Ars<strong>on</strong><br />
Burglary<br />
Robbery<br />
Assault <strong>on</strong> owners/staff<br />
Employee fraud<br />
Employee <str<strong>on</strong>g>the</str<strong>on</strong>g>ft<br />
Cheque fraud<br />
Credit card fraud<br />
E-crime<br />
Identity fraud<br />
O<str<strong>on</strong>g>the</str<strong>on</strong>g>r<br />
0.0% 5.0% 10.0% 15.0% 20.0% 25.0% 30.0% 35.0%<br />
An analysis of rural and urban businesses, however, revealed that, overall, urban businesses were more<br />
likely to report crime than rural businesses (47.1% compared with 40.5%). In some areas of crime<br />
reported (see Figure 6), such as burglary and credit card fraud, <str<strong>on</strong>g>the</str<strong>on</strong>g> fi ndings are that both rural and urban<br />
reported similar crime levels. Vandalism, vehicle damage, threatening behaviour, graffi ti, and shoplifting<br />
dominated <str<strong>on</strong>g>the</str<strong>on</strong>g> fi ndings for both rural and urban businesses.<br />
page 14 lifting <str<strong>on</strong>g>the</str<strong>on</strong>g> barriers to growth in UK small businesses 2008
Figure 7<br />
Average cost of<br />
crime over past<br />
year by regi<strong>on</strong><br />
/ country<br />
<str<strong>on</strong>g>Putting</str<strong>on</strong>g> <str<strong>on</strong>g>the</str<strong>on</strong>g> <str<strong>on</strong>g>ec<strong>on</strong>omy</str<strong>on</strong>g> <str<strong>on</strong>g>back</str<strong>on</strong>g> <strong>on</strong> <strong>track</strong> <strong>Crimes</strong> <strong>Against</strong> <strong>Business</strong><br />
The Cost and Effect of Crime<br />
North East<br />
East Midlands<br />
South West<br />
L<strong>on</strong>d<strong>on</strong><br />
West Midlands<br />
South East<br />
East of England<br />
England<br />
North West<br />
Yorkshire & Humber<br />
Wales<br />
Scotland<br />
Nor<str<strong>on</strong>g>the</str<strong>on</strong>g>rn Ireland<br />
£1,192<br />
£1,938<br />
£2,320<br />
£4,9091<br />
£5,742<br />
£6,606<br />
£8,022<br />
£8,215<br />
£21,256<br />
£25,108<br />
£30,197<br />
£41,255<br />
£76,715<br />
£0 £10,000 £20,000 £30,000 £40,000 £50,000 £60,000 £70,000 £80,000 £90,000<br />
The average cost of crime was £13,354 per UK business. There are very large differences in <str<strong>on</strong>g>the</str<strong>on</strong>g><br />
average cost of crime for businesses in different regi<strong>on</strong>s (see Figure 7). It is clearly evident that <str<strong>on</strong>g>the</str<strong>on</strong>g><br />
average cost of crime in Nor<str<strong>on</strong>g>the</str<strong>on</strong>g>rn Ireland was much higher than in <str<strong>on</strong>g>the</str<strong>on</strong>g> rest of <str<strong>on</strong>g>the</str<strong>on</strong>g> sampled regi<strong>on</strong>s and<br />
countries. It must be noted, however, that a very small number of crimes accounted for much of <str<strong>on</strong>g>the</str<strong>on</strong>g><br />
overall cost of crime, distorting <str<strong>on</strong>g>the</str<strong>on</strong>g> averages for <str<strong>on</strong>g>the</str<strong>on</strong>g> regi<strong>on</strong>s in which <str<strong>on</strong>g>the</str<strong>on</strong>g>se crimes took place. With <str<strong>on</strong>g>the</str<strong>on</strong>g><br />
current ec<strong>on</strong>omic down-turn being experienced by UK businesses, however, <str<strong>on</strong>g>the</str<strong>on</strong>g> cost of crime as a total<br />
proporti<strong>on</strong> of a small-business owners’ effort in running a business should not be overlooked or ignored.<br />
Owning a business has its trials and tribulati<strong>on</strong>s, and in most cases <str<strong>on</strong>g>the</str<strong>on</strong>g> ec<strong>on</strong>omic impact of crime is<br />
minor. Crime can, however, be an extremely upsetting and stressful experience for <str<strong>on</strong>g>the</str<strong>on</strong>g> victim.<br />
Unsurprisingly, <str<strong>on</strong>g>the</str<strong>on</strong>g>refore, many businesses c<strong>on</strong>tinued to follow <str<strong>on</strong>g>the</str<strong>on</strong>g> trend of <str<strong>on</strong>g>the</str<strong>on</strong>g> 2006 FSB survey by<br />
increasing security measures. Across <str<strong>on</strong>g>the</str<strong>on</strong>g> UK <str<strong>on</strong>g>the</str<strong>on</strong>g> 2008 survey found that 27.6% of businesses had installed<br />
extra security alarms and 13.6% of resp<strong>on</strong>dents had installed additi<strong>on</strong>al or upgraded security systems.<br />
In resp<strong>on</strong>se to <str<strong>on</strong>g>the</str<strong>on</strong>g> often increased levels of crime, many businesses also increased <str<strong>on</strong>g>the</str<strong>on</strong>g>ir level of CCTV<br />
security (16.4%). In additi<strong>on</strong>, a relatively signifi cant percentage of businesses sought additi<strong>on</strong>al advice<br />
from <str<strong>on</strong>g>the</str<strong>on</strong>g> police (13.8%). The resp<strong>on</strong>ses also varied by sector. The motor vehicle sales and repair sector<br />
were most likely to have installed or upgraded security alarms toge<str<strong>on</strong>g>the</str<strong>on</strong>g>r with those from <str<strong>on</strong>g>the</str<strong>on</strong>g> wholesale<br />
and retail (35.6%) sectors. Only <str<strong>on</strong>g>the</str<strong>on</strong>g> hotel and restaurants and wholesale and retail sectors seemed to be<br />
using, or setting up, <strong>Business</strong> Watch schemes (9.2% & 7.0% respectively) to any degree.<br />
lifting <str<strong>on</strong>g>the</str<strong>on</strong>g> barriers to growth in UK small businesses 2008 page 15
Figure 8<br />
Effectiveness<br />
of crimereducti<strong>on</strong><br />
methods (1 =<br />
not effective - 5<br />
= very<br />
effective) by<br />
sector<br />
■ Neighbourhood<br />
Policing<br />
Units / Police<br />
Community<br />
Support<br />
Offi cers<br />
■ Tougher<br />
sentencing<br />
■ ASBOs<br />
(anti-social<br />
behaviour<br />
orders)<br />
■ Private security<br />
guard / patrol<br />
■ CCTV<br />
surveillance<br />
■ Grant assistance<br />
for security<br />
■ Faster police<br />
resp<strong>on</strong>se<br />
■ More visible<br />
police presence<br />
■ Crime and<br />
Disorder<br />
Reducti<strong>on</strong><br />
Partnership /<br />
<strong>Business</strong> Crime<br />
partnership<br />
■ <strong>Business</strong> Watch<br />
/ Shop Watch<br />
■ Crime<br />
preventi<strong>on</strong><br />
advice<br />
<str<strong>on</strong>g>Putting</str<strong>on</strong>g> <str<strong>on</strong>g>the</str<strong>on</strong>g> <str<strong>on</strong>g>ec<strong>on</strong>omy</str<strong>on</strong>g> <str<strong>on</strong>g>back</str<strong>on</strong>g> <strong>on</strong> <strong>track</strong> <strong>Crimes</strong> <strong>Against</strong> <strong>Business</strong><br />
The Effectiveness of Crime-Reducti<strong>on</strong> Methods<br />
40.0<br />
35.0<br />
30.0<br />
25.0<br />
20.0<br />
15.0<br />
10.0<br />
5.0<br />
0.0<br />
3.6<br />
4.2<br />
2.2<br />
3.3<br />
3.7<br />
3.7<br />
4.2<br />
4.0<br />
2.6<br />
2.7<br />
2.9<br />
Agriculture, forestry & fi shing<br />
3.3<br />
4.1<br />
1.9<br />
3.0<br />
3.6<br />
3.4<br />
4.0<br />
3.8<br />
2.2<br />
2.4<br />
2.5<br />
Mining & c<strong>on</strong>structi<strong>on</strong><br />
3.5<br />
4.2<br />
1.8<br />
3.4<br />
3.6<br />
3.7<br />
4.1<br />
4.0<br />
2.0<br />
2.4<br />
2.6<br />
Manufacturing<br />
3.2<br />
4.1<br />
2.0<br />
3.0<br />
3.8<br />
3.6<br />
4.1<br />
4.0<br />
2.2<br />
2.6<br />
2.6<br />
Transport, communicati<strong>on</strong>s & utilities<br />
3.5<br />
4.2<br />
1.8<br />
3.2<br />
3.8<br />
4.0<br />
4.1<br />
4.1<br />
2.0<br />
2.2<br />
2.4<br />
Motor vehicle sales and repair<br />
3.6<br />
4.1<br />
2.2<br />
2.7<br />
3.8<br />
3.8<br />
4.2<br />
4.1<br />
2.6<br />
2.9<br />
2.7<br />
Hotels & restaurants<br />
It is evident from Figure 8 that <str<strong>on</strong>g>the</str<strong>on</strong>g> percepti<strong>on</strong> of <str<strong>on</strong>g>the</str<strong>on</strong>g> resp<strong>on</strong>dents to this survey was that crimereducti<strong>on</strong><br />
methods were not tackling <str<strong>on</strong>g>the</str<strong>on</strong>g> problem to any signifi cant degree. Across <str<strong>on</strong>g>the</str<strong>on</strong>g> majority of<br />
sectors, faster police resp<strong>on</strong>se and tougher sentencing were perceived to be <str<strong>on</strong>g>the</str<strong>on</strong>g> most effective methods<br />
of tackling crime. Increased levels of CCTV were also c<strong>on</strong>sidered by many sectors to act as an effective<br />
measure in reducing crime levels. In additi<strong>on</strong>, most sectors also c<strong>on</strong>sidered Neighbourhood Policing<br />
Units to be a fairly effective method of tackling crime. The survey has also found that all sectors<br />
believed that a Grant Assistance Initiative for increasing <str<strong>on</strong>g>the</str<strong>on</strong>g> levels of security for businesses would be of<br />
value. This measure, of course, may also have <str<strong>on</strong>g>the</str<strong>on</strong>g> effect of increasing <str<strong>on</strong>g>the</str<strong>on</strong>g> business’ rateable value, which<br />
raises a sec<strong>on</strong>dary issue of whe<str<strong>on</strong>g>the</str<strong>on</strong>g>r <str<strong>on</strong>g>the</str<strong>on</strong>g> amount by which <str<strong>on</strong>g>the</str<strong>on</strong>g> business’ rateable value is increased should<br />
be discounted, in order to encourage take-up of Grant Assistance Initiatives. Small fi rms’ percepti<strong>on</strong> of<br />
crime-reducti<strong>on</strong> initiatives should be of particular c<strong>on</strong>cern to government, specifi cally <str<strong>on</strong>g>the</str<strong>on</strong>g> ineffectiveness<br />
of crime-reducti<strong>on</strong> initiatives, and whe<str<strong>on</strong>g>the</str<strong>on</strong>g>r <str<strong>on</strong>g>the</str<strong>on</strong>g>y are perceived as something small businesses do not<br />
need to be involved with because <str<strong>on</strong>g>the</str<strong>on</strong>g>y are seen as a waste of time and resources.<br />
page 16 lifting <str<strong>on</strong>g>the</str<strong>on</strong>g> barriers to growth in UK small businesses 2008<br />
3.2<br />
3.9<br />
1.7<br />
2.7<br />
3.4<br />
3.3<br />
4.1<br />
4.0<br />
2.1<br />
2.5<br />
2.6<br />
Financial, insurance & real estate<br />
3.4<br />
3.8<br />
1.8<br />
3.0<br />
3.4<br />
3.4<br />
4.0<br />
3.9<br />
2.2<br />
2.5<br />
2.8<br />
<strong>Business</strong> services<br />
3.7<br />
3.7<br />
2.1<br />
3.0<br />
3.7<br />
3.6<br />
4.1<br />
4.0<br />
2.5<br />
2.9<br />
3.0<br />
Health, educati<strong>on</strong> & social services<br />
3.5<br />
4.1<br />
2.0<br />
3.1<br />
3.7<br />
3.8<br />
4.1<br />
4.0<br />
2.4<br />
2.5<br />
2.7<br />
C<strong>on</strong>sumer & pers<strong>on</strong>al services<br />
3.6<br />
4.2<br />
2.2<br />
3.1<br />
3.8<br />
3.8<br />
4.1<br />
4.1<br />
2.5<br />
3.0<br />
2.7<br />
Wholesale & retail<br />
3.6<br />
3.6<br />
3.6<br />
3.6<br />
3.6<br />
3.6<br />
3.6<br />
3.6<br />
3.6<br />
3.6<br />
3.6<br />
O<str<strong>on</strong>g>the</str<strong>on</strong>g>r/uncodeable
10 See Tables 11 and 12 in<br />
appendix. Neighbourhood<br />
Policing Units operate in<br />
England and Wales <strong>on</strong>ly<br />
<str<strong>on</strong>g>Putting</str<strong>on</strong>g> <str<strong>on</strong>g>the</str<strong>on</strong>g> <str<strong>on</strong>g>ec<strong>on</strong>omy</str<strong>on</strong>g> <str<strong>on</strong>g>back</str<strong>on</strong>g> <strong>on</strong> <strong>track</strong> <strong>Crimes</strong> <strong>Against</strong> <strong>Business</strong><br />
It is also clear that many owners do not c<strong>on</strong>sider that <str<strong>on</strong>g>the</str<strong>on</strong>g> criminal justice system is achieving<br />
positive results, which may of course seriously reduce <str<strong>on</strong>g>the</str<strong>on</strong>g> actual amount of crime being reported<br />
across all sectors and regi<strong>on</strong>s. Initiatives such as Crime and Disorder Reducti<strong>on</strong> Partnerships (CDRPs)<br />
are often viewed by business as ineffective. Indeed, Figure 8 indicates that <str<strong>on</strong>g>the</str<strong>on</strong>g> view that CDRPs<br />
actually assisting in crime reducti<strong>on</strong> is fairly rare across all sectors, as <str<strong>on</strong>g>the</str<strong>on</strong>g>y are viewed by members<br />
as having less potential impact up<strong>on</strong> <str<strong>on</strong>g>the</str<strong>on</strong>g> reducti<strong>on</strong> of crime than current initiatives such as<br />
<strong>Business</strong> Watch/Shop Watch schemes. These fi gures are surprising, as government aims to increase<br />
<str<strong>on</strong>g>the</str<strong>on</strong>g> level of spending <strong>on</strong> CDRPs in <str<strong>on</strong>g>the</str<strong>on</strong>g> near future.<br />
Special Focus - Neighbourhood Policing Units<br />
The survey results in respect of Neighbourhood Policing Units (NPUs) 10 showed that, overall, around<br />
67% of <str<strong>on</strong>g>the</str<strong>on</strong>g> businesses surveyed were not aware that NPUs exist. In additi<strong>on</strong>, whilst around 7%<br />
of businesses had been c<strong>on</strong>tacted by <str<strong>on</strong>g>the</str<strong>on</strong>g> NPU liais<strong>on</strong> offi cer, <strong>on</strong>ly 3.9% have regular c<strong>on</strong>tact<br />
with <str<strong>on</strong>g>the</str<strong>on</strong>g>ir NPU. Of those who commented <strong>on</strong> <str<strong>on</strong>g>the</str<strong>on</strong>g>ir percepti<strong>on</strong> of <str<strong>on</strong>g>the</str<strong>on</strong>g> effectiveness of NPUs, opini<strong>on</strong><br />
was more or less equally divided, and 10.5% of businesses believed <str<strong>on</strong>g>the</str<strong>on</strong>g>re was no NPU in <str<strong>on</strong>g>the</str<strong>on</strong>g>ir<br />
area. This is of c<strong>on</strong>cern, as previous results indicated that many sectors felt that NPUs could be<br />
effective as a crime-reducti<strong>on</strong> method.<br />
The sector with <str<strong>on</strong>g>the</str<strong>on</strong>g> highest percentage of NPU’s in <str<strong>on</strong>g>the</str<strong>on</strong>g>ir area was health, educati<strong>on</strong> and social services<br />
(Only 6.8% with no NPU). This sector also scored <str<strong>on</strong>g>the</str<strong>on</strong>g> lowest in believing that NPUs are ineffective<br />
(2.5%). Their scores were near average in o<str<strong>on</strong>g>the</str<strong>on</strong>g>r areas. The sector least aware of NPUs was <str<strong>on</strong>g>the</str<strong>on</strong>g> mining<br />
and c<strong>on</strong>structi<strong>on</strong> industry (72%) closely followed by motor vehicle sales and repair (71.6%), agriculture,<br />
forestry and fi shing (71.3%) and manufacturing (70.5%). The hotels and restaurants sector was <str<strong>on</strong>g>the</str<strong>on</strong>g><br />
most aware of NPUs (though 60.8% were not aware) and had <str<strong>on</strong>g>the</str<strong>on</strong>g> highest percentage of regular<br />
c<strong>on</strong>tact with <str<strong>on</strong>g>the</str<strong>on</strong>g>ir local units. Interestingly, however, <str<strong>on</strong>g>the</str<strong>on</strong>g>y were also <str<strong>on</strong>g>the</str<strong>on</strong>g> third-highest sector with no<br />
NPU in <str<strong>on</strong>g>the</str<strong>on</strong>g>ir area (15.4%). The <strong>on</strong>ly o<str<strong>on</strong>g>the</str<strong>on</strong>g>r sectors with higher scores in this regard were agriculture,<br />
forestry and fi sheries (19.3%), and motor vehicle sales and repair (19.7%), both of which tend to<br />
operate in rural, or at least, n<strong>on</strong> residential areas.<br />
Looking into this, <str<strong>on</strong>g>the</str<strong>on</strong>g> results in respect of urban/rural businesses in particular were similar in most<br />
regards, with 66.3% of urban businesses being unaware of NPUs, as opposed to 68.6% of rural<br />
businesses. The results for most of <str<strong>on</strong>g>the</str<strong>on</strong>g> o<str<strong>on</strong>g>the</str<strong>on</strong>g>r questi<strong>on</strong>s were near average. The excepti<strong>on</strong> was <str<strong>on</strong>g>the</str<strong>on</strong>g><br />
number of businesses with no NPU in <str<strong>on</strong>g>the</str<strong>on</strong>g>ir area. The results for <str<strong>on</strong>g>the</str<strong>on</strong>g> rural businesses were notably<br />
higher, with 13.8% having no local NPU, as opposed to 9.2% of urban businesses.<br />
Of <str<strong>on</strong>g>the</str<strong>on</strong>g> regi<strong>on</strong>s surveyed, <str<strong>on</strong>g>the</str<strong>on</strong>g> least aware of NPUs was <str<strong>on</strong>g>the</str<strong>on</strong>g> East Midlands (73.1%). The North East<br />
also scored above 70%. The most aware by far was L<strong>on</strong>d<strong>on</strong>, with <strong>on</strong>ly 54.1% not aware. The types of<br />
premises least aware of NPUs were warehouses/factories (71.1%). They also reported above average<br />
for having no NPUs in <str<strong>on</strong>g>the</str<strong>on</strong>g>ir area (13.2%). Unsurprisingly, retail/shop premises were <str<strong>on</strong>g>the</str<strong>on</strong>g> most aware<br />
(61.9% not aware). They also scored <str<strong>on</strong>g>the</str<strong>on</strong>g> highest for having been c<strong>on</strong>tacted by <str<strong>on</strong>g>the</str<strong>on</strong>g>ir liais<strong>on</strong> offi cer<br />
(12.6%) and for having regular c<strong>on</strong>tact with <str<strong>on</strong>g>the</str<strong>on</strong>g>ir local NPU (7.5%). They also scored <str<strong>on</strong>g>the</str<strong>on</strong>g> highest<br />
for believing that NPUs are effective (10.6%), though 8.1% believed that <str<strong>on</strong>g>the</str<strong>on</strong>g>y were ineffective<br />
(average 6%).<br />
Finally, as far as business size is c<strong>on</strong>cerned, owner-<strong>on</strong>ly businesses had <str<strong>on</strong>g>the</str<strong>on</strong>g> highest percentage not<br />
aware of NPUs (68.6%). The percentage decreased corresp<strong>on</strong>dingly as employee numbers increased,<br />
with businesses of 20 or more employees having <str<strong>on</strong>g>the</str<strong>on</strong>g> lowest score (64.9%).<br />
Overall, this highlights a clear problem for NPUs in that 60–70% of small businesses are not<br />
even aware of <str<strong>on</strong>g>the</str<strong>on</strong>g>ir existence. This is a c<strong>on</strong>sistent problem across sectors, regi<strong>on</strong>s and fi rm types.<br />
Of equal c<strong>on</strong>cern is that even in <str<strong>on</strong>g>the</str<strong>on</strong>g> retail/shop premises type with most c<strong>on</strong>tact, <strong>on</strong>ly around 1 in 8<br />
reported having had c<strong>on</strong>tact and 1 in 14 had regular c<strong>on</strong>tact. This suggests that <str<strong>on</strong>g>the</str<strong>on</strong>g> NPU initiative has<br />
a major task ahead if it is to c<strong>on</strong>nect with small business.<br />
lifting <str<strong>on</strong>g>the</str<strong>on</strong>g> barriers to growth in UK small businesses 2008 page 17
<str<strong>on</strong>g>Putting</str<strong>on</strong>g> <str<strong>on</strong>g>the</str<strong>on</strong>g> <str<strong>on</strong>g>ec<strong>on</strong>omy</str<strong>on</strong>g> <str<strong>on</strong>g>back</str<strong>on</strong>g> <strong>on</strong> <strong>track</strong> <strong>Crimes</strong> <strong>Against</strong> <strong>Business</strong><br />
c<strong>on</strong>clusi<strong>on</strong>s<br />
This survey reveals that most businesses have experienced crime to at least some extent in <str<strong>on</strong>g>the</str<strong>on</strong>g> past<br />
year. Vandalism was <str<strong>on</strong>g>the</str<strong>on</strong>g> crime most comm<strong>on</strong>ly experienced and reported by all sectors and regi<strong>on</strong>s and<br />
c<strong>on</strong>tinues to be of significant importance to small businesses in <str<strong>on</strong>g>the</str<strong>on</strong>g> UK. The hotel and restaurant, motor<br />
vehicle sales and repair and transport, communicati<strong>on</strong>s and utilities sectors were particularly susceptible<br />
to this type of crime. The highest rates of crime above <str<strong>on</strong>g>the</str<strong>on</strong>g> UK average were experienced by firms in <str<strong>on</strong>g>the</str<strong>on</strong>g><br />
wholesale and retail, hotel and restaurant and transport, communicati<strong>on</strong>s and utilities sectors. The most<br />
susceptible regi<strong>on</strong>s to <str<strong>on</strong>g>the</str<strong>on</strong>g> various types of fraud and e-crime were Nor<str<strong>on</strong>g>the</str<strong>on</strong>g>rn Ireland and Scotland.<br />
A c<strong>on</strong>trast clearly exists between <str<strong>on</strong>g>the</str<strong>on</strong>g> experiencing and reporting of crime, with <strong>on</strong>ly 45% of firms that<br />
experienced a crime actually reporting at least <strong>on</strong>e of <str<strong>on</strong>g>the</str<strong>on</strong>g>se instances. <strong>Business</strong>es regarded certain<br />
types of crime as more worthy of reporting to <str<strong>on</strong>g>the</str<strong>on</strong>g> police but not all crime experienced was reported.<br />
For example, burglary was <str<strong>on</strong>g>the</str<strong>on</strong>g> sixth most experienced crime by businesses, but <strong>on</strong>ly <str<strong>on</strong>g>the</str<strong>on</strong>g> sec<strong>on</strong>d most<br />
reported. Vehicle <str<strong>on</strong>g>the</str<strong>on</strong>g>ft was <str<strong>on</strong>g>the</str<strong>on</strong>g> ninth most experienced but <str<strong>on</strong>g>the</str<strong>on</strong>g> fourth most reported. In additi<strong>on</strong>,<br />
robbery was <str<strong>on</strong>g>the</str<strong>on</strong>g> twelfth most experienced but <str<strong>on</strong>g>the</str<strong>on</strong>g> fifth most reported.<br />
The issue of loss due to crime should not be ignored or minimised. It is reas<strong>on</strong>able to assume, <strong>on</strong> an<br />
individual, case-by-case basis, that <str<strong>on</strong>g>the</str<strong>on</strong>g> cost of crime may <strong>on</strong> <str<strong>on</strong>g>the</str<strong>on</strong>g> surface seem fairly small, and this may<br />
indicate why many businesses do not report it. This, of course, should not be trivialised, as <str<strong>on</strong>g>the</str<strong>on</strong>g> cost to a<br />
very small business would be viewed as being significant and can often mean <str<strong>on</strong>g>the</str<strong>on</strong>g> difference between<br />
a small profit <strong>on</strong> <str<strong>on</strong>g>the</str<strong>on</strong>g> <strong>on</strong>e hand, and a yearly loss and in many cases significant increases in insurance<br />
premiums <strong>on</strong> <str<strong>on</strong>g>the</str<strong>on</strong>g> o<str<strong>on</strong>g>the</str<strong>on</strong>g>r. In additi<strong>on</strong> to this, however, it has been reported that small firms do not seem to<br />
have faith in <str<strong>on</strong>g>the</str<strong>on</strong>g> policing of crime or that <str<strong>on</strong>g>the</str<strong>on</strong>g> legal system will provide positive results. Indeed, it could<br />
be argued that many businesses do not see <str<strong>on</strong>g>the</str<strong>on</strong>g> benefits of reporting crime as <str<strong>on</strong>g>the</str<strong>on</strong>g> opportunity cost of<br />
having to deal with <str<strong>on</strong>g>the</str<strong>on</strong>g> legal system may not be viewed as productive. With many owners working<br />
between 60–80 hours per week, <str<strong>on</strong>g>the</str<strong>on</strong>g> reporting of crime may not be seen to provide any financial return or<br />
to prevent future crime from occurring.<br />
<strong>Business</strong>es in this survey regard faster police resp<strong>on</strong>se and tougher sentencing as <str<strong>on</strong>g>the</str<strong>on</strong>g> effective answers<br />
to crime reducti<strong>on</strong>. It is fair to say that initiatives such as Every Crime Every Time are a positive step in<br />
assisting in <str<strong>on</strong>g>the</str<strong>on</strong>g> reducti<strong>on</strong> of crime for small businesses in <str<strong>on</strong>g>the</str<strong>on</strong>g> UK.<br />
Across <str<strong>on</strong>g>the</str<strong>on</strong>g> UK, <str<strong>on</strong>g>the</str<strong>on</strong>g> survey also found that many businesses had installed extra security alarms, and<br />
additi<strong>on</strong>al or upgraded security systems. In resp<strong>on</strong>se to <str<strong>on</strong>g>the</str<strong>on</strong>g> increased levels of crime, many businesses<br />
had increased <str<strong>on</strong>g>the</str<strong>on</strong>g>ir level of CCTV security. In additi<strong>on</strong>, a relatively significant percentage of businesses<br />
sought additi<strong>on</strong>al advice from <str<strong>on</strong>g>the</str<strong>on</strong>g> police. The resp<strong>on</strong>ses also varied by sector. The motor vehicle sales<br />
and repair sector was most likely to have installed or upgraded security alarms, toge<str<strong>on</strong>g>the</str<strong>on</strong>g>r with those from<br />
<str<strong>on</strong>g>the</str<strong>on</strong>g> wholesale and retail (35.6%) sectors. Only <str<strong>on</strong>g>the</str<strong>on</strong>g> hotel and restaurant and wholesale and retail sectors<br />
seemed to be using, or setting up, <strong>Business</strong> Watch schemes to any degree.<br />
Finally, 67% of relevant business owners were not even aware of NPUs and <str<strong>on</strong>g>the</str<strong>on</strong>g> 2008 results show that<br />
<strong>on</strong>ly 7% of all businesses had been c<strong>on</strong>tacted by <str<strong>on</strong>g>the</str<strong>on</strong>g>ir local unit, <str<strong>on</strong>g>the</str<strong>on</strong>g> hotel and restaurant sector being<br />
most aware of this initiative. This suggests that <str<strong>on</strong>g>the</str<strong>on</strong>g> NPU has a job to do as far as engagement and<br />
c<strong>on</strong>necti<strong>on</strong> with small business are c<strong>on</strong>cerned.<br />
page 18 lifting <str<strong>on</strong>g>the</str<strong>on</strong>g> barriers to growth in UK small businesses 2008
<str<strong>on</strong>g>Putting</str<strong>on</strong>g> <str<strong>on</strong>g>the</str<strong>on</strong>g> <str<strong>on</strong>g>ec<strong>on</strong>omy</str<strong>on</strong>g> <str<strong>on</strong>g>back</str<strong>on</strong>g> <strong>on</strong> <strong>track</strong> <strong>Crimes</strong> <strong>Against</strong> <strong>Business</strong><br />
key policy recommendati<strong>on</strong>s<br />
• 64% of businesses are <str<strong>on</strong>g>the</str<strong>on</strong>g> victims of crime and <str<strong>on</strong>g>the</str<strong>on</strong>g>se crimes make up 20% or <str<strong>on</strong>g>the</str<strong>on</strong>g> ‘Forgotten Fifth’ of<br />
all recorded crime. All police forces must adopt a nati<strong>on</strong>al defi niti<strong>on</strong> for crimes against business and<br />
set targets for its reducti<strong>on</strong> through local policing plans. A local business crime-reducti<strong>on</strong> strategy<br />
agreed with <str<strong>on</strong>g>the</str<strong>on</strong>g> business community would set out how this should be achieved.<br />
• Local authorities should set local strategies and targets for reducing crimes against business through<br />
local structures such as Local Area Agreements (LAAs) and Local Strategic Partnerships (LSPs) which<br />
<str<strong>on</strong>g>the</str<strong>on</strong>g>n fi lter <str<strong>on</strong>g>the</str<strong>on</strong>g>ir priorities down to <str<strong>on</strong>g>the</str<strong>on</strong>g> work of Crime and Disorder Reducti<strong>on</strong> Partnerships (CDRPs).<br />
• <strong>Business</strong>es have a lack of faith that crime-reducti<strong>on</strong> measures such as Crime and Disorder Reducti<strong>on</strong><br />
Partnerships are able to deliver results for <str<strong>on</strong>g>the</str<strong>on</strong>g>m. CDRPs must engage directly with <str<strong>on</strong>g>the</str<strong>on</strong>g> business<br />
community in order to refl ect <str<strong>on</strong>g>the</str<strong>on</strong>g>ir c<strong>on</strong>cerns and work to address <str<strong>on</strong>g>the</str<strong>on</strong>g>ir issues at a local level.<br />
• Police authorities should include at least <strong>on</strong>e member from <str<strong>on</strong>g>the</str<strong>on</strong>g> business community or an individual<br />
who can speak <strong>on</strong> behalf of <str<strong>on</strong>g>the</str<strong>on</strong>g> business community and c<strong>on</strong>sult, ei<str<strong>on</strong>g>the</str<strong>on</strong>g>r formally or informally, in<br />
order to refl ect businesses’ views.<br />
• Police forces must make crime reporting easier by providing an easy-access <strong>on</strong>line reporting<br />
mechanism for crime.<br />
• <strong>Business</strong>es have some faith in Neighbourhood Policing Units (NPUs) to deliver <strong>on</strong> local issues but it<br />
is hugely important that NPUs engage directly with businesses, to seek <str<strong>on</strong>g>the</str<strong>on</strong>g>ir views <strong>on</strong> local priorities<br />
and to ga<str<strong>on</strong>g>the</str<strong>on</strong>g>r intelligence <strong>on</strong> <str<strong>on</strong>g>the</str<strong>on</strong>g> local area.<br />
References<br />
1. http://www.axa.co.uk/media/pressreleases/2007/pr20070314_1100.html<br />
2. http://www.britishchambers.org.uk/6798219243143333651/crime.html2<br />
lifting <str<strong>on</strong>g>the</str<strong>on</strong>g> barriers to growth in UK small businesses 2008 page 19
Table 1<br />
Average of<br />
overall cost of<br />
crime over <str<strong>on</strong>g>the</str<strong>on</strong>g><br />
last two years<br />
Table 2<br />
Percentages<br />
of overall cost<br />
of crime to<br />
business in<br />
last year (eight<br />
categories)<br />
<str<strong>on</strong>g>Putting</str<strong>on</strong>g> <str<strong>on</strong>g>the</str<strong>on</strong>g> <str<strong>on</strong>g>ec<strong>on</strong>omy</str<strong>on</strong>g> <str<strong>on</strong>g>back</str<strong>on</strong>g> <strong>on</strong> <strong>track</strong> <strong>Crimes</strong> <strong>Against</strong> <strong>Business</strong><br />
annex of tables<br />
Cost of<br />
crime<br />
N<br />
North East £1,192 83<br />
North West £21,256 412<br />
Yorkshire & Humber £25,108 347<br />
East Midlands £1,938 345<br />
West Midlands £5,742 358<br />
East of England £8,022 473<br />
L<strong>on</strong>d<strong>on</strong> £4,991 145<br />
South East £6,606 812<br />
South West £2,320 791<br />
England £8,215 3997<br />
Wales £30,197 192<br />
Scotland £41,255 350<br />
Nor<str<strong>on</strong>g>the</str<strong>on</strong>g>rn Ireland £76,715 119<br />
UK £13,354 4658<br />
£0<br />
£1 to £100<br />
£101 to<br />
£500<br />
page 20 lifting <str<strong>on</strong>g>the</str<strong>on</strong>g> barriers to growth in UK small businesses 2008<br />
£501 to<br />
£1,000<br />
£1,001 to<br />
£2,500<br />
£2,501 to<br />
£5,000<br />
£5,001 to<br />
£10,000<br />
North East 31.3 10.8 25.3 13.3 7.2 3.6 8.4 0.0<br />
North West 27.7 10.2 18.0 12.6 10.9 8.7 6.3 5.6<br />
Yorkshire & Humber 28.0 11.8 21.0 15.0 9.2 6.9 6.1 2.0<br />
East Midlands 27.2 7.5 22.6 16.2 11.0 7.8 4.9 2.6<br />
West Midlands 24.9 9.8 21.8 11.7 8.7 10.6 5.6 7.0<br />
East of England 35.3 12.5 16.3 12.1 7.8 5.3 3.8 7.0<br />
L<strong>on</strong>d<strong>on</strong> 32.4 9.0 18.6 7.6 11.0 12.4 5.5 3.4<br />
South East 32.0 10.5 19.6 11.3 10.1 9.1 3.3 4.1<br />
South West 30.6 12.6 23.4 11.1 9.1 7.7 2.7 2.8<br />
England 30.3 10.7 20.4 12.2 9.4 8.4 4.4 4.3<br />
Wales 24.0 12.0 15.6 6.8 6.3 9.9 4.2 21.4<br />
Scotland 20.9 10.9 20.9 8.9 5.1 4.9 4.6 24.0<br />
Nor<str<strong>on</strong>g>the</str<strong>on</strong>g>rn Ireland 28.6 5.9 16.8 10.9 4.2 9.2 3.4 21.0<br />
UK 29.3 10.6 20.1 11.7 8.8 8.2 4.3 6.9<br />
More than<br />
£10,000
Table 3<br />
Percentage<br />
of members<br />
experiencing a<br />
crime by sector<br />
Table 4<br />
Percentage<br />
of members<br />
experiencing<br />
a crime by<br />
sector (Table 3<br />
c<strong>on</strong>tinued)<br />
<str<strong>on</strong>g>Putting</str<strong>on</strong>g> <str<strong>on</strong>g>the</str<strong>on</strong>g> <str<strong>on</strong>g>ec<strong>on</strong>omy</str<strong>on</strong>g> <str<strong>on</strong>g>back</str<strong>on</strong>g> <strong>on</strong> <strong>track</strong> <strong>Crimes</strong> <strong>Against</strong> <strong>Business</strong><br />
Vandalism<br />
Graffi ti<br />
Vehicle <str<strong>on</strong>g>the</str<strong>on</strong>g>ft<br />
lifting <str<strong>on</strong>g>the</str<strong>on</strong>g> barriers to growth in UK small businesses 2008 page 21<br />
Vehicle damage<br />
Threatening<br />
behaviour<br />
Agriculture, Forestry & Fishing 38.0 31.4 33.3 34.1 32.2 29.5 37.2 27.9 35.3<br />
Mining & C<strong>on</strong>structi<strong>on</strong> 41.8 35.3 35.0 42.5 35.4 29.0 33.1 29.4 36.2<br />
Manufacturing 41.6 33.0 29.2 35.0 31.7 27.6 33.9 25.8 35.1<br />
Transport, Communicati<strong>on</strong>s &<br />
Utilities<br />
46.7 32.7 35.3 47.4 38.6 30.6 32.3 28.0 33.8<br />
Motor Vehicle Sales and Repair 48.7 35.0 41.6 47.8 35.0 36.3 35.0 28.8 37.6<br />
Hotels & Restaurants 53.0 36.9 29.5 38.1 45.3 33.6 31.5 27.7 34.8<br />
Financial, Insurance & Real<br />
Estate<br />
36.0 30.8 23.4 28.1 29.3 22.8 25.1 21.0 24.6<br />
<strong>Business</strong> Services 30.1 26.6 25.7 31.2 26.6 22.9 25.3 22.2 25.1<br />
Health, Educati<strong>on</strong> & Social<br />
Services<br />
39.2 31.9 26.5 30.2 30.8 24.3 23.9 22.8 27.1<br />
C<strong>on</strong>sumer & Pers<strong>on</strong>al Services 42.3 34.8 27.9 35.2 37.3 31.5 28.1 25.4 29.6<br />
Wholesale & Retail 43.8 34.4 26.9 33.5 36.9 49.1 29.4 23.9 29.4<br />
UK 40.8 32.7 29.2 35.7 34.1 32.1 29.6 25.2 30.8<br />
Robbery<br />
Assault <strong>on</strong><br />
owners/<br />
Employee fraud<br />
Employee <str<strong>on</strong>g>the</str<strong>on</strong>g>ft<br />
Cheque fraud<br />
Shoplifting<br />
Fly tipping<br />
Credit-card<br />
fraud<br />
Agriculture, Forestry & Fishing 31.4 25.6 28.3 28.3 28.7 27.5 26.0 26.7<br />
Mining & C<strong>on</strong>structi<strong>on</strong> 32.7 29.4 30.9 33.1 30.7 33.4 29.8 30.5<br />
Manufacturing 29.2 25.6 27.6 29.3 26.5 28.0 26.3 25.7<br />
Transport, Communicati<strong>on</strong>s &<br />
Utilities<br />
28.0 28.5 30.1 31.2 31.8 32.3 28.5 27.6<br />
Motor Vehicle Sales and Repair 32.7 27.9 29.6 31.9 35.8 30.5 27.4 27.4<br />
Hotels & Restaurants 30.6 31.8 32.5 36.6 31.8 31.1 28.0 27.3<br />
Financial, Insurance & Real Estate 22.0 21.4 24.4 24.2 25.1 22.2 22.6 22.6<br />
<strong>Business</strong> Services 23.1 22.4 23.6 24.5 23.9 28.3 24.5 23.4<br />
Health, Educati<strong>on</strong> & Social Services 24.7 23.6 23.9 25.4 25.4 26.2 23.2 22.8<br />
C<strong>on</strong>sumer & Pers<strong>on</strong>al Services 27.5 25.6 27.5 31.0 29.8 27.9 25.6 25.0<br />
Wholesale & Retail 26.5 24.7 26.8 29.1 32.7 31.2 26.1 24.7<br />
UK 27.4 25.7 27.3 29.1 29.0 29.6 26.3 25.6<br />
Ars<strong>on</strong><br />
E-crime<br />
Burglary<br />
Identify fraud
Table 5<br />
Percentages<br />
by regi<strong>on</strong><br />
experiencing<br />
a crime by<br />
regi<strong>on</strong> and<br />
country<br />
Table 6<br />
Percentages<br />
by regi<strong>on</strong><br />
experiencing<br />
a crime by<br />
regi<strong>on</strong> and<br />
country (Table<br />
5 c<strong>on</strong>tinued)<br />
<str<strong>on</strong>g>Putting</str<strong>on</strong>g> <str<strong>on</strong>g>the</str<strong>on</strong>g> <str<strong>on</strong>g>ec<strong>on</strong>omy</str<strong>on</strong>g> <str<strong>on</strong>g>back</str<strong>on</strong>g> <strong>on</strong> <strong>track</strong> <strong>Crimes</strong> <strong>Against</strong> <strong>Business</strong><br />
Robbery<br />
Vandalism<br />
Assault <strong>on</strong> owners/<br />
staff<br />
Graffiti<br />
Employee fraud<br />
Vehicle <str<strong>on</strong>g>the</str<strong>on</strong>g>ft<br />
North East 29.4 28.8 30.7 30.7 32.0 30.7 28.8 28.1 25.5<br />
North West 27.6 25.7 27.5 28.7 27.8 29.4 25.2 25.1 21.7<br />
Yorkshire & Humber 26.9 24.4 26.4 28.2 28.5 28.7 26.3 25.7 19.9<br />
East Midlands 29.2 27.1 29.5 30.3 30.3 31.2 27.4 25.9 23.1<br />
West Midlands 28.0 25.4 27.7 30.5 29.6 29.3 26.3 25.4 23.4<br />
East of England 23.6 23.6 24.6 26.0 27.0 26.8 23.0 22.6 20.8<br />
L<strong>on</strong>d<strong>on</strong> 29.6 27.5 26.3 30.4 32.5 30.4 27.9 27.9 21.7<br />
South East 25.3 23.7 25.5 27.5 26.9 28.7 24.7 24.4 20.6<br />
South West 26.9 25.6 26.8 27.9 28.2 29.0 25.9 25.5 22.5<br />
England 26.5 25.0 26.6 28.2 28.0 28.8 25.5 25.0 21.7<br />
Wales 28.5 25.1 27.7 29.0 29.5 27.7 26.7 23.8 22.3<br />
Scotland 30.9 29.1 30.2 32.8 31.9 33.4 30.2 29.9 25.5<br />
Nor<str<strong>on</strong>g>the</str<strong>on</strong>g>rn Ireland 29.9 26.4 30.3 32.9 36.8 29.9 26.0 25.1 23.8<br />
UK 27.1 25.5 27.1 28.8 28.7 29.2 26.0 25.4 22.2<br />
Employee <str<strong>on</strong>g>the</str<strong>on</strong>g>ft<br />
page 22 lifting <str<strong>on</strong>g>the</str<strong>on</strong>g> barriers to growth in UK small businesses 2008<br />
Vehicle damage<br />
Threatening<br />
behaviour<br />
North East 40.5 34.0 29.4 35.9 34.6 33.3 34.0 26.8 31.4<br />
North West 42.3 34.0 30.2 36.8 34.8 31.8 29.9 24.9 31.5<br />
Yorkshire & Humber 44.6 35.1 30.6 38.2 34.7 32.8 29.2 25.0 31.3<br />
East Midlands 41.5 33.6 31.6 36.6 34.2 31.6 30.6 27.1 32.1<br />
West Midlands 40.4 30.8 29.7 33.7 34.1 32.2 29.0 25.1 33.3<br />
East of England 35.6 29.8 25.5 31.3 30.4 28.9 28.0 22.3 28.8<br />
L<strong>on</strong>d<strong>on</strong> 41.3 38.8 29.6 38.8 41.3 31.3 30.0 26.3 34.6<br />
South East 37.9 30.3 27.1 34.1 32.1 29.2 27.4 23.4 28.2<br />
South West 39.7 30.2 27.8 35.5 32.9 31.7 29.1 24.9 29.8<br />
England 39.6 31.7 28.4 34.9 33.1 30.8 28.9 24.5 30.2<br />
Wales 42.1 32.1 30.8 34.1 32.3 33.3 29.2 24.9 30.3<br />
Scotland 44.7 37.7 31.9 39.1 38.4 37.9 33.8 29.1 33.2<br />
Nor<str<strong>on</strong>g>the</str<strong>on</strong>g>rn Ireland 45.9 38.1 31.6 34.2 39.8 39.0 29.0 25.5 32.0<br />
UK 40.4 32.5 28.9 35.3 33.7 31.8 29.3 25.0 30.5<br />
Cheque fraud<br />
Shoplifting<br />
Credit-card fraud<br />
Fly tipping<br />
E-crime<br />
Ars<strong>on</strong><br />
Identify fraud<br />
Burglary<br />
O<str<strong>on</strong>g>the</str<strong>on</strong>g>r
Table 7<br />
Percentage<br />
of businesses<br />
reporting a<br />
crime by sector<br />
Table 8<br />
Percentage<br />
of businesses<br />
reporting<br />
a crime by<br />
sector (Table 7<br />
c<strong>on</strong>tinued)<br />
<str<strong>on</strong>g>Putting</str<strong>on</strong>g> <str<strong>on</strong>g>the</str<strong>on</strong>g> <str<strong>on</strong>g>ec<strong>on</strong>omy</str<strong>on</strong>g> <str<strong>on</strong>g>back</str<strong>on</strong>g> <strong>on</strong> <strong>track</strong> <strong>Crimes</strong> <strong>Against</strong> <strong>Business</strong><br />
Vandalism<br />
Graffi ti<br />
Agriculture, Forestry & Fishing 21.2 6.2 22.1 18.2 14.5 5.3 13.5 6.9 33<br />
Mining & C<strong>on</strong>structi<strong>on</strong> 19 6.4 21 26.3 7.5 2.4 4.8 2 22.7<br />
Manufacturing 24.7 7.2 13.9 18.1 7.5 1.7 5.3 3.2 33<br />
Transport, Communicati<strong>on</strong>s & Utilities 27.9 6.4 25.1 32.7 12.7 3.1 6.4 2.7 28.5<br />
Motor Vehicle Sales and Repair 32.7 7.6 31.9 33.3 6.3 6.1 5.1 7.7 34.1<br />
Hotels & Restaurants 35.4 8.5 8.9 22.9 24.4 5.4 6.3 3 26.1<br />
Financial, Insurance & Real Estate 29.4 11.9 6.1 22.5 13.2 0.9 6.5 1.9 19.8<br />
<strong>Business</strong> Services 19.2 6.2 11.8 21 6.2 2.9 4.2 2.9 15.4<br />
Health, Educati<strong>on</strong> & Social Services 26.3 9.8 11.1 14 9.6 3 1.5 3.2 18.4<br />
C<strong>on</strong>sumer & Pers<strong>on</strong>al Services 30.5 12 15.7 20.7 20.7 8.6 3.7 4.9 24.6<br />
Wholesale & Retail 32.1 11.4 12.8 19.4 15.8 22.7 5.9 3.6 27.5<br />
UK 26.7 8.5 15.2 22.1 12.5 9.5 5.3 3.3 24.7<br />
Robbery<br />
Assault <strong>on</strong><br />
owners/<br />
Employee fraud<br />
Agriculture, Forestry & Fishing 17.3 3 2.7 4.1 1.4 4.2 4.5 1.4 5.4<br />
Mining & C<strong>on</strong>structi<strong>on</strong> 11.8 1.7 2.6 4.2 6.5 5.3 2.7 2.9 4.1<br />
Manufacturing 14.8 2.3 2.2 4.9 2.3 7.7 3.2 3.3 6.5<br />
Transport, Communicati<strong>on</strong>s<br />
& Utilities<br />
10.8 6 4.4 7.9 7.7 7.6 4.6 2.7 7.4<br />
Motor Vehicle Sales and Repair 17.6 1.4 6.2 1.4 3.2 1.6 5.2<br />
Hotels & Restaurants 15.1 13 6.1 9.9 6.7 10.1 4.7 4.8 12.9<br />
Financial, Insurance & Real<br />
Estate<br />
9.3 3.8 5.8 7.6 8.9 1.8 2.7 9 5.9<br />
<strong>Business</strong> Services 5.7 2.6 5 5.6 5.8 9.7 5.6 3.9 4.3<br />
Health, Educati<strong>on</strong> & Social<br />
Services<br />
11.9 4.7 4.6 7.2 7.2 5.6 4.8 1.6 5.9<br />
C<strong>on</strong>sumer & Pers<strong>on</strong>al Services 12.9 4.1 3.8 8.1 5.6 10.4 2.4 4.2 5.4<br />
Wholesale & Retail 16.6 5.6 4.7 6.7 13.4 11.6 6 5.4 8.2<br />
UK 12.5 4.5 4.0 6.1 7.5 8.3 4.4 3.9 6.4<br />
lifting <str<strong>on</strong>g>the</str<strong>on</strong>g> barriers to growth in UK small businesses 2008 page 23<br />
Vehicle <str<strong>on</strong>g>the</str<strong>on</strong>g>ft<br />
Employee <str<strong>on</strong>g>the</str<strong>on</strong>g>ft<br />
Vehicle damage<br />
Cheque fraud<br />
Threatening behaviour<br />
Credit-card fraud<br />
Shoplifting<br />
E-crime<br />
Fly tipping<br />
Ars<strong>on</strong><br />
Identify fraud<br />
Burglary<br />
O<str<strong>on</strong>g>the</str<strong>on</strong>g>r
Table 9<br />
Percentage of<br />
resp<strong>on</strong>dents<br />
reporting<br />
crime to police<br />
by regi<strong>on</strong> and<br />
country<br />
Table 10<br />
Percentage of<br />
resp<strong>on</strong>dents<br />
reporting<br />
crime to police<br />
by regi<strong>on</strong> and<br />
country (Table<br />
9 c<strong>on</strong>tinued)<br />
<str<strong>on</strong>g>Putting</str<strong>on</strong>g> <str<strong>on</strong>g>the</str<strong>on</strong>g> <str<strong>on</strong>g>ec<strong>on</strong>omy</str<strong>on</strong>g> <str<strong>on</strong>g>back</str<strong>on</strong>g> <strong>on</strong> <strong>track</strong> <strong>Crimes</strong> <strong>Against</strong> <strong>Business</strong><br />
Vandalism<br />
Graffiti<br />
Vehicle <str<strong>on</strong>g>the</str<strong>on</strong>g>ft<br />
Vehicle damage<br />
page 24 lifting <str<strong>on</strong>g>the</str<strong>on</strong>g> barriers to growth in UK small businesses 2008<br />
Threatening<br />
behaviour<br />
North East 14.5 3.8 11.1 20.0 9.4 9.8 5.8 0.0 22.9<br />
North West 28.0 10.7 19.6 27.8 16.3 6.8 5.4 3.8 30.8<br />
Yorkshire &<br />
Humber<br />
30.6 9.9 18.1 20.4 13.4 6.8 5.3 2.8 28.2<br />
East Midlands 29.6 8.0 20.9 24.6 11.0 7.6 5.9 6.1 25.7<br />
West Midlands 28.2 8.0 19.2 24.2 14.0 9.6 3.7 4.3 31.0<br />
East of England 25.2 9.2 11.7 22.1 9.8 9.5 8.1 3.2 24.5<br />
L<strong>on</strong>d<strong>on</strong> 26.3 16.1 18.3 21.5 16.2 10.7 4.2 3.2 30.1<br />
South East 24.1 6.6 14.8 21.2 12.3 7.8 3.9 2.8 22.0<br />
South West 23.5 5.6 11.6 19.7 10.0 12.1 3.7 2.2 20.5<br />
England 26.1 8.3 16.1 22.5 12.4 9.0 5.1 3.3 25.4<br />
Wales 33.5 8.8 20.0 28.6 15.1 16.2 8.8 5.2 24.6<br />
Scotland 29.2 10.1 6.3 17.6 12.7 10.0 6.7 2.8 18.9<br />
Nor<str<strong>on</strong>g>the</str<strong>on</strong>g>rn Ireland 21.7 10.2 9.6 12.7 12.0 12.2 3.0 0.0 21.6<br />
UK 26.6 8.6 15.1 22.0 12.5 9.6 5.4 3.2 24.6<br />
Robbery<br />
Assault <strong>on</strong> owners/<br />
staff<br />
Employee fraud<br />
North East 4.4 0.0 2.1 6.4 10.2 0.0 4.5 2.3 5.1<br />
North West 16.1 7.3 5.9 7.5 9.2 7.8 4.3 3.2 4.3<br />
Yorkshire &<br />
Humber<br />
11.5 3.5 3.9 8.0 7.9 10.2 3.3 2.7 7.0<br />
East Midlands 16.4 5.0 4.6 5.0 8.9 10.6 5.5 2.9 6.5<br />
West Midlands 14.8 3.0 5.0 8.6 5.7 6.3 4.7 1.8 7.2<br />
East of England 12.1 5.6 5.3 4.1 10.6 10.7 3.1 3.2 9.2<br />
L<strong>on</strong>d<strong>on</strong> 14.1 4.5 4.8 4.1 9.0 11.0 4.5 10.4 3.8<br />
South East 13.5 3.9 3.1 6.6 8.2 8.8 4.1 6.3 5.8<br />
South West 9.7 3.9 2.0 3.6 4.5 7.0 4.9 3.2 6.0<br />
England 12.8 4.4 3.9 5.9 7.6 8.4 4.4 4.0 6.5<br />
Wales 15.3 6.1 8.3 8.8 12.2 8.3 9.6 2.2 8.0<br />
Scotland 8.4 2.8 3.1 6.5 4.5 7.8 2.4 4.0 7.4<br />
Nor<str<strong>on</strong>g>the</str<strong>on</strong>g>rn Ireland 15.9 11.5 2.9 3.9 11.8 8.7 1.7 0.0 1.8<br />
UK 12.5 4.5 4.0 6.0 7.6 8.4 4.4 3.8 6.5<br />
Employee <str<strong>on</strong>g>the</str<strong>on</strong>g>ft<br />
Cheque fraud<br />
Shoplifting<br />
Credit-card fraud<br />
Fly tipping<br />
E-crime<br />
Ars<strong>on</strong><br />
Identify fraud<br />
Burglary<br />
O<str<strong>on</strong>g>the</str<strong>on</strong>g>r
Table 11<br />
Effectiveness<br />
of crime<br />
reducti<strong>on</strong><br />
methods (1 =<br />
not effective<br />
– 5 = very<br />
effective)<br />
<str<strong>on</strong>g>Putting</str<strong>on</strong>g> <str<strong>on</strong>g>the</str<strong>on</strong>g> <str<strong>on</strong>g>ec<strong>on</strong>omy</str<strong>on</strong>g> <str<strong>on</strong>g>back</str<strong>on</strong>g> <strong>on</strong> <strong>track</strong> <strong>Crimes</strong> <strong>Against</strong> <strong>Business</strong><br />
Crime-preventi<strong>on</strong> advice<br />
<strong>Business</strong> Watch<br />
Crime and Disorder<br />
Reducti<strong>on</strong> Partnership<br />
More visible police presence<br />
North East<br />
Mean 2.9 2.8 2.6 4.2 4.4a,b,c N 62 45 36 101 92<br />
3.9<br />
67<br />
3.8<br />
86<br />
3.0<br />
56<br />
1.9<br />
69<br />
4.1<br />
86<br />
3.6<br />
91<br />
North West<br />
Mean<br />
N<br />
2.6<br />
301<br />
2.7<br />
199<br />
2.2<br />
136<br />
4.0<br />
458<br />
4.1<br />
411<br />
3.7<br />
257<br />
3.8<br />
364<br />
3.2<br />
209<br />
2.1<br />
288<br />
4.2<br />
377<br />
3.5<br />
396<br />
Yorkshire & Mean 2.6 2.7 2.2 3.9 4.0<br />
Humber<br />
a 3.7 3.6 3.1 2.0 4.0 3.5<br />
N 233 138 97 361 327 188 289 159 222 302 318<br />
East Midlands<br />
Mean<br />
N<br />
2.6<br />
288<br />
2.6<br />
167<br />
2.5<br />
135<br />
4.1<br />
413<br />
4.1<br />
373<br />
3.8<br />
236<br />
3.6<br />
319<br />
3.2<br />
200<br />
1.9<br />
258<br />
4.1<br />
361<br />
3.6<br />
363<br />
West Midlands<br />
Mean<br />
N<br />
2.7<br />
265<br />
2.6<br />
177<br />
2.2<br />
134<br />
4.0<br />
383<br />
4.2<br />
359<br />
3.6<br />
224<br />
3.7<br />
336<br />
3.1<br />
202<br />
2.0<br />
256<br />
4.2<br />
327<br />
3.4<br />
337<br />
East of<br />
Mean 2.7 2.5 2.2 4.0 4.0<br />
England<br />
b 3.7 3.6 3.0 1.9 4.0i 3.4<br />
N 324 230 160 487 455 227 387 222 299 414 424<br />
L<strong>on</strong>d<strong>on</strong><br />
Mean<br />
N<br />
2.9<br />
108<br />
2.6<br />
67<br />
2.5<br />
44<br />
4.0<br />
147<br />
4.1<br />
135<br />
3.5<br />
75<br />
3.7<br />
121<br />
3.5<br />
67<br />
1.9<br />
91<br />
4.0<br />
111<br />
3.5<br />
136<br />
South East<br />
Mean 2.7 2.7 2.3 4.0 4.0c 3.4d,e 3.6 3.1g 1.9 3.9j N 523 360 255 840 773 401 668 390 500 689<br />
3.5<br />
745<br />
South West<br />
Mean 2.7 2.7 2.2 3.9 4.0 3.5f N 552 379 242 878 777 442<br />
3.6<br />
677<br />
2.9<br />
393<br />
1.9<br />
528<br />
4.0<br />
736<br />
3.5<br />
766<br />
England Mean 2.7 2.6 2.3 4.0 4.1 3.6 3.6 3.1 1.9 4.0 3.5<br />
N 2807 1872 1324 4294 3901 2246 3428 2002 2656 3585 3795<br />
Wales<br />
Mean 2.5 2.7 2.1 4.0 4.0 3.9d N 129 84 65 223 204 118<br />
3.8<br />
190<br />
3.0<br />
86<br />
2.1<br />
137<br />
4.0<br />
184<br />
3.5<br />
180<br />
Scotland<br />
Mean 2.9 2.7 2.4 4.1 4.1 3.7 3.7 2.7h N 299 183 106 439 398 229 356 166<br />
2.2<br />
241<br />
4.1<br />
359<br />
Nor<str<strong>on</strong>g>the</str<strong>on</strong>g>rn Mean 2.7 2.9 2.5 4.1 4.2 4.0<br />
Ireland<br />
e,f 3.9 3.6g,h 2.5 4.4i,j N 86 54 34 138 138 94 118 56 73 123<br />
UK<br />
Mean<br />
N<br />
2.7<br />
3321<br />
2.7<br />
2193<br />
2.3<br />
1529<br />
4.0<br />
5094<br />
4.1<br />
4641<br />
3.6<br />
2687<br />
3.7<br />
4092<br />
3.1<br />
2310<br />
2.0<br />
3107<br />
4.0<br />
4251<br />
3.5<br />
3975<br />
lifting <str<strong>on</strong>g>the</str<strong>on</strong>g> barriers to growth in UK small businesses 2008 page 25<br />
Faster police resp<strong>on</strong>se<br />
Grant assistance for security<br />
CCTV surveillance<br />
Private security guard<br />
ASBO<br />
Tougher sentencing<br />
Neighbourhood Policing<br />
Units
Table 12<br />
Experiences of<br />
Neighbourhood<br />
Policing Units<br />
<str<strong>on</strong>g>Putting</str<strong>on</strong>g> <str<strong>on</strong>g>the</str<strong>on</strong>g> <str<strong>on</strong>g>ec<strong>on</strong>omy</str<strong>on</strong>g> <str<strong>on</strong>g>back</str<strong>on</strong>g> <strong>on</strong> <strong>track</strong> <strong>Crimes</strong> <strong>Against</strong> <strong>Business</strong><br />
Not aware of <str<strong>on</strong>g>the</str<strong>on</strong>g>m<br />
Had no c<strong>on</strong>tact with my<br />
local Unit<br />
Was c<strong>on</strong>tacted by <str<strong>on</strong>g>the</str<strong>on</strong>g><br />
liais<strong>on</strong> officer<br />
Have regular c<strong>on</strong>tact with<br />
Unit<br />
Think <str<strong>on</strong>g>the</str<strong>on</strong>g> Unit is effective<br />
in reducing crime<br />
Think Unit is ineffective in<br />
reducing crime<br />
There is no NPU in my<br />
area<br />
North East 70.2% 56.7% 7.8% 3.5% 3.5% 8.5% 9.9% 141<br />
North West 66.4% 50.8% 7.0% 4.7% 7.0% 6.3% 8.2% 685<br />
Yorkshire & Humber 68.7% 54.6% 7.3% 3.5% 7.1% 5.2% 10.4% 520<br />
East Midlands 73.1% 53.2% 6.4% 2.8% 3.6% 4.6% 11.9% 607<br />
West Midlands 67.1% 55.7% 7.5% 3.1% 5.9% 7.0% 11.4% 589<br />
East of England 67.5% 51.6% 6.4% 3.3% 8.7% 5.9% 11.3% 762<br />
L<strong>on</strong>d<strong>on</strong> 54.1% 55.5% 11.9% 7.8% 13.3% 10.1% 6.4% 218<br />
South East 67.1% 51.5% 6.2% 3.7% 7.7% 5.3% 8.5% 1359<br />
South West 66.2% 49.7% 7.4% 4.9% 6.8% 7.1% 11.6% 1345<br />
England 67.4% 52.0% 7.0% 3.9% 7.0% 6.1% 10.3% 6610<br />
Wales 66.0% 44.0% 7.4% 3.1% 6.0% 6.3% 14.6% 350<br />
England and Wales 67.3% 51.6% 7.0% 3.9% 7.0% 6.1% 10.5% 6960<br />
N
ISBN Number 978-0-906779-90-3<br />
November 2008<br />
©Federati<strong>on</strong> of Small <strong>Business</strong>es<br />
Copies of this publicati<strong>on</strong> may be obtained by writing to:<br />
Federati<strong>on</strong> of Small <strong>Business</strong>es<br />
2 Ca<str<strong>on</strong>g>the</str<strong>on</strong>g>rine Place, L<strong>on</strong>d<strong>on</strong> SW1E 6HF<br />
Teleph<strong>on</strong>e: 020 7592 8100<br />
Facsimile: 020 7233 7899<br />
email: l<strong>on</strong>d<strong>on</strong>.policy@fsb.org.uk<br />
website: www.fsb.org.uk<br />
Disclaimer<br />
All rights reserved. No part of this publicati<strong>on</strong> may be reproduced, stored in a retrieval system,<br />
or transmitted in any form or by any means, electr<strong>on</strong>ic, mechanical, photocopying, recording or<br />
o<str<strong>on</strong>g>the</str<strong>on</strong>g>rwise, without <str<strong>on</strong>g>the</str<strong>on</strong>g> prior permissi<strong>on</strong> of <str<strong>on</strong>g>the</str<strong>on</strong>g> Federati<strong>on</strong> of Small <strong>Business</strong>es (FSB). While every<br />
effort has been made to ensure <str<strong>on</strong>g>the</str<strong>on</strong>g> accuracy of <str<strong>on</strong>g>the</str<strong>on</strong>g> facts and data c<strong>on</strong>tained in this publicati<strong>on</strong>,<br />
no resp<strong>on</strong>sibility can be accepted by FSB for errors or omissi<strong>on</strong>s or <str<strong>on</strong>g>the</str<strong>on</strong>g>ir c<strong>on</strong>sequences. Articles<br />
that appear in <str<strong>on</strong>g>the</str<strong>on</strong>g> book are written in general terms <strong>on</strong>ly. They are not intended to be a<br />
comprehensive statement of <str<strong>on</strong>g>the</str<strong>on</strong>g> issues raised and should not be relied up<strong>on</strong> for any specifi c<br />
purposes. Readers should seek appropriate professi<strong>on</strong>al advice regarding <str<strong>on</strong>g>the</str<strong>on</strong>g> applicati<strong>on</strong> to <str<strong>on</strong>g>the</str<strong>on</strong>g>ir<br />
specifi c circumstances of <str<strong>on</strong>g>the</str<strong>on</strong>g> issues raised in any article.<br />
Designed <strong>on</strong> behalf of <str<strong>on</strong>g>the</str<strong>on</strong>g> Federati<strong>on</strong> of Small <strong>Business</strong>es by<br />
Hutt<strong>on</strong> Design, L<strong>on</strong>g Road, Paignt<strong>on</strong>, TQ4 7BB<br />
Teleph<strong>on</strong>e: 01803 668718 Fax: 01803 557148<br />
email: luke@hutt<strong>on</strong>design.net