

Download PDF - New Zealand Fire Service
Download PDF - New Zealand Fire Service
Download PDF - New Zealand Fire Service

Create successful ePaper yourself
Turn your PDF publications into a flip-book with our unique Google optimized e-Paper software.
ehaviour. The actual percentage of fixture failures, rather than incorrect use of<br />
equipment, is uncertain but a “guesstimate” is that about 30% of fires are due to<br />
failures in the fixtures. These are unsafe stoves and fixed heaters (solid fuel and<br />
electric panel heaters), unsafe hot water cylinder wiring, old circuit wiring, unsafe light<br />
switches and fittings, faulty power outlet fittings, and unsafe flues and chimneys.<br />
Generally the incidence of these faults are higher in older houses.<br />
Table 6 Object first ignited by fire<br />
Object ignited<br />
<strong>Fire</strong>s per 10,000 houses per year<br />
Oblject ignited House age 2006<br />
Pre 1900 1900 - 1945 1946 - 1969 1970 - 1991 1992 - 2005 onward All ages<br />
Framing 4.4 1.1 1.2 0.9 0.4 0.1 1.0<br />
Cooking materials, food 1.0 0.5 1.1 1.3 0.4 0.0 0.9<br />
Electrical wire, Wiring insulation 1.5 0.7 0.9 1.1 0.4 0.1 0.8<br />
Exterior wall claddings 3.3 1.2 0.9 0.6 0.4 0.0 0.8<br />
Bedding eg. Mattress, Pillow 0.8 0.4 0.8 0.9 0.3 0.0 0.6<br />
Interior wall covering 2.3 0.6 0.6 0.5 0.2 0.1 0.5<br />
Furniture (beds, chairs, sofas) 0.8 0.4 0.5 0.6 0.2 0.0 0.5<br />
Flammable liquids 0.4 0.2 0.4 0.4 0.1 0.1 0.3<br />
Clothing (Not being worn) 0.4 0.2 0.3 0.4 0.1 0.0 0.3<br />
Rubbish, Garbage, Waste 0.8 0.3 0.3 0.3 0.1 0.0 0.2<br />
Exterior roof claddings 0.4 0.1 0.1 0.1 0.1 0.0 0.1<br />
Thermal insulation 0.2 0.1 0.1 0.1 0.1 0.0 0.1<br />
Other 7.5 2.7 3.1 3.6 1.6 0.4 2.9<br />
Unknown 2.9 0.6 0.5 0.4 0.2 0.1 0.5<br />
Total 26 9 11 11 4 1 9.4<br />
Source: SMS, House fires between July 2000 to April 2009<br />
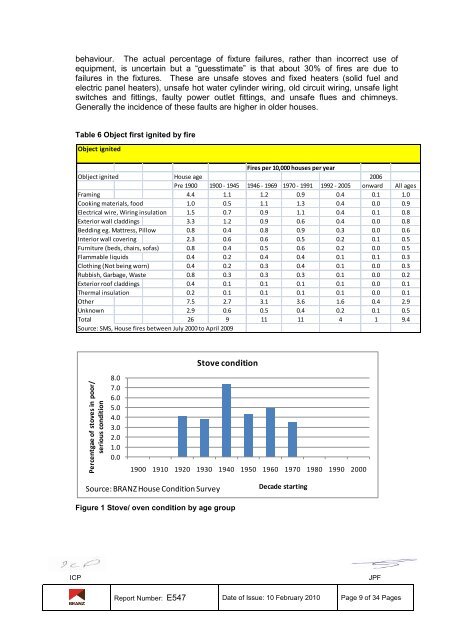
Percentgae of stoves in poor/<br />
serious condition<br />
8.0<br />
7.0<br />
6.0<br />
5.0<br />
4.0<br />
3.0<br />
2.0<br />
1.0<br />
0.0<br />
1900 1910 1920 1930 1940 1950 1960 1970 1980 1990 2000<br />
Source: BRANZ House Condition Survey<br />
Stove condition<br />
Figure 1 Stove/ oven condition by age group<br />
Decade starting<br />
ICP JPF<br />
Report Number: E547 Date of Issue: 10 February 2010 Page 9 of 34 Pages


