

Download PDF - New Zealand Fire Service
Download PDF - New Zealand Fire Service
Download PDF - New Zealand Fire Service

You also want an ePaper? Increase the reach of your titles
YUMPU automatically turns print PDFs into web optimized ePapers that Google loves.
8.2.6 Electrical Wiring inside the roof space<br />
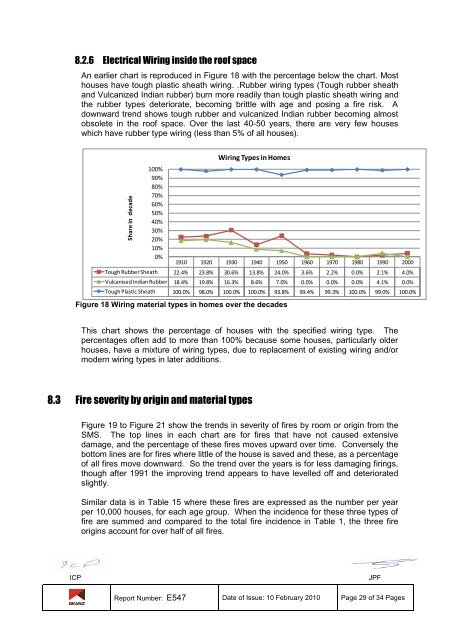
An earlier chart is reproduced in Figure 18 with the percentage below the chart. Most<br />
houses have tough plastic sheath wiring. .Rubber wiring types (Tough rubber sheath<br />
and Vulcanized Indian rubber) burn more readily than tough plastic sheath wiring and<br />
the rubber types deteriorate, becoming brittle with age and posing a fire risk. A<br />
downward trend shows tough rubber and vulcanized Indian rubber becoming almost<br />
obsolete in the roof space. Over the last 40-50 years, there are very few houses<br />
which have rubber type wiring (less than 5% of all houses).<br />
Share in decade<br />
100%<br />
90%<br />
80%<br />
70%<br />
60%<br />
50%<br />
40%<br />
30%<br />
20%<br />
10%<br />
0%<br />
Figure 18 Wiring material types in homes over the decades<br />
This chart shows the percentage of houses with the specified wiring type. The<br />
percentages often add to more than 100% because some houses, particularly older<br />
houses, have a mixture of wiring types, due to replacement of existing wiring and/or<br />
modern wiring types in later additions.<br />
8.3 <strong>Fire</strong> severity by origin and material types<br />
Wiring Types in Homes<br />
1910 1920 1930 1940 1950 1960 1970 1980 1990 2000<br />
Tough Rubber Sheath 22.4% 23.8% 30.6% 13.8% 24.0% 3.6% 2.2% 0.0% 2.1% 4.0%<br />
Vulcanised Indian Rubber 18.4% 19.8% 16.3% 8.6% 7.0% 0.0% 0.0% 0.0% 4.1% 0.0%<br />
Tough Plastic Sheath 100.0% 98.0% 100.0% 100.0% 93.8% 99.4% 99.3% 100.0% 99.0% 100.0%<br />
Figure 19 to Figure 21 show the trends in severity of fires by room or origin from the<br />
SMS. The top lines in each chart are for fires that have not caused extensive<br />
damage, and the percentage of these fires moves upward over time. Conversely the<br />
bottom lines are for fires where little of the house is saved and these, as a percentage<br />
of all fires move downward. So the trend over the years is for less damaging firings,<br />
though after 1991 the improving trend appears to have levelled off and deteriorated<br />
slightly.<br />
Similar data is in Table 15 where these fires are expressed as the number per year<br />
per 10,000 houses, for each age group. When the incidence for these three types of<br />
fire are summed and compared to the total fire incidence in Table 1, the three fire<br />
origins account for over half of all fires.<br />
ICP JPF<br />
Report Number: E547 Date of Issue: 10 February 2010 Page 29 of 34 Pages


