Karl Glazebrook - Gemini Observatory
Karl Glazebrook - Gemini Observatory
Karl Glazebrook - Gemini Observatory

Create successful ePaper yourself
Turn your PDF publications into a flip-book with our unique Google optimized e-Paper software.
uniformly in r, using the fact that the velocity along the streams is<br />
roughly constant (Supplementary Information, sections 5 and 6).<br />
This is convolved with the halo mass function 23 , n(M v ), to give<br />
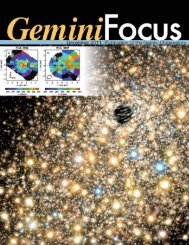
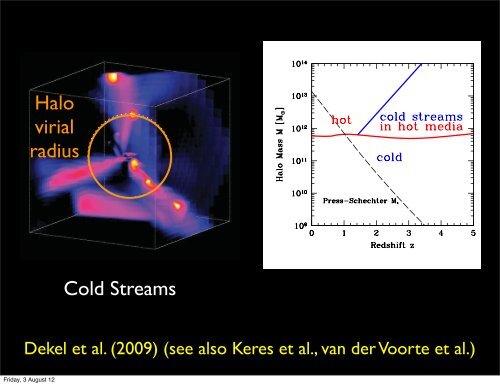
Figure 2 | Streams in three dimensions. The map shows radial flux for the<br />
galaxy of Fig. 1 in a box of side length 320 kpc. The colours refer to inflow rate<br />
per solid angle of<br />
Cold<br />
point-like tracers<br />
Streams<br />
at the centres of cubic-grid cells. The<br />
dotted circle marks the halo virial radius. The appearance of three fairly<br />
radial streams seems to be generic in massive haloes at high redshift, and is a<br />
feature of the cosmic web that deserves an explanation. Two of the streams<br />
show gas clumps of mass on the order of one-tenth that of the central galaxy,<br />
but most of the stream mass is smoother (Supplementary Fig. 6). The<br />
>10 10 M [ clumps, which involve about one-third of the incoming mass, are<br />
also gas rich—in the current simulation only 30% of their baryons turn into<br />
stars before they merge with the central galaxy.<br />
452<br />
Halo<br />
virial<br />
radius<br />
©2009<br />
2 Dekel et al.<br />
n ( _M)~<br />
ð ?<br />
0<br />
P( _M jM v )n(M v ) dM v<br />
The desired cumulative abundance, n(. _M), obtained by integration<br />
over the inflow rates from _M to infinity, is shown at z 5 2.2 in Fig. 4.<br />
Assuming that the SFR equals _M, the curve referring to _M lies safely<br />
above the observed values, marked by the symbols, indicating that the<br />
gas input rate is sufficient to explain the SFR. However, _M and the<br />
SFR are allowed to differ only by a factor of ,2, confirming our<br />
suspicion that the SFR must closely follow the gas input rate. The<br />
simulated SFR indeed traces the accretion rate to within a factor of<br />
two, but, given that our disks are poorly resolved, we focus here on<br />
the accretion as the more robustly simulated quantity. Because at<br />
z < 2.2 the star-forming galaxies constitute only a fraction of the<br />
observed ,10 11 M [ galaxies 24,25 , the requirement for a SFR almost<br />
as great as _M, based on Fig. 4, becomes even stronger.<br />
By analysing the clumpiness of the gas streams, using the sharp<br />
peaks of inflow in the _M(r) profiles, we address the role of mergers<br />
versus smooth flows. We evaluate each clump mass by integrating<br />
M clump ~ Ð ( _M(r)=v r (r)) dr across the peak, and estimate a mass ratio<br />
for the expected merger as m 5 M clump /f b M v , ignoring further mass<br />
loss in the clump on its way in and deviations of the galaxy baryon<br />
fraction from f b . We use ‘merger’ to describe any major or minor<br />
merger with m $ 0.1, as distinct from ‘smooth’ flows, which include<br />
‘mini-minor’ mergers with m , 0.1. We find that about one-third of<br />
the mass is flowing in as mergers and the rest as smoother flows.<br />
However, the central galaxy is fed by a clump with m $ 0.1 less than<br />
10% of the time; that is, the duty cycle for mergers is g = 0.1. A<br />
similar estimate is obtained using EPS merger rates 7 and starburst<br />
durations of ,50 Myr at z 5 2.5 from simulations 26 (Supplementary<br />
Information, section 5).<br />
From the difference between the two curves of Fig. 4, we learn that<br />
only one-quarter of the galaxies with a given _M are to be seen during a<br />
merger. The fact that the SFGs lie well above the merger curve even if<br />
the SFR is , _M indicates that in most of them the star formation is<br />
driven by smooth streams. Thus, ‘SFG’ could also stand for ‘streamfed<br />
galaxy’. This may explain why these galaxies maintain an<br />
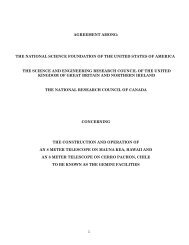
Figure 1. Analytic prediction for the regimes dominated by cold flows an<br />
medium in the plane of halo mass and redshift, based on Fig. 7 of DB<br />
horizontal curve marks the robust threshold mass for a stable shock bas<br />
infall analysis, M shock (z). Below this curve the flows are predicted to be<br />
cold and above it a shock-heated medium is expected to extend out to<br />
radius. The inclined solid curve is the conjectured upper limit for cold s<br />
redshifts higher than z crit ∼ 2. The hot medium in haloes of M v >M sho<br />
predicted to host penetrating cold streams, while haloes of a similar mas<br />
expected to be all hot, shutting off most of the gas supply to the inner gala<br />
is the characteristic Press-Schechter halo mass M ∗ (z); it is much smaller<br />
Dekel et al. (2009) (see also Keres et al., van der Voorte et al.)<br />
Friday, 3 August 12<br />
Macmillan Publishers Limited. All rights reserved