Lecture 17: Binary and Ternary Phase Diagrams Read Chpt 8
Lecture 17: Binary and Ternary Phase Diagrams Read Chpt 8
Lecture 17: Binary and Ternary Phase Diagrams Read Chpt 8
You also want an ePaper? Increase the reach of your titles
YUMPU automatically turns print PDFs into web optimized ePapers that Google loves.
<strong>Lecture</strong> <strong>17</strong>:<br />
<strong>Binary</strong> <strong>and</strong> <strong>Ternary</strong> <strong>Phase</strong> <strong>Diagrams</strong><br />
<strong>Read</strong> <strong>Chpt</strong> 8<br />
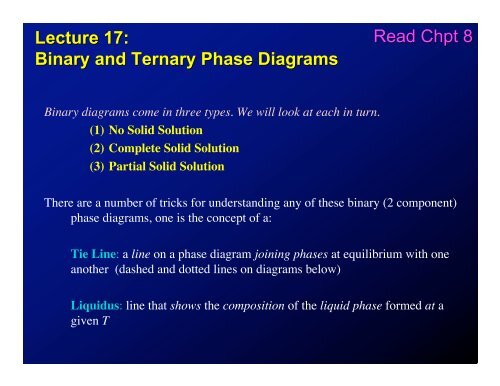
<strong>Binary</strong> diagrams come in three types. We will look at each in turn.<br />
(1) No Solid Solution<br />
(2) Complete Solid Solution<br />
(3) Partial Solid Solution<br />
There are a number of tricks for underst<strong>and</strong>ing any of these binary (2 component)<br />
phase diagrams, one is the concept of a:<br />
Tie Line: a line on a phase diagram joining phases at equilibrium with one<br />
another (dashed <strong>and</strong> dotted lines on diagrams below)<br />
Liquidus: line that shows the composition of the liquid phase formed at a<br />
given T
(1) NO SOLID SOLUTION (PURE A or PURE B)<br />
Tieline: composition of the solid is given by the right h<strong>and</strong> side (pure An); composition<br />
of the liquid is given by the intersection with the liquidus line (53% An, 47% Di)
Evenutally, you’ll reach the Eutectic composition: approximately 45%An, 55% Di<br />
So farther from eutectic T, composition gets farther from eutectic composition,<br />
closer to pure system composition
(2) INCOMPLETE SOLID SOLUTION<br />
Now we have some miscibility (ability of one phase to dissolve in another)<br />
Just like salt is miscible in water, up to the saturation limit.<br />
Solvus: a line that shows the saturation limit of one solid component into another<br />
Solidus: a line that gives the composition of a solid solution in equilibrium with a<br />
liquid (analogous to liquidus in the no solid solution case)<br />
1450°<br />
Liquid<br />
Liquidus<br />
Solidus<br />
T<br />
T*<br />
Di ss<br />
+ L<br />
An ss<br />
+ L<br />
Di ss<br />
X 1 X 3 X 4<br />
An ss<br />
Solvus<br />
Di ss<br />
+ An ss<br />
Di<br />
X 2<br />
An<br />
Example: Orthoclase (KAlSi 3 O 8 ) – Albite (NaAlSi 3 O 8 )
1450°<br />
Liquid<br />
T<br />
T*<br />
Di ss<br />
+ L<br />
An ss<br />
+ L<br />
An ss<br />
Di ss<br />
+ An ss<br />
Tielines:<br />
Di<br />
Di ss<br />
X 1 X 3 X 4<br />
X 2<br />
An<br />
At T*<br />
From Di to X 1 : pure solid Di ss , composition evolves from Di to X 1<br />
From X 1 to X 2 : pure solid Di ss + liquid; composition of Di ss => given by X 1 ;<br />
composition of liquid given by X 2<br />
From X 2 to X 3 : pure liquid; composition evolves from X 2 to X 3<br />
From X 3 to X 4 : pure solid B ss + liquid; compositioin of B ss given by X 4 ; composition of<br />
liquid given by X 3<br />
From X 4 to An: pure solid B ss ; composition evolves from X 4 to An
(3) COMPLETE SOLID SOLUTION<br />
Plagioclase Feldspars, for example,<br />
NaAlSi 3 O 8 (albite) => CaAl 2 Si 2 O 8 (anorthite)<br />
“melting loop”: solidus <strong>and</strong> liquidus lines join to form a loop<br />
You can still use tielines to underst<strong>and</strong> this diagram!!
(3) COMPLETE SOLID SOLUTION<br />
At T*: At compositions from A to X*: pure solid solution with composition A to X*<br />
At compositions from X* to Y*: liquid + solid solution; solid solution always has<br />
composition X*; liquid always has composition Y*; as you move from X* to Y* you<br />
change from mostly solid to mostly liquid<br />
At compositions from Y* to B: pure liquid with composition from Y* to B
How can you use phase diagrams to underst<strong>and</strong> something about petrology?<br />
Well, what happens when you take a melt <strong>and</strong> cool it down? Depends on the type of<br />
phase diagram <strong>and</strong> on how the magma forms:<br />
(1) Perfect Equilibrium Crystallization: always at equilibrium, composition<br />
of liquid <strong>and</strong> solid formed are constantly evolving; start with liquid of composition X,<br />
end with solid of composition X
(1) Perfect Fractional Crystallization<br />
• Crystals are removed from the melt (remember Bowen <strong>and</strong> differentiation of<br />
magmas?), in other words, they sink to the bottom of the melt <strong>and</strong> stop reacting with<br />
the remaining liquid<br />
• So, first crystal to form has the same composition as in the perfect equilibrium<br />
crystallization case, but subsequent crystals have solidus composition, so that the<br />
AVERAGE composition of solids is very different<br />
• The liquid becomes more <strong>and</strong> more pure (following the liquidus), <strong>and</strong> the liquid lasts<br />
longer <strong>and</strong> goes through more compositions:
TERNARY PHASE DIAGRAMS<br />
What if we add yet another component? Now we can’t draw the T-X phase diagram<br />
in 2D, so we either need a 3D diagram or, we can use Projections<br />
<strong>Binary</strong> eutectic point => ternary cotectic line<br />
<strong>Ternary</strong> eutectic: 3 solids <strong>and</strong> liquid form


