Amberg Geotechnics
Amberg Geotechnics
Amberg Geotechnics

Create successful ePaper yourself
Turn your PDF publications into a flip-book with our unique Google optimized e-Paper software.
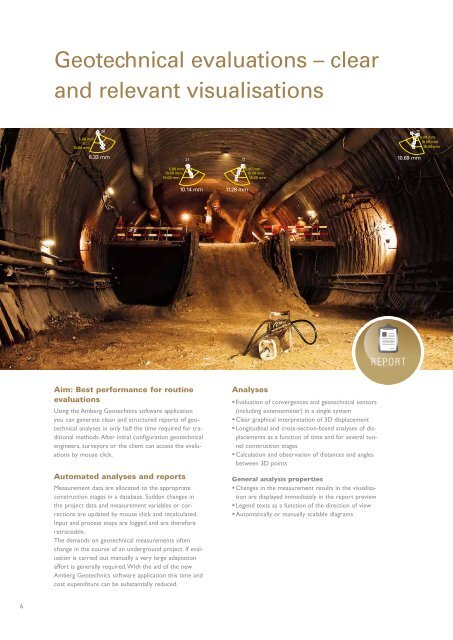
Geotechnical evaluations – clear<br />
and relevant visualisations<br />
20<br />
5.00 mm<br />
10.00 mm<br />
8.33 mm<br />
21 11<br />
5.00 mm 5.00 mm<br />
10.00 mm 10.00 mm<br />
15.00 mm 15.00 mm<br />
10.14 mm 11.28 mm<br />
10<br />
5.00 mm<br />
10.00 mm<br />
15.00 mm<br />
10.69 mm<br />
Aim: Best performance for routine<br />
evaluations<br />
Using the <strong>Amberg</strong> <strong>Geotechnics</strong> software application<br />
you can generate clean and structured reports of geotechnical<br />
analyses in only half the time required for traditional<br />
methods. After initial configuration geotechnical<br />
engineers, surveyors or the client can access the evaluations<br />
by mouse click.<br />
Automated analyses and reports<br />
Measurement data are allocated to the appropriate<br />
construction stages in a database. Sudden changes in<br />
the project data and measurement variables or corrections<br />
are updated by mouse click and recalculated.<br />
Input and process steps are logged and are therefore<br />
retraceable.<br />
The demands on geotechnical measurements often<br />
change in the course of an underground project. If evaluation<br />
is carried out manually a very large adaptation<br />
effort is generally required. With the aid of the new<br />
<strong>Amberg</strong> <strong>Geotechnics</strong> software application this time and<br />
cost expenditure can be substantially reduced.<br />
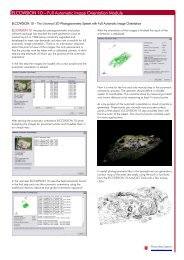
Analyses<br />
• Evaluation of convergences and geotechnical sensors<br />
(including extensometer) in a single system<br />
• Clear graphical interpretation of 3D displacement<br />
• Longitudinal and cross-section-based analyses of displacements<br />
as a function of time and for several tunnel<br />
construction stages<br />
• Calculation and observation of distances and angles<br />
between 3D points<br />
General analysis properties<br />
• Changes in the measurement results in the visualisation<br />
are displayed immediately in the report preview<br />
• Legend texts as a function of the direction of view<br />
• Automatically or manually scalable diagrams<br />
6