Efficient evaluation and classification of chromatograms - Gerstel
Efficient evaluation and classification of chromatograms - Gerstel
Efficient evaluation and classification of chromatograms - Gerstel

Create successful ePaper yourself
Turn your PDF publications into a flip-book with our unique Google optimized e-Paper software.
GERSTEL solutions worldwide<br />
Analysis<br />
Yes/no. Good/ bad:<br />
Chemometrics <strong>of</strong>fer efficient<br />
<strong>evaluation</strong> <strong>and</strong> <strong>classification</strong> <strong>of</strong> <strong>chromatograms</strong>.<br />
When you need<br />
a fast decision<br />
Author<br />
Carlos Gil<br />
Product Manager Chemometrics<br />
GERSTEL GmbH & Co. KG<br />
chemsensor@gerstel.de<br />
You are faced with a substantial number <strong>of</strong> <strong>chromatograms</strong>, <strong>and</strong><br />
want to know which ones fall into certain classes, for example<br />
good or bad, ship or hold. What do you do? Normally, you would<br />
download the data to your chromatography data h<strong>and</strong>ling<br />
s<strong>of</strong>tware, generate a peak area report for each chromatogram,<br />
<strong>and</strong> begin the process <strong>of</strong> comparing the reports - a laborious<br />
<strong>and</strong> tedious process. The exploratory analysis <strong>of</strong> reduced data<br />
could make your work significantly easier.<br />
Chromatography data analysis is normally<br />
performed based on the peak areas<br />
<strong>of</strong> identified compounds or on area percent<br />
reports. Especially in the case <strong>of</strong><br />
complex <strong>chromatograms</strong>, <strong>evaluation</strong> <strong>and</strong><br />
<strong>classification</strong> becomes a difficult <strong>and</strong><br />
time-consuming exercise that requires<br />
highly qualified <strong>and</strong> experienced personnel.<br />
There are alternatives, however, especially<br />
when quick decisions are needed,<br />
for determining whether a sample is<br />
good or bad or whether it can be shipped,<br />
yes or no.<br />
Chemometric analysis using pattern<br />
recognition algorithms can provide clear<br />
answers quickly <strong>and</strong> easily. The data<br />
analysis procedure can be fully automated.<br />
Chromatograms <strong>and</strong>/or mass<br />
spectra <strong>of</strong> samples are subjected to a<br />
sophisticated screening process <strong>and</strong> only<br />
outliers subsequently need to be evaluated<br />
in the traditional way.<br />
GERSTEL <strong>of</strong>fers chemometrics s<strong>of</strong>tware<br />
packages – either within the scope<br />
<strong>of</strong> a complete analytical solution package,<br />
or as a retr<strong>of</strong>it for existing systems.<br />
GERSTEL co-operates with Infometrix,<br />
one <strong>of</strong> the leading developers <strong>of</strong><br />
chemometric s<strong>of</strong>tware, as well as with<br />
Agilent Technologies, a leading manufacturer<br />
<strong>of</strong> analytical systems.<br />
Complete Solution Packages:<br />
The GERSTEL ChemSensor<br />
Systems<br />
The product family <strong>of</strong> the GERSTEL<br />
ChemSensors is far superior to conventional<br />
electronic noses. By coupling an<br />
autosampler directly to a mass spectrometer,<br />
a highly flexible analytical system is<br />
produced with a large number <strong>of</strong> fully independent<br />
sensors: every detected variable<br />
(m/z) is equivalent to the sensor <strong>of</strong> a<br />
conventional electronic nose. Apart from<br />
this, the ChemSensor <strong>of</strong>fers the user the<br />
possibility <strong>of</strong> correlating both GC/MS<br />
data <strong>and</strong> their chemometric <strong>evaluation</strong>.<br />
The principle <strong>of</strong> chemometric <strong>evaluation</strong><br />
is based on reducing 3-dimensional<br />
data (intensity, fragment m/z <strong>and</strong> retention<br />
time) acquired with the mass-selective<br />
detector (MSD) to two dimensions.<br />
This means that either the total combined<br />
mass spectrum <strong>of</strong> the sample over the<br />
course <strong>of</strong> the analysis, also called the<br />
fingerprint mass spectrum (intensity vs.<br />
m/z) or the total ion current chromatogram<br />
(TIC intensity vs. retention time) is<br />
used.<br />
ChemSensor: Fingerprint Mass<br />
Spectrum without GC<br />
Separation<br />
The ChemSensor is the MS-only configuration.<br />
It comes with an interface<br />
through which samples can be directly<br />
injected into the MSD – without chromatographic<br />
separation. The injection is<br />
done via the GERSTEL Cooled Injection<br />
System (CIS 4 Plus), which can be operated<br />
in split <strong>and</strong> splitless modes using<br />
various injection techniques. In combination<br />
with the GERSTEL MultiPurpose<br />
Sampler (MPS 2) (cf. pp 14-15), either<br />
headspace injection or solid phase<br />
microextraction (SPME) can be applied.<br />
As compounds are not separated,<br />
retention times are irrelevant. The influence<br />
<strong>of</strong> retention time is removed from<br />
the data by summing up the intensities <strong>of</strong><br />
m/z value over the complete time period<br />
<strong>of</strong> the run. The <strong>evaluation</strong> is performed<br />
based on fingerprint mass spectra.<br />
ChemSensor System:<br />
Fingerprint Mass Spectrum plus<br />
GC Separation<br />
The ChemSensor System consists <strong>of</strong><br />
a GC coupled with a Mass Spectrometer.<br />
The sample is injected via a conventional<br />
GC, not through the ChemSensor inter-<br />
GERSTEL solutions worldwide – February October 2005 2004<br />
6
GERSTEL solutions worldwide<br />
Analysis<br />
face. The ChemSensor system can be<br />
operated both as a ChemSensor <strong>and</strong> as<br />
a conventional GC/MS system with free<br />
choice <strong>of</strong> the injection technique. The<br />
system is extremely flexible: During<br />
ChemSensor operation, the column is<br />
mainly kept isothermal (hot) <strong>and</strong> serves<br />
as a transfer capillary. Samples identified<br />
as outliers can be investigated further by<br />
performing a full GC/MS analysis using<br />
the system in exactly the same configuration.<br />
For ChemSensor operation, chromatographic<br />
separation is irrelevant, <strong>and</strong><br />
analyte retention is minimal. The aim is to<br />
reduce analysis time <strong>and</strong> increase sample<br />
throughput. Chromatograms, though, are<br />
helpful for closer investigation <strong>of</strong> outliers.<br />
If a GC separation is performed, the<br />
ChemSensor s<strong>of</strong>tware can be used to<br />
evaluate both the fingerprint mass spectrum<br />
<strong>and</strong> the total ion chromatogram<br />
(TIC) pr<strong>of</strong>ile. The TIC pr<strong>of</strong>ile shows the<br />
total intensity <strong>of</strong> all fragments as a function<br />
<strong>of</strong> the retention time.<br />
Pirouette S<strong>of</strong>tware for<br />
Chemometric Analysis<br />
Regardless <strong>of</strong> how the user reduces<br />
the data (intensity vs. m/z or TIC intensity<br />
vs. retention time), the result is a two-dimensional<br />
matrix. Using the Pirouette<br />
S<strong>of</strong>tware, the data can be depicted as a<br />
line plot <strong>and</strong> normalised.<br />
Chemometric analysis is based on linear<br />
combinations <strong>of</strong> the original variables<br />
(m/z values or retention times). The data<br />
is listed in the columns <strong>of</strong> the data tables.<br />
The first step after visualizing the data is<br />
an exploratory analysis employing two<br />
algorithms: hierarchical cluster analysis<br />
(HCA) <strong>and</strong> principal component analysis<br />
(PCA).<br />
The aim is to identify groups within<br />
the data, <strong>and</strong> to determine whether <strong>classification</strong>s<br />
can be established. PCA<br />
searches simultaneously for correlations<br />
between all variables, <strong>and</strong> extracts linear<br />
combinations <strong>of</strong> strongly correlated variables,<br />
the so-called principal components,<br />
which describe the main variability<br />
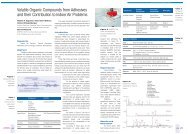
<strong>of</strong> the sample. The PCA Scores Plot (Figure<br />
1) shows quickly <strong>and</strong> simply which<br />
samples are similar <strong>and</strong> which fall outside<br />
the pattern.<br />
In parallel to the exploratory analysis,<br />
two further algorithms are used to construct<br />
the <strong>classification</strong> models <strong>and</strong> assign<br />
unknown samples to the groups:<br />
K Nearest Neighbors (KNN) <strong>and</strong> the socalled<br />
SIMCA (S<strong>of</strong>t Independent Modelling<br />
<strong>of</strong> Class Analogy) algorithms.<br />
KNN classifies unknown samples depending<br />
on their proximity to samples<br />
already assigned to categories (classes),<br />
whereas SIMCA uses principal component<br />
analysis (PCA) to model the position<br />
<strong>and</strong> distribution <strong>of</strong> the samples. Classifications<br />
<strong>of</strong> this type can be automated<br />
with the ChemSensor s<strong>of</strong>tware.<br />
Figure 1 PCA Scores Plot<br />
Rapid Data Interpretation<br />
For existing Agilent GC/MS systems,<br />
the Rapid Data Interpretation S<strong>of</strong>tware is<br />
a convenient add-on tool that implements<br />
many ChemSensor features. Its<br />
main application is to search datasets for<br />
outliers or to investigate the natural<br />
grouping <strong>of</strong> samples based on the fingerprint<br />
mass spectrum or on the TIC pr<strong>of</strong>ile.<br />
A Pirouette Lite Explore s<strong>of</strong>tware is included,<br />
comprising the HCA <strong>and</strong> PCA<br />
algorithms.<br />
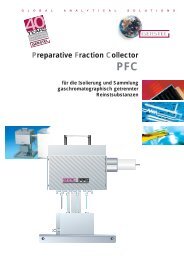
GERSTEL ChemSensor System<br />
Chemometric Analysis <strong>of</strong> GC<br />
<strong>and</strong> LC Data from non-MS<br />
detectors<br />
GC <strong>and</strong> LC data based on detectors<br />
other than mass spectrometric can also<br />
be analyzed <strong>and</strong> classified using automated<br />
chemometric analysis. The analysis<br />
can be based on either a peak table or<br />
raw data (intensity vs. retention time).<br />
When using raw data, which is normally<br />
acquired at a high sampling rate, it is advisable<br />
to reduce the number <strong>of</strong> datapoints<br />
(bunching).<br />
GC <strong>and</strong> LC Retention Time<br />
Correction<br />
Concentration differences, ageing <strong>of</strong><br />
the column <strong>and</strong> changes in carrier gas<br />
flow are factors that can cause a shift in<br />
retention time. To compensate for this,<br />
the Agilent Technologies Retention Time<br />
Locking (RTL) s<strong>of</strong>tware can be employed.<br />
Alternatively, the new InfoMetrix LineUp<br />
s<strong>of</strong>tware, Version 2.0 can perform purely<br />
s<strong>of</strong>tware-based corrections. The s<strong>of</strong>tware<br />
uses a multivariate correlation<br />
method to shift <strong>and</strong> align the retention<br />
time axis <strong>of</strong> a chromatogram with a reference<br />
chromatogram. LineUp supports<br />
various file formats, for instance Agilent<br />
ChemStation (*.CH files) <strong>and</strong> AIA data interchange<br />
format (*.CDF files). In combination<br />
with the ChemStation, this process<br />
can be automated.<br />
GERSTEL solutions worldwide – October February 2004 2005<br />
7