

The real structure of Na3BiO4 by electron ... - Columbia University
The real structure of Na3BiO4 by electron ... - Columbia University
The real structure of Na3BiO4 by electron ... - Columbia University

Create successful ePaper yourself
Turn your PDF publications into a flip-book with our unique Google optimized e-Paper software.
Z. Kristallogr. 220 (2005) 231–244 231<br />
# <strong>by</strong> Oldenbourg Wissenschaftsverlag, München<br />
<strong>The</strong> <strong>real</strong> <strong>structure</strong> <strong>of</strong> <strong>Na3BiO4</strong> <strong>by</strong> <strong>electron</strong> microscopy,<br />
HR-XRD and PDF analysis<br />
Sascha Vensky I , Lorenz Kienle I , Robert E. Dinnebier I , Ahmad S. Masadeh II , Simon J. L. Billinge II and Martin Jansen*,I<br />
I Max-Planck-Institute for Solid State Research, Heisenbergstrasse 1, D-70569 Stuttgart, Germany<br />
II Department <strong>of</strong> Physics and Astronomy, Michigan State <strong>University</strong>, East Lansing, MI 48824, USA<br />
Dedicated to Pr<strong>of</strong>essor Dr. Hans-Jörg Deiseroth on the occasion <strong>of</strong> his 60 th birthday<br />
Received July 9, 2004; accepted September 16, 2004<br />
Electrocrystallization /<br />
High resolution transmission <strong>electron</strong> microscopy /<br />
Pair distribution function / Sodium bismuthate /<br />
Powder diffraction <strong>structure</strong> analysis / X-ray diffraction<br />
Abstract. <strong>The</strong> <strong>real</strong> <strong>structure</strong> <strong>of</strong> a new crystalline high<br />
temperature phase, metastable at room temperature, in the<br />
system sodium – bismuth – oxygen, b-<strong>Na3BiO4</strong>, was determinated<br />
using high resolution X-ray powder diffraction,<br />
pair distribution function analysis, and high resolution<br />
transmission <strong>electron</strong> microscopy. b-<strong>Na3BiO4</strong> was synthesized<br />
<strong>by</strong> anodic oxidation <strong>of</strong> bismuth(III)-oxide in a sodium<br />
hydroxide – lithium hydroxide melt. <strong>The</strong> average<br />
crystal <strong>structure</strong> <strong>of</strong> b-<strong>Na3BiO4</strong> at ambient conditions<br />
(R3m, a ¼ 3.32141(9) A, c ¼ 16.4852(5) A) is structurally<br />
related to a-NaFeO2 with metal layers almost statistically<br />
occupied in a Na : Bi ratio <strong>of</strong> 3 : 1. Analysis <strong>of</strong> the longrange<br />
order on the bulk material <strong>by</strong> Rietveld refinement<br />
led to approximately Na : Bi ratios <strong>of</strong> 2 :1 and 4 : 1, in consecutive<br />
metal layers, while a detailed analysis <strong>of</strong> the local<br />
order <strong>by</strong> means <strong>of</strong> the pair distribution function revealed<br />
the existence <strong>of</strong> almost pure sodium layers and mixed 1 :1<br />
– sodium:bismuth layers. Complementary studies on single<br />
crystallites using high resolution transmission <strong>electron</strong><br />
miscroscopy exhibited a complex domain <strong>structure</strong> with<br />
short-range ordered, partially ordered, and long-range ordered<br />
domains.<br />
Introduction<br />
<strong>The</strong> rock salt arrangement is among the fundamental<br />
building principles in three-dimensional space. Besides the<br />
vast families <strong>of</strong> chemically different AB compounds, it is<br />
<strong>real</strong>ized in salts containing complex anionic and/or cationic<br />
constituents, even including extended cluster ions. Examples<br />
are calcite CaCO3, [1] sodium nitrate NaNO3, [2]<br />
sodium ozonide NaO3, [3] calcium carbide CaC2, [4] sodium<br />
azide NaN3, [5] and fulleride compounds <strong>of</strong> the<br />
* Correspondence author (e-mail: m.jansen@fkf.mpg.de)<br />
[M(NH3)6] C60 6NH3 type, M ¼ (Cd, Co, Mn, Zn) [6, 7].<br />
Substitution variants, with either the cationic or anionic<br />
sublattices occupied <strong>by</strong> different species in an ordered<br />
manner, represent another class <strong>of</strong> rock salt derivatives.<br />
Here various ternary alkali metal oxides <strong>of</strong> general formula<br />
types ABO2, A2BO3, A3BO4, A4BO5, ... (A ¼ alkali<br />
metal, B ¼ metal or nonmetal) need to be included. Some<br />
<strong>of</strong> the latter show order-disorder transitions within their<br />
cationic sublattices, and are reluctant to fully order, during<br />
the synthesis along the solid state route. In the past, this<br />
phenomenon has caused some confusion with respect to<br />
the correct indexing <strong>of</strong> the powder patterns <strong>of</strong> e.g.<br />
Li2SnO3, [8, 9] Li2MnO3, [10–12] or Na2RuO3 [13, 14].<br />
<strong>The</strong> room temperature modification <strong>of</strong> <strong>Na3BiO4</strong>, referred<br />
to as a-<strong>Na3BiO4</strong>, hereafter, is a fully ordered rock<br />
salt substitution variant with monoclinic symmetry [15].<br />
Here we report on a heavily disordered high temperature<br />
modification <strong>of</strong> <strong>Na3BiO4</strong>, i.e. b-<strong>Na3BiO4</strong>, grown electrochemically<br />
from a NaOH/Bi2O3 melt.<br />
<strong>The</strong> oxidation state <strong>of</strong> +V for bismuth in oxides is generally<br />
rare. However, it has been <strong>real</strong>ized in a number <strong>of</strong><br />
alkali bismuthates: ABiO3 and A3BiO4 with A ¼ Li, Na,<br />
K, Li5BiO5, and Li7BiO6 [15 – 25]. Out <strong>of</strong> these, the only<br />
one accessible through electrocrystallization from a melt,<br />
besides solid state routes, was KBiO3 [20 – 22].<br />
Experimental<br />
Syntheses and analyses<br />
Crystalline material <strong>of</strong> b-<strong>Na3BiO4</strong> was obtained <strong>by</strong> electrocrystallization<br />
from alkali hydroxide melts containing bismuth(III)<br />
oxide Bi2O3. <strong>The</strong> components <strong>of</strong> the melt, 1 g<br />
Bi2O3 (Riedel-de Haen, 10305), 12 g NaOH (Merck,<br />
106498), 3.4 g LiOH (Merck, 105691), and 0.4 g ZnO<br />
(Chempur, 008417), were used without pre-treatment.<br />
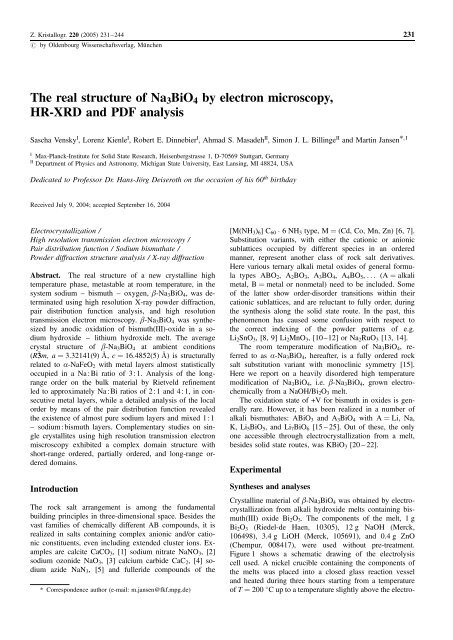
Figure 1 shows a schematic drawing <strong>of</strong> the electrolysis<br />
cell used. A nickel crucible containing the components <strong>of</strong><br />
the melts was placed into a closed glass reaction vessel<br />
and heated during three hours starting from a temperature<br />
<strong>of</strong> T ¼ 200 C up to a temperature slightly above the electro-
232 S. Vensky, L. Kienle, R. E. Dinnebier et al.<br />
Fig. 1. Cell used for the electrocrystallization <strong>of</strong> b-<strong>Na3BiO4</strong>. (1) wires<br />
leading to the potentiostat, (2) gas inlet, (3) connectors, (4) Pt electrodes,<br />
(5) furnace, (6) nickel crucible.<br />
lysis temperature (330–350 C), allowing the melt to equilibrate.<br />
ZnO levels the amount <strong>of</strong> water in the melt. After<br />
one hour, the temperature was decreased to the electrolysis<br />
temperature, the platinum electrodes were inserted, and the<br />
reaction vessel was closed. A platinum wire (˘ ¼ 1 mm)<br />
was used as the cathode, and a second platinum wire<br />
(˘ ¼ 0.3 mm) as the anode. A constant current density <strong>of</strong><br />
1 mA/cm 2 was applied for 18 – 42 h using a VMP multipotentiostat<br />
(Bio-Logic, France). b-<strong>Na3BiO4</strong> crystallized as<br />
dark red, shiny crystals at the platinum anode. <strong>The</strong> material<br />
was washed with bidestilled water and acetone, and was<br />
stored under an argon atmosphere.<br />
Crystalline material <strong>of</strong> a-<strong>Na3BiO4</strong> was obtained <strong>by</strong> solid<br />
state reaction [15]. A thoroughly ground mixture <strong>of</strong><br />
Na2O2 (Aldrich, 223417) and Bi2O3 (Riedel-de Haen,<br />
10305) in the ratio 3 : 1 was placed in a corundum boat<br />
and reacted for 12 h at T ¼ 600 C, in a flow <strong>of</strong> oxygen.<br />
a-<strong>Na3BiO4</strong> was obtained as a bright yellow powder.<br />
Images <strong>of</strong> the crystals were taken <strong>by</strong> means <strong>of</strong> scanning<br />
<strong>electron</strong> microscopy (ESEM XL30 TMP, Philips).<br />
Investigations <strong>of</strong> the stoichiometry <strong>of</strong> b-<strong>Na3BiO4</strong> <strong>by</strong> chemical<br />
analysis using ICP-OES technique were conducted<br />
with an optical emission spectrometer ARL 3580 B.<br />
<strong>The</strong>rmal analysis (DTA/TGA) <strong>of</strong> b-<strong>Na3BiO4</strong> was performed<br />
using a Simultaneous <strong>The</strong>rmo-Analyzer STA 409<br />
(Netzsch) with the sample in a corundum crucible, in a<br />
flow <strong>of</strong> oxygen (100 mL/min).<br />
High resolution X-ray powder diffraction<br />
High resolution X-ray powder diffraction data <strong>of</strong> b-<br />
<strong>Na3BiO4</strong> were collected at ambient conditions in transmission<br />
geometry with the sample sealed in a 0.5 mm lithiumborate<br />
glass (Hilgenberg glass No. 50) capillary at beam-<br />
line X17B1 <strong>of</strong> the National Synchrotron Light Source at<br />
Brookhaven National Laboratory. X-rays <strong>of</strong> an energy <strong>of</strong><br />
67 keV were selected <strong>by</strong> a silicon(220)-Laue-Bragg-monochromator<br />
and analyzed <strong>by</strong> a sagittally bent silicon crystal<br />
[26–29]. <strong>The</strong> exact wavelength was determined as<br />
l ¼ 0.18528(2) A using the NIST SRM 660 LaB6 standard.<br />
Data were taken in steps <strong>of</strong> 0.001 2q from 1.00–<br />
15.00 2q for 16 h. <strong>The</strong> samples were spun during measurement<br />
for better particle statistics. <strong>The</strong> powder pattern<br />
exhibits several peaks <strong>of</strong> small amounts <strong>of</strong> sodium hydroxide<br />
and bismuth oxide.<br />
Data reduction was performed using the GUFI program<br />
[30]. Indexing with ITO [31] led to a hexagonal cell with<br />
lattice parameters given in Table 1. <strong>The</strong> number <strong>of</strong> formula<br />
units (Na0.75Bi0.25O) per unit cell was deduced to be<br />
Z ¼ 6, from volume increments. <strong>The</strong> extinctions found in<br />
the powder pattern indicated R3, R3, R32, R3m, and R3m<br />
as the most probable space group. <strong>The</strong> latter was confirmed<br />
<strong>by</strong> Rietveld refinements. <strong>The</strong> peak pr<strong>of</strong>iles and precise<br />
lattice parameters were determined <strong>by</strong> LeBail-type fits<br />
[32] using the program GSAS [33]. <strong>The</strong> background exhibited<br />
various humbs caused <strong>by</strong> strong diffuse scattering<br />
and was modeled manually using GUFI. <strong>The</strong> peak-pr<strong>of</strong>ile<br />
was described <strong>by</strong> a pseudo-Voigt function in combination<br />
with a special function that accounts for the asymmetry<br />
due to axial divergence [34, 35].<br />
Rietveld refinements [36] were performed using the<br />
program package GSAS. Starting parameters for the atomic<br />
positions <strong>of</strong> b-sodium bismuthate were taken from the<br />
structurally related a-sodium ferrate NaFeO2. Starting values<br />
for the peak pr<strong>of</strong>ile, background, and lattice parameters<br />
were taken from the corresponding LeBail-fit. No<br />
additional phases were included in the refinement, but several<br />
excluded regions containing reflections <strong>of</strong> sodium hydroxide<br />
and bismuth oxide were defined. Structural variations<br />
causing diffuse scattering were not included in the<br />
refinement. <strong>The</strong> Rietveld refinement converged to agreement<br />
factors (R-values) listed in Table 1. <strong>The</strong> atomic coor-<br />
Table 1. Crystallographic data for b-<strong>Na3BiO4</strong> (average <strong>structure</strong>, from<br />
synchrotron powder data) in comparison with a-<strong>Na3BiO4</strong> [30].<br />
a-<strong>Na3BiO4</strong><br />
b-<strong>Na3BiO4</strong><br />
Formula <strong>Na3BiO4</strong> Na0.75Bi0.25O4<br />
Temperature (in K) 295 295<br />
Space group (No.) P2/c(13) R3m(166)<br />
Z 2 6<br />
a (in A) 5.87(1) 3.32141(9)<br />
b (in A) 6.69(6) ¼ a<br />
c (in A) 5.65(0) 16.4852(5)<br />
a (in ) 90 90<br />
b (in ) 109.8 90<br />
g (in ) 90 120<br />
V (in A) 208.8(19) 157.50(1)<br />
Rp (in %) 12.7<br />
Rwp (in %) 14.4<br />
RF (in %) 25.8<br />
R F 2 (in %) 29.9
Real <strong>structure</strong> <strong>of</strong> <strong>Na3BiO4</strong><br />
Table 2. Combined results <strong>of</strong> the refined parameters (Rietveld and PDF). Positional parameters and temperature factors for b-<strong>Na3BiO4</strong> at ambient<br />
conditions. Standard uncertainties are given in parentheses. Temperature factors <strong>of</strong> metal atoms on the same position were restrained.<br />
Atom x y z s<strong>of</strong> Rietveld URietveld UPDF (s<strong>of</strong> values fixed to<br />
Rietveld values)<br />
dinates, temperature factors, and fractional occupancies are<br />
given in Table 2 1 .<br />
Pair distribution function analysis<br />
<strong>The</strong> diffraction experiment for the Pair Distribution Function<br />
(PDF) analysis was performed at the 6ID-D mCAT<br />
beamline at the Advance Photon Source (APS) at Argonne<br />
National Laboratory. Data acquisition at a temperature <strong>of</strong><br />
T ¼ 300 K employed the recently developed rapid acquisition<br />
PDF (RA-PDF) technique [37] with the X-ray energy<br />
<strong>of</strong> 87.97 keV. Data were collected using an image plate<br />
1 Further details <strong>of</strong> the crystal <strong>structure</strong> investigation <strong>of</strong> b-<br />
<strong>Na3BiO4</strong> can be obtained from the Fachinformationszentrum Karlsruhe,<br />
D-76344 Eggenstein-Leopoldshafen, Germany, (fax: (+49)7247-<br />
808-666; e-mail: crysdata@fiz.karlsruhe.de) on quoting the depository<br />
numbers CSD-414158.<br />
camera (Mar345), with a usable diameter <strong>of</strong> 345 mm,<br />
mounted orthogonal to the beam path with a sample to<br />
detector distance <strong>of</strong> 159.88 mm. Lead shielding before the<br />
goniometer with a small opening for the incident beam<br />
was used to reduce the background. All raw data were<br />
integrated using the s<strong>of</strong>tware Fit2D [38, 39] and converted<br />
to intensity versus 2q. <strong>The</strong> integrated data were normalized<br />
with respect to the average monitor count, then transferred<br />
to the program PDFgetX2 [40] to carry out data<br />
reduction to obtain S(Q) and the PDF which are shown in<br />
Fig. 2a and 2b, respectively.<br />
High resolution transmission <strong>electron</strong> microscopy<br />
For HRTEM investigations microcrystalline samples <strong>of</strong><br />
<strong>Na3BiO4</strong> were crushed under dry argon atmosphere in a<br />
glove box. Perforated carbon/copper nets were covered<br />
with the powder, leaving the crystallites in random orientations.<br />
<strong>The</strong>se sample carriers were fixed in a side-entry,<br />
double-tilt holder (maximum tilt: 25 in two directions).<br />
An argon bag was used to transfer the sample holder to<br />
the microscope. High Resolution Transmission Electron<br />
Microscopy (HRTEM) and Selected Area Electron Diffraction<br />
(SAED) were performed in a Philips CM30ST<br />
(300 kV) which is equipped with a LaB6 cathode. SAED<br />
patterns were obtained using a diaphragm which limited<br />
the diffraction to a selected area <strong>of</strong> 2500 A in diameter.<br />
<strong>The</strong> EMS program package [41] served for the simulation<br />
<strong>of</strong> HRTEM micrographs (spread <strong>of</strong> defocus: 70 A, illumination<br />
semiangle: 1.2 mrad) and SAED patterns (kinematical<br />
approximation). All images were registered with a<br />
Multiscan CCD Camera (Gatan). EDX (energy dispersive<br />
X-ray spectroscopy) was performed with a Si/Li-EDX detector<br />
(Noran, Vantage System). All Fouriertransforms<br />
(FFT) were calculated from square regions <strong>of</strong> the HRTEM<br />
micrographs (S<strong>of</strong>tware: Digital Micrograph 3.6.1, Gatan).<br />
Results and discussion<br />
s<strong>of</strong> PDF UPDF UPDF<br />
Rmax (A) 20 20 20 6<br />
Bi(1) 0 0 0 0.206(1) 0.0113(3) 0.0112(4) 0.081(15) 0.0111(6) 0.01095(14)<br />
Na(1) 0 0 0 0.794(1) 0.0113(3) 0.0112(4) 0.919(16) 0.0111(6) 0.01095(14)<br />
Bi(2) 0 0 1<br />
=2 0.294(1) 0.0113(3) 0.0112(4) 0.419(16) 0.0111(6) 0.01095(14)<br />
Na(2) 0 0 1<br />
=2 0.706(1) 0.0113(3) 0.0112(4) 0.581(16) 0.0111(6) 0.01095(14)<br />
O 0 0 0.2407(6) 1.0 0.037(2) 0.0242(7) 1.0 0.0203(5) 0.0306(10)<br />
a<br />
b<br />
Fig. 2. <strong>The</strong> experimental reduced <strong>structure</strong> function FðQÞ ¼<br />
QðSðQÞ 1Þ <strong>of</strong> b-<strong>Na3BiO4</strong> (a) at room temperature from the X-ray<br />
measurement and (b) the corresponding PDF.<br />
X-ray analysis und <strong>structure</strong> solution<br />
233<br />
b-<strong>Na3BiO4</strong> crystallized as dark red, shiny crystals, exhibiting<br />
an undulated surface (Fig. 3) which gives hint towards<br />
a distorted crystal <strong>structure</strong>. No thermal degradation <strong>of</strong> the<br />
substance is observed in the thermal analysis up to a temperature<br />
<strong>of</strong> T ¼ 700 C. X-ray powder diffraction data <strong>of</strong><br />
the sample recorded after the DTA/TGA measurement ex-
234 S. Vensky, L. Kienle, R. E. Dinnebier et al.<br />
Fig. 3. SEM images b-<strong>Na3BiO4</strong> crystals.<br />
hibits exclusively reflections <strong>of</strong> the ordered a-modification.<br />
A Na : Bi ratio <strong>of</strong> 3 : 1 is found <strong>by</strong> chemical analysis<br />
(Na: exp. 18.0% (calc. 20,1%), Bi: 60,0% (61,1%)).<br />
<strong>The</strong> crystal <strong>structure</strong> <strong>of</strong> b-<strong>Na3BiO4</strong> was solved <strong>by</strong> Rietveld<br />
Refinement (Fig. 4). b-<strong>Na3BiO4</strong> crystallizes in trigonal<br />
symmetry (Fig. 5), showing strong relationship to the<br />
a-NaFeO2-type <strong>structure</strong> [42, 43], which may be derived<br />
from the rock-salt aristotype (cubic closest-packed oxygen<br />
anion arrangement with all octahedral voids occupied <strong>by</strong><br />
cations) with alternating cation layers along [111] ([001]<br />
in hexagonal metric). In contrast to the a-NaFeO2-type,<br />
Fig. 5. Average crystal <strong>structure</strong> <strong>of</strong> b-<strong>Na3BiO4</strong> at ambient conditions.<br />
Oxygen atoms are shown in white. <strong>The</strong> atom positions named “Na”<br />
represent a mixed occupancy <strong>of</strong> 80 at% sodium and 20 at% bismuth<br />
atoms, while the atom positions named “Bi” represent a mixed occupancy<br />
<strong>of</strong> 70 at% sodium and 30 at% bismuth atoms.<br />
where pure sodium and iron cation layers alternate, in b-<br />
<strong>Na3BiO4</strong> all cation layers are occupied <strong>by</strong> mixtures <strong>of</strong><br />
Na :Bi ratio <strong>of</strong> close to 3:1. Two types <strong>of</strong> cation layers<br />
exist, which are stacked alternatingly: one is enriched <strong>by</strong><br />
sodium up to a Na : Bi ratio <strong>of</strong> 3.85:1 (see Table 2), while<br />
the other is enriched <strong>by</strong> bismuth to a Na : Bi ratio <strong>of</strong><br />
2.40:1.<br />
Both, the Na enriched cation position Na(1)/Bi(1) and<br />
the Bi enriched position Na(2)/Bi(2) are coordinated <strong>by</strong><br />
oxygen anions in a trigonally distorted octahedral coordination<br />
with shorter distances (cation oxygen distances<br />
2.273(0) A for Na(2)/Bi(2); 2.451(0) A for Na(1)/Bi(1))<br />
for the position enriched <strong>by</strong> the smaller cation Bi 5+ . <strong>The</strong><br />
Fig. 4. Scattered X-ray intensity for b-<strong>Na3BiO4</strong> at<br />
ambient conditions as a function <strong>of</strong> the diffraction<br />
angle 2q. Shown are the observed pattern<br />
(diamonds), the best Rietveld fit pr<strong>of</strong>ile in space<br />
group R3m (a), the difference curve between observed<br />
and calculated pr<strong>of</strong>ile (b), and the reflection<br />
markers (vertical bars). <strong>The</strong> wavelength was<br />
l ¼ 0.18528(2) A. Several regions representing<br />
the decompositions products sodium hydroxide<br />
and bismuth oxide were excluded from the refinement.
Real <strong>structure</strong> <strong>of</strong> <strong>Na3BiO4</strong><br />
coordination sphere <strong>of</strong> the oxygen anion can best be described<br />
as a slightly distorted octahedron formed <strong>by</strong> sodium<br />
and bismuth.<br />
Due to the long coherence length <strong>of</strong> X-rays used, the<br />
average crystal <strong>structure</strong> <strong>of</strong> b-<strong>Na3BiO4</strong> was analyzed, resulting<br />
in a model with sodium und bismuth cations occupying<br />
almost statistically the same atomic positions. Because<br />
<strong>of</strong> the apparent diffuse scattering, the local order at<br />
the atomic level was studied <strong>by</strong> means <strong>of</strong> pair distribution<br />
function analysis.<br />
Pair distribution function analysis<br />
<strong>The</strong> <strong>real</strong>-space pair distribution function (PDF), G(r),<br />
gives the probability <strong>of</strong> finding pairs <strong>of</strong> atoms separated<br />
<strong>by</strong> distance r, and there<strong>by</strong> comprises peaks corresponding<br />
to all discrete interatomic distances. <strong>The</strong> experimental<br />
PDF is a direct Fourier transform <strong>of</strong> the total scattering<br />
<strong>structure</strong> function S(Q), the corrected, normalized intensity,<br />
from powder scattering data given <strong>by</strong><br />
where<br />
GðrÞ ¼ 2<br />
p<br />
ð1<br />
0<br />
Q½SðQÞ 1Š sin Qr dQ ;<br />
Q ¼ 4p<br />
sin q<br />
l<br />
is the magnitude <strong>of</strong> the scattering vector. Unlike crystallographic<br />
techniques, the PDF incorporates both Bragg and<br />
diffuse scattering intensities resulting in local structural information<br />
[44, 45]. Its high <strong>real</strong>-space resolution is ensured<br />
<strong>by</strong> measurement <strong>of</strong> scattering intensities over an extended<br />
Q range using short wavelength X-rays or<br />
neutrons.<br />
For the room-temperature data considered here, transformation<br />
<strong>of</strong> the FðQÞ ¼QðSðQÞ 1Þ; to a Qmax <strong>of</strong><br />
25.0 A 1 was found to be optimal. <strong>The</strong>re are basically two<br />
considerations. <strong>The</strong> first is to have sufficient Qmax to avoid<br />
large termination effects; the second is to reasonably minimize<br />
the noise level due to statistical fluctuations as the<br />
signal-to-noise ratio decreases with increasing Q. We<br />
found that Qmax <strong>of</strong> 25.0 A 1 has significantly lower noise<br />
level without losing useful structural information, i.e. no<br />
significant change <strong>of</strong> PDF peaks.<br />
<strong>The</strong> experimental PDF with Qmax 25.0 A 1 was refined<br />
within the crystallographic model <strong>of</strong> b-<strong>Na3BiO4</strong> as described<br />
in the chapter above. <strong>The</strong> constraints <strong>of</strong> space<br />
group R3m were maintained. Lattice parameters, thermal<br />
displacement parameters, and some experimental factors<br />
were refined. <strong>The</strong> occupancy <strong>of</strong> the atoms on each site<br />
was fixed according to the values (s<strong>of</strong> Rietveld) given in<br />
Table 2. We obtained lattice parameters <strong>of</strong> a ¼ b ¼<br />
3.34(8) A, and c ¼ 16.48(1) A. Figure 6a shows both the<br />
experimental and model PDFs. <strong>The</strong> UPDF obtained are<br />
summarized in Table 2 (column 7). It is clear from the<br />
figure, that the fit [46] is quite good (Rwp ¼ 0.21) in the<br />
high-r region above r ¼ 6 A indicating the model agrees<br />
with the PDF in this region. However significant deviations<br />
between the model and the data exist below r ¼ 6 A.<br />
In particular, the two model peaks at 2.45 A and 4.77 A<br />
235<br />
(Figs. 6a and 7a) are poorly fit. <strong>The</strong>y are (Na/Bi)–O and<br />
(Na/Bi)–(Na/Bi) peaks, respectively, originating from the<br />
O(Na/Bi)6 octahedra. <strong>The</strong>se peaks can be reduced in amplitude<br />
if these correlations have an excess <strong>of</strong> Na over Bi.<br />
We therefore tried relaxing the constraint <strong>of</strong> Bi occupancy<br />
on the 000 and 00 1 =2 sites, while maintaining the sample<br />
stoichiometry. We obtained a better value <strong>of</strong> the weightedpr<strong>of</strong>ile<br />
R-value, (Rwp ¼ 0.18) with the Bi occupancy at<br />
000 refining to 0.081 and the Bi occupancy at 00 1 =2 to<br />
0.419. Figure 6b shows the fits with the refinement results<br />
summarized in Table 2. In particular, the fit in the low-r<br />
region is improved, but still more intensity needs to be<br />
removed from the 2.45 A and 4.77 A peaks. <strong>The</strong>refore, we<br />
manually set the Bi atoms to have an occupancy <strong>of</strong> 0.0 at<br />
000 and an occupancy <strong>of</strong> 0.5 at 00 1 =2 and fixed these values.<br />
<strong>The</strong> resulting model agrees extremely well in the<br />
low-r region below 5 A (Rwp ¼ 0.13, Fig. 7b). However,<br />
the high-r region above 10 A is fit rather poorly (Rwp ¼<br />
0.30).<br />
On the surface, these results are in contradiction. <strong>The</strong><br />
average <strong>structure</strong> refined from both, the Rietveld refinement<br />
and the PDF fitting over a wider range <strong>of</strong> r, suggests<br />
that Bi is distributed approximately equally over the two<br />
crystallographic sites, 000 and 00 1 =2. However, the local<br />
<strong>structure</strong> refinement indicates clearly that Bi atoms preferredly<br />
localized at 00 1 =2. Disagreements between local and<br />
average <strong>structure</strong>s are not uncommon [44, 45] and these<br />
differences are always reconcilable <strong>by</strong> some averaging <strong>of</strong><br />
local structural motifs that yield a higher-symmetry average<br />
<strong>structure</strong>. <strong>The</strong> 000 and 00 1 =2 sites form sheets <strong>of</strong> (Na/<br />
Bi) sites perpendicular to the c-axis coming from the<br />
edge-shared O(Na/Bi)6 octahedra. Three 000-site atoms in<br />
a triangle form one face <strong>of</strong> the octahedra while the three<br />
00 1 =2-site atoms, with the triangle rotated 60 degrees, form<br />
the opposite face <strong>of</strong> the same octahedron. According to<br />
Fig. 6. <strong>The</strong> experimental GðrÞ (solid dots) and the calculated PDF<br />
(solid line) from the refined structural model <strong>of</strong> b-<strong>Na3BiO4</strong>. <strong>The</strong> difference<br />
curve shown <strong>of</strong>fset below: (a) Without refining the occupancy,<br />
(b) with refining the occupancy, (c) for manually setting Bi<br />
occupancy 0.0 at 000 and 0.5 at 00 1 =2.<br />
a<br />
b<br />
c
236 S. Vensky, L. Kienle, R. E. Dinnebier et al.<br />
Fig. 7. <strong>The</strong> experimental GðrÞ (solid dots) and the calculated PDF (solid<br />
line) from the refined structural model <strong>of</strong> b-<strong>Na3BiO4</strong>. <strong>The</strong> difference<br />
curve shown <strong>of</strong>fset below: (a) Without refining the occupancy, (b)<br />
manually setting Bi occupancy 0.0 at 000 and 0.5 at 00 1 =2.<br />
the average <strong>structure</strong> the Bi ions are distributed equally<br />
over both faces, whereas the local <strong>structure</strong> indicates that<br />
one face is preferred to be pure Na. In this, PDF could tell<br />
us something different. In the average <strong>structure</strong> the difference<br />
between the (000) and the (00 1 =2) sites is that the<br />
atoms on the former site form a long (2.45 A) bond with<br />
the oxygen at the center, whereas in the latter site form a<br />
shorter (2.27 A) bond to the oxygen. What is clear from<br />
the PDF is that the Bi ion always forms a short 2.27 A<br />
bond to the oxygen. As well, (Bi–Bi) try to have short<br />
bond (3.32 and 3.35 A) rather than 4.74 A, so that we can<br />
see the 4.74 A peak weak in the data but strong in the<br />
model.<br />
HRTEM investigation<br />
While <strong>by</strong> HR-XRD and PDF techniques bulk materials are<br />
analyzed, high resolution transmission <strong>electron</strong> microscopy<br />
(HRTEM) studies were performed on single crystallites.<br />
Samples <strong>of</strong> <strong>Na3BiO4</strong> with both, disordered crystals (bphase)<br />
from electrocrystallization and ordered crystals (aphase)<br />
from solid state synthesis were examined <strong>by</strong> <strong>electron</strong><br />
microscopy. According to EDX, the ratio Na : Bi<br />
( 3 :1) is equal in ordered and disordered crystals. <strong>The</strong><br />
ordered crystals were strongly affected <strong>by</strong> a segregation <strong>of</strong><br />
sodium and the formation <strong>of</strong> amorphous particles during<br />
exposure to the <strong>electron</strong> beam. SAED patterns recorded on<br />
the ordered crystals can be indexed assuming the monoclinic<br />
metrics <strong>of</strong> a-<strong>Na3BiO4</strong> [15].<br />
Three different <strong>structure</strong> models (I–III) with different<br />
arrangements <strong>of</strong> Na and Bi atoms were chosen for the<br />
indexing <strong>of</strong> reflections and zone axes. <strong>The</strong> first one<br />
(<strong>structure</strong> I, space group: Fm3m, a ¼ 4.716 A) represents<br />
an average NaCl-type <strong>structure</strong> with a random distribution<br />
<strong>of</strong> the metal atoms. Indices [uvw]cub refer to the metrics <strong>of</strong><br />
this <strong>structure</strong> which is also used for the indexing <strong>of</strong> the<br />
fundamental reflections. Structure II (indices hkltrig,<br />
[uvw]trig) corresponds to the average <strong>structure</strong> <strong>of</strong> b-<br />
a<br />
b<br />
<strong>Na3BiO4</strong> (see X-ray analysis). It is characterized <strong>by</strong> the<br />
partial order <strong>of</strong> Na and Bi atoms in exactly one <strong>of</strong> the<br />
{111}cub layers with a slight enrichment <strong>of</strong> Bi in every<br />
second (001)trig layer. Following the conventions <strong>of</strong> transformations<br />
[47], the indices <strong>of</strong> directions in direct space <strong>of</strong><br />
<strong>structure</strong> I and II are connected <strong>by</strong> the matrix Q1:<br />
0 1<br />
u<br />
@ v A<br />
w<br />
trig<br />
¼ Q1<br />
0 1<br />
u<br />
@ v A<br />
w<br />
cub<br />
0<br />
4=3<br />
B<br />
¼ @ 2=3<br />
2=3<br />
2=3<br />
1 0 1<br />
2=3 u<br />
C<br />
4=3 A @ v A<br />
1=6 1=6 1=6 w<br />
Structure III (indices hklmon, [uvw]mon) is the ordered<br />
monoclinic <strong>structure</strong>, a-<strong>Na3BiO4</strong>[15] (P2/c, a ¼ 5.87 A,<br />
b ¼ 6.69 A, c ¼ 5.65 A, b ¼ 109.8 ). <strong>The</strong> transformations<br />
<strong>of</strong> [uvw]mon and [uvw]trig follow the matrix Q2:<br />
0 1<br />
u<br />
@ v A<br />
w<br />
mon<br />
¼ Q2<br />
Electron diffraction<br />
0 1<br />
u<br />
@ v A<br />
w<br />
trig<br />
cub<br />
0<br />
0<br />
B<br />
¼ @ 1=4<br />
0<br />
1=4<br />
1 0 1<br />
3 u<br />
C<br />
0A@vA<br />
1=2 1=2 1 w<br />
Three different types <strong>of</strong> SAED patterns were observed<br />
within defined regions <strong>of</strong> b-<strong>Na3BiO4</strong> crystals corresponding<br />
to long-range order, short-range order, and partially<br />
ordered domains. All phenomena can be observed within<br />
the same microcrystal. Electron diffraction patterns <strong>of</strong><br />
long-range ordered microdomains exhibit no diffuse scattering,<br />
but fundamental reflections and super<strong>structure</strong> reflections.<br />
Short-range ordered domains are characterized<br />
<strong>by</strong> prominent diffuse scattering besides sharp fundamental<br />
reflections, while partially ordered microdomains exhibit<br />
concentrations <strong>of</strong> the diffuse scattering.<br />
<strong>The</strong> order within the long-range ordered microdomains<br />
was evidenced in different orientations <strong>by</strong> tilting separated<br />
microdomains systematically. All super<strong>structure</strong> reflections<br />
can be indexed assuming the monoclinic metrics <strong>of</strong> <strong>structure</strong><br />
III, i.e. a-<strong>Na3BiO4</strong>. <strong>The</strong> experimental intensities recorded<br />
on thin ordered microdomains agree convincingly<br />
with simulated ones based on <strong>structure</strong> III, cf. Fig. 8a.<br />
<strong>The</strong>refore, the <strong>structure</strong> <strong>of</strong> the microdomains is closely related<br />
to <strong>structure</strong> III. Additionally, for neighboring ordered<br />
microdomains multiple twinning is observed which can be<br />
rationalized <strong>by</strong> group-subgroup relations. <strong>The</strong> space group<br />
P2/c (<strong>structure</strong> III) is a maximal k subgroup (index 2) <strong>of</strong><br />
C2/m, which is a maximal t subgroup <strong>of</strong> R3m (index 3).<br />
Taking into account the symmetry relation (t4) between<br />
the space groups R3m and Fm3m (<strong>structure</strong> I), the maximum<br />
number <strong>of</strong> coexisting monoclinic domains with different<br />
orientations is twelve. <strong>The</strong> twinning can be described<br />
as twinning <strong>by</strong> reticular pseudomerohedry. In<br />
diffraction patterns <strong>of</strong> multiply twinned crystals one would<br />
expect fundamental reflections and a variable pattern <strong>of</strong><br />
super<strong>structure</strong> reflections depending on the orientations <strong>of</strong><br />
the transmitted ordered domains. One pro<strong>of</strong> <strong>of</strong> this expectation<br />
is depicted in Fig. 8 for zone axis h100icub. <strong>The</strong><br />
patterns <strong>of</strong> the separated ordered domains were recorded<br />
sequentially as depicted in Fig. 8a for the comparison <strong>of</strong><br />
simulated and experimental patterns with zone axes<br />
h101imon (left and center) and [111]mon (right). In Fig. 8b<br />
trig
Real <strong>structure</strong> <strong>of</strong> <strong>Na3BiO4</strong><br />
a<br />
b<br />
Fig. 8. SAED patterns <strong>of</strong> multiply twinned domains <strong>of</strong> the same crystal. (a) SAED patterns <strong>of</strong> separated domains. Left and center: h101imon,<br />
right: [111]mon. (b) Superpositions <strong>of</strong> two rotated h101imon, (left) and <strong>of</strong> [101]mon with [111]mon (right).<br />
two regions with different superpositions are shown (left:<br />
two rotated h101imon, right: [101]mon and [111]mon). <strong>The</strong><br />
twin boundaries in h100icub orientations are almost parallel<br />
to the incident <strong>electron</strong> beam. <strong>The</strong>refore, double diffraction<br />
is not significant and all patterns can be approximated<br />
<strong>by</strong> superimposed simulated patterns based on the monoclinic<br />
<strong>structure</strong> III, cf. Fig. 8b. <strong>The</strong> multiple twinning can<br />
also be demonstrated <strong>by</strong> HRTEM. <strong>The</strong> FFTs <strong>of</strong> neighboring<br />
domains correlate with variable orientations <strong>of</strong> multiple<br />
twinned monoclinic domains (not shown).<br />
Short-range order in microdomains leads to curved diffuse<br />
streaks in the SAED patterns. <strong>The</strong>se streaks are not<br />
passing through the almost sharp fundamental reflections<br />
hklcub. A splitting <strong>of</strong> the latter was observed in many zone<br />
axes orientations, indicating deviations from cubic average<br />
metrics. <strong>The</strong> pr<strong>of</strong>ile <strong>of</strong> the diffuse scattering perpendicular<br />
to the streaks is almost sharp. <strong>The</strong> 3D shape <strong>of</strong> the diffuse<br />
237<br />
intensity in reciprocal space defines a surface which can<br />
be reconstructed <strong>by</strong> tilting the crystals systematically. This<br />
surface is quite similar to the P* surface applied for the<br />
description <strong>of</strong> crystal <strong>structure</strong>s (see Fig. 9a) [48–50]. Sections<br />
<strong>of</strong> a surface with cos ph + cos pk + cos pl – 3(cos<br />
ph cos pk cos pl) ¼ 0 reproduce the diffuse streak’s geometry,<br />
see diffraction patterns and corresponding sections<br />
for the zone axes h100icub (b), h110icub (c), h111icub (d),<br />
h112icub (e) and h013icub (f) in Fig. 9. Similar surfaces had<br />
been previously observed for various short-range ordered<br />
NaCl-type compounds, e.g. non stoichiometric transition<br />
metal carbides, nitrides and oxides, as well as for chemically<br />
rather different compounds like the ternary oxide<br />
LiFeO2 [51, 52]. <strong>The</strong> similarity <strong>of</strong> these surfaces [53–60]<br />
and that <strong>of</strong> b-<strong>Na3BiO4</strong> indicate some relations <strong>of</strong> the disorder<br />
phenomena. A first and qualitative interpretation <strong>of</strong><br />
the diffuse scattering is based on a cluster model [55, 56].
238 S. Vensky, L. Kienle, R. E. Dinnebier et al.<br />
Applying this model to our problem, the <strong>structure</strong> <strong>of</strong> b-<br />
<strong>Na3BiO4</strong> would be considered to contain centered ONaxBi6 x<br />
octahedra (i.e. clusters) which represent the smallest ordered<br />
building units <strong>of</strong> the <strong>structure</strong>. Following generalized<br />
electrostatic valence rules [61, 62], one would expect<br />
a<br />
that the compositions <strong>of</strong> the clusters and the stoichiometry<br />
<strong>of</strong> the sample are preferably identical. Hence, b-<strong>Na3BiO4</strong><br />
would require ONa5Bi- and ONa4Bi2-octahedra at a ratio<br />
<strong>of</strong> 1 : 1. A related ratio <strong>of</strong> clusters (VC5 & and VC4 & 2) has<br />
been reported for short-range ordered V4C3 [63]. Assum-<br />
b c<br />
d e f<br />
Fig. 9. Surface <strong>of</strong> the diffuse intensity. (a) 3D model, (b)–(f) comparison <strong>of</strong> experimental SAED patterns and sections <strong>of</strong> the surface. (b)<br />
h100icub, (c) h110icub, (d) h111icub, (e) h012icub, (f) h013icub.
Real <strong>structure</strong> <strong>of</strong> <strong>Na3BiO4</strong><br />
ing these two types <strong>of</strong> clusters for b-<strong>Na3BiO4</strong> seems reasonable<br />
since these are <strong>real</strong>ized in the experimentally observed<br />
(ordered) <strong>structure</strong> III, i.e. a-<strong>Na3BiO4</strong>.<br />
This simple model <strong>of</strong> the <strong>real</strong> <strong>structure</strong> holds for constant<br />
diffuse intensity within the surface. However, characteristic<br />
deviations were observed <strong>by</strong> SAED recorded in<br />
selected regions <strong>of</strong> one crystal. <strong>The</strong> most common fluctuation<br />
<strong>of</strong> the diffuse intensity is connected with partial order<br />
<strong>of</strong> the <strong>real</strong> <strong>structure</strong> in one <strong>of</strong> the {111}cub layers, as described<br />
for the (001)trig layers <strong>of</strong> <strong>structure</strong> II. Consequently,<br />
the concentrations <strong>of</strong> the diffuse intensities are<br />
observed at the positions <strong>of</strong> super<strong>structure</strong> reflections<br />
hkltrig (cf. <strong>structure</strong> II). <strong>The</strong>se concentrations occur in different<br />
extent within one crystal, as depicted in Fig. 10a<br />
and c (left and center) for the zone axes h110icub and<br />
h013icub, respectively. For the h110icub pattern, the concen-<br />
Fig. 10. SAED patterns <strong>of</strong> b-<strong>Na3BiO4</strong>.<br />
(a) SAED patterns recorded on shortrange<br />
ordered domains (left) and partially<br />
ordered domains (right) <strong>of</strong> the<br />
same crystal. (b) Twinning <strong>of</strong> partially<br />
ordered domains h100itrig. Left and<br />
right: h100itrig, center: superposition.<br />
(c) SAED patterns recorded on differently<br />
ordered domains <strong>of</strong> the same<br />
crystal. Left: short-range ordered domain<br />
h013icub, center: partially ordered<br />
domain [141]trig, right: ordered domain<br />
[212]mon. (d) SAED patterns <strong>of</strong> partially<br />
ordered ðh100itrigÞ and ordered<br />
domains ([101]mon).<br />
a<br />
b<br />
c<br />
d<br />
239<br />
trations (Fig. 10a, right) are exclusively observed on positions<br />
1 =2 hhhcub or 1 =2 hhhcub. SAED patterns with simultaneous<br />
concentrations on both positions (Fig. 10b, center)<br />
were produced <strong>by</strong> twinning, as indicated <strong>by</strong> recording the<br />
diffraction patterns <strong>of</strong> the single domains sequentially, see<br />
Fig. 10b, left and right. <strong>The</strong> twinning can be rationalized<br />
<strong>by</strong> the symmetry relations between the aristotype <strong>of</strong><br />
<strong>Na3BiO4</strong> (i.e. <strong>structure</strong> I) and <strong>structure</strong> II. In a first step<br />
the symmetry <strong>of</strong> the aristotype is reduced to space group<br />
R3m which is a maximal t subgroup (index 4) <strong>of</strong> Fm3m<br />
(<strong>structure</strong> I). <strong>The</strong> c-axis <strong>of</strong> this trigonal unit cell is half <strong>of</strong><br />
that assumed for <strong>structure</strong> II. Due to this symmetry reduction,<br />
a maximum number <strong>of</strong> four distinguishable orientations<br />
is expected for domains with average trigonal symmetry.<br />
In a second step (i2), the symmetry is reduced <strong>by</strong><br />
doubling the c-axis. <strong>The</strong> coexistence <strong>of</strong> tilted domains
240 S. Vensky, L. Kienle, R. E. Dinnebier et al.<br />
with h100itrig orientations is consistent with this scenario.<br />
Microdiffraction [60, 64] is a useful tool to analyze the<br />
number <strong>of</strong> concentrations on different 1 =2 hhhcub-type positions<br />
<strong>by</strong> inspection <strong>of</strong> HOLZ (higher order Laue zone)<br />
patterns. <strong>The</strong>se experiments support the SAED results,<br />
particularly, concentrations <strong>of</strong> the diffuse intensity in separated<br />
domains occur exactly on one 1 =2 hhhcub-type position.<br />
<strong>The</strong> concentrations <strong>of</strong> the diffuse intensity in<br />
h013icub-patterns (Fig. 10c, center) are again observed on<br />
positions <strong>of</strong> super<strong>structure</strong> reflections hkltrig.<br />
All concentrations can be interpreted according to the<br />
partial order as observed for Ca5Y4S11 (symmetry <strong>of</strong> the<br />
average <strong>structure</strong>: R3m [60]). In that case, the 1 =2hhhcubtype<br />
concentrations originate from structural relaxation <strong>of</strong><br />
the S atoms and partial order <strong>of</strong> cations and vacancies.<br />
That type <strong>of</strong> order is characterized <strong>by</strong> an alternation <strong>of</strong> the<br />
average metal atoms occupancy in consecutive (001)trig<br />
layers. In b-<strong>Na3BiO4</strong> all metal positions are fully occupied,<br />
therefore, the alternation is due to the aggregation <strong>of</strong><br />
Na and Bi atoms in every second (001)trig metal layer. As<br />
observed, this ordering involves concentrations <strong>of</strong> the diffuse<br />
intensities and significant splitting <strong>of</strong> the fundamental<br />
reflections.<br />
It should be noted, that besides the diffuse concentrations<br />
produced <strong>by</strong> a trigonal partial order, we also observed<br />
other types <strong>of</strong> diffuse intensity distributions in<br />
SAED patterns. Again, they break the uniform intensity<br />
distribution <strong>of</strong> a pure short-range ordered <strong>structure</strong>. Such<br />
deviations from the cubic intensity distribution can be examined<br />
<strong>by</strong> tilting experiments which demonstrate the differences<br />
in patterns which should be equivalent.<br />
A coexistence <strong>of</strong> short-range order, partial order and<br />
long-range order within microdomains can be verified <strong>by</strong><br />
shifting the SAED aperture relative to the surface <strong>of</strong> one<br />
crystal. Following this strategy, the diffraction patterns <strong>of</strong><br />
Fig. 10c were recorded on the same crystal. <strong>The</strong> different<br />
scattering phenomena in addition to the fundamental reflections<br />
(left: exclusively diffuse scattering, center: concentrations<br />
<strong>of</strong> the diffuse scattering, right: super<strong>structure</strong><br />
reflections) indicate the complex domain <strong>structure</strong> <strong>of</strong><br />
<strong>Na3BiO4</strong>. Multiple twinning (cf. transformation matrices<br />
Q1,2) must be considered in order to rationalize possible<br />
orientations <strong>of</strong> coexisting domains. In Fig. 10d, the coexistence<br />
<strong>of</strong> partially ordered (left) and long-range ordered<br />
(right) domains in one crystal is presented for the zone<br />
axis h110icub. Due to the multiple twinning, the corresponding<br />
orientations <strong>of</strong> the domains are [100]trig and<br />
[101]mon. <strong>The</strong> different degree <strong>of</strong> order in neighboring domains<br />
can also be evidenced <strong>by</strong> Fourier transformation <strong>of</strong><br />
HRTEM micrographs (not shown).<br />
Structure models<br />
Several hypothetical <strong>structure</strong>s were assumed in order to<br />
model different distributions <strong>of</strong> Bi and Na atoms. A first<br />
series <strong>of</strong> <strong>structure</strong>s is based on a suitable supercell <strong>of</strong><br />
<strong>structure</strong> II. <strong>The</strong> initial symmetry was chosen triclinic<br />
(space group: P1) which enables us to vary the metal<br />
atoms arrangement without symmetry restrictions. In a following<br />
step the <strong>real</strong> (higher) symmetry <strong>of</strong> the metal arrangements<br />
was determined. As a matter <strong>of</strong> principle, two<br />
basic possibilities for the separation <strong>of</strong> the metal atoms in<br />
one <strong>of</strong> the {111}cub layers exist. <strong>The</strong> first one (space<br />
group: R3m, metrics <strong>of</strong> <strong>structure</strong> II) is designated <strong>structure</strong><br />
IV. It is characterized <strong>by</strong> an alternation <strong>of</strong> pure Na and<br />
mixed Na/Bi (001)trig layers (ratio Na :Bi ¼ 1:1). This<br />
motif <strong>of</strong> alternating layers reminds <strong>of</strong> <strong>structure</strong> II and the<br />
a-NaFeO2-type <strong>structure</strong> [42, 43]. <strong>The</strong> second possibility<br />
(<strong>structure</strong> V, space group P3m1) is based on a complete<br />
separation <strong>of</strong> the metal atoms, i.e. the formation <strong>of</strong> pure<br />
Na and Bi layers in large supercells.<br />
A common feature <strong>of</strong> <strong>structure</strong>s III and IV are ONa5Biand<br />
ONa4Bi2 octahedra, in cis and trans configurations <strong>of</strong><br />
the Bi atoms. <strong>The</strong> cis arrangement produces a remarkably<br />
short interatomic distance dBi–Bi<br />
3.36 A which is unfa-<br />
vorable with respect to the repulsion <strong>of</strong> Bi 5þ .However,it<br />
is possible to generate <strong>structure</strong>s (VI and VII) with optimized<br />
dBi–Bi <strong>by</strong> introducing trans configuration <strong>of</strong> the<br />
ONa4Bi2 octahedra [15]. <strong>The</strong>se <strong>structure</strong>s were described<br />
in space group P1, but they can be transformed to higher<br />
symmetry.<br />
Structure VI (Pm3m, a ¼ 4.716 A) reminds <strong>of</strong> the<br />
LiTiO2-type <strong>structure</strong> [65, 66], but the ratio <strong>of</strong> the metal<br />
atoms <strong>of</strong> 1 : 3 and 3:1 in alternating dense metal atom layers<br />
must be changed completely to 3:1, in the case <strong>of</strong> <strong>Na3BiO4</strong>.<br />
In contrast to <strong>structure</strong>s III and IV, <strong>structure</strong> VI contains<br />
ONa6- and trans ONa4Bi2 octahedra at a ratio <strong>of</strong> 1 : 3.<br />
Structure VII (I4mm, a ¼ 4.715 A, c ¼ 9.434 A) contains<br />
ONa5Bi- and trans-ONa4Bi2 octahedra at a ratio <strong>of</strong><br />
1:1.<br />
As deduced from MAPLE calculations [15] (Madelung-part<br />
<strong>of</strong> the lattice energy) [67], a trans configuration<br />
<strong>of</strong> the ONa4Bi2 octahedra seems not to be the commanding<br />
criterion for the formation <strong>of</strong> ordered a-<strong>Na3BiO4</strong>.<br />
Nevertheless, it is possible that small domains with an optimized<br />
(i.e. trans) arrangement <strong>of</strong> the Bi atoms exist in<br />
the <strong>real</strong> <strong>structure</strong>. <strong>The</strong>refore, <strong>structure</strong>s VI and VII were<br />
included.<br />
HRTEM<br />
<strong>The</strong> arrangement <strong>of</strong> Na and Bi atoms in the <strong>real</strong> <strong>structure</strong><br />
was examined <strong>by</strong> means <strong>of</strong> HRTEM and image simulations<br />
based on the four <strong>structure</strong> models mentioned above.<br />
<strong>The</strong> thickness and defocus values <strong>of</strong> the simulations were<br />
chosen similar. Structure V requires large supercells with<br />
Bi atoms at least in every forth (001)trig layer. Such an<br />
ordering served for a first simulation <strong>of</strong> HRTEM micrographs.<br />
A close inspection <strong>of</strong> all experimental HRTEM<br />
micrographs gives evidence that neither this variant nor<br />
more complex ones <strong>of</strong> this type is present in <strong>Na3BiO4</strong> –<br />
even not in nano-sized domains <strong>of</strong> the crystals. Hence, the<br />
<strong>real</strong> <strong>structure</strong> <strong>of</strong> <strong>Na3BiO4</strong> does not consist <strong>of</strong> pure layers<br />
<strong>of</strong> Na and Bi atoms, but <strong>of</strong> mixed Na/Bi layers. <strong>The</strong>refore,<br />
<strong>structure</strong> V can be ruled out.<br />
HRTEM micrographs recorded on areas with different<br />
orderings <strong>of</strong> the metal atoms are shown in Fig. 11. <strong>The</strong><br />
simulated micrographs are based on <strong>structure</strong> IV<br />
(Fig. 11b) and <strong>structure</strong> III (Fig. 11c), respectively. Structural<br />
relaxation was neglected in all simulations. As a first<br />
approximation, the white dots in all simulated micrographs
Real <strong>structure</strong> <strong>of</strong> <strong>Na3BiO4</strong><br />
Fig. 11. HRTEM micrographs and<br />
FFTs <strong>of</strong> differently ordered domains.<br />
(a) Domain with shortrange<br />
order, (b) Partially ordered<br />
domain with simulation based on<br />
<strong>structure</strong> IV (h100itrig, Df ¼<br />
15 nm, thickness: 1.5 nm). (c)<br />
Ordered domain with simulation<br />
based on <strong>structure</strong> III ðh101imon,<br />
Df ¼ 15 nm, thickness: 2.0 nmÞ.<br />
(Df ¼ 15 nm) correlate with high values <strong>of</strong> the projected<br />
potential, hence, mainly with positions strongly occupied<br />
<strong>by</strong> Bi atoms. A distinct interpretation <strong>of</strong> wide areas <strong>of</strong><br />
HRTEM micrographs is not possible in the case <strong>of</strong> domain<br />
crystals. <strong>The</strong> reconstruction <strong>of</strong> the 3D <strong>real</strong> <strong>structure</strong><br />
from the 2D information <strong>of</strong> HRTEM micrographs are not<br />
interpretable in terms <strong>of</strong> a defined <strong>real</strong> <strong>structure</strong> due to<br />
unsystematic superposition <strong>of</strong> differently ordered and orientated<br />
domains in the course <strong>of</strong> tilting experiments.<br />
However, a qualitative interpretation <strong>of</strong> the 2D metal<br />
atoms arrangement <strong>of</strong> separated and thin microdomains is<br />
possible. This had been checked for all four assumed<br />
<strong>structure</strong> models in the zone axis h110icub <strong>of</strong> the aristotype<br />
a<br />
b<br />
c<br />
241<br />
(similar parameters for all simulations). For a distinct assignment<br />
<strong>of</strong> the projections (HRTEM micrographs) to a<br />
3D metal atoms arrangements, twinning must be taken<br />
into account as one <strong>of</strong> the h110icub correspond to a defined<br />
set <strong>of</strong> zone axis in <strong>structure</strong>s IV–VII. As the main<br />
result <strong>of</strong> the simulations, only two types <strong>of</strong> characteristic<br />
simulated patterns <strong>of</strong> white dots exist:<br />
1) Zigzag patterns <strong>of</strong> white dots along h100icub. This<br />
pattern is characteristic for the projection <strong>of</strong> <strong>structure</strong><br />
III along zone axis [101]mon, cf. Fig. 11c.<br />
2) White contrasts in every second consecutive line<br />
which correlate with traces <strong>of</strong> {100}cub layers (not<br />
shown). This pattern is characteristic for all
242 S. Vensky, L. Kienle, R. E. Dinnebier et al.<br />
orientations <strong>of</strong> <strong>structure</strong> VI and was not observed in<br />
the HRTEM micrographs. <strong>The</strong>refore, <strong>structure</strong> VI<br />
has to be excluded and ordering <strong>of</strong> ONa6- and<br />
ONa4Bi2 octahedra with trans configuration <strong>of</strong> the<br />
Bi atoms (optimized dBi Bi, see above) can be discarded<br />
<strong>by</strong> the HRTEM observations. Experimentally,<br />
only type 1 patterns were observed in separated<br />
microdomains (see Fig. 11c).<br />
A formation <strong>of</strong> consecutive lines with white contrast<br />
corresponding to traces <strong>of</strong> {111}cub layers – not {100}cub,<br />
cf. type 2 – is the most frequently observed pattern in<br />
h110icub images (cf. Fig. 11b). However, this pattern is not<br />
specific for one 3D arrangement <strong>of</strong> the metal atoms. <strong>The</strong><br />
extent and separation <strong>of</strong> such {111}cub-ordering is quite<br />
different, as shown <strong>by</strong> Fig. 11a and b. In both images, the<br />
dominating motifs are white contrasts in every second<br />
trace <strong>of</strong> {111}cub layers. In Fig. 11a, partial order <strong>of</strong> the<br />
<strong>structure</strong> is not significant as both types <strong>of</strong> {111}cub traces<br />
form alternating lines with white spots. In the FFT, no<br />
concentrations <strong>of</strong> diffuse intensities occur. In Fig. 11b, one<br />
<strong>of</strong> the {111}cub layers is preferably occupied <strong>by</strong> Bi atoms.<br />
Hence, the local <strong>structure</strong> is characterized <strong>by</strong> partial order,<br />
as evidenced <strong>by</strong> the FFT (see concentrations <strong>of</strong> the diffuse<br />
scattering). In Fig. 11c, the zigzag patterns expected for<br />
the monoclinic order (<strong>structure</strong> III) are clearly visible.<br />
As images like Fig. 11a and 11b are representative for<br />
b-<strong>Na3BiO4</strong>, it seems at least probable that the motif <strong>of</strong> alternating<br />
{111}cub layers is a typical feature <strong>of</strong> the 3D <strong>real</strong><br />
<strong>structure</strong>. <strong>The</strong> precise occupancies <strong>of</strong> the metal positions<br />
within the microdomains cannot be derived from HRTEM,<br />
however, a more pronounced ordering <strong>of</strong> the metal atoms<br />
than derived from Rietveld refinement has to be assumed.<br />
For the interpretation <strong>of</strong> HRTEM micrographs, image<br />
processing is a useful tool and gives additional evidence for<br />
the partial order. Information about the sizes <strong>of</strong> the domains<br />
and their relative orientations can be obtained <strong>by</strong> applying a<br />
Fourier filter which extracts the diffuse concentrations for<br />
the inverse Fourier transformation (see circles in the FFT <strong>of</strong><br />
Fig. 12a). <strong>The</strong> resulting image may show artifacts due to the<br />
filtering. Yet, it verifies clearly the presence <strong>of</strong> microdomains<br />
(average diameter < 50 nm), cf. Fig. 12a. Additionally,<br />
a second feature <strong>of</strong> the <strong>real</strong> <strong>structure</strong> is clearly visualized,<br />
i.e. the formation <strong>of</strong> antiphase boundaries between the<br />
microdomains, see arrows in Fig. 12a highlighting a defined<br />
shift <strong>of</strong> t ¼ 1 =2 ctrig between neighboring domains. <strong>The</strong> formation<br />
<strong>of</strong> antiphase boundaries is interconnected with the<br />
ordering <strong>of</strong> the metal atoms. Like the twinning, this feature<br />
<strong>of</strong> the <strong>real</strong> <strong>structure</strong> can be rationalized <strong>by</strong> the group-subgroup<br />
relations (see above, second step (i2)).<br />
<strong>The</strong> micrograph and the simulations in Fig. 12b demonstrate<br />
the amount <strong>of</strong> the ordering in two neighboring microdomains.<br />
Simulation 1 is characterized <strong>by</strong> a uniform<br />
distribution <strong>of</strong> the contrasts corresponding with the random<br />
distribution <strong>of</strong> Na and Bi atoms <strong>of</strong> <strong>structure</strong> I. Simulation 2<br />
shows alternating lines <strong>of</strong> gray and white spots perpendicular<br />
to [001]trig correlating with the alternating Na and<br />
Na/Bi layers <strong>of</strong> <strong>structure</strong> IV. In the experimental micrograph<br />
both characteristics, alternation and uniform distribution<br />
is observed. <strong>The</strong> first within separated microdomains<br />
(cf. simulation 2), the second in the superpositioned area<br />
between antiphase domains. Hence, the uniform distribu-<br />
a<br />
b<br />
Fig. 12. HRTEM on domain crystals <strong>of</strong> b-<strong>Na3BiO4</strong>. (a) Processed image<br />
for partially ordered domains (see text) with FFT. (b) HRTEM<br />
micrograph (non processed image) <strong>of</strong> partially ordered domains with<br />
simulations (simulation 1: h110icub, Df ¼ 10 nm, thickness:<br />
1.5 nm, simulation 2: h100itrig, Df ¼ 10 nm, thickness: 1.5 nm).<br />
tion <strong>of</strong> the contrasts (simulation 1, <strong>structure</strong> I) is produced<br />
<strong>by</strong> averaging <strong>of</strong> partially ordered microdomains.<br />
Conclusion<br />
We have investigated the average and the <strong>real</strong> <strong>structure</strong> <strong>of</strong><br />
b-<strong>Na3BiO4</strong> using high resolution X-ray powder diffraction,<br />
pair distribution function analysis, and high resolution<br />
transmission <strong>electron</strong> microscopy. <strong>The</strong> tools employed<br />
show specific weaknesses and strengths, each. Evaluation<br />
<strong>of</strong> Bragg powder reflexions, provides insights into the<br />
average <strong>structure</strong> only, while Fourier transformations <strong>of</strong><br />
the total scattering, still integrating over the whole sample,<br />
provide the average local pair interactions. Finally,<br />
HRTEM images local defect <strong>structure</strong>s, but does not give<br />
the statistical weights with which specific defect patterns<br />
occur. Thus, it is not coming as a surprise, that, at a first<br />
glance, the different techniques applied are producing different<br />
and even deviating structural information. However,<br />
HRTEM and PDF are in good agreement.<br />
Fitting the measured Bragg intensities <strong>of</strong> the powder<br />
pattern result in a rock salt <strong>structure</strong> with a slight trigonal<br />
distortion with respect to the cubic unit cell. This symme-
Real <strong>structure</strong> <strong>of</strong> <strong>Na3BiO4</strong><br />
try reduction is caused <strong>by</strong> a partial ordering <strong>of</strong> the cations.<br />
Along [001]trig, corresponding to [111]cub, layers containing<br />
random distribution <strong>of</strong> the Na þ and Bi 5þ cations, however,<br />
with slightly varying Na :Bi ratios follow each other<br />
alternatingly. Thus, the average <strong>structure</strong> is coming very<br />
close to the a-NaFeO2 type <strong>of</strong> <strong>structure</strong>. Fitting the total<br />
scattered intensity, is basically confirming the results <strong>of</strong><br />
the Rietveld refinement. However, there are discrepancies<br />
concerning the Na : Bi ratios for the two crystallographically<br />
different cationic positions. This can be traced back<br />
to a larger amount <strong>of</strong> local <strong>structure</strong> information revealed<br />
<strong>by</strong> the total scattering experiment. In addition, the<br />
HRTEM results document a complex domain <strong>structure</strong><br />
within single cristallites. Three different local <strong>structure</strong>s<br />
are found. One corresponds to the ideal rock salt <strong>structure</strong><br />
with short-range order <strong>of</strong> the cations. <strong>The</strong> second is based<br />
on the ordered crystal <strong>structure</strong> <strong>of</strong> a-<strong>Na3BiO4</strong> with defined<br />
atomic positions for the sodium and bismuth atoms. <strong>The</strong><br />
third, which represents the majority <strong>of</strong> the investigated<br />
grains, matches what has been found as the average crystal<br />
<strong>structure</strong> <strong>of</strong> b-<strong>Na3BiO4</strong> <strong>by</strong> PDF analysis with approximately<br />
pure sodium and mixed sodium-bismuth layers.<br />
Taking into account the many stacking faults <strong>of</strong> this<br />
highly distorted crystal <strong>structure</strong>, it is evident that superpositions<br />
<strong>of</strong> these local <strong>structure</strong>s yield the average <strong>structure</strong>,<br />
as found <strong>by</strong> Rietveld analysis.<br />
No indication for fully ordered sections/regions which<br />
would comprise a cation sequence <strong>of</strong> Na/Na/Na/Bi were<br />
detected which is in full agreement with electrostatic reasoning.<br />
<strong>The</strong> results <strong>of</strong> the structural studies shed light on the<br />
way how b-<strong>Na3BiO4</strong> forms. It can be assumed that at the<br />
conditions <strong>of</strong> electrocrystallization a rock salt <strong>structure</strong><br />
forms with the cations randomly distributed. During cooling,<br />
the partially ordered <strong>structure</strong> <strong>of</strong> b-<strong>Na3BiO4</strong> is obtained,<br />
while the totally ordered form <strong>of</strong> a-<strong>Na3BiO4</strong> occures<br />
while annealing, or <strong>by</strong> solid state synthesis.<br />
It has been shown that even with the lack <strong>of</strong> crystals<br />
suitable for single crystal X-ray diffraction, a detailed analysis<br />
<strong>of</strong> the <strong>real</strong> <strong>structure</strong> <strong>of</strong> highly disordered materials is possible<br />
using a complementary methodical approach <strong>of</strong> <strong>electron</strong><br />
microscopy and high resolution diffraction techniques.<br />
Acknowledgments. Special thanks go to Viola Duppel for her assistance<br />
<strong>of</strong> the TEM measurements as well as to Sanela Kevrić for her<br />
assistance in sample preparation. Thanks also go to Dr. Alexander<br />
Hannemann and Zeljko Čančarević for visualizing the P* surface,<br />
Dr. Christian P. M. Oberndorfer for conducting the thermal analysis,<br />
Eva-Maria Peters for the SEM images, and to Pr<strong>of</strong>. Dr. Dr. h.c.<br />
mult. Arndt Simon for providing time at his TEM. SJLB and AM<br />
would like to thank Drs. Doug Robinson and Didier Wermeille for<br />
help in collecting the PDF data. Work in the Billinge group was<br />
supported <strong>by</strong> NSF through grant DMR-0304391. Research was carried<br />
out in part at beamline X17B1 <strong>of</strong> the National Synchrotron<br />
Light Source, Brookhaven National Laboratory, which is supported<br />
<strong>by</strong> the U.S. Department <strong>of</strong> Energy, Contract No. DE-AC02–<br />
76CH00016. PDF experiments were carried out at sector 6 <strong>of</strong> the<br />
Advanced Photon Source (APS). Sector 6 is supported <strong>by</strong> the US-<br />
DOE through the Ames Laboratory under Contract No. W-7405-<br />
Eng-82. <strong>The</strong> APS is supported <strong>by</strong> DOE under contract W-31-109-<br />
Eng-38. Financial support <strong>by</strong> the Deutsche Forschungsgemeinschaft<br />
(DFG), the Bundesministerium für Bildung und Forschung (BMBF),<br />
and the Fonds der Chemischen Industrie (FCI) is gratefully acknowledged.<br />
References<br />
243<br />
[1] Wyck<strong>of</strong>f, R. W. G.: <strong>The</strong> crystal <strong>structure</strong>s <strong>of</strong> some carbonates <strong>of</strong><br />
the calcite group. Amer. J. Sci. 50 (1920) 317–360.<br />
[2] Sass, R. L.; Vidale, R.; Donohue, J.: Interatomic distances and<br />
thermal anisotropy in sodium nitrate and calcite. Acta Crystallogr.<br />
10 (1957) 567–570.<br />
[3] Klein, W.; Jansen, M.: Synthesis and crystal <strong>structure</strong> analysis<br />
<strong>of</strong> sodium ozonide. Z. Anorg. Allg. Chem. 626 (2000) 136–<br />
140.<br />
[4] von Stackelberg, M.: <strong>The</strong> crystal <strong>structure</strong> <strong>of</strong> calcium carbide.<br />
Naturwissenschaften 18 (1930) 305–306.<br />
[5] Hendricks, S. B.; Pauling, L.: <strong>The</strong> crystal <strong>structure</strong>s <strong>of</strong> sodium<br />
and potassium trinitrides and potassium cyanate and the nature<br />
<strong>of</strong> the trinitride group. J. Am. Chem. Soc. 47 (1925) 2904–<br />
2920.<br />
[6] Himmel, K.; Jansen, M.: On the geometry <strong>of</strong> the fulleride dianion<br />
C60 2 in crystalline fullerides – synthesis and crystal <strong>structure</strong><br />
<strong>of</strong> [M(NH3)6]C60 6NH3 (M ¼ Mn 2+ ,Cd 2+ ). Eur. J. Inorg.<br />
Chem. (1998) 1183–1186.<br />
[7] Brumm, H.; Jansen, M.: Synthesis and single crystal <strong>structure</strong><br />
analysis <strong>of</strong> [M(NH3)6]C60 6NH3 (M ¼ Co 2+ ,Zn 2+ ). Z. Anorg.<br />
Allg. Chem. 627 (2001) 1433–1435.<br />
[8] Lang, G.: Structural comparison <strong>of</strong> ternary and quaternary oxides.<br />
Z. Anorg. Allg. Chem. 348 (1966) 246–256.<br />
[9] Kreuzburg, G.; Stewner, F.; Hoppe, R.: Crystal stucture <strong>of</strong><br />
Li2SnO3. Z. Anorg. Allg. Chem. 379 (1970) 242–254.<br />
[10] Jansen, M.; Hoppe, R.: Knowledge <strong>of</strong> NaCl-type <strong>structure</strong> family<br />
– new investigations on Li2MnO3. Z. Anorg. Allg. Chem.<br />
397 (1973) 279–289.<br />
[11] Strobel, P.; Lambert-Andron, B.: Crystallographic and magnetic<br />
<strong>structure</strong> <strong>of</strong> Li2MnO3. J. Solid State Chem. 75 (1988) 90–98.<br />
[12] Riou, A.; Lecerf, A.; Gerault, Y.; Cudennec, Y.: Structural studies<br />
<strong>of</strong> lithium manganese oxide (Li2MnO3). Mater. Res. Bull.<br />
27 (1992) 269–275.<br />
[13] Shaplygin, I. S.; Lazarev, V. B.: New phases in a sodium-ruthenium-oxygen<br />
system. Russ. J. Inorg. Chem. 25 (1980) 1837–<br />
1840.<br />
[14] Mogare, K. M.; Friese, K.; Klein, W.; Jansen, M.: Syntheses<br />
and crystal <strong>structure</strong>s <strong>of</strong> two sodium ruthenates: Na2RuO4 and<br />
Na2RuO3. Z. Anorg. Allg. Chem. 630 (2004) 547–552.<br />
[15] Schwedes, B.; Hoppe, R.: Oxobismuthates – Compounds<br />
<strong>Na3BiO4</strong> and Na3SbO4. Z. Anorg. Allg. Chem. 393 (1972)<br />
136–148.<br />
[16] Kumada, N.; Takahashi, N.; Kinomura, N.; Sleight, A. W.: Preparation<br />
and crystal stucture <strong>of</strong> a new lithium bismuth oxide:<br />
LiBiO3. J. Solid State Chem. 126 (1996) 121–126.<br />
[17] Blasse, G.: On the <strong>structure</strong> <strong>of</strong> some compounds Li3M 5+ O4 and<br />
some other mixed metal oxides containing lithium. Z. Anorg.<br />
Allg. Chem. 331 (1964) 44–50.<br />
[18] Aurivillius, B.: X-ray studies on sodium metabismuthates. Acta<br />
Chem. Scand. 9 (1955) 1219–1221.<br />
[19] Zintl, E.; Scheiner K.: Sodium bismuthate. Z. Anorg. Allg.<br />
Chem. 245 (1940) 32–34.<br />
[20] Jansen, M.: Preparation <strong>of</strong> anhydrous KBiO3. Z. Naturforsch. B<br />
32 (1977) 1340–1341.<br />
[21] Nguyen, T. N.; Giaquinta, D. M.; Davis, W. M.; zur Loye, H.-<br />
C.: Electrosynthesis <strong>of</strong> KBiO3: A potassium ion conductor with<br />
the KSbO3 tunnel <strong>structure</strong>. Chem. Mater. 5 (1993) 1273–1276.<br />
[22] Sasirekha Kodialam; Korthius, V. C.; H<strong>of</strong>fmann, R.-D.; Sleight,<br />
A. W.: Electrodeposition <strong>of</strong> potassium bismuthate: KBiO3. Mater.<br />
Res. Bull. 27 (1992) 1379–1384.<br />
[23] Emmerling, F.; Idilbi, M.; Röhr, C.: New oxopnictates A3MO4:<br />
Synthesis and crystal <strong>structure</strong> <strong>of</strong> A3AsO4 (A ¼ K, Rb, Cs) and<br />
K3BiO4. Z. Naturforsch. B57 (2002) 599–604.<br />
[24] Greaves, C.; Katib, S. M. A.: <strong>The</strong> <strong>structure</strong>s <strong>of</strong> Li5BiO5 and<br />
Li5SbO5 from powder neutron diffraction. Mater. Res. Bull. 24<br />
(1989) 973–980.<br />
[25] Mühle, C.; Dinnebier, R. E.; van Wüllen, L.; Schwering, G.;<br />
Jansen, M.: New insights into stuctural and dynamical features<br />
<strong>of</strong> lithium hexaoxometallates Li7MO6 (M ¼ Nb, Ta, Sb, Bi). Inorg.<br />
Chem. 43 (2004) 874–881.<br />
[26] Zhong, Z.; Kao, C. C.; Siddons, D. P.; J. B. Hastings: Sagittal<br />
focusing <strong>of</strong> high-energy synchrotron X-rays with asymmmetric
244 S. Vensky, L. Kienle, R. E. Dinnebier et al.<br />
Laue crystals. I. <strong>The</strong>oretical considerations. J. Appl. Crystallogr.<br />
34 (2001) 504–509.<br />
[27] Zhong, Z.; Kao, C. C.; Siddons, D. P.; J. B. Hastings: Sagittal<br />
focusing <strong>of</strong> high-energy synchrotron X-rays with asymmmetric<br />
Laue crystals. II. Experimental studies. J. Appl. Crystallogr. 34<br />
(2001) 646–653.<br />
[28] Zhong, Z.; Kao, C. C.; Siddons, D. P.; J. B. Hastings: Rockingcurve<br />
width <strong>of</strong> sagittally bent Laue crystals. Acta Crystallogr.<br />
A58 (2002) 487–493.<br />
[29] Zhong, Z.; Kao, C. C.; Siddons, D. P.; Zhong, H.; J. B. Hastings:<br />
A lamellar model for the X-ray rocking curves <strong>of</strong> sagittally<br />
bent Laue crystals. Acta Crystallogr. A58 (2002) 487–493.<br />
[30] Dinnebier, R. E.; Finger, L. W.: GUFI 5.0. Z. Kristallogr. Suppl.<br />
15 (1998) 148.<br />
[31] Visser, J. W.: A fully automatic program for finding unit cell<br />
from powder data. J. Appl. Crystallogr. 2 (1969) 89–95.<br />
[32] Le Bail, A.; Duroy, H.; Fouerquet, J. L.: Ab-initio <strong>structure</strong> determination<br />
<strong>of</strong> LiSbWO6 <strong>by</strong> X-ray powder diffraction. Mater.<br />
Res. Bull. 23 (1988) 447–452.<br />
[33] Larson, A. C.; von Dreele, R. B.: GSAS, version 2002. Los<br />
Alamos National Laboratory Report LAUR 86–748. Los Alamos<br />
National Laboratory, Los Alamos, USA 2002.<br />
[34] Thompson, P.; Cox, D. E.; Hastings, J. B.: Rietveld refinement<br />
<strong>of</strong> De<strong>by</strong>e-Scherrer synchrotron X-ray data from Al2O3. J. Appl.<br />
Crystallogr. 20 (1987) 79–83.<br />
[35] Finger, L. W.; Cox, D. E.; Jephcoat, A. P.: A correction for<br />
powder diffraction peak asymmetry due to axial divergence. J.<br />
Appl. Crystallogr. 27 (1994) 892–900.<br />
[36] Rietveld, H. M.: A pr<strong>of</strong>ile refinement method for nuclear and<br />
magnetic <strong>structure</strong>s. J. Appl. Crystallogr. 2 (1969) 65–71.<br />
[37] Chupas, P. J.; Qiu, X.; Hanson, J. C.; Lee, P. L.; Grey, C. P.;<br />
Billinge, S. J. L.: Rapid acquisition pair distribution function<br />
analysis (RA-PDF). J. Appl. Crystallogr. 36 (2003) 1342–1347.<br />
[38] Hammersley, A. P.: FIT2D, Vers. 9.129. ESRF Internal Report<br />
ESRF98HA01T.<br />
[39] Hammersley, A. P.; Svenson, S. O.; Hanfland, M.; Hauserman, D.:<br />
Two-dimensional detector s<strong>of</strong>tware: From <strong>real</strong> detector to idealised<br />
image or two-theta scan. High Pressure Res. 14 (1996) 235–248.<br />
[40] Qiu, X.; Thompson, J. W.; Billinge, S. J. L.: PDFgetX2: a GUI<br />
driven program to obtain the pair distribution function from X-ray<br />
powder diffraction data. J. Appl. Crystallogr. 37 (2004) 678.<br />
[41] Stadelmann, P. A.: EMS – a s<strong>of</strong>tware package for <strong>electron</strong>-diffraction<br />
analysis and HREM image simulation in materials<br />
science. Ultramicroscopy 21 (1987) 131–145.<br />
[42] Goldsztaub, S.: Study <strong>of</strong> some derivates <strong>of</strong> ferric oxide<br />
(FeOOH, FeO2Na, FeOCl); determination <strong>of</strong> their <strong>structure</strong>s.<br />
Bull. Soc. Franc. Minral. 58 (1935) 6–76.<br />
[43] Takeda, Y.; Nakahara, K.; Nishijima, M.; Imanishi, N.; Yamamoto,<br />
O.; Takano, M.; Kanno, R.: Sodium deintercalation from<br />
sodium iron oxide. Mater. Res. Bull. 29 (1994) 659–666.<br />
[44] Egami, T.; Billinge, S. J. L.: Underneath the Bragg peaks: Structural<br />
analysis <strong>of</strong> complex materials. Pergamon Press Elsevier,<br />
Oxford 2003.<br />
[45] Kanatzidis, M. G.; Billinge, S. J. L.: Beyond crystallography:<br />
<strong>The</strong> study <strong>of</strong> disorder nanocrystallinity and crystallographically<br />
challenged materials. Chem. Commun. (2004) 749–760.<br />
[46] Pr<strong>of</strong>fen, Th.; Billinge, S. J. L.: PDFFIT: A program for full pr<strong>of</strong>ile<br />
structural refinement <strong>of</strong> the atomic pair distribution function.<br />
J. Appl. Crystallogr. 32 (1999) 572–575.<br />
[47] Hahn, T.: International tables for Crystallography, Vol. A.<br />
Kluwer Academic Publishers, Dordrecht 2000.<br />
[48] Nesper, R.; von Schnering, H. G.: Periodic equipotential layers<br />
(PEPS). Z. Kristallogr. 170 (1985) 138–140.<br />
[49] Nesper, R.; von Schnering, H. G.: Periodic potential surfaces in<br />
crystal stuctures. Angew. Chem. Int. Ed. 25 (1986) 110–112.<br />
[50] von Schnering, H. G.; Nesper, R.: How nature adapts chemical<br />
<strong>structure</strong>s to curved surfaces. Angew. Chem. Int. Ed. 26 (1987)<br />
1059–1080.<br />
[51] Allpress, J. G.: Electron microscopy <strong>of</strong> lithium ferrites – precipitation<br />
<strong>of</strong> LiFe5O8 in a-LiFeO2. J. Mater. Sci. 6 (1971) 313.<br />
[52] Tanaka, N.; Cowley, J. M.: High-resolution <strong>electron</strong> microscopy<br />
<strong>of</strong> disordered lthium ferrites. Ultramicroscopy 17 (1985) 365–<br />
377.<br />
[53] Billingham, J.; Bell, P. S.; Lewis, M. H.: Vacancy short-range<br />
order in substoichiometric transition metal carbides and nitrides<br />
with the NaCl <strong>structure</strong>. I. Electron diffraction studies <strong>of</strong> shortrange<br />
ordered compounds. Acta Crystllogr. A28 (1972) 602–<br />
606.<br />
[54] Sauvage, M.; Parthé, E.: Vacancy short-range order in substoichiometric<br />
transition metal carbides and nitrides with the NaCl<br />
<strong>structure</strong>. II. Numerical calculation <strong>of</strong> vacancy arrangement.<br />
Acta Crystllogr. A28 (1972) 607–616.<br />
[55] Sauvage, M.; Parthé, E.: Prediction <strong>of</strong> diffuse intensity surfaces<br />
in short-range ordered ternary derivative <strong>structure</strong>s based on<br />
SnS, NaCl, CsCl, an other stuctures. Acta Crystallogr. A30<br />
(1974) 239–246.<br />
[56] De Ridder, R.; van Tendeloo, G.; Amelinckx, S.: A cluster model<br />
for the transition from short-range order to the long-range<br />
order state in f.c.c based binary systems and its studies <strong>by</strong><br />
means <strong>of</strong> <strong>electron</strong> diffraction. Acta Crystllogr. A32 (1976) 216–<br />
224.<br />
[57] Kennett, H. M.; Rudee, M. L.: Short-range an long-range ordering<br />
<strong>of</strong> vacancies in nonstochiometric zirconium sulfide. Philos.<br />
Mag. 35 (1977) 129–137.<br />
[58] Ohshima, K.; Harada, J.; Morinaga, M.; Georgopoulos, P.; Cohen,<br />
J. B.: Distortion-induced scattering due to vacancies in<br />
NbC0.72. Acta Crystallogr. A44 (1988) 167–176.<br />
[59] Guymont, M.; Thomas, A.; Palazzi, M.: Short-range order in<br />
EuLiS2 <strong>by</strong> <strong>electron</strong> microscopy. Phys. Status Solidi A118 (1990)<br />
29–40.<br />
[60] Withers, R. L.; Otero-Diaz, L. C.; Thompson, J. G.: A TEM<br />
study <strong>of</strong> defect ordering in a calcium yttrium sulfide solid-solution<br />
with an average NaCl type <strong>structure</strong>. J. Solid State Chem.<br />
111 (1994) 283–293.<br />
[61] Pauling, J.: <strong>The</strong> nature <strong>of</strong> the chemical bond. Cornell Univ.<br />
Press, Ithaca 1960.<br />
[62] Brunel, M.; de Bergevin, F.; Gondrand, M.: <strong>The</strong>oretical determination<br />
and existence domains fo different super<strong>structure</strong>s in<br />
A 3+ B 1+ X 2- 2 <strong>of</strong> the sodium chloride type. J. Phys. Chem. Solids<br />
33 (1972) 1927–1941.<br />
[63] Froidevaux, C.; Rossier, D.: NMR investigations <strong>of</strong> the atomic<br />
and <strong>electron</strong>ic <strong>structure</strong> <strong>of</strong> vanadium and niobium carbides. J.<br />
Phys. Chem. Solids 28 (1967) 1197–1209.<br />
[64] Morniroli, J. P.; Steeds, J. W.: Microdiffraction as a tool for<br />
crystal <strong>structure</strong> identification and determination. Ultramicroscopy<br />
45 (1992) 219–239.<br />
[65] Cava, R. J.; Murphy, D. W.; Zahurak, S.; Santoro, A.; Roth, R.<br />
S.: <strong>The</strong> crystal <strong>structure</strong>s <strong>of</strong> the lithium inserted metal oxides<br />
Li0.5TiO2 anatase, LiTi2O4 spinel, and Li2Ti2O4. J. Solid State<br />
Chem. 53 (1984) 64–75.<br />
[66] Lissner, F.; Schleid, Th.: Single crystals <strong>of</strong> NaPrTe2 with Li-<br />
TiO2-type <strong>structure</strong>. Z. Anorg. Allg. Chem. 629 (2003) 1895–<br />
1897.<br />
[67] Hoppe, R.: Madelung constants. Angew. Chem. Int. Ed. 5<br />
(1966) 95.