M&E Training Manual (Pages 139-154)
M&E Training Manual (Pages 139-154)
M&E Training Manual (Pages 139-154)
You also want an ePaper? Increase the reach of your titles
YUMPU automatically turns print PDFs into web optimized ePapers that Google loves.
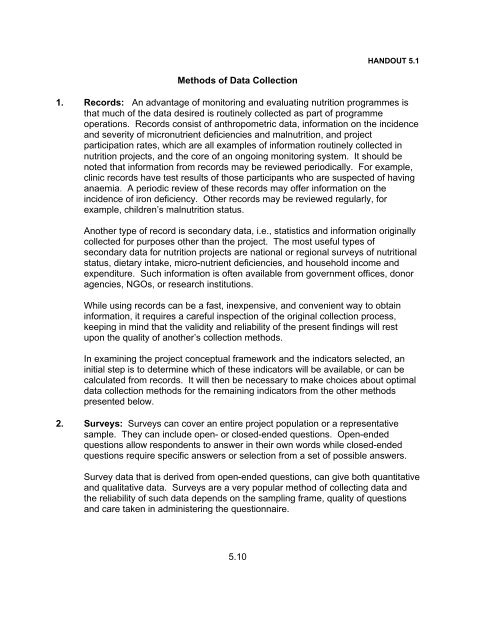
HANDOUT 5.1<br />
Methods of Data Collection<br />
1. Records: An advantage of monitoring and evaluating nutrition programmes is<br />
that much of the data desired is routinely collected as part of programme<br />
operations. Records consist of anthropometric data, information on the incidence<br />
and severity of micronutrient deficiencies and malnutrition, and project<br />
participation rates, which are all examples of information routinely collected in<br />
nutrition projects, and the core of an ongoing monitoring system. It should be<br />
noted that information from records may be reviewed periodically. For example,<br />
clinic records have test results of those participants who are suspected of having<br />
anaemia. A periodic review of these records may offer information on the<br />
incidence of iron deficiency. Other records may be reviewed regularly, for<br />
example, children’s malnutrition status.<br />
Another type of record is secondary data, i.e., statistics and information originally<br />
collected for purposes other than the project. The most useful types of<br />
secondary data for nutrition projects are national or regional surveys of nutritional<br />
status, dietary intake, micro-nutrient deficiencies, and household income and<br />
expenditure. Such information is often available from government offices, donor<br />
agencies, NGOs, or research institutions.<br />
While using records can be a fast, inexpensive, and convenient way to obtain<br />
information, it requires a careful inspection of the original collection process,<br />
keeping in mind that the validity and reliability of the present findings will rest<br />
upon the quality of another’s collection methods.<br />
In examining the project conceptual framework and the indicators selected, an<br />
initial step is to determine which of these indicators will be available, or can be<br />
calculated from records. It will then be necessary to make choices about optimal<br />
data collection methods for the remaining indicators from the other methods<br />
presented below.<br />
2. Surveys: Surveys can cover an entire project population or a representative<br />
sample. They can include open- or closed-ended questions. Open-ended<br />
questions allow respondents to answer in their own words while closed-ended<br />
questions require specific answers or selection from a set of possible answers.<br />
Survey data that is derived from open-ended questions, can give both quantitative<br />
and qualitative data. Surveys are a very popular method of collecting data and<br />
the reliability of such data depends on the sampling frame, quality of questions<br />
and care taken in administering the questionnaire.<br />
5.10
3. Direct Measurements: Direct measurements are usually necessary to ascertain<br />
changes in nutrition status resulting from a project. They often are included in<br />
surveys and, when used programmatically, are likely to be included in project<br />
records. A number of specific methods are often employed in direct<br />
measurements and these include the following:<br />
Anthropometry: ht/age, wt/age, wt/ht, BMI<br />
Biochemical indices: blood analysis, urine, and breast milk<br />
Clinical signs of micronutrient deficiencies, i.e., goitre and night blindness<br />
Direct measurements can be influenced by precision, e.g., periodic calibration of<br />
scales for anthropometric measurements is necessary.<br />
4. Observation: Observations are one method used to assess time-use patterns<br />
and behaviours related to desired outcomes. Observation can also offer valuable<br />
insights into the social and physical context of the problem being addressed and<br />
the use of project inputs. The “observer” needs to develop a good relationship<br />
with the observed, if possible, by spending time living with the observed, so that<br />
the observed are no longer conscious of the observer’s physical presence. When<br />
this happens, the process is called participatory observation. It is desirable but<br />
rarely achieved.<br />
5. Key Informant Interviews and Focus Group Discussions: A key informant<br />
interview involves a face-to-face meeting between a trained interviewer and a<br />
person who can provide an overview/big picture of knowledge, attitudes or<br />
practices of the group being monitored or evaluated, i.e., target population. They<br />
may be part of the target population (e.g., project staff, mothers, school children,<br />
or mothers-in-law) but not necessarily so (e.g., a medical specialist presenting<br />
views on a community’s disease patterns). Key informants provide a broad view<br />
of the situation and this overview is critical in data collection.<br />
Similarly a focus group discussion involves group dynamics that allow participants<br />
to respond to one another’s perceptions, generating new ideas and highlighting<br />
conflicting attitudes that might otherwise be inaccessible to an outsider.<br />
Focus group discussions should be held with small groups of people who have<br />
similar characteristics, e.g., mothers of small children, parents of teenagers, and<br />
they should be led by a moderator/facilitator who uses a question guide to<br />
introduce topics of interest. In focus group discussions:<br />
C<br />
C<br />
the flow of discussion creates an environment to probe deeply into<br />
beliefs and concepts about a particular subject. Creating such an<br />
ideal environment requires appropriate settings for interaction<br />
between the interviewer and stakeholder(s) without distractions.<br />
the deliberations of the discussion should either be tape recorded or<br />
written down by a recorder. However, moderators/facilitators must<br />
5.11
always discuss tape recording and note-taking with participants,<br />
making sure that there is agreement. It should be remembered that<br />
tape recording and note-taking are very intimidating to participants.<br />
Therefore, there must be specific and general acceptance by the<br />
participants.<br />
Key informant interviews and focus groups with stakeholders are among the<br />
fastest and least expensive of data collection techniques. These techniques are<br />
particularly effective for projects that attempt to change behaviours such as<br />
nutrition communication campaigns.<br />
Focus group participants and key informants should represent the entire range of<br />
stakeholders in order to yield clear and candid insights.<br />
Although key informant interviews and focus groups can provide important<br />
contextual information, certain difficulties should be anticipated:<br />
C<br />
C<br />
C<br />
Open-ended questions are difficult to code and analyse but can<br />
provide valuable information which cannot be provided by any other<br />
method.<br />
It is not always possible to compare the information within and<br />
between projects statistically because there are no standard<br />
response categories. However, qualitative comparisons such as<br />
perceived effectiveness or likely sustainability can still be made.<br />
Interviewers and moderators need to be experienced staff who are<br />
capable of probing with follow-up questions for answers and eliciting<br />
and recording adequately detailed information.<br />
5.12
HANDOUT 5.2<br />
FOCUS GROUP DISCUSSIONS<br />
FOCUS GROUP DISCUSSIONS AND INTERVIEWS<br />
Focus group discussions (FGDs) are a qualitative method designed to use group<br />
dynamics and the flow of discussion to probe deeply into the images, beliefs, and<br />
concepts that people have about a particular subject. Ideally, people become involved<br />
in the discussion and react to one another's comments. It is not a group interview but a<br />
group discussion focussed on a topic. These guided discussions are held with small<br />
groups of people who have similar characteristics. For example, hold discussions with a<br />
group of low-income fathers, with mothers of children under two years, or with traditional<br />
healers. The discussions are led by a trained moderator who uses a question guide to<br />
introduce the topics of interest and probe for deeper discussion.<br />
Focus group discussions can be used to:<br />
• focus the evaluation and develop relevant evaluation questions by<br />
exploring in greater depth the problem to be investigated and its possible<br />
causes;<br />
• formulate appropriate questions for more structured larger-scale surveys;<br />
• supplement information on community knowledge, beliefs, attitudes and<br />
behaviour already available but incomplete or unclear;<br />
• develop appropriate messages for health education programmes;<br />
• explore controversial topics and issues.<br />
Focus group discussions (FGDs) provide valuable information when they are properly<br />
planned and executed. The following points should be considered when planning for a<br />
focus group discussion:<br />
• it is important to prepare a set of written guidelines on the objectives and<br />
how to conduct the FGDs. There should be a written list of topics to be<br />
covered. It is formulated as a series of open-ended questions;<br />
• the seating arrangements should facilitate communication. Arrange the<br />
respondents so that they sit in a circle and encourage respondents to<br />
interact and express their views freely;<br />
• there should be a maximum of 8 -10 persons per focus group;<br />
5.13
• plan to conduct a focus group discussion for no more than an hour and a<br />
half.<br />
Members of the evaluation team who know how to conduct the focus group discussion<br />
should do so. One person should serve as the facilitator and the other as a recorder.<br />
The facilitator should stimulate and support the discussion. The recorder should keep a<br />
record of the content of the discussion and note the reaction and interaction within the<br />
group. The recorder may also use a tape recorder/player if the group allows. Items to<br />
be recorded include:<br />
• date, time and venue;<br />
• names and characteristics of respondents;<br />
• description of the group’s dynamics;<br />
• opinion of the comments recorded;<br />
• vocabulary and language use.<br />
The following are the functions of the facilitator:<br />
• introduce the session;<br />
• encourage discussion;<br />
• encourage involvement;<br />
• build rapport and empathize;<br />
• avoid being placed in the role of expert;<br />
• control the rhythm of the meeting, but in an unobtrusive way;<br />
• take time at the end of the meeting to summarize, check for agreement<br />
and thank the participants.<br />
Following the discussion, the facilitator and recorder should sit together to review and<br />
complete the notes taken during the discussion.<br />
INTERVIEWING<br />
An interview is a data collection method that involves oral questioning of respondents,<br />
either individually or as a group. It is suitable for use with illiterate people. It also<br />
permits clarification of questions through probing. Interviews are probably the most<br />
commonly used evaluation method.<br />
Good interviewers should have the following skills and characteristics:<br />
• friendly and warm;<br />
• hardworking and reliable;<br />
• able to speak the local language;<br />
• able to ask questions in a neutral way.<br />
5.14
To enable interviewers to develop these skills and characteristics they need to be trained<br />
on all of the following:<br />
• how to put the interviewee at ease;<br />
• how to raise sensitive issues;<br />
• how to probe;<br />
• how to accurately record responses, particularly for open-ended questions;<br />
• how to edit and check for errors and omissions.<br />
Role-plays are an effective method that should be used during the training. Evaluators<br />
should supervise interviewers in order to ensure quality data from interviews.<br />
5.15
TRANSPARENCY 5.1<br />
ADVANTAGES AND LIMITATIONS OF DIFFERENT TYPES OF<br />
QUESTIONS<br />
1. Closed-ended structured questions<br />
Advantages:<br />
Limitations:<br />
easy to administer in the field and work with in the<br />
analysis<br />
easy to code with a number<br />
answer can be shown by making a mark against the code<br />
that corresponds to the answer<br />
pre-coding makes the task of tabulating or data entry<br />
simpler<br />
useful for collecting factual information or when the full<br />
range of possibilities is already known<br />
does not allow respondents to answer in his/her own<br />
words<br />
2. Open-ended (unstructured) questions<br />
Advantages:<br />
Limitations:<br />
useful when full range of responses is unknown or when<br />
great range of possible answers is expected<br />
provides a special depth of response<br />
time consuming in the field as all respondent’s words<br />
must be recorded<br />
space consuming in the questionnaire<br />
difficult to code and tabulate (responses must be grouped,<br />
categorized and coded for analysis)<br />
3. Semi-structured questions (field coded)<br />
Advantages:<br />
useful when the code categories are known in advance<br />
gives the respondent more freedom<br />
easy to tabulate since they are pre-coded<br />
5.16
Limitations:<br />
difficult to administer since interviewer must make an onthe-spot<br />
decision on how to categorize a free response<br />
detail or the free response is lost.<br />
5.17
UNIT 6<br />
DATA ANALYSIS AND INTERPRETATION<br />
PURPOSE OF<br />
THE UNIT<br />
OBJECTIVES<br />
The purpose of this unit is to explain how to prepare data for<br />
analysis. Participants also learn how to analyse quantitative and<br />
qualitative data, and interpret the results. In addition, the unit<br />
explains how to present the results of analysis in a meaningful and<br />
useful way.<br />
By the end of this unit, participants should be able to:<br />
• explain how to prepare data for analysis;<br />
• analyse qualitative and quantitative data;<br />
• interpret quantitative and qualitative data;<br />
• present data using appropriate formats.<br />
UNIT<br />
OVERVIEW Session 1: Preparing the Data for Analysis (90 minutes)<br />
Session 2:<br />
Session 3:<br />
Session 4:<br />
Session 5:<br />
Analysing Qualitative Data (60 minutes)<br />
Analysing Quantitative Data (120 minutes)<br />
Interpretation of M&E Data/Information (90 minutes)<br />
Data Presentation (45 minutes)<br />
TIME<br />
ADVANCE<br />
PREPARATION<br />
6 hours 45 minutes<br />
Before the session, prepare a sample questionnaire or data<br />
collection form based on the data collected in the field or on some<br />
programme data that already exists. Ensure that at least 10 forms<br />
are completely filled out. Put some illustrative codes for numerical<br />
fields (e.g., 88=refused; 99=missing) on the questionnaire/form, and<br />
make check boxes for categorical data. Make a transparency of a<br />
blank form (Transparency 6.1).<br />
Prepare and photocopy handouts and make the transparencies.<br />
6.1
Ensure all materials are available.<br />
Handouts: 6.1 Qualitative Data Analysis<br />
6.2 Definitions of Descriptive Statistics<br />
6.3 Types of Data<br />
6.4 Data Summary<br />
6.5 Formats for Presenting Qualitative Data<br />
Transparencies: 6.1 Data Matrix Example and Blank<br />
6.2 Sample Computer File<br />
6.3 Cleaning Data<br />
6.4 Definitions of Descriptive Statistics<br />
6.5 Types of Data<br />
6.6 World Bank Table<br />
6.7 World Bank Table 2<br />
6.8 Table on Iodized Salt Use at Household<br />
and Presence of Iodine<br />
6.9 Intake of Dark Green Leafy Vegetables<br />
by Pregnant Women<br />
6.10 Mean Women’s BMI by Age at Followup<br />
6.11 Mean Women’s BMI by Age at Followup<br />
6.12 Prevalence of Severe and Moderate<br />
Malnutrition at Baseline and Follow-up<br />
6.13 Prevalence of Malnutrition (weight/age)<br />
at Baseline and Follow-up<br />
6.14 Pie Chart<br />
Materials:<br />
cards, flipchart, masking tape, pens, markers,<br />
transparencies, overhead projector,<br />
transparency pens<br />
6.2
PROCEDURE<br />
Session 1<br />
Step 1:<br />
Preparing the Data for Analysis ......................60 minutes<br />
Start this session by presenting the objectives of the unit and by giving a<br />
brief overview of what the unit is about. Remind participants where we are<br />
in the monitoring/evaluation process.<br />
Ask participants to identify what needs to be done with all the data that has<br />
been collected during monitoring and/or evaluation. As participants offer<br />
their suggestions, write each one on a VIPP card and place them on the<br />
board in chronological order. After receiving all responses put up the<br />
following 4 cards at the right places between:<br />
C<br />
C<br />
C<br />
C<br />
Data/Information Preparation<br />
Data/Information Analysis<br />
Interpretation of the Findings<br />
Presentation of the Findings<br />
Tell participants that during this session they are going to look at preparing<br />
the data for analysis, with special emphasis on data entry and cleaning.<br />
Step 2:<br />
Step 3:<br />
Ask participants to brainstorm on the techniques and methods they know<br />
or use to prepare data for analysis. Have a co-facilitator write these on a<br />
flipchart and cluster these into “electronic” and “manual” categories.<br />
Point out that we will first discuss manual methods of data preparation. If<br />
data have been collected as part of a field trip, work through the process of<br />
creating a matrix based on individual questionnaires or data sheets. If<br />
there is no data available from a field trip, then use data that has been<br />
prepared from an on-going programme. (Refer to Advance Preparation<br />
on page 6.1).<br />
Display Transparency 6.1 and, while referring to it, create the matrix on<br />
two sheets of flipchart paper (side by side). Demonstrate its use by<br />
transferring data from the first questionnaire or sheet to the matrix. As the<br />
matrix is being constructed, ask participants to identify the qualities of a<br />
matrix. The following points should come out:<br />
The matrix has a unique identifier (e.g., questionnaire number,<br />
household number, or participant number) for each row.<br />
A separate column is used to record each possible value of a<br />
question with checked categories.<br />
6.3
The columns contain, among other things, the indicators collected<br />
from the evaluation/monitoring.<br />
Each column has a unique “variable name.”<br />
The same units of measurement are used for all records, for all<br />
participants.<br />
Pass out the 10 completed questionnaires/forms, and ask participants to<br />
come, one by one, to enter their data into the matrix from their<br />
questionnaires or forms. After the participants have completed adding<br />
their records to the matrix, refer again to Transparency 6.1 and discuss<br />
the following:<br />
Explain that there are other ways to record questions with<br />
categories (use of codes rather than “x” in each category). Ask<br />
participants if they know the reasons for using codes like<br />
“88=refused” and “99=unknown.” Point out that refusal or not<br />
knowing are information, and information about refusal or inability to<br />
respond is lost without special codes; blank cells in the matrix may<br />
be misunderstood as mistakes during later inspection of the data,<br />
unnecessarily requiring re-checking of the original forms.<br />
Explain that the data on the matrix can be used to do manual<br />
calculations, where individual observations are listed by an identifier<br />
in the column at the top of the matrix, and values for individual<br />
variables (pieces of information for analysis) are recorded in the<br />
rows of the matrix. Using the data on the matrix, calculate some<br />
simple summary statistics such as the mean and frequency.<br />
Step 4:<br />
Ask participants to share other types of manual methods they have used to<br />
prepare and organize data for analysis. Have the participants write these<br />
on a flipchart. Ask them to detail how they checked or “cleaned” the data<br />
when using manual methods.<br />
Step 5: Ask participants to describe what computer-based methods they know of<br />
or use for preparing data for analysis. Ask participants to share any<br />
problems they have had when using computers to prepare data for<br />
computer analysis, and ask what they would do differently in the future.<br />
Point out that the choice of manual or computer methods depends on<br />
several factors:<br />
availability of computers<br />
facilities to protect computers<br />
amount of data<br />
6.4
type of data<br />
Step 6:<br />
Ask participants to share why they chose a particular programme or<br />
method and to summarize its advantages and disadvantages. The<br />
following points should also be mentioned:<br />
C<br />
C<br />
programmes that check for allowable values are best;<br />
programmes that automatically move from variable to<br />
variable within a record are easiest and safest.<br />
Step 7:<br />
Step 8:<br />
Step 9:<br />
Display Transparency 6.2 (flat file) and point out that most programmes<br />
create a file that cannot be understood visually without software to<br />
organize it into a table. Discuss creation of variable names during entry<br />
and define a variable as a measure whose values vary between<br />
observations.<br />
Ask participants what the next step in computerized data preparation is<br />
after the data are entered into the computer (data cleaning). Ask them<br />
what they do to clean data in their programmes, and write their responses<br />
on a flipchart. Summarize using Transparency 6.3, and ask for examples<br />
of logical checks they make when examining data.<br />
Ask participants why it is important to clean data. Ensure that the need to<br />
avoid bad data in order to avoid bad conclusions is mentioned. Ask<br />
participants to share how they decide whether data are “bad” or just<br />
“outliers.” The following points should come out:<br />
Obviously bad data (impossible values) can be thrown out, but only<br />
after making every attempt to get a valid value by checking the<br />
original data sheet.<br />
Possible values that are very different than all other values may be<br />
important to keep in order to maintain the representativeness of the<br />
sample (review the concept of representative sampling).<br />
If only one observation is very different than the others, removal is<br />
okay, but it is a good idea to perform analysis both with and without<br />
that observation to see if its removal provides greatly different<br />
results.<br />
If several “outliers” exist, consult a statistician for advice on how to<br />
deal with them.<br />
Step 10:<br />
Summarize the session by reviewing that both manual and computerized<br />
6.5
methods can be used to prepare data for analysis, and, once the data<br />
have been checked to ensure that all values are valid, the data are ready<br />
for analysis to provide useful information about the programme.<br />
6.6
Session 2 Analysing Qualitative Data ......................... 60 minutes<br />
Step 1:<br />
Step 2:<br />
Remind participants what qualitative data is. Ask which data collection<br />
instruments can be used to collect qualitative data.<br />
Ask participants what steps they would take to analyse qualitative data.<br />
The following points should come out:<br />
transcribe all interviews/observations<br />
look for and code key words and phrases that are similar in<br />
meaning<br />
categorize issues by topics<br />
compare responses from different groups<br />
determine patterns and trends in the responses from different<br />
groups or individual respondents<br />
make summary statements of the patterns or trends and responses<br />
cite key quotations, statements and phrases from respondents to<br />
give added meaning to the text<br />
re-check with key informants to verify the responses and the<br />
generalization of the findings.<br />
Step 3:<br />
Step 4:<br />
Distribute Handout 6.1 on qualitative data analysis and discuss it with<br />
participants. Answer any questions they may have.<br />
Explain to participants that once the data has been analysed they need to<br />
write a full report that reflects the discussion as completely as possible,<br />
using the respondents’ own words.<br />
6.7
Session 3<br />
Step 1:<br />
Step 2:<br />
Analysing Quantitative Data ........................120 minutes<br />
Ask participants to define the term “quantitative.”<br />
Explain that the first thing we need to do to analyse quantitative data is to<br />
convert raw data into useful summaries. Introduce three types of<br />
summaries, putting up a card for each:<br />
Descriptive measures: proportions, frequencies, and ratios;<br />
Measures of central tendency: mean/average, median, mode;<br />
Measures of dispersion: range, standard deviation, percentiles.<br />
Distribute Handout 6.2 which provides definitions of each of the data<br />
summaries.<br />
Step 3:<br />
Display Transparency 6.4 (same as Handout 6.2) and discuss the<br />
definitions of the items in each category. Work though the following<br />
examples of each:<br />
C<br />
Descriptive measures:<br />
Proportion, frequency, and ratio of male and female participants. Introduce<br />
“cost-effectiveness ratio” and “cost-delivery ratio” as two important types of<br />
ratios.<br />
Frequency distribution (use counts from current participants):<br />
Sex Count Relative frequency<br />
(percent)<br />
Male 8 40<br />
Female 12 60<br />
Total 20 100<br />
Ratio: Males = 8, Females = 12; Ratio of males to females = 8/12 or 0.67<br />
C<br />
Measures of central tendency:<br />
1,2,3,4,5,6,7,8,9: Mean=5; Median=5<br />
1,2,3,4,5,6,7,8,9,155: Mean=20; Median=5.5 (ask participants which<br />
summary is more affected by extreme values)<br />
6.8


