van den Berg et al., 2005, Earth Planetary Science Letters.
van den Berg et al., 2005, Earth Planetary Science Letters.
van den Berg et al., 2005, Earth Planetary Science Letters.

You also want an ePaper? Increase the reach of your titles
YUMPU automatically turns print PDFs into web optimized ePapers that Google loves.
268 A.P. <strong>van</strong> <strong>den</strong> <strong>Berg</strong> <strong>et</strong> <strong>al</strong>. / Physics of the <strong>Earth</strong> and Plan<strong>et</strong>ary Interiors 149 (<strong>2005</strong>) 259–278<br />
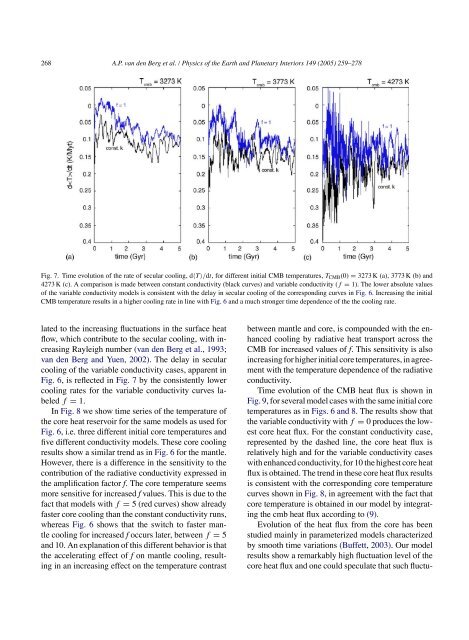
Fig. 7. Time evolution of the rate of secular cooling, d〈T 〉/dt, for different initi<strong>al</strong> CMB temperatures, T CMB (0) = 3273 K (a), 3773 K (b) and<br />
4273 K (c). A comparison is made b<strong>et</strong>ween constant conductivity (black curves) and variable conductivity (f = 1). The lower absolute v<strong>al</strong>ues<br />
of the variable conductivity models is consistent with the delay in secular cooling of the corresponding curves in Fig. 6. Increasing the initi<strong>al</strong><br />
CMB temperature results in a higher cooling rate in line with Fig. 6 and a much stronger time depen<strong>den</strong>ce of the the cooling rate.<br />
lated to the increasing fluctuations in the surface heat<br />
flow, which contribute to the secular cooling, with increasing<br />
Rayleigh number (<strong>van</strong> <strong>den</strong> <strong>Berg</strong> <strong>et</strong> <strong>al</strong>., 1993;<br />
<strong>van</strong> <strong>den</strong> <strong>Berg</strong> and Yuen, 2002). The delay in secular<br />
cooling of the variable conductivity cases, apparent in<br />
Fig. 6, is reflected in Fig. 7 by the consistently lower<br />
cooling rates for the variable conductivity curves labeled<br />
f = 1.<br />
In Fig. 8 we show time series of the temperature of<br />
the core heat reservoir for the same models as used for<br />
Fig. 6, i.e. three different initi<strong>al</strong> core temperatures and<br />
five different conductivity models. These core cooling<br />
results show a similar trend as in Fig. 6 for the mantle.<br />
However, there is a difference in the sensitivity to the<br />
contribution of the radiative conductivity expressed in<br />
the amplification factor f. The core temperature seems<br />
more sensitive for increased f v<strong>al</strong>ues. This is due to the<br />
fact that models with f = 5 (red curves) show <strong>al</strong>ready<br />
faster core cooling than the constant conductivity runs,<br />
whereas Fig. 6 shows that the switch to faster mantle<br />
cooling for increased f occurs later, b<strong>et</strong>ween f = 5<br />
and 10. An explanation of this different behavior is that<br />
the accelerating effect of f on mantle cooling, resulting<br />
in an increasing effect on the temperature contrast<br />
b<strong>et</strong>ween mantle and core, is compounded with the enhanced<br />
cooling by radiative heat transport across the<br />
CMB for increased v<strong>al</strong>ues of f. This sensitivity is <strong>al</strong>so<br />
increasing for higher initi<strong>al</strong> core temperatures, in agreement<br />
with the temperature depen<strong>den</strong>ce of the radiative<br />
conductivity.<br />
Time evolution of the CMB heat flux is shown in<br />
Fig. 9, for sever<strong>al</strong> model cases with the same initi<strong>al</strong> core<br />
temperatures as in Figs. 6 and 8. The results show that<br />
the variable conductivity with f = 0 produces the lowest<br />
core heat flux. For the constant conductivity case,<br />
represented by the dashed line, the core heat flux is<br />
relatively high and for the variable conductivity cases<br />
with enhanced conductivity, for 10 the highest core heat<br />
flux is obtained. The trend in these core heat flux results<br />
is consistent with the corresponding core temperature<br />
curves shown in Fig. 8, in agreement with the fact that<br />
core temperature is obtained in our model by integrating<br />
the cmb heat flux according to (9).<br />
Evolution of the heat flux from the core has been<br />
studied mainly in param<strong>et</strong>erized models characterized<br />
by smooth time variations (Buff<strong>et</strong>t, 2003). Our model<br />
results show a remarkably high fluctuation level of the<br />
core heat flux and one could speculate that such fluctu-