Frank and Brickman 2000 - Gulf of Maine Research Institute
Frank and Brickman 2000 - Gulf of Maine Research Institute
Frank and Brickman 2000 - Gulf of Maine Research Institute

Create successful ePaper yourself
Turn your PDF publications into a flip-book with our unique Google optimized e-Paper software.
514 Can. J. Fish. Aquat. Sci. Vol. 57, <strong>2000</strong><br />
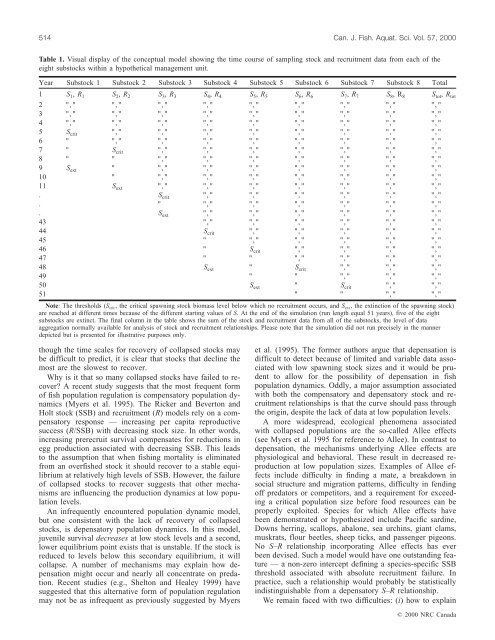
Table 1. Visual display <strong>of</strong> the conceptual model showing the time course <strong>of</strong> sampling stock <strong>and</strong> recruitment data from each <strong>of</strong> the<br />
eight substocks within a hypothetical management unit.<br />
Year Substock 1 Substock 2 Substock 3 Substock 4 Substock 5 Substock 6 Substock 7 Substock 8 Total<br />
1 S 1 , R 1 S 2 , R 2 S 3 , R 3 S 4 , R 4 S 5 , R 5 S 6 , R 6 S 7 , R 7 S 8 ,R 8 S tot , R tot<br />
2 "," "," "," "," "," "," "," "," ","<br />
3 "," "," "," "," "," "," "," "," ","<br />
4 "," "," "," "," "," "," "," "," ","<br />
5 S crit "," "," "," "," "," "," "," ","<br />
6 " "," "," "," "," "," "," "," ","<br />
7 " S crit "," "," "," "," "," "," ","<br />
8 " " "," "," "," "," "," "," ","<br />
9 S ext " "," "," "," "," "," "," ","<br />
10 " "," "," "," "," "," "," ","<br />
11 S ext "," "," "," "," "," "," ","<br />
. S crit "," "," "," "," "," ","<br />
. " "," "," "," "," "," ","<br />
. S ext "," "," "," "," "," ","<br />
43 "," "," "," "," "," ","<br />
44 S crit "," "," "," "," ","<br />
45 " "," "," "," "," ","<br />
46 " S crit "," "," "," ","<br />
47 " " "," "," "," ","<br />
48 S ext " S crit "," "," ","<br />
49 " " "," "," ","<br />
50 S ext " S crit "," ","<br />
51 " " "," ","<br />
Note: The thresholds (S crit , the critical spawning stock biomass level below which no recruitment occurs, <strong>and</strong> S ext , the extinction <strong>of</strong> the spawning stock)<br />
are reached at different times because <strong>of</strong> the different starting values <strong>of</strong> S. At the end <strong>of</strong> the simulation (run length equal 51 years), five <strong>of</strong> the eight<br />
substocks are extinct. The final column in the table shows the sum <strong>of</strong> the stock <strong>and</strong> recruitment data from all <strong>of</strong> the substocks, the level <strong>of</strong> data<br />
aggregation normally available for analysis <strong>of</strong> stock <strong>and</strong> recruitment relationships. Please note that the simulation did not run precisely in the manner<br />
depicted but is presented for illustrative purposes only.<br />
though the time scales for recovery <strong>of</strong> collapsed stocks may<br />
be difficult to predict, it is clear that stocks that decline the<br />
most are the slowest to recover.<br />
Why is it that so many collapsed stocks have failed to recover?<br />
A recent study suggests that the most frequent form<br />
<strong>of</strong> fish population regulation is compensatory population dynamics<br />
(Myers et al. 1995). The Ricker <strong>and</strong> Beverton <strong>and</strong><br />
Holt stock (SSB) <strong>and</strong> recruitment (R) models rely on a compensatory<br />
response — increasing per capita reproductive<br />
success (R/SSB) with decreasing stock size. In other words,<br />
increasing prerecruit survival compensates for reductions in<br />
egg production associated with decreasing SSB. This leads<br />
to the assumption that when fishing mortality is eliminated<br />
from an overfished stock it should recover to a stable equilibrium<br />
at relatively high levels <strong>of</strong> SSB. However, the failure<br />
<strong>of</strong> collapsed stocks to recover suggests that other mechanisms<br />
are influencing the production dynamics at low population<br />
levels.<br />
An infrequently encountered population dynamic model,<br />
but one consistent with the lack <strong>of</strong> recovery <strong>of</strong> collapsed<br />
stocks, is depensatory population dynamics. In this model,<br />
juvenile survival decreases at low stock levels <strong>and</strong> a second,<br />
lower equilibrium point exists that is unstable. If the stock is<br />
reduced to levels below this secondary equilibrium, it will<br />
collapse. A number <strong>of</strong> mechanisms may explain how depensation<br />
might occur <strong>and</strong> nearly all concentrate on predation.<br />
Recent studies (e.g., Shelton <strong>and</strong> Healey 1999) have<br />
suggested that this alternative form <strong>of</strong> population regulation<br />
may not be as infrequent as previously suggested by Myers<br />
et al. (1995). The former authors argue that depensation is<br />
difficult to detect because <strong>of</strong> limited <strong>and</strong> variable data associated<br />
with low spawning stock sizes <strong>and</strong> it would be prudent<br />
to allow for the possibility <strong>of</strong> depensation in fish<br />
population dynamics. Oddly, a major assumption associated<br />
with both the compensatory <strong>and</strong> depensatory stock <strong>and</strong> recruitment<br />
relationships is that the curve should pass through<br />
the origin, despite the lack <strong>of</strong> data at low population levels.<br />
A more widespread, ecological phenomena associated<br />
with collapsed populations are the so-called Allee effects<br />
(see Myers et al. 1995 for reference to Allee). In contrast to<br />
depensation, the mechanisms underlying Allee effects are<br />
physiological <strong>and</strong> behavioral. These result in decreased reproduction<br />
at low population sizes. Examples <strong>of</strong> Allee effects<br />
include difficulty in finding a mate, a breakdown in<br />
social structure <strong>and</strong> migration patterns, difficulty in fending<br />
<strong>of</strong>f predators or competitors, <strong>and</strong> a requirement for exceeding<br />
a critical population size before food resources can be<br />
properly exploited. Species for which Allee effects have<br />
been demonstrated or hypothesized include Pacific sardine,<br />
Downs herring, scallops, abalone, sea urchins, giant clams,<br />
muskrats, flour beetles, sheep ticks, <strong>and</strong> passenger pigeons.<br />
No S–R relationship incorporating Allee effects has ever<br />
been devised. Such a model would have one outst<strong>and</strong>ing feature<br />
— a non-zero intercept defining a species-specific SSB<br />
threshold associated with absolute recruitment failure. In<br />
practice, such a relationship would probably be statistically<br />
indistinguishable from a depensatory S–R relationship.<br />
We remain faced with two difficulties: (i) how to explain<br />
© <strong>2000</strong> NRC Canada