preliminary fy 2011-12 city of glendale, az annual budget book
preliminary fy 2011-12 city of glendale, az annual budget book
preliminary fy 2011-12 city of glendale, az annual budget book

You also want an ePaper? Increase the reach of your titles
YUMPU automatically turns print PDFs into web optimized ePapers that Google loves.
PRELIMINARY<br />
FY <strong>2011</strong>-<strong>12</strong><br />
CITY OF GLENDALE, AZ<br />
ANNUAL BUDGET<br />
BOOK
CITY OF GLENDALE, AZ<br />
Budget Book Navigation Tips<br />
BUDGET BOOK NAVIGATION TIPS<br />
There are a number <strong>of</strong> ways to navigate through the <strong>budget</strong> <strong>book</strong>. Listed below are the three<br />
easiest options:<br />
1. Both the Preliminary Budget Book Table <strong>of</strong> Contents and the CIP Table <strong>of</strong> Contents<br />
contain links to all sections <strong>of</strong> the <strong>book</strong>. To go directly to the section you would like to<br />
see, simply click on the section name or page number directly in either <strong>of</strong> the table <strong>of</strong><br />
contents.<br />
If at any time you would like to return to the table <strong>of</strong> contents, click on Return to TOC<br />
located at the bottom <strong>of</strong> each page. Note that if within the CIP, clicking on Return to<br />
CIP TOC will take you back to the CIP table <strong>of</strong> contents.<br />
2. Click on the Bookmarks tab to the left <strong>of</strong> the window to view all <strong>of</strong> the <strong>book</strong>marked<br />
pages; the format is similar to the table <strong>of</strong> contents. To expand a subsection, click the<br />
“+”. To go to a section you would like to see, simply click on the section name.<br />
3. At the bottom <strong>of</strong> the window enter the page number you would like to go to and press<br />
enter, you will be taken directly to that page. The “◄” and “►” buttons take you back<br />
and forward one page at a time. The “▐◄” and “►▌” take you to the first and last page<br />
<strong>of</strong> the document, respectively.
CITY OF GLENDALE, AZ<br />
Table <strong>of</strong> Contents<br />
CITY OF GLENDALE, ARIZONA<br />
FY <strong>2011</strong>-<strong>12</strong> ANNUAL BUDGET<br />
TABLE OF CONTENTS<br />
Introduction<br />
Page<br />
Table <strong>of</strong> Contents<br />
i<br />
Mayor’s Message (To be Included in Final Budget Book)<br />
Mayor & City Council 1<br />
City Organizational Chart 2<br />
City Management 3<br />
City Council District Map 4<br />
Map <strong>of</strong> Glendale and Neighboring Communities 5<br />
Financial Organizational Chart 6<br />
Budget Presentation Award 10<br />
How to Make the Most <strong>of</strong> this Document 11<br />
Budget Calendar 13<br />
Budget Process 16<br />
Budget Message<br />
City Manager’s Budget Message 20<br />
Budget Summaries<br />
Budget Summary 28<br />
Revenues 43<br />
Expenditures 56<br />
Conclusion 72<br />
Financial Guidelines<br />
Five-Year Financial Forecast 74<br />
Financial Plan 90<br />
Financial Policies 102<br />
Operating Budget<br />
Appointed & Elected Officials<br />
Mayor & City Council 106<br />
City Attorney 113<br />
City Clerk 117<br />
City Court <strong>12</strong>3<br />
i
CITY OF GLENDALE, AZ<br />
Table <strong>of</strong> Contents<br />
Budget & Financial Services<br />
Page<br />
Finance 130<br />
Lease Payments 135<br />
Management & Budget 136<br />
Grants 143<br />
City Manager<br />
City Manager’s Office 144<br />
Communications<br />
Glendale Civic Center 151<br />
Marketing and Communications 156<br />
Convention Center, Media Center and Parking Garage 162<br />
Compliance & Asset Management<br />
Compliance & Asset Management 163<br />
Development Services<br />
Community Development 168<br />
Building Safety 169<br />
Code Compliance 175<br />
Planning 181<br />
Economic Development<br />
Economic Development 186<br />
Rebates & Incentives 193<br />
Human Resources & Risk Management<br />
Human Resources 194<br />
Employee Groups 200<br />
Intergovernmental Programs<br />
Intergovernmental Programs 201<br />
Leisure & Cultural Services<br />
Leisure & Cultural Services 206<br />
Library & Arts 213<br />
Parks & Recreation 214<br />
ii
CITY OF GLENDALE, AZ<br />
Table <strong>of</strong> Contents<br />
Neighborhood & Human Services<br />
Page<br />
Neighborhood & Human Services 216<br />
Community Action Program 221<br />
Community Partnerships 222<br />
Neighborhood Improvement Grants 223<br />
Fire Services<br />
Fire Services 225<br />
Police Services<br />
Police Services 232<br />
Public Works<br />
Engineering 240<br />
Field Operations 246<br />
Technology & Innovation<br />
Technology & Innovation 254<br />
Transportation Services<br />
Transportation Services 258<br />
Airport 262<br />
Transportation 263<br />
Water Services<br />
Environmental Resources 265<br />
Utilities 271<br />
Other<br />
Non-Departmental 277<br />
20<strong>12</strong>-2021 Capital Improvement Plan<br />
CIP Table <strong>of</strong> Contents 278<br />
CIP Ten-Year Plan 280<br />
Schedule<br />
Why Include Schedules? 499<br />
Schedule 1: Fund Balance Analysis by Category; by Fund 500<br />
Schedule 2: Operating Revenues by Category; by Fund 505<br />
Schedule 3: Operating Budgets by Program and Fund 518<br />
Schedule 4: Transfers Between Funds 539<br />
iii
CITY OF GLENDALE, AZ<br />
Table <strong>of</strong> Contents<br />
Schedule 5: Expenditure Limitation and Property Tax Rate 540<br />
Schedule 6: Authorized Staffing 541<br />
Schedule 7: Long Term Debt Service Summary; by Detail 577<br />
Schedule 8: Scheduled Lease Payments 613<br />
Schedule 9: Internal Service Premiums 615<br />
Schedule 10: General Staff and Administrative Service Charges 623<br />
Schedule 11: Operating Capital List 624<br />
Schedule <strong>12</strong>: Carryover Savings Budgets 626<br />
Appendix<br />
Miscellaneous Statistics 631<br />
Acronyms 636<br />
Glossary 638<br />
Frequently Asked Questions 642<br />
iv
CITY OF GLENDALE, AZ<br />
Mayor & City Council<br />
Mayor & City Council<br />
1<br />
Return to TOC
CITY OF GLENDALE, AZ<br />
City Organizational Chart<br />
CITY ORGANIZATIONAL CHART<br />
CITIZENS OF GLENDALE<br />
Mayor & Council<br />
Boards &<br />
Commissions<br />
City Attorney<br />
Craig Tindall<br />
City Manager<br />
Ed Beasley<br />
City Clerk<br />
Pam Hanna<br />
Presiding City<br />
Judge<br />
Elizabeth Finn<br />
Executive Director<br />
Compliance &<br />
Asset Mgmt<br />
Candace MacLeod<br />
Executive Director<br />
Communications<br />
Julie Frisoni<br />
Director Economic<br />
Development<br />
Brian Friedman<br />
Assistant City<br />
Manager<br />
Horatio Skeete<br />
Director<br />
Intergovernmental<br />
Programs<br />
Brent Stoddard<br />
Fire Chief<br />
Fire Services<br />
Mark Burdick<br />
Police Chief<br />
Police Services<br />
Steve Conrad<br />
Assistant to the<br />
Mayor<br />
Steve Methvin<br />
Council Services<br />
Administrator<br />
Kristen Krey<br />
Executive Director<br />
Human Resources<br />
& Risk M gmt<br />
Alma Carmicle<br />
Executive Director<br />
Budget & Financial<br />
Services<br />
Sherry<br />
Schurhammer<br />
Executive Director<br />
Technology &<br />
Innovation<br />
Chuck Murphy<br />
Executive Director<br />
Public Works<br />
Stuart Kent<br />
Deputy City<br />
Manager<br />
Community<br />
Services<br />
Cathy Gorham<br />
Deputy City<br />
Manager<br />
Community<br />
Development<br />
Jim Colson<br />
Executive Director<br />
Leisure & Cultural<br />
Services<br />
Erik Strunk<br />
Interim Director<br />
Executive Director<br />
Water Services<br />
Craig Johnson<br />
Executive Director<br />
Transportation<br />
Services<br />
Jamsheed Mehta<br />
2<br />
Return to TOC
CITY OF GLENDALE, AZ<br />
City Management<br />
CITY MANAGEMENT<br />
Mayor<br />
ELAINE M. SCRUGGS<br />
Councilmembers<br />
Steven E. Frate<br />
Vice Mayor<br />
Sahuaro District<br />
Norma Alavarez<br />
Ocotillo District<br />
Joyce V. Clark<br />
Yucca District<br />
Yvonne J. Knaack<br />
Barrel District<br />
H. Philip Lieberman<br />
Cactus District<br />
Manuel D. Martinez<br />
Cholla District<br />
Management Staff<br />
Ed Beasley<br />
City Manager<br />
Horatio Skeete<br />
Assistant City Manager<br />
Department Heads<br />
and Directors<br />
Craig Tindall<br />
City Attorney<br />
Pamela Hanna<br />
City Clerk<br />
Judge Elizabeth Finn<br />
Presiding City Judge<br />
Department Heads<br />
and Directors, cont.<br />
Executive Director<br />
Sherry Schurhammer<br />
Budget & Financial Services<br />
Executive Director<br />
Julie Frisoni<br />
Communications<br />
Executive Director<br />
Candace MacLeod<br />
Compliance & Asset<br />
Management<br />
Deputy City Manager<br />
Jim Colson<br />
Development Services<br />
Brian Friedman<br />
Economic Development<br />
Executive Director<br />
Alma Carmicle<br />
Human Resources & Risk<br />
Management<br />
Brent Stoddard<br />
Intergovernmental Programs<br />
Executive Director<br />
Erik Strunk<br />
Leisure & Cultural Services<br />
Cathy Gorham<br />
Deputy City Manager<br />
Neighborhood & Human<br />
Services<br />
Department Heads<br />
and Directors, cont.<br />
Mark Burdick<br />
Fire Services<br />
Steven Conrad<br />
Police Services<br />
Executive Director<br />
Stuart Kent<br />
Public Works<br />
Executive Director<br />
Chuck Murphy<br />
Technology & Innovation<br />
Executive Director<br />
Jamsheed Mehta<br />
Transportation Services<br />
Executive Director<br />
Craig Johnson<br />
Water Services<br />
3<br />
Return to TOC
CITY OF GLENDALE, AZ<br />
Glendale District Boundaries<br />
GLENDALE COUNCIL DISTRICT BOUNDARIES<br />
4<br />
Return to TOC
CITY OF GLENDALE, AZ<br />
Map <strong>of</strong> Glendale & Neighboring Communities<br />
MAP OF GLENDALE AND NEIGHBORING COMMUNITIES<br />
5<br />
Return to TOC
CITY OF GLENDALE, AZ<br />
Financial Organization Chart<br />
OPERATING<br />
$362,100,087<br />
|<br />
| | | | |<br />
| | | |<br />
| | | | | | |<br />
| | | | | | |<br />
| | | | | |<br />
| | | | |<br />
| | | | |<br />
| | | | |<br />
| | | | |<br />
| | |<br />
|<br />
TOTAL FY 20<strong>12</strong> BUDGET<br />
$638,000,000<br />
General<br />
Special Revenue<br />
Capital Enterprise Internal Services<br />
Fund Group<br />
Fund Group<br />
Fund Group Fund Group Fund Group<br />
$170,959,859 $81,429,506 $38,734 $82,078,681 $27,593,307<br />
1000<br />
<strong>12</strong>81<br />
1300<br />
1760<br />
1980<br />
2360<br />
2540<br />
Stadium Event<br />
Airport Special St reet s<br />
Risk Mgmt<br />
General Fund<br />
Home Grant<br />
Water and Sewer<br />
Operations<br />
Revenue Construction<br />
Self Insurance<br />
$<strong>12</strong>3,525,277 $2,967,219 $1,787,501 $527,326<br />
$6,066<br />
$47,789,682 $3,068,438<br />
1040<br />
General Services<br />
$8,934,049<br />
1100<br />
Telephone<br />
Services<br />
$979,324<br />
1<strong>12</strong>0<br />
Vehicle<br />
Replacement<br />
$3,029,742<br />
1140<br />
PC<br />
Replacement<br />
$3,511,584<br />
1190<br />
Employee<br />
Groups<br />
$84,000<br />
<strong>12</strong>20<br />
Arts Commission<br />
Fund<br />
$<strong>12</strong>7,787<br />
<strong>12</strong>40<br />
Court<br />
Security/Bonds<br />
$583,860<br />
<strong>12</strong>60<br />
Library<br />
$247,373<br />
<strong>12</strong>80<br />
Youth Sports<br />
Complex<br />
$322,000<br />
<strong>12</strong>82<br />
Arena Event<br />
Operations<br />
$21,204,142<br />
<strong>12</strong>83<br />
CamelbackRanch<br />
EventOperations<br />
$28,852<br />
1740<br />
Civic Center<br />
$766,817<br />
1780<br />
Arena Special<br />
Revenue<br />
$550,000<br />
1790<br />
St adium City<br />
Sales T ax -<br />
$1,745,900<br />
1870<br />
Marketing<br />
Self Sust<br />
$753,116<br />
2530<br />
Training Facility<br />
Revenue Fund<br />
$1,544,817<br />
2538<br />
Glendale Health<br />
Center<br />
$54,000<br />
CAPITAL OUTLAY DEBT SERVICE CONTINGENCY<br />
$144,221,459 $85,109,532 $46,568,922<br />
1310<br />
Neighborhood<br />
Stabilization<br />
$2,117,897<br />
1311<br />
N'hood<br />
Stabilization<br />
$3,368,377<br />
1320<br />
C.D.B.G.<br />
$3,718,764<br />
1340<br />
Highway User<br />
Gas T ax<br />
$8,217,576<br />
1650<br />
Transportation<br />
Grant s<br />
$768,765<br />
1660<br />
Transportation<br />
Sales T ax<br />
$11,840,560<br />
1700<br />
Police Special<br />
Revenue<br />
$14,173,737<br />
1720<br />
Fire Special<br />
Revenue<br />
$6,395,637<br />
1820<br />
CAP Grant<br />
$1,603,044<br />
1830<br />
Emergency<br />
Shelter Grants<br />
$98,278<br />
1840<br />
Grant s<br />
$18,994,995<br />
1842<br />
ARRA Stimulus<br />
Grant s<br />
$2,671,757<br />
1860<br />
RICO Funds<br />
$3,895,053<br />
1880<br />
Parks & Rec<br />
Self Sust<br />
$1,073,201<br />
1885<br />
Parks & Rec<br />
Designated<br />
$177,038<br />
2000<br />
Hurf Street<br />
Bonds<br />
$1,030<br />
2040<br />
Public Safety<br />
Construction<br />
$2,000<br />
2060<br />
Parks<br />
Construction<br />
$6,857<br />
2080<br />
Gov't Facilities<br />
Construction<br />
$2,000<br />
2100<br />
Economic Dev.<br />
Construction<br />
$2,000<br />
2180<br />
Flood Control<br />
Construction<br />
$5,213<br />
2210<br />
Transportation<br />
Capital Project<br />
$13,568<br />
2440<br />
Landfill<br />
$7,099,142<br />
2480<br />
Sanitation<br />
$14,580,731<br />
2500<br />
Pub Housing<br />
Budget Activities<br />
$<strong>12</strong>,609,<strong>12</strong>6<br />
2560<br />
Workers Comp.<br />
Self Insurance<br />
$1,407,000<br />
2580<br />
Benefits Trust<br />
Fund<br />
$23,117,869<br />
6<br />
Return to TOC
CITY OF GLENDALE, AZ<br />
Financial Organization Chart<br />
|<br />
OPERATING CAPITAL OUTLAY DEBT SERVICE CONTINGENCY<br />
$362,100,087 $144,221,459 $85,109,532<br />
$46,568,922<br />
| | | |<br />
General<br />
Fund Group<br />
$2,132,357<br />
1000<br />
General Fund<br />
$1,282,357<br />
Special Revenue<br />
Fund Group<br />
$25,777,848<br />
1650<br />
Transportation<br />
Grants<br />
$5,518,115<br />
| |<br />
| | |<br />
| | | | |<br />
<strong>12</strong>20<br />
Arts Commission<br />
Fund<br />
$500,000<br />
$2,811,252<br />
| | | | |<br />
1740<br />
Civic Center<br />
$350,000<br />
1840<br />
Grants<br />
2<strong>12</strong>0<br />
Airport Capital<br />
Grants<br />
$17,448,481<br />
TOTAL FY 20<strong>12</strong> BUDGET<br />
$638,000,000<br />
Development G.O. Bond<br />
Other<br />
Impact Fee Construction Capital<br />
Funds<br />
Funds<br />
Funds<br />
$830,138 $19,200,291 $39,504,390<br />
1500 1980 2210<br />
Streets Transportation<br />
DIF-Libraries<br />
Construction Capital Project<br />
$272,665 $3,089,699 $39,504,390<br />
1540<br />
DIF-Parks Dev<br />
Zone 1<br />
$39,632<br />
| |<br />
1560<br />
DIF-Parks Dev<br />
Zone 2<br />
$138,506<br />
| |<br />
1580<br />
DIF-Parks Dev<br />
Zone 3<br />
$31,904<br />
2060<br />
Parks<br />
Construction<br />
$166,246<br />
| |<br />
1600<br />
DIF-Roadway<br />
Improvements<br />
$131,958<br />
Capital<br />
Fund Group<br />
$59,534,819<br />
1520<br />
2000<br />
DIF-Citywide Hurf Street<br />
Open Spaces<br />
Bonds<br />
$215,473 $197,379<br />
2040<br />
Public Safety<br />
Construction<br />
$2,415,<strong>12</strong>0<br />
2080<br />
Gov't Facilities<br />
Construction<br />
$1,131,437<br />
2100<br />
Economic Dev.<br />
Construction<br />
$1,746,094<br />
|<br />
2130<br />
Cultural Facility<br />
Construction<br />
$104,876<br />
|<br />
2180<br />
Flood Control<br />
Construction<br />
$10,349,440<br />
Enterprise<br />
Fund Group<br />
$56,776,435<br />
2360<br />
Water and Sewer<br />
$53,182,149<br />
2440<br />
Landfill<br />
$1,730,641<br />
2480<br />
Sanitation<br />
$1,863,645<br />
7<br />
Return to TOC
CITY OF GLENDALE, AZ<br />
Financial Organization Chart<br />
TOTAL FY 20<strong>12</strong> BUDGET<br />
$638,000,000<br />
|<br />
OPERATING CAPITAL OUTLAY DEBT SERVICE CONTINGENCY<br />
$362,100,087 $144,221,459 $85,109,532 $46,568,922<br />
| |<br />
Debt Service<br />
Fund Group<br />
$58,144,070<br />
Enterprise<br />
Fund Group<br />
$26,965,462<br />
1900<br />
G.O. Bond<br />
Debt Service<br />
$24,283,604<br />
|<br />
1920<br />
HURF<br />
Debt Service<br />
$4,706,338<br />
|<br />
1930<br />
PFC<br />
Debt Service<br />
$380,000<br />
|<br />
1940<br />
M.P.C.<br />
Debt Service<br />
$21,447,247<br />
|<br />
1970<br />
Transportation<br />
Debt Service<br />
$7,326,881<br />
2360<br />
Water and Sewer<br />
$26,965,462<br />
For a description <strong>of</strong> major fund sources please refer to<br />
the Budget Summary on page 28. You can navigate<br />
to the description by clicking the funding source you<br />
would like more information about.<br />
8<br />
Return to TOC
CITY OF GLENDALE, AZ<br />
Financial Organization Chart<br />
|<br />
| | | | | |<br />
General<br />
Fund Group<br />
$334,905<br />
1010<br />
National Events<br />
$334,905<br />
Special Revenue<br />
Fund Group<br />
$14,258,971<br />
1340<br />
Highway User<br />
Gas T ax<br />
$14,258,971<br />
| |<br />
1380<br />
$1,738,916<br />
| | |<br />
1420<br />
DIF-Fire<br />
Protection Fac<br />
$20,909<br />
| | |<br />
1440<br />
DIF-Police<br />
Facilities<br />
$1,159,410<br />
| |<br />
1460<br />
DIF-Citywide<br />
Parks<br />
$229,557<br />
| |<br />
1480<br />
DIF-Citywide<br />
Recreation Fac<br />
$1,189,275<br />
| |<br />
| |<br />
1520<br />
DIF-Citywide<br />
Open Spaces<br />
$290,606<br />
| |<br />
1540<br />
DIF-Parks Dev<br />
Zone 1<br />
$89,062<br />
| |<br />
1560<br />
DIF-Parks Dev<br />
Zone 2<br />
$44,477<br />
| |<br />
1580<br />
DIF-Parks Dev<br />
Zone 3<br />
$8,457<br />
TOTAL FY 20<strong>12</strong> BUDGET<br />
$638,000,000<br />
OPERATING CAPITAL OUTLAY DEBT SERVICE CONTINGENCY<br />
$362,100,087 $144,221,459 $85,109,532 $46,568,922<br />
DIF-Library Blds<br />
1500<br />
DIF-Libraries<br />
$3,017,482<br />
Capital<br />
Fund Group<br />
$15,876,823<br />
1600<br />
DIF-Roadway<br />
Improvements<br />
$1,727,748<br />
1620<br />
DIF-General<br />
Government<br />
$188,255<br />
1980<br />
St reet s<br />
Construction<br />
$1,194,418<br />
2000<br />
Hurf Street<br />
Bonds<br />
$106,557<br />
2040<br />
Public Safety<br />
Construction<br />
$2,272,052<br />
2060<br />
Parks<br />
Construction<br />
$176,498<br />
2100<br />
Economic Dev.<br />
Construction<br />
$61,531<br />
2130<br />
Cultural Facility<br />
Construction<br />
$250,750<br />
2140<br />
Open Space/Trail<br />
Construction<br />
$555,688<br />
2180<br />
Flood Control<br />
Construction<br />
$1,555,175<br />
Trust<br />
Fund Group<br />
$5,598,223<br />
2280<br />
Cemetery<br />
Perpetual Care<br />
$5,598,223<br />
Enterprise<br />
Fund Group<br />
$7,500,000<br />
2360<br />
Water and Sewer<br />
$5,000,000<br />
2440<br />
Landfill<br />
$2,000,000<br />
2480<br />
Sanitation<br />
$500,000<br />
Internal S ervice<br />
Fund Group<br />
$3,000,000<br />
2540<br />
Risk Mgmt<br />
Self Insurance<br />
$3,000,000<br />
9<br />
Return to TOC
CITY OF GLENDALE, AZ<br />
Distinguished Budget Presentation Award<br />
The Government Finance Officers Association <strong>of</strong> the United States and Canada (GFOA)<br />
presented a Distinguished Budget Presentation Award to the City <strong>of</strong> Glendale, Arizona for its<br />
<strong>annual</strong> <strong>budget</strong> for the fiscal year beginning July 1, 2010.<br />
In order to receive this award, a government unit must publish a <strong>budget</strong> document that meets<br />
program criteria as a policy document, as an operations guide, as a financial plan, and as a<br />
communications device.<br />
This award is valid for a period <strong>of</strong> one year only. We believe our current <strong>budget</strong> continues to<br />
conform to program requirements, and we are submitting it to GFOA to determine its eligibility<br />
for another award.<br />
10<br />
Return to TOC
CITY OF GLENDALE, AZ<br />
How to Make the Most <strong>of</strong> this Document<br />
HOW TO MAKE THE MOST OF THIS DOCUMENT<br />
This <strong>budget</strong> document serves two primary but distinct purposes. One purpose is to present the<br />
City Council and the public with a clear picture <strong>of</strong> the services the <strong>city</strong> provides and <strong>of</strong> the policy<br />
alternatives that are available. The other purpose is to provide <strong>city</strong> management with a financial<br />
and operating plan that adheres to the <strong>city</strong>’s financial policies. It also communicates the vision<br />
<strong>of</strong> the City Council and leadership team for the City <strong>of</strong> Glendale and presents the financial and<br />
organizational operations for each <strong>of</strong> the City’s departments.<br />
In an effort to assist users in navigating through this document, the following guide is provided.<br />
The document begins with the mayor’s message that is addressed to the citizens <strong>of</strong> Glendale. As<br />
such, it provides a strategic overview <strong>of</strong> the <strong>city</strong>’s infrastructure investments that would be <strong>of</strong><br />
most interest to Glendale’s citizens. A financial organization chart follows this message and<br />
provides a high level look at the operating, capital, debt service and contingency <strong>budget</strong>s. The<br />
<strong>budget</strong> calendar and a description <strong>of</strong> the <strong>budget</strong> process will help the user understand the time<br />
and effort that the City puts into developing a balance <strong>budget</strong>.<br />
Budget Message<br />
The <strong>city</strong> manager’s <strong>budget</strong> message articulates the balancing strategy used to develop the FY<br />
20<strong>12</strong> <strong>budget</strong> as well as policy issues and priorities for the fiscal year. It describes significant<br />
changes from the FY <strong>2011</strong> <strong>budget</strong> and the factors that led to those changes. It also outlines key<br />
components <strong>of</strong> the upcoming <strong>budget</strong> and discusses underlying administrative practices that<br />
support the <strong>city</strong>’s organizational goals.<br />
Budget Summaries<br />
The <strong>budget</strong> summary <strong>of</strong>fers an overview <strong>of</strong> the <strong>city</strong>’s finances and examines the following areas:<br />
• The <strong>budget</strong> components, process and <strong>budget</strong> amendment policy<br />
• Financial and operational summaries for all major funds<br />
• Historical trends for revenues, expenditures and staffing<br />
Financial Guidelines<br />
This section <strong>of</strong>fers an overview <strong>of</strong> the City’s financial planning practices including the<br />
following:<br />
• The Five-Year Forecast provides the long-range financial outlook for <strong>city</strong> operations with<br />
details on how the revenue and expenditure projections are established,<br />
• The Financial Plan discusses short- and long-term strategies that comprise the <strong>city</strong>’s<br />
approach to financial planning, and<br />
• The Financial Policies that form the framework and guidelines for overall fiscal planning<br />
and management.<br />
11<br />
Return to TOC
CITY OF GLENDALE, AZ<br />
How to Make the Most <strong>of</strong> this Document<br />
Operating Budget<br />
This section provides a closer look at the various functions <strong>of</strong> each department. Each department<br />
has provided a description <strong>of</strong> its core job functions, goals and objectives for the upcoming year,<br />
as well as recent accomplishments and other relevant statistics. The <strong>budget</strong> summaries include<br />
both historical and current year financial data for programs and services <strong>of</strong>fered by the<br />
department. They also include a summary <strong>of</strong> the type <strong>of</strong> expenditures incurred by the<br />
department as well as trends on authorized staffing.<br />
20<strong>12</strong>-2021 Capital Improvement Plan (CIP)<br />
The CIP section outlines all infrastructure improvements and additions and their respective<br />
funding sources, along with estimates for the associated operating impacts <strong>of</strong> each capital<br />
project. It starts with a narrative summary and is followed by detailed information such as<br />
funding source, project number and project description for both capital and operating costs by<br />
year for the first five years <strong>of</strong> the plan. In addition, the CIP includes five additional “out years”<br />
for future planning and discussion purposes.<br />
Schedules<br />
This is the heart <strong>of</strong> the <strong>budget</strong> document as an operating and financial plan. These schedules<br />
summarize the City’s financial activities in a comprehensive, financial format.<br />
Appendix<br />
This section includes some key <strong>city</strong> statistics regarding population, household income,<br />
occupational distribution, school enrollment and much, much more. You can also find<br />
information on the number <strong>of</strong> parks, libraries, fire and police stations.<br />
A glossary <strong>of</strong> important financial and <strong>budget</strong>ary terms that are used throughout the City’s <strong>budget</strong><br />
document and a “frequently asked questions” section, which helps address many <strong>of</strong> the most<br />
important aspects regarding the <strong>budget</strong> document, is also included.<br />
<strong>12</strong><br />
Return to TOC
CITY OF GLENDALE, AZ<br />
Budget Calendar<br />
FY 20<strong>12</strong> BUDGET CALENDAR<br />
July 2010 – February <strong>2011</strong><br />
Budget analyzed revenue and expenditure data to determine <strong>budget</strong> picture for FY 20<strong>12</strong>.<br />
Discussions with the assistant <strong>city</strong> manager and other executive management staff<br />
occurred during this time regarding numerous balancing options for the FY 20<strong>12</strong> capital<br />
and operating <strong>budget</strong>s.<br />
September 2010 thru January <strong>2011</strong><br />
Capital improvement plan (CIP) <strong>budget</strong> preparation. This process involved input by<br />
departments; the review <strong>of</strong> project <strong>budget</strong>s and operating and maintenance <strong>budget</strong>s by<br />
engineering, <strong>budget</strong> and facilities management staff; the prioritization <strong>of</strong> projects based<br />
on City Council’s strategic priorities and financial constraints; a discussion <strong>of</strong> various<br />
financing options by the CIP finance team; and preparation <strong>of</strong> the Preliminary CIP 20<strong>12</strong>-<br />
2021 document for City Council review.<br />
Preparation <strong>of</strong> FY 20<strong>12</strong> operating <strong>budget</strong> items such as premiums for workers<br />
compensation insurance, risk management insurance, vehicle replacement, technology<br />
replacement, phone services, and indirect cost allocation. Analysis <strong>of</strong> revenue trends also<br />
prepared during this time, with periodic updates to the assistant <strong>city</strong> manager.<br />
November 2010<br />
16 Status report through the first quarter on the FY <strong>2011</strong> General Fund operating <strong>budget</strong><br />
revenues and expenditures was presented to City Council.<br />
29 FY 20<strong>12</strong> operating <strong>budget</strong> kick<strong>of</strong>f meeting with the executive leadership team comprised<br />
<strong>of</strong> the assistant <strong>city</strong> manager, deputy <strong>city</strong> managers, police and fire chiefs, and City<br />
Council appointees.<br />
30 FY 20<strong>12</strong> operating <strong>budget</strong> kick<strong>of</strong>f meeting with department directors and staff to<br />
commence <strong>budget</strong> input. Input continued through December 23, 2010.<br />
December 2010<br />
8 City Council goal review and strategic planning retreat with a presentation <strong>of</strong> the<br />
successes <strong>of</strong> the <strong>city</strong>’s Innovate program. City Council affirmed its existing strategic<br />
goals.<br />
23 Last day for FY 20<strong>12</strong> operating <strong>budget</strong> input by departments.<br />
January <strong>2011</strong><br />
18 Economic update and outlook, as well as status report through five months on the FY<br />
<strong>2011</strong> General Fund operating <strong>budget</strong> revenues and expenditures, were presented to City<br />
Council. Overall balancing strategy for the FY 20<strong>12</strong> operating <strong>budget</strong> also was discussed<br />
with City Council.<br />
13<br />
Return to TOC
CITY OF GLENDALE, AZ<br />
Budget Calendar<br />
February <strong>2011</strong><br />
The balancing plan for the FY 20<strong>12</strong> general fund operating <strong>budget</strong> and the FY 20<strong>12</strong>-2021<br />
capital plan was finalized with the assistant <strong>city</strong> manager and the executive leadership<br />
team. Preparation <strong>of</strong> the City Council <strong>budget</strong> work<strong>book</strong> for the March 22 and 29 <strong>budget</strong><br />
workshops commenced.<br />
March <strong>2011</strong><br />
1 Status report through seven months on the FY <strong>2011</strong> General Fund operating <strong>budget</strong><br />
revenues and expenditures was presented to City Council.<br />
14 Delivery <strong>of</strong> the City Council <strong>budget</strong> work<strong>book</strong> occurred during the week beginning<br />
March 14. The work<strong>book</strong> contained the <strong>city</strong> manager’s recommended FY 20<strong>12</strong> <strong>budget</strong><br />
memo, the FY 20<strong>12</strong> operating <strong>budget</strong> document and the <strong>preliminary</strong> FY 20<strong>12</strong>-2021<br />
capital improvement plan.<br />
22 1:30 PM – 5:00 PM, <strong>budget</strong> workshop.<br />
29 1:00 PM – 5:00 PM, <strong>budget</strong> workshop<br />
April <strong>2011</strong><br />
The FY 20<strong>12</strong> <strong>budget</strong> document was prepared. This included preparation <strong>of</strong> all schedules<br />
such as fund balance analyses, summary <strong>of</strong> revenues, operating <strong>budget</strong>s by program and<br />
fund, debt service schedules, transfers between funds, summary <strong>of</strong> property tax levy and<br />
tax rate, departmental narratives, <strong>budget</strong> message, etc.<br />
May <strong>2011</strong><br />
17 The FY 20<strong>12</strong> <strong>preliminary</strong> <strong>budget</strong> document was delivered to City Council in advance <strong>of</strong><br />
the May 24 council meeting.<br />
24 City Council adopted a resolution approving the FY 20<strong>12</strong> <strong>preliminary</strong> <strong>budget</strong>, directing<br />
publication <strong>of</strong> the <strong>preliminary</strong> <strong>budget</strong>, giving notice <strong>of</strong> the June 14 date for the public<br />
hearing on the FY 20<strong>12</strong> <strong>preliminary</strong> <strong>budget</strong> and a separate public hearing on the FY 20<strong>12</strong><br />
property tax levy and giving notice <strong>of</strong> the June 28 date for the adoption <strong>of</strong> the FY 20<strong>12</strong><br />
property tax levy.<br />
26 Publication in The Glendale Star <strong>of</strong> FY 20<strong>12</strong> <strong>budget</strong> information as required by state<br />
statute.<br />
June <strong>2011</strong><br />
2 Second publication in The Glendale Star <strong>of</strong> FY 20<strong>12</strong> <strong>budget</strong> information as required by<br />
state statute.<br />
2 The Planning Department presented the FY 20<strong>12</strong>-2021 CIP to the Planning Commission<br />
for review as required by Arizona state law to ensure consistency with the City’s General<br />
14<br />
Return to TOC
CITY OF GLENDALE, AZ<br />
Budget Calendar<br />
Plan. The Planning Commission sent a letter to the City Council indicating that the FY<br />
20<strong>12</strong>-2021 CIP is consistent with the Glendale’s General Plan.<br />
14 City Council conducted a public hearing on the FY 20<strong>12</strong> property tax levy. City Council<br />
conducted a separate public hearing on the FY 20<strong>12</strong> <strong>budget</strong> and convened a special<br />
meeting to adopt a resolution approving the FY 20<strong>12</strong> <strong>budget</strong>.<br />
28 City Council adopted an ordinance approving the FY 20<strong>12</strong> property tax levy.<br />
July <strong>2011</strong><br />
1 Start <strong>of</strong> FY 20<strong>12</strong>.<br />
September <strong>2011</strong><br />
TBD Clean up ordinance to City Council regarding FY <strong>2011</strong> inter-fund <strong>budget</strong> transfers.<br />
15<br />
Return to TOC
CITY OF GLENDALE, AZ<br />
Budget Process<br />
OVERVIEW:<br />
FY 20<strong>12</strong> BUDGET PROCESS<br />
The FY 20<strong>12</strong> operating and capital <strong>budget</strong>s are based on council’s continued vision <strong>of</strong> ‘one<br />
community’ and the supporting strategic goals that Council reaffirmed at a December 2009<br />
retreat:<br />
• One community that is fiscally sound,<br />
• One community with strong neighborhoods,<br />
• One community committed to public safety,<br />
• One community with quality economic development,<br />
• One community with a vibrant <strong>city</strong> center,<br />
• One community with an active partnership with Luke Air Force Base, and<br />
• One community with high quality services for citizens.<br />
Two principal issues for the FY 20<strong>12</strong> <strong>budget</strong> were the ongoing challenges <strong>of</strong> the economy and<br />
the Coyotes National Hockey League team as the main tenant <strong>of</strong> the <strong>city</strong>-owned Jobing.com<br />
Arena. Both are discussed in detail in the City Manager’s Message in this document.<br />
Over the course <strong>of</strong> several months various balancing options for both the FY 20<strong>12</strong> operating<br />
<strong>budget</strong> and the FY 20<strong>12</strong>-2021 capital improvement plan were evaluated. A final balancing plan<br />
was established in February <strong>2011</strong> and resulted in the recommended <strong>budget</strong> presented to City<br />
Council at a series <strong>of</strong> <strong>budget</strong> workshops held in March <strong>2011</strong>. For more information please see<br />
the City Manager’s Message in this document<br />
At the conclusion <strong>of</strong> these <strong>budget</strong> workshops, the proposed <strong>budget</strong> was presented to Council for<br />
tentative adoption and then, two weeks later, for final adoption. The <strong>budget</strong> was transmitted to<br />
the general public in the form <strong>of</strong> public hearing notices. These notices included summary <strong>budget</strong><br />
information, including the date for the public hearing on the property tax levy, as required by<br />
Arizona state law. After completing the public hearing for the final FY 20<strong>12</strong> <strong>budget</strong>, the Council<br />
adopted it and thereby set the expenditure limitation for FY 20<strong>12</strong>. A separate public hearing on<br />
the FY 20<strong>12</strong> property tax levy was conducted at the same meeting as the final <strong>budget</strong> adoption.<br />
Adoption <strong>of</strong> the property tax levy occurred two weeks later. The chart below illustrates the<br />
broad outline <strong>of</strong> the FY 20<strong>12</strong> <strong>budget</strong> development process.<br />
16<br />
Return to TOC
CITY OF GLENDALE, AZ<br />
Budget Process<br />
VARIATIONS IN BUDGETING METHODS:<br />
The <strong>budget</strong>s <strong>of</strong> general government type funds, such as the General Fund, Public Safety Special<br />
Revenue Fund, Streets Fund and Transportation Fund are prepared on a modified accrual basis.<br />
This means that unpaid financial obligations, such as outstanding purchase orders, are<br />
immediately reflected as encumbrances when the cost is estimated, although the items may not<br />
have been received yet. However, in most cases revenue is recognized only after it is measurable<br />
and actually available. Beginning with FY 1996, sales tax revenues were recorded in the period<br />
in which they were due to the <strong>city</strong>. This changed in FY 2008 and sales tax revenue is now<br />
recorded to the month it is collected.<br />
Enterprise funds (Water/Sewer, Landfill, Sanitation and Community Housing Services) are<br />
prepared using the full accrual method. Enterprise funds also recognize expenditures as<br />
encumbered when a commitment is made (e.g., through a purchase order). Revenues, on the<br />
other hand, are recognized when they are obligated to the <strong>city</strong> (for example, water user fees are<br />
recognized as revenue when service is provided).<br />
Purchase orders for goods and services received prior to the end <strong>of</strong> the current fiscal year will be<br />
eligible for payment for a period <strong>of</strong> days following the close <strong>of</strong> the fiscal year. However,<br />
encumbrances for all other purchase orders will automatically lapse.<br />
17<br />
Return to TOC
CITY OF GLENDALE, AZ<br />
Budget Process<br />
The Comprehensive Annual Financial Report (CAFR) presents the status <strong>of</strong> the <strong>city</strong>'s finances on<br />
the basis <strong>of</strong> Generally Accepted Accounting Principles (GAAP). Since FY 2002, the CAFR has<br />
been prepared in compliance with Governmental Accounting Standards Board (GASB)<br />
Statement No. 34 requirements. The CAFR shows fund expenditures and revenues on both a<br />
GAAP basis and <strong>budget</strong> basis for comparison purposes. In most cases, this conforms to the way<br />
the <strong>city</strong> prepares its <strong>budget</strong> with the following exceptions:<br />
a. Compensated absences liabilities that are expected to be liquidated with expendable<br />
available financial resources are accrued as earned by employees on a GAAP basis as<br />
opposed to being expended when paid on a <strong>budget</strong> basis.<br />
b. Principal payments on long-term debt within the enterprise funds are applied to the<br />
outstanding liability on a GAAP basis as opposed to being expended when paid on a<br />
<strong>budget</strong> basis.<br />
c. Capital outlays within the enterprise funds are recorded as assets on a GAAP basis and<br />
expended on a <strong>budget</strong> basis.<br />
d. Inventory is expensed at the time it is used.<br />
e. Depreciation expense is not <strong>budget</strong>ed as an expense.<br />
ACCOUNTING CHANGES:<br />
A new fund was <strong>budget</strong>ed in FY 20<strong>12</strong> within the General Fund Group titled Camelback Ranch<br />
Event Ops (Fund <strong>12</strong>83). This fund is used to track operational expenditures incurred at the new<br />
spring training baseball facility which is home to the Los Angeles Dodgers and Chicago White<br />
Sox. Any revenue reimbursement received for <strong>city</strong> services is recorded in the fund. A General<br />
Fund operating transfer will be made to cover all expenditures that exceed the reimbursement<br />
received. This fund will function is much the same way as the Stadium Event Operations (Fund<br />
<strong>12</strong>81) and Arena Event Operations (Fund <strong>12</strong>82) that were established to track financial activity<br />
at the NFL’s Arizona Cardinals and NHL’s Phoenix Coyotes venues.<br />
The Civic Center (Fund 1740) was reclassified from the Special Revenue Fund Group in FY<br />
<strong>2011</strong> to the General Fund Group in FY 20<strong>12</strong>. This change was made due to the level <strong>of</strong> support<br />
received from the General Fund made via <strong>annual</strong> operating transfers <strong>of</strong> cash to cover Civic<br />
Center expenditures that exceed revenues collected. A $361,497 General Fund transfer was<br />
<strong>budget</strong>ed in FY <strong>2011</strong> and a $406,517 transfer has been <strong>budget</strong>ed for FY 20<strong>12</strong>. FY <strong>2011</strong> Civic<br />
Center <strong>budget</strong>ed revenues totaled $387,000, while the FY 20<strong>12</strong> revenue <strong>budget</strong> is $410,300.<br />
Another new fund was created within the Special Revenue Fund Group titled Neighborhood<br />
Stabilization Program III (Fund 1311). This fund is used to track revenues received from the<br />
federal government and any associated expenditures with the federal grant program. This new<br />
fund is very similar to the Neighborhood Stabilization Program (Fund 1310) that has been<br />
included in the <strong>city</strong>’s <strong>budget</strong> for many years.<br />
A new fund titled P.F.C. Debt Service (Fund 1930) was created within the Debt Service Fund<br />
Group to track the principal and interest payments associated with the construction and<br />
18<br />
Return to TOC
CITY OF GLENDALE, AZ<br />
Budget Process<br />
equipment needed for the Camelback Ranch spring training baseball facility. The Public<br />
Facilities Corporation (PFC) is a non-pr<strong>of</strong>it corporation organized under the laws <strong>of</strong> the State <strong>of</strong><br />
Arizona. City Council retains oversight and must approve all debt upon recommendation from<br />
the PFC Board <strong>of</strong> Directors, which consists <strong>of</strong> four City employees and one private citizen.<br />
Although the PFC is a legally separate entity from the City, the PFC is reported as if it is part <strong>of</strong><br />
the primary government because it sole purpose is to finance and construct public facilities for<br />
the City.<br />
Debt service for Highway User Fee Revenue (HURF) bonds will continue to be addressed as it<br />
was for FY 2010 and FY <strong>2011</strong>. The City has outstanding HURF bonds for street projects that<br />
are backed by a pledge <strong>of</strong> the HURF monies the <strong>city</strong> receives from the state. The state reduced<br />
the amount <strong>of</strong> HURF revenue that is distributed to cities for FY 2010 and FY <strong>2011</strong> and further<br />
reduced for FY 20<strong>12</strong>. Therefore, a portion <strong>of</strong> HURF debt service will continue to be paid by<br />
secondary property tax revenue ($1,353,169), roadway development impact fees ($1 million) and<br />
transportation sales tax revenues ($1 million). The remaining $1,353,169 needed for the $4.7<br />
million debt service payment will be paid for using HURF revenues.<br />
19<br />
Return to TOC
BUDGET MESSAGE<br />
FY <strong>2011</strong>-<strong>12</strong><br />
CITY OF GLENDALE, AZ<br />
PRELIMINARY<br />
ANNUAL BUDGET<br />
BOOK
Honorable Mayor and Council:<br />
BUDGET MESSAGE<br />
City Manager’s Budget Message<br />
While the current economic environment has presented its<br />
share <strong>of</strong> challenges for local and state government, the City<br />
<strong>of</strong> Glendale continues to look towards the future with<br />
optimism, flexibility and resilience. Vision, innovation,<br />
partnerships, and dedicated employees continue to play a<br />
central role in making the <strong>city</strong>’s future efforts rewarding<br />
and successful despite the difficult economy.<br />
This outlook is a result <strong>of</strong> City Council’s continued focus<br />
on enhancing long-term fiscal strength and sustainability<br />
for the community. This outcome is being accomplished<br />
through quality economic development and the<br />
continuation <strong>of</strong> strategic investments that build upon those<br />
made over the last several years. This outlook also is the<br />
result <strong>of</strong> the strategic management <strong>of</strong> constrained <strong>city</strong><br />
resources during the long and deep recession that hit Arizona particularly hard. As a result, the<br />
<strong>city</strong>’s FY 20<strong>12</strong> <strong>budget</strong> continues to provide resources to maintain high quality, core services and<br />
minimizes the impact <strong>of</strong> <strong>budget</strong> reductions in other areas <strong>of</strong> <strong>city</strong> services. The FY 20<strong>12</strong> <strong>budget</strong><br />
also continues to position ourselves to be proactive and responsive to opportunities that benefit<br />
the community.<br />
The FY 20<strong>12</strong> <strong>budget</strong> total across all funds is $638 million. The total <strong>of</strong> $638 million is the third<br />
consecutive year <strong>of</strong> decline from the peak <strong>of</strong> $925 million in FY 2009. Despite the declines, the<br />
overall <strong>budget</strong> continues to focus on the Mayor and Council’s vision <strong>of</strong> ‘one community’ and the<br />
supporting strategic goals that Council reconsidered at a December 2010 retreat.<br />
• One community that is fiscally sound,<br />
• One community with strong neighborhoods,<br />
• One community committed to public safety,<br />
• One community with quality economic development,<br />
• One community with a vibrant <strong>city</strong> center,<br />
• One community with an active partnership with Luke Air Force Base, and<br />
• One community with high quality services for citizens.<br />
The FY 20<strong>12</strong> <strong>budget</strong> also continues to reflect the enduring challenges <strong>of</strong> the post-recession<br />
economy. Many expenditure management measures were implemented since FY 2009 while<br />
keeping our focus on providing exceptional <strong>city</strong> services that sustain Council’s strategic goals.<br />
While public safety remains a top priority for Council, the represented public safety labor groups<br />
have fully participated in helping to balance the <strong>budget</strong>. They have made reductions in their<br />
operating <strong>budget</strong>, implemented operational efficiencies, absorbed vacancies, and made<br />
concessions on labor-related items.<br />
20<br />
Return to TOC
BUDGET MESSAGE<br />
City Manager’s Budget Message<br />
Discussion – Principal Issues<br />
The same two principal issues that had to be addressed for the FY <strong>2011</strong> <strong>budget</strong> remain for the FY<br />
<strong>12</strong> <strong>budget</strong>. They are explained below. The <strong>budget</strong> actions taken to address these two principal<br />
issues are addressed in the subsequent section.<br />
Economic Conditions. One principal issue for the FY 20<strong>12</strong> <strong>budget</strong> continues to be the recession<br />
and the impact it had, and continues to have, on the <strong>city</strong>’s resources to fund services to the<br />
community and the <strong>city</strong>’s capital plan. Arizona was substantially impacted by the recent<br />
recession as indicated by the unprecedented decline in property values (discussed later in this<br />
message) and 35 consecutive months <strong>of</strong> year-over-year job losses that just ended in January<br />
<strong>2011</strong>. As a result, economic recovery is expected to occur over an extended period <strong>of</strong> time.<br />
According to the academic, private and government experts on the Arizona economy, recovery<br />
across the state will rely on business growth and investment that translates into improved<br />
employment conditions and population growth. These are the traditional drivers <strong>of</strong> economic<br />
growth in Arizona. Also key to Arizona’s recovery is a clearing <strong>of</strong> the excess inventory <strong>of</strong><br />
vacant homes and <strong>of</strong>fice and retail space that still dominate the Phoenix metropolitan area.<br />
The impact <strong>of</strong> the economic conditions that have prevailed in Arizona for the past few years are<br />
most evident in the major sources <strong>of</strong> operating and capital <strong>budget</strong> revenue. For the General Fund<br />
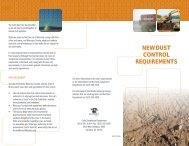
(GF) operating <strong>budget</strong>, ongoing revenue collections peaked in FY 2008 at $184.2 million. The<br />
FY 20<strong>12</strong> projection <strong>of</strong> $143.7 million is $40.5 million or 22% less than the peak. Overall, we<br />
expect to collect less in FY 20<strong>12</strong> than we received in FY 2005.<br />
$190.0<br />
$180.0<br />
$170.0<br />
$160.0<br />
$150.0<br />
$140.0<br />
$130.0<br />
$<strong>12</strong>0.0<br />
$110.0<br />
$100.0<br />
General Fund Total Ongoing Revenue<br />
(excl one‐time revenues)<br />
FY 02 FY 03 FY 04 FY 05 FY 06 FY 07 FY 08 FY 09 FY 10 FY 11<br />
Est<br />
FY<strong>12</strong><br />
Proj<br />
21<br />
Return to TOC
BUDGET MESSAGE<br />
City Manager’s Budget Message<br />
The two major sources <strong>of</strong> GF operating <strong>budget</strong> revenue continue to be <strong>city</strong> sales taxes and stateshared<br />
revenues. The FY 20<strong>12</strong> <strong>city</strong> sales tax projection is $51.9 million, an 18% decline from<br />
the peak <strong>of</strong> $63.6 million in FY 2007. The good news is that we believe the positive sales tax<br />
performance since the start <strong>of</strong> FY <strong>2011</strong> means the erosion in this critical revenue source has<br />
leveled <strong>of</strong>f. Despite the recent volatility <strong>of</strong> gas prices and other essential commodities, we<br />
believe price stability will return, as it has in the past. Therefore, the FY 20<strong>12</strong> projection <strong>of</strong><br />
$51.9 million reflects a modest increase <strong>of</strong> 2.7% from the FY <strong>2011</strong> estimate <strong>of</strong> $50.5 million.<br />
State shared revenue for FY 20<strong>12</strong> is expected to be $43.9 million, a 34% decline from the peak<br />
<strong>of</strong> $66.1 million in FY 2008. This is the fourth consecutive year <strong>of</strong> decline for this critical<br />
revenue source. The continued decline is the result <strong>of</strong> the lagging impact <strong>of</strong> the economic<br />
downturn on income tax receipts and the state’s subsequent distribution <strong>of</strong> them, as well as<br />
population changes reflected in the 2010 Census. Glendale formerly comprised almost 5% <strong>of</strong> the<br />
state’s population; with the 2010 Census figures, Glendale’s population now comprises about<br />
4.5% <strong>of</strong> the state’s total. That seemingly minor change in population distribution resulted in a<br />
loss <strong>of</strong> $5.4 million in state-shared revenue for Glendale, an amount already incorporated into the<br />
<strong>budget</strong> balancing for FY 20<strong>12</strong>.<br />
On the capital side, Glendale’s secondary assessed valuation has plummeted almost 50% from a<br />
high <strong>of</strong> $2.2 billion in FY 2009, which reflected the real estate market <strong>of</strong> calendar year 2006, to<br />
an estimated low <strong>of</strong> $1.1 billion in FY 2013 (calendar year 2010 real estate market). The<br />
unprecedented valuation decline has resulted in a corresponding dive in secondary property tax<br />
revenue, from $29.3 million in FY 2010 to $18.1 million in FY 20<strong>12</strong>. Another decline is<br />
expected for FY 2013 – to an estimated $15.6 million – based on the <strong>preliminary</strong> valuation<br />
notices sent to property owners in February <strong>2011</strong>.<br />
City-Owned Jobing.com Arena and the Coyotes Hockey Team. In 2001, the City <strong>of</strong><br />
Glendale entered into various agreements for the purpose <strong>of</strong> creating a high-quality, diversified<br />
economic engine. The purpose <strong>of</strong> this economic center was to generate new and sustainable<br />
revenue sources to support exceptional <strong>city</strong> services for the community and to develop a<br />
signature destination area for tourism. Offices, hotels, entertainment, retail and restaurant<br />
facilities were planned to complement the <strong>city</strong>-owned Jobing.com Arena. A key tenant <strong>of</strong> the<br />
Jobing.com Arena has been the National Hockey League’s (NHL) Coyotes team.<br />
In May 2009, the former owner <strong>of</strong> the Coyotes hockey team unexpectedly filed for federal<br />
bankruptcy protection. During the bankruptcy proceedings, the National Hockey League<br />
purchased the assets <strong>of</strong> the Coyotes but did not assume the arena management, use and lease<br />
agreement. Therefore, for the past two years the <strong>city</strong> has been working with potential buyers <strong>of</strong><br />
the Coyotes to structure an arrangement that would retain the team in Glendale.<br />
City Council established criteria to guide the development <strong>of</strong> a new arrangement. They include<br />
• Retention <strong>of</strong> the team for the full length <strong>of</strong> the lease at the <strong>city</strong>’s Jobing.com Arena,<br />
• Retention <strong>of</strong> existing arena revenues to support the <strong>annual</strong> debt service requirements<br />
for the capital construction <strong>of</strong> the <strong>city</strong>’s Jobing.com Arena, and<br />
22<br />
Return to TOC
BUDGET MESSAGE<br />
City Manager’s Budget Message<br />
• Creation <strong>of</strong> opportunities for the <strong>city</strong> to share in new revenue streams that could<br />
support exceptional <strong>city</strong> services to the community and ensure a sustainable future for<br />
the <strong>city</strong>.<br />
These criteria were established because the expenses <strong>of</strong> managing the arena are currently <strong>of</strong>fset<br />
with the revenue earned by having the Coyotes as the arena’s main tenant. Further, an<br />
independent economic impact study showed that keeping the team for the term <strong>of</strong> the arena lease<br />
and management agreement was valued at between $270 million and $338 million. That is the<br />
value to the <strong>city</strong> today so losing the team to another <strong>city</strong> would cause significant damage to the<br />
Glendale community.<br />
In May <strong>2011</strong>, the NHL confirmed its intention to keep the team in Glendale by agreeing to an<br />
extension <strong>of</strong> the management agreement between the NHL and the <strong>city</strong>. This extension <strong>of</strong> the<br />
agreement allows the team to remain in Glendale for the NHL’s <strong>2011</strong>-<strong>12</strong> season. It also allows<br />
the NHL and the <strong>city</strong> additional time to complete the required agreement with an ownership<br />
group that will be committed to retaining the team in Glendale at the Jobing.com Arena.<br />
Therefore, the FY 20<strong>12</strong> GF operating <strong>budget</strong> assumes the general terms <strong>of</strong> the current agreement<br />
moving forward will be in place. The most significant is retention <strong>of</strong> the team as the anchor<br />
tenant <strong>of</strong> Glendale’s Jobing.com Arena. The FY 20<strong>12</strong> <strong>budget</strong> also incorporates the addition <strong>of</strong> a<br />
$20 million arena management fee.<br />
Discussion – Actions Taken To Address Principal Issues<br />
The <strong>budget</strong> balancing strategy that was presented to Council as part <strong>of</strong> the FY <strong>2011</strong> operating<br />
<strong>budget</strong> remains in place. It is important we continue with this strategy until we see sustained<br />
growth in retail sales, income taxes and other critical revenue sources because ongoing revenues<br />
have not recovered sufficiently to fully support the <strong>city</strong>’s ongoing operating expenses. While<br />
this <strong>budget</strong> strategy is designed to adapt operations to constrained resources, it also positions the<br />
<strong>city</strong> to be ready for the time when the economy is fully recovered.<br />
This <strong>budget</strong> strategy is marked by a strategic, business-based and phased approach. This <strong>budget</strong><br />
strategy also sustains core <strong>city</strong> services as defined by Council’s strategic goals. These core<br />
services are health and safety related such as emergency response services provided by the Police<br />
and Fire Departments. This strategy also ensures the smooth operation <strong>of</strong> the overall<br />
organization. Finally, to the extent possible, this strategy minimizes the impact to other services<br />
provided to the community in recognition <strong>of</strong> the fact that a municipality is fundamentally a<br />
service organization.<br />
One critical element <strong>of</strong> the <strong>city</strong>’s <strong>budget</strong> strategy that deserves recognition is the <strong>city</strong>’s Innovate<br />
Initiative. This initiative is directly tied to the <strong>budget</strong> process and the <strong>city</strong>’s strategic business<br />
model. Employees have been, and continue to be, actively engaged in making business-based<br />
recommendations for adjustments that help us in balancing the <strong>budget</strong>.<br />
Operating Budget. I have very good news for employees for FY 20<strong>12</strong> regarding furloughs and<br />
the pay-related reductions <strong>of</strong>fered by the represented labor groups: these measures will be scaled<br />
back by 50%. For FY 20<strong>12</strong>, furloughs will be at 2.5% (52 hours) and the pay-related reductions<br />
for the represented labor groups will be changed accordingly.<br />
23<br />
Return to TOC
BUDGET MESSAGE<br />
City Manager’s Budget Message<br />
Also for FY 20<strong>12</strong>, step increases will be implemented for eligible employees in the represented<br />
public safety labor groups. The increases are necessary for Glendale to remain competitive for<br />
essential public safety-related recruitment and retention efforts.<br />
The FY 20<strong>12</strong> operating <strong>budget</strong> includes a mix <strong>of</strong> ongoing and one-time <strong>budget</strong> measures, debt<br />
refunding and use <strong>of</strong> the GF fund balance as was done for the FY 2009 and FY 2010 operating<br />
<strong>budget</strong>s. Use <strong>of</strong> the GF fund balance during challenging economic cycles is a legitimate and<br />
widely-used course <strong>of</strong> action for many state and local governments here in Arizona and across<br />
the United States.<br />
The City <strong>of</strong> Glendale established a healthy GF fund balance after the 2001 recession through<br />
prudent financial management that resulted in the development <strong>of</strong> a robust reserve totaling more<br />
than $66 million (CAFR basis) at the end <strong>of</strong> FY 2008. This was a prudent course <strong>of</strong> action<br />
because that healthy fund balance has enabled the <strong>city</strong> to continue providing exceptional <strong>city</strong><br />
services over the past few years and again for FY 20<strong>12</strong>. The alternative would have been severe<br />
ongoing reductions to <strong>city</strong> services, including core services, to match the $40.5 million or 22%<br />
decline in GF ongoing revenue sources that was discussed earlier in this message.<br />
By the end <strong>of</strong> FY 2010, the GF fund balance had declined to $38.8 million. The decline in fund<br />
balance during the recession led to a downgrade in the <strong>city</strong>’s bond rating, as has happened with<br />
several valley cities given the recession’s deep impact on Arizona. While the <strong>city</strong>’s bond rating<br />
remains strong, the downgrade is a signal that we must begin rebuilding the <strong>city</strong>’s GF fund<br />
balance. Therefore we must make deliberate steps toward a gradual rebuilding <strong>of</strong> the GF fund<br />
balance to a more healthy level.<br />
The recommended mix <strong>of</strong> ongoing and one-time measures results in a balanced <strong>budget</strong> plan for<br />
FY 20<strong>12</strong>, as required by state statutes. A summary <strong>of</strong> the mix <strong>of</strong> GF ongoing and one-time<br />
measures for FY 20<strong>12</strong> follows.<br />
• Hold open 64 GF vacancies as they become available. At the time this message was<br />
written, 30 GF positions were vacant. $4.7 million in savings.<br />
• Continuation <strong>of</strong> phased, sworn positions (22 FTEs) originally put in place for FY<br />
<strong>2011</strong>. $1.6 million in savings.<br />
• Continue the furlough program but at one-half the level in place for FY <strong>2011</strong>. This<br />
means that furloughs will be at 2.5% (52 hours) for FY 20<strong>12</strong>. All non-represented<br />
employees participate in the furlough plan. Also similarly modi<strong>fy</strong> the pay-related<br />
deferrals for the represented employees. $1.3 million in savings.<br />
• Five percent (5%) reductions to base <strong>budget</strong>s plus further reductions to internal<br />
service and replacement fund premiums to correspond with the increased number<br />
vacancies to be held frozen. $1.8 million in savings.<br />
• Restructure lease debt and Municipal Property Corporation debt service to take<br />
advantage <strong>of</strong> more favorable repayment terms. $8.6 million in savings.<br />
• One time revenue related to the amended parking agreement for the mixed use<br />
development in the sports and entertainment district that City Council approved in<br />
January <strong>2011</strong> plus a contribution from the enterprise funds with the refund <strong>of</strong> the<br />
24<br />
Return to TOC
BUDGET MESSAGE<br />
City Manager’s Budget Message<br />
escrow established to retain the Coyotes team as a primary tenant at the Glendale<br />
Arena. This refund makes the funds available for GF use, as a one-time investment,<br />
to reduce the amount <strong>of</strong> transfers from the GF. $17.5 million in one-time revenue.<br />
• Use GF fund balance to close the remaining between GF operating revenues and<br />
expenditures. $9.6 million in GF fund balance.<br />
It is very important to note the use <strong>of</strong> $17.5M in one-time revenue and $9.6 million in fund<br />
balance to balance the GF operating <strong>budget</strong> for FY 20<strong>12</strong> in order to avoid drastic reductions to<br />
<strong>city</strong> services for the community. That one-time revenue and use <strong>of</strong> fund balance is a one-time fix<br />
for the $27.1 million gap between GF ongoing revenue and GF ongoing expenditures. This<br />
means the gap will have to be addressed for the FY 2013 <strong>budget</strong> given that it is unlikely revenues<br />
will grow sufficiently to close that gap.<br />
For the enterprise funds, an <strong>annual</strong> review <strong>of</strong> the rates charged for water, sewer, sanitation<br />
collection, and landfill disposal services was completed. No rate adjustments will be made for<br />
FY 20<strong>12</strong>. These <strong>annual</strong> reviews <strong>of</strong> the enterprise funds are done to ensure incoming revenues<br />
are sufficient to support operating and capital expenditures for those individual operations.<br />
Other fees, such as those charged for plan review and building inspections, are adjusted<br />
periodically per the consumer price index (CPI).<br />
Capital Program. Given Council’s prior direction to keep the secondary property tax rate<br />
unchanged, the first five years <strong>of</strong> the <strong>of</strong> the G.O. component <strong>of</strong> FY 20<strong>12</strong>-21 CIP was restructured<br />
to push back into the last five years <strong>of</strong> the plan all but two projects (plus any carryover from<br />
projects underway in the current FY). The two projects retained in the first five years <strong>of</strong> the<br />
G.O. component <strong>of</strong> the CIP are listed below.<br />
• One is in the Public Safety category and is related to ongoing improvements to the<br />
public safety digital communication system.<br />
• The second project is in the Flood Control category and addresses the cost <strong>of</strong> a<br />
regulatory permit the <strong>city</strong> is required to maintain.<br />
Notable G.O. projects on hold are the completion <strong>of</strong> the new Municipal Court and the new West<br />
Area Library. Both projects are now in the last five years <strong>of</strong> the FY 20<strong>12</strong>-21 capital plan.<br />
As mentioned briefly earlier in this message, the impact <strong>of</strong> the steep valuation decline on the<br />
<strong>city</strong>’s secondary property tax revenue stream directly affects the <strong>city</strong>’s capa<strong>city</strong> to support debt<br />
service on existing General Obligation bonds, as well as support additional debt service for new<br />
capital projects. Additional factors affecting the <strong>city</strong>’s secondary property tax revenue are the<br />
following:<br />
• Accelerated reduction in the assessment ratio for commercial properties per recent<br />
state statutes, and<br />
• Reduction <strong>of</strong> the <strong>city</strong>’s secondary property tax rate in FY 2008 and FY 2009<br />
25<br />
Return to TOC
BUDGET MESSAGE<br />
City Manager’s Budget Message<br />
The significantly changed landscape necessitates an evaluation <strong>of</strong> the <strong>city</strong>’s secondary property<br />
tax rate over the next year. This is especially true if the <strong>city</strong> is not able to restructure existing<br />
General Obligation bond debt service along more favorable terms so <strong>annual</strong> debt service<br />
payments can more closely match the diminished revenue stream. The plan <strong>of</strong> action for FY<br />
20<strong>12</strong> is to evaluate debt restructuring options through this upcoming fall and return to Council<br />
with a revised debt management plan and recommended options for Council’s <strong>annual</strong> retreat.<br />
This timeframe allows us to evaluate fully the range <strong>of</strong> options as well as assess the <strong>2011</strong> real<br />
estate market, which will affect the secondary property tax revenue to be received in FY 2014.<br />
Given the sustained decline in total water consumption and the number <strong>of</strong> bills issued, combined<br />
with no rate adjustments for FY 20<strong>12</strong>, the water and sewer capital plan was modified to reflect<br />
the following:<br />
• The deferral <strong>of</strong> non-essential growth-related capital projects<br />
• Ongoing improvements in operational efficiencies to minimize cost increases related<br />
to fuel, equipment and electri<strong>city</strong><br />
• Continuation <strong>of</strong> critical repair, maintenance and replacement <strong>of</strong> existing capital assets<br />
such as underground pipes<br />
• Continuation <strong>of</strong> capital projects that ensure compliance with applicable federal, state<br />
and county regulations<br />
The Glendale Onboard transportation capital program is primarily supported by the designated<br />
sales tax for transportation, with federal, state and regional transportation funds used for some<br />
projects. As expected, the economy continues to impact this program’s capital plan although<br />
significant progress on key projects has been made.<br />
Of particular note is the pavement management program that is included in the transportation<br />
sales tax capital plan. The pavement management program will be funded at $2 million per FY<br />
for FY 20<strong>12</strong> through FY 2016, and $10 million for the last five years <strong>of</strong> the plan. If an<br />
opportunity arises to increase this level <strong>of</strong> funding level through changes to the debt management<br />
plan, we will present this information to Council during the year.<br />
For FY 20<strong>12</strong>, two major projects planned are the start <strong>of</strong> construction for Northern Parkway and<br />
Grand Avenue improvements. Northern Parkway is a <strong>12</strong>.5 mile high-capa<strong>city</strong> expressway<br />
running west to east, and will be a major transportation corridor across Glendale from the Loop<br />
303 east to Grand Avenue. The first segment, from the Loop 303 to Dysart Road, is set to start<br />
construction in the summer <strong>of</strong> <strong>2011</strong>. Grand Avenue improvements will improve traffic flow,<br />
enhance safety and improve the overall appearance <strong>of</strong> the roadway with landscaping, sidewalks,<br />
and undergrounding utilities. Other capital projects include design <strong>of</strong> a transit center in north<br />
Glendale, intersection safety improvements at 51 st Avenue and Camelback Road, Glendale<br />
Airport runway improvements, and several bicycle/pedestrian multiuse pathway projects.<br />
The Glendale transportation capital program also has benefitted tremendously from the federal<br />
stimulus program. Glendale was approved for over $6 million in federal stimulus funding for<br />
capital projects that will help lower ongoing maintenance expenses for roads. Street pavement<br />
overlays enhanced the life <strong>of</strong> the pavement on two arterial streets, Litchfield Road and Glendale<br />
Avenue. Also completed were the application <strong>of</strong> long-term pavement markings on 25 miles <strong>of</strong><br />
arterial streets and improvements to the existing signal system that reduce the burden on local<br />
funds to maintain older equipment prone to breakdowns and emergency repairs.<br />
26<br />
Return to TOC
BUDGET MESSAGE<br />
City Manager’s Budget Message<br />
Conclusion<br />
As we progress through FY 20<strong>12</strong>, we will continue to evalute revenues and expenditures and to<br />
ensure we are on the path the Council has charted for the <strong>city</strong>. We will continue providing<br />
quarterly reports to Council on the performance <strong>of</strong> the General Fund and the designated sales tax<br />
funds. These reports will keep you apprised <strong>of</strong> how revenues and expenditures are doing when<br />
compared with the revenue and expenditure <strong>budget</strong>s established for FY 20<strong>12</strong>.<br />
Even with the ongoing challenges <strong>of</strong> the economy, employees will remain focused on<br />
implementing City Council’s strategic goals. The provision <strong>of</strong> exceptional <strong>city</strong> services will<br />
continue as will collaborative, innovative efforts to:<br />
• Strengthen neighborhoods,<br />
• Ensure Glendale is a safe community,<br />
• Retain and attract quality economic development opportunities,<br />
• Foster sustainable downtown development, and<br />
• Continue the dedicated partnership with Luke Air Force Base.<br />
It is important to thank employees for their active participation in and valuable contributions to<br />
the development <strong>of</strong> the FY 20<strong>12</strong> <strong>budget</strong>. As a service organization focused on providing<br />
exceptional services to the community, the employees remain the <strong>city</strong>’s most critical resource.<br />
In closing, I believe the FY 20<strong>12</strong> <strong>budget</strong> is a plan that provides resources to maintain core <strong>city</strong><br />
services while moving forward with strategies that ensure a positive, sustainable future.<br />
I continue to be confident that the Mayor and Council’s vision will ensure an outstanding quality<br />
<strong>of</strong> life for the Glendale community and further enhance our position as a world-class destination<br />
<strong>city</strong>.<br />
Sincerely,<br />
Ed Beasley<br />
City Manager<br />
27<br />
Return to TOC
BUDGET SUMMARIES<br />
FY <strong>2011</strong>-<strong>12</strong><br />
CITY OF GLENDALE, AZ<br />
PRELIMINARY<br />
ANNUAL BUDGET<br />
BOOK
BUDGET SUMMARY<br />
Budget Summary<br />
BUDGET SUMMARY<br />
The <strong>annual</strong> <strong>budget</strong> for the City <strong>of</strong> Glendale is divided into four major components that include all<br />
appropriations for the <strong>city</strong> and are explained below. The operating <strong>budget</strong> finances the day-today<br />
provision <strong>of</strong> <strong>city</strong> services and totals $361.9 million. The capital improvement <strong>budget</strong> funds<br />
the construction <strong>of</strong> <strong>city</strong> facilities, such as police/fire stations and libraries, in addition to the<br />
construction <strong>of</strong> roads, public amenities and other infrastructure throughout the <strong>city</strong>. This year the<br />
capital improvement <strong>budget</strong> totals $144.2 million. The debt service <strong>budget</strong> is used to repay<br />
money borrowed by the <strong>city</strong>, primarily for capital improvements, and amounts to $85.1 million.<br />
The final component <strong>of</strong> the <strong>budget</strong> is the contingency appropriation at $46.8 million. This<br />
appropriation is made up <strong>of</strong> fund reserves and is available to cover emergency expenses, revenue<br />
shortages or capital project acceleration should they arise during the fiscal year.<br />
The total <strong>budget</strong>, including all four components, is $638 million for Fiscal Year (FY) 20<strong>12</strong>. This<br />
represents a decrease <strong>of</strong> 5.6% from the FY <strong>2011</strong> total <strong>budget</strong> <strong>of</strong> $676 million. The decrease is<br />
the result <strong>of</strong> capital <strong>budget</strong> reductions that were implemented to address reduced revenue sources<br />
because <strong>of</strong> the recession.<br />
As you can see from the graph below, the operating (56.8%) and capital (22.6%) appropriations<br />
are the largest components <strong>of</strong> the FY 20<strong>12</strong> <strong>budget</strong> and account for 79.4% <strong>of</strong> the total<br />
appropriations. Both are discussed on the following pages.<br />
City <strong>of</strong> Glendale<br />
Total FY 20<strong>12</strong> Appropriations<br />
Operating<br />
56.8%<br />
Contingency<br />
7.3%<br />
Debt Service<br />
13.3%<br />
Capital<br />
22.6%<br />
28<br />
Return to TOC
BUDGET SUMMARY<br />
Budget Summary<br />
A summary <strong>of</strong> the <strong>city</strong>’s major revenues and expenditures, including other financing sources and<br />
uses, provides an overview <strong>of</strong> the total resources <strong>budget</strong>ed by the organization. This summary is<br />
located in the Schedules section <strong>of</strong> this <strong>book</strong> and is titled Schedule One by Category.<br />
Operating Budget<br />
The development <strong>of</strong> Glendale’s FY 20<strong>12</strong> <strong>budget</strong> was an open process designed to reflect the<br />
needs and desires <strong>of</strong> the community. Throughout the year, the Mayor, City Council and <strong>city</strong><br />
staff obtained input from the community through neighborhood meetings, citizen boards and<br />
commissions, surveys and other contacts with individuals and groups. The feedback from<br />
Glendale citizens received last year regarding proposed operating <strong>budget</strong> reductions via the <strong>city</strong><br />
web-site, telephone hotline and public meetings in three locations was used again in developing<br />
the FY 20<strong>12</strong> operating <strong>budget</strong>.<br />
During the fall <strong>of</strong> 2010, staff updated the <strong>city</strong>’s Five-Year Financial Forecast. The forecast<br />
allows various <strong>budget</strong> scenarios to be tested for their effect on the <strong>city</strong>’s financial condition on a<br />
long-range basis. At the same time, the <strong>city</strong>’s CIP Management Team began the process <strong>of</strong><br />
updating the Ten-Year Capital Improvement Plan. In December, City Council conducted a<br />
goals-setting retreat to update its strategic goals and key objectives. City Council’s strategic<br />
goals did not change from the previous year.<br />
In December, the Management and Budget Department kicked <strong>of</strong>f the <strong>budget</strong> input process for<br />
FY 20<strong>12</strong>. This meeting provided an assessment <strong>of</strong> current economic trends, the revenue outlook<br />
for the upcoming fiscal year and the <strong>city</strong> manager’s direction for the development <strong>of</strong> a balanced<br />
<strong>budget</strong>.<br />
The principal issue to address in developing the FY 20<strong>12</strong> <strong>budget</strong> was the economy and the impact<br />
it was having on the <strong>city</strong>’s resources to fund services to the community. FY 20<strong>12</strong> represents the<br />
fourth straight year that revenue resources have shrunk for the General Fund while demand for<br />
<strong>city</strong> services has remained steady or increased in some areas (e.g., code compliance). While <strong>city</strong><br />
sales tax revenues have stabilized and are projected to have a modest increase, state shared<br />
revenues dropped again and Glendale’s percentage share <strong>of</strong> those revenues also was reduced<br />
based upon the latest census figures.<br />
As part <strong>of</strong> the FY 20<strong>12</strong> <strong>budget</strong> development process, departments proposed reductions to their<br />
ongoing General Fund base operating <strong>budget</strong>s for non-salary related items. All departments<br />
participated and the proposed reductions equaled 5% <strong>of</strong> their General Fund operating <strong>budget</strong>s.<br />
Each department head reviewed all the proposed reductions to ensure core services, particularly<br />
those related to health and safety, as defined by City Council strategic goals, would continue to<br />
be provided. For a more in-depth discussion about the reductions, see the City Manager’s<br />
Budget Message.<br />
The entire management team met in October, January and February to develop the <strong>city</strong><br />
manager’s recommended <strong>budget</strong>. City Council reviewed the <strong>city</strong> manager’s balanced <strong>budget</strong> in<br />
29<br />
Return to TOC
BUDGET SUMMARY<br />
Budget Summary<br />
two public, televised workshop sessions held on March 22 and March 29 to discuss the pertinent<br />
issues surrounding the FY 20<strong>12</strong> operating, capital and debt service <strong>budget</strong>s. The proposed<br />
<strong>budget</strong>, as revised by City Council, became the <strong>preliminary</strong> <strong>budget</strong>. It was published and made<br />
available for further public review prior to the public hearing and formal adoption <strong>of</strong> the final<br />
<strong>budget</strong> on June 14, <strong>2011</strong>. See the Budget Calendar for more details about the timing <strong>of</strong> various<br />
steps in the <strong>budget</strong> development and adoption process.<br />
Capital Improvement Plan Budget<br />
The <strong>city</strong> <strong>annual</strong>ly updates the Ten-Year Capital Improvement Plan (CIP), which is now based on<br />
FY 20<strong>12</strong> through FY 2021 and includes over $1.2 billion in projects. The first year <strong>of</strong> the plan is<br />
the only year appropriated by Council. The remaining nine years are for planning purposes and<br />
funding is not guaranteed to occur in the year planned. The final decision to fund a project is<br />
made by City Council. Projects include renovations to <strong>city</strong> buildings, street improvements<br />
including pavement preservation, police/fire department communications enhancements and<br />
upgrades to water treatment and wastewater collection facilities.<br />
The CIP Management Team includes staff from the Engineering, Management and Budget, Field<br />
Operations and Finance Departments. This team reviewed all CIP projects for their construction<br />
costs and their projected impact on the operating <strong>budget</strong>. Projects with high operating costs may<br />
be deferred to ensure the <strong>city</strong> can absorb the operating impact once the facility opens. For FY<br />
20<strong>12</strong>, $144.2 million in capital investments is planned (figures are rounded):<br />
Table 1: Capital Improvements<br />
(All Dollars in Millions)<br />
Fund Name (Number) FY 20<strong>12</strong><br />
Water and Sewer (2360) $53.2<br />
Transportation Capital Project (2210) $39.5<br />
Airport Capital Grants (2<strong>12</strong>0) $17.4<br />
Flood Control Construction (2180) $10.3<br />
Transportation Grants (1650) $5.5<br />
Streets Constr. - 1999 Auth (1980) $3.1<br />
Grants (1840) $2.8<br />
Public Safety Construction (2040) $2.4<br />
Sanitation (2480) $1.9<br />
Economic Dev. Constr-1999 Auth (2100) $1.7<br />
Landfill (2440) $1.7<br />
General (1000 & 1740) $1.6<br />
Gov't Facilities - 1999 Auth (2080) $1.1<br />
Arts Commission Fund (<strong>12</strong>20) $0.5<br />
All Other Projects $1.3<br />
Total CIP $144.2<br />
30<br />
Return to TOC
BUDGET SUMMARY<br />
Budget Summary<br />
Refer to the Capital Improvement Plan section for more detailed information regarding the<br />
projects included in these categories, as well as the funding sources available for each.<br />
Amending the Budget<br />
Once the City Council adopts the <strong>annual</strong> <strong>budget</strong>, total expenditures cannot exceed the final<br />
appropriation <strong>of</strong> $638 million for FY 20<strong>12</strong>. However, with City Council’s formal approval, the<br />
<strong>city</strong> can adjust the total appropriations within the funds provided that the <strong>budget</strong> remains in<br />
balance. This means that if one fund’s total appropriation is increased, then appropriations from<br />
another fund or funds must be reduced by an equal amount.<br />
Inter-fund transfers are approved by City Council as part <strong>of</strong> the normal course <strong>of</strong> <strong>city</strong> business<br />
when various council communications detailing pending construction awards, grant awards or<br />
pr<strong>of</strong>essional service agreements are presented at public meetings. Inter-fund transfers that did<br />
not come forward in a formal council communication are summarized by the Management and<br />
Budget Department and presented to City Council after the end <strong>of</strong> the fiscal year via the <strong>annual</strong><br />
clean-up ordinance.<br />
The City Charter gives the <strong>city</strong> manager the authority to approve transfers <strong>of</strong> appropriations<br />
within the same fund without City Council approval. These types <strong>of</strong> <strong>budget</strong> transfer requests are<br />
typically reviewed by the relevant operating managers and the Management and Budget<br />
Department staff before being sent to executive management for final approval. Line item<br />
changes within the same department do not require such approvals. All administrative <strong>budget</strong><br />
transfers are documented by the Management and Budget Department and tracked in the <strong>city</strong>’s<br />
computerized financial system.<br />
Fund Descriptions<br />
The City <strong>of</strong> Glendale uses fund accounting to track revenues and expenditures. Some funds,<br />
such as the Streets Fund, are required by state legislation. Others were adopted by the <strong>city</strong> to<br />
track and document revenues and expenditures related to specific operations. The <strong>city</strong> has seven<br />
main categories <strong>of</strong> funds: general, special revenue, debt service, capital, trust, enterprise and<br />
internal service. These categories are used to track the activity <strong>of</strong> 76 separate funds. For<br />
example, enterprise funds are expected to be self-supporting through revenue for the services<br />
provided. For these funds, the <strong>city</strong> charges a fee for a specific service, such as sanitation<br />
collection, just like any other business would do.<br />
General Fund Group:<br />
General (Fund 1000): The General Fund includes all sources <strong>of</strong> revenue the <strong>city</strong> receives that<br />
are not designated for a specific purpose. General Fund revenue may be used by the City<br />
Council for any legal public purpose. Most <strong>city</strong> departments receive at least some support from<br />
the General Fund. The fund balance will be used to help balance operations as the impact <strong>of</strong> the<br />
31<br />
Return to TOC
BUDGET SUMMARY<br />
Budget Summary<br />
recession continues to be felt. It was drawn down over FY 2009, FY 2010 and FY <strong>2011</strong> as a<br />
cushion to the impact <strong>of</strong> the recession on this fund’s primary revenue sources.<br />
National Events (Fund 1010): The National Events Fund was established in FY 2005 to track<br />
General Fund cash that was set aside by City Council to pay for community improvements and<br />
operations associated with the initial Fiesta Bowl, the 2007 Bowl Championship Series college<br />
football game and Super Bowl 2008. The cash reserves were augmented by the collection <strong>of</strong><br />
fees associated with these events, including parking and shuttle revenue. With the successful<br />
completion <strong>of</strong> the Super Bowl event in February 2008, the remaining fund balance was retained<br />
in the fund until FY <strong>2011</strong> when $335,000 (half) was transferred back into the General Fund. The<br />
remaining fund balance has been appropriated as contingency in FY 20<strong>12</strong>.<br />
General Services (Fund 1040) and Telephone (Fund 1100): The General Services and<br />
Telephone Funds are used to track income and expenses <strong>of</strong> the internal services provided to <strong>city</strong><br />
departments. The General Services Fund specifically covers vehicle maintenance needs and fuel<br />
purchased for <strong>city</strong> vehicles. The Telephone Fund covers expenses related to phone lines,<br />
circuits, T1 lines, VPN access, long distance, etc. City departments pay for these services on an<br />
actual usage basis. These charges go into each fund as revenues that support the cost <strong>of</strong><br />
providing the services. Both funds generally carry only a small fund balance because the rate<br />
structures are designed to recover only actual costs. Small <strong>annual</strong> surpluses may occur from time<br />
to time, but these are generally returned to <strong>city</strong> departments when rates are established for the<br />
following year. An exception to this general practice has occurred with the Telephone Fund. A<br />
fund balance has been allowed to accrue in anticipation <strong>of</strong> future upgrades and the potential for<br />
unforeseen repairs.<br />
Vehicle (Fund 1<strong>12</strong>0) and Technology Replacement (Fund 1140): These replacement funds<br />
were designed to allow the <strong>city</strong> to accumulate the money needed to replace at regular intervals<br />
the <strong>city</strong>’s fleet <strong>of</strong> cars, trucks and other rolling stock and its personal computers, servers and<br />
other technology-related equipment. Typically each department pays <strong>annual</strong>ly into each fund<br />
based on the amount <strong>of</strong> equipment in its inventory, the expected life span <strong>of</strong> the equipment in use<br />
and any residual value <strong>of</strong> the equipment. Replacement equipment is then purchased according to<br />
the established replacement schedule and paid for out <strong>of</strong> the appropriate replacement fund. Fund<br />
balances in both fluctuate from year to year according to the replacement schedules. In fact, the<br />
balances for both <strong>of</strong> these funds are expected to decline as a result <strong>of</strong> scheduled equipment<br />
replacements.<br />
To help address s<strong>of</strong>t economic conditions, the General Fund contributions to both funds were<br />
reduced to the 40% funding level for FY 20<strong>12</strong>. To account for this reduction in funding, the<br />
<strong>city</strong>’s fleet <strong>of</strong> cars was reduced, a motor pool was created, the useful lives <strong>of</strong> non-public safety<br />
General Fund equipment were extended and computers will not be replaced unless they<br />
malfunction. Enterprise Funds contributions remain at the 100% level and replacements<br />
continue to be made as scheduled for equipment in FY 20<strong>12</strong>.<br />
32<br />
Return to TOC
BUDGET SUMMARY<br />
Budget Summary<br />
Employee Groups (Fund 1190): This fund was created to track activity related to employee<br />
groups such as the Glendale’s Exceptional Municipal Staff (GEMS). GEMS plans, organizes<br />
and sponsors events such as the <strong>annual</strong> holiday employee luncheon, conducts fund raising<br />
activities for local non-pr<strong>of</strong>its and plans periodic social events to provide a setting for informal<br />
networking outside <strong>of</strong> the work environment, with the assistance <strong>of</strong> various planning committees<br />
and employee volunteers. Inflows to the fund include vending machine revenues generated by<br />
employee purchases as well as outside donations and sponsorships.<br />
Arts Commission (Fund <strong>12</strong>20): One percent (1%) <strong>of</strong> <strong>city</strong> construction projects included in the<br />
Capital Improvement Program is deposited quarterly into the municipal arts fund. The funds are<br />
used to administer the <strong>city</strong>’s public art and performing arts program. Expenditures from the fund<br />
are recommended by the Glendale Arts Commission through its <strong>annual</strong> art projects plan and are<br />
subject to approval by the <strong>city</strong> council. FY 20<strong>12</strong> revenue is projected to be $97,271 due to a<br />
planned slowdown in construction activity. However, a projected beginning fund balance <strong>of</strong><br />
$1.4 million will be used to fund operations and any capital related purchases.<br />
Court (Fund <strong>12</strong>40): The Court Fund revenue is derived from two primary sources: a security<br />
surcharge paid by persons convicted <strong>of</strong> traffic or misdemeanor <strong>of</strong>fenses in City Court, and time<br />
payment fees charged to persons who choose to pay their fines in installments. The security<br />
surcharge revenue must be used for security services and facility improvements at the City<br />
Court. The time payment fee revenue may be used for activities or costs associated with<br />
collecting fines. These revenues and any associated expenditures are tracked in this fund.<br />
Library (Fund <strong>12</strong>60): This fund is used to track revenues from <strong>book</strong> sales at our Main, Foothills<br />
and Velma Teague branches. Other library fines and fees revenue is included in the General<br />
Fund. The FY 20<strong>12</strong> projected beginning balance <strong>of</strong> $234,1<strong>12</strong> and projected revenues <strong>of</strong><br />
$156,900 will be <strong>of</strong>fset by <strong>budget</strong>ed expenditures for <strong>book</strong> purchases and some temporary/hourly<br />
labor costs made from the fund totaling $247,373.<br />
Youth Sports Complex (Fund <strong>12</strong>80): The Glendale Youth Sports Complex is adjacent to the<br />
University <strong>of</strong> Phoenix Stadium. It features five sports fields that were developed to fill a<br />
community need for additional youth facilities in the west valley. The complex also provides<br />
additional parking to the stadium. Expenditures related to the operations and maintenance <strong>of</strong> the<br />
facility is <strong>of</strong>fset primarily by a General Fund operating transfer that is supplemented by some<br />
rental revenue generated through the use <strong>of</strong> the fields.<br />
Stadium (Fund <strong>12</strong>81), Arena Event Operations (Fund <strong>12</strong>82) and Camelback Ranch Event<br />
Operations (Fund <strong>12</strong>83): These funds were created to track the <strong>city</strong>’s operational costs<br />
associated with events held at the stadium, arena and spring training venues. All public safety,<br />
transportation and marketing costs related to football, hockey, baseball, concerts, trade shows<br />
and other events held at these venues are recorded in the corresponding event operations fund.<br />
Revenue reimbursement for <strong>city</strong> services paid by the operations management company for all<br />
venues is recorded in the funds. A General Fund operating transfer is made to cover all<br />
expenditures that exceed the reimbursement received.<br />
33<br />
Return to TOC
BUDGET SUMMARY<br />
Budget Summary<br />
Civic Center (Fund 1740): The Civic Center Fund was created to track revenues and expenses<br />
for the downtown facility that contains over 33,000 square feet <strong>of</strong> meeting and event space. The<br />
Civic Center can host as many as 60,000 people at as many as 250 events including weddings,<br />
trade shows and conventions in any given fiscal year. This fund was reclassified from the<br />
special revenue category to the general fund group in FY 20<strong>12</strong> because <strong>of</strong> the level <strong>of</strong> support<br />
provided by the General Fund. A projected transfer from the General Fund <strong>of</strong> $406,517 will<br />
supplement revenues <strong>of</strong> $410,300 generated from Civic Center activities in FY 20<strong>12</strong> to cover<br />
operating and capital related expenditures.<br />
Zanjero Special Revenue (Fund 1770): This fund is used to track the revenue generated by the<br />
Zanjero development just north <strong>of</strong> Westgate on Glendale Avenue. The Zanjero development is a<br />
158-acre mixed-use project that is planned to include residential, <strong>of</strong>fice, retail and hotels. This<br />
site is anchored by Cabela's, the world’s foremost outfitter <strong>of</strong> outdoor gear. Revenues collected<br />
in the fund are transferred to the MPC debt service fund and are used to pay the debt service<br />
related to infrastructure improvements that the <strong>city</strong> completed for this development. The<br />
designated sales taxes for public safety and transportation that are generated at facilities in the<br />
Zanjero development are deposited to the appropriate designated sales tax fund.<br />
Arena Special Revenue (Fund 1780): The Arena Special Revenue Fund tracks the revenues<br />
generated from Jobing.com Arena events and the surrounding Westgate City Center. The Arena<br />
Special Revenue Fund also tracks the operating expenditures associated with the arena renewal<br />
and replacement agreement that helps ensure the arena stays modernized. Revenue collected in<br />
the fund includes Phoenix Coyote team fees, parking fees and sales taxes. There is a transfer<br />
from this fund to the MPC debt service fund to pay the debt service related to the construction<br />
costs associated with the arena. The designated sales taxes for public safety and transportation<br />
that are generated at the Arena and Westgate City Center are deposited to the appropriate<br />
designated sales tax fund.<br />
Westgate City Center opened in November 2006 and already includes 2.8 million square feet <strong>of</strong><br />
retail, lodging, restaurants, entertainment and <strong>of</strong>fice uses. Jobing.com Arena is home to the<br />
National Hockey League’s Phoenix Coyotes and also serves as a first-class venue for concerts,<br />
trade shows and other events.<br />
Stadium City Sales Tax - AZSTA (Fund 1790): This fund was created to track specific<br />
University <strong>of</strong> Phoenix Stadium revenues that are refunded to the Arizona Sports and Tourism<br />
Authority (AZSTA) in accordance with signed development, construction and operating<br />
agreements. All revenues collected in this clearing house type fund are subsequently disbursed<br />
to the AZSTA. The designated sales taxes for public safety and transportation that are generated<br />
at the University <strong>of</strong> Phoenix stadium are deposited to the appropriate designated sales tax fund.<br />
Marketing Self-Sustaining (Fund 1870): This fund tracks the collection and use <strong>of</strong> revenues<br />
related to special events put on by the <strong>city</strong>’s Marketing Department. Examples include vendor<br />
rental fees and <strong>city</strong> costs for downtown special events such as the J<strong>az</strong>z N’ Blues Festival,<br />
Glendale Glitters and the Chocolate Affaire. Although the Marketing Department receives<br />
34<br />
Return to TOC
BUDGET SUMMARY<br />
Budget Summary<br />
contributions from sponsors and collects fees from vendors for these special events, it also is<br />
scheduled to receive a transfer <strong>of</strong> $320,145 from the General Fund to support FY 20<strong>12</strong> special<br />
events.<br />
Public Safety Training Center (Fund 2530): All revenues and expenditures associated with<br />
the Glendale Regional Public Safety Training Center are tracked in this fund. The facility was<br />
built with capital contributions from the City <strong>of</strong> Glendale (74.8%), Maricopa County Community<br />
College District (8.2%), City <strong>of</strong> Surprise (6.6%), City <strong>of</strong> Peoria (6.5%), City <strong>of</strong> Avondale (3.9%)<br />
and the federal government. The training center provides fire and police departments with the<br />
tools required to train new firefighters and conduct continuing education and training for fire and<br />
police personnel. Facility management operating costs are shared proportionately with the police<br />
and fire partners based upon the initial capital contribution. In addition, direct operating costs<br />
incurred by the Police and Fire Departments are shared with the partners <strong>of</strong> those respective<br />
disciplines/departments.<br />
Glendale Health Center (Fund 2538): The Glendale Health Center is located within the<br />
Glendale Regional Public Safety Training Center. The center is staffed by contractual medical<br />
pr<strong>of</strong>essionals and is fully equipped with the testing equipment, exam rooms, x-ray machines, and<br />
other medical equipment required to perform public safety personnel physical examinations on a<br />
fee-for-service basis. The onsite contractual staff is required to perform medical examinations,<br />
bill and collect for all services rendered at the center, and remit negotiated fees for each medical<br />
examination performed to the City <strong>of</strong> Glendale and the Glendale Health Center.<br />
Revenues and associated operating expenses are tracked in this fund. Although the center will<br />
derive a large portion <strong>of</strong> its business from existing Glendale Regional Public Safety Training<br />
Center partners, it is also open to outside organizations that are in need <strong>of</strong> the more extensive<br />
testing requirements associated with public safety personnel physical examinations. FY 20<strong>12</strong><br />
projected revenues totaling $69,388 will be <strong>of</strong>fset by operating expenditures <strong>of</strong> $54,000. Any<br />
excess revenues at year end will remain in fund balance and can be used to <strong>of</strong>fset future costs<br />
associated with the repair and replacement <strong>of</strong> medical equipment.<br />
Special Revenue Fund Group:<br />
Streets (Fund 1340): The Streets Fund is used to track Highway User Revenue Fund (HURF)<br />
monies that the State <strong>of</strong> Arizona distributes to cities, towns and counties. This revenue source is<br />
commonly referred to as the gasoline tax although there are several additional transportationrelated<br />
fees that comprise this revenue, including a portion <strong>of</strong> vehicle license taxes. Overall,<br />
much <strong>of</strong> this revenue source is based on the volume <strong>of</strong> fuel sold rather than the price <strong>of</strong> fuel.<br />
There is a state constitutional restriction on the use <strong>of</strong> HURF revenues; they must be used solely<br />
for street and highway purposes such as maintenance, repair, reconstruction and roadside<br />
development. In Glendale, the Streets Fund supports street cleaning and maintenance, traffic<br />
signs and signals, street lighting and other street-related activities. Any remaining fund balance<br />
35<br />
Return to TOC
BUDGET SUMMARY<br />
Budget Summary<br />
is appropriated as contingency appropriation that can be used only as directed by Council during<br />
the fiscal year.<br />
Local Transportation Assistance (Fund 1640): The Local Transportation Assistance Fund<br />
(LTAF) is used to receive state lottery funds distributed to the cities based on population. These<br />
funds must be used for transportation purposes including transit programs. Glendale transfers<br />
100% <strong>of</strong> its LTAF funds into the Transportation Sales Tax Fund.<br />
The state legislature suspended LTAF distributions to cities and towns again in FY 20<strong>12</strong> in an<br />
effort to balance the state’s <strong>budget</strong>. Therefore, revenue collections normally recorded in this<br />
fund will be suspended until FY 2013.<br />
Transportation Sales Tax (Fund 1660): The Transportation Sales Tax Fund supports<br />
transportation services in Glendale. The fund is primarily supported by designated sales tax<br />
revenue received from Proposition 402 (0.5%). In 2001 Glendale voters approved a one-half<br />
cent adjustment to the <strong>city</strong> sales tax rate to fund a comprehensive package <strong>of</strong> transportation<br />
projects including expansion <strong>of</strong> public transit service, intersection improvements to reduce<br />
congestion and other street-related services. 100% <strong>of</strong> the revenues and operating expenditures<br />
are accounted for in this fund. A separate Transportation Construction Fund exists to track<br />
transportation related capital expenditures that are paid for by the designated sales tax.<br />
Typically, the <strong>city</strong> will issue revenue bonds to fund transportation capital projects and deposit the<br />
bond proceeds into the Transportation Construction Fund. Debt service payments are then<br />
funded with the revenues collected in the Transportation Fund. Each year the Transportation<br />
Fund transfers cash into the Transportation Debt Service Fund to cover debt payments.<br />
Transfers also can be made from the Transportation Fund to the Transportation Construction<br />
Fund to fund capital project construction on a cash basis.<br />
Police (Fund 1700) and Fire Special Revenue (Fund 1720): In 1994, Glendale voters passed a<br />
citizens’ initiative that increased the local sales tax by 0.1% to add police and fire personnel and<br />
related equipment. In September 2007, Glendale voters passed a separate initiative that<br />
increased the local sales tax by another 0.4%, bringing the total public safety tax rate to 0.5%,<br />
effective November 1, 2007. Both taxes specified that two-thirds <strong>of</strong> the revenue would go to<br />
police operations and one-third to fire operations. The original tax (0.1%) included all grocery<br />
related food sales but the new tax (0.4%) excludes all grocery related food sales. Both taxes<br />
specifically prohibit supplanting existing general fund <strong>budget</strong>s with the sales tax revenue.<br />
The number <strong>of</strong> authorized positions within the designated sales taxes increased from 42 to 118<br />
for the Police Department, and from 22 to 51 for the Fire Department since the tax rate<br />
adjustment became effective on November 1, 2007. The designated sales tax also covers the<br />
associated vehicles, equipment and supplies needed to outfit the additional staffing. The Police<br />
and Fire Revenue Funds are used to track these revenues and expenditures to ensure compliance<br />
with all rules and regulations outlined in the ordinance.<br />
36<br />
Return to TOC
BUDGET SUMMARY<br />
Budget Summary<br />
During the course <strong>of</strong> FY 20<strong>12</strong>, the balances for these funds are expected to decline to<br />
accommodate planned expenses. Even so, the Police Special Revenue Fund is expected to retain<br />
year-end balances equal to approximately 20% <strong>of</strong> the current year’s projected revenues, and the<br />
Fire Special Revenue Fund will retain approximately 8%, which in total exceed the 10% fund<br />
balance minimums set per the <strong>city</strong>’s financial policies.<br />
Airport Operating (Fund 1760): This fund was established to track the operating revenues and<br />
expenses <strong>of</strong> the Glendale Municipal Airport. The long-range goal for the airport is to become a<br />
self-sustaining operation, at which time the Airport Fund will become an enterprise fund. The<br />
airport has already attracted more commercial business traffic with the development <strong>of</strong> Westgate,<br />
the Jobing.com Arena, University <strong>of</strong> Phoenix Stadium and Camelback Ranch (spring training<br />
baseball facility). The Airport Fund is projected to receive a General Fund transfer <strong>of</strong> $60,835 to<br />
augment projected revenue collections <strong>of</strong> $466,491 in FY 20<strong>12</strong>.<br />
Grant Funds: The <strong>city</strong> created a number <strong>of</strong> individual funds to track grants received from<br />
various federal, state and county sources. Individual funds allow the <strong>city</strong> to comply with the<br />
specific financial and reporting requirements <strong>of</strong> each grantor agency. Separate funds are used to<br />
track revenues received from the federal government and any associated expenditures with the<br />
HOME Grant (Fund 1300), Neighborhood Stabilization Program (Fund 1310), Neighborhood<br />
Stabilization Program III (Fund 1311), Community Development Block Grant (Fund 1320) and<br />
Emergency Shelter Grant (Fund 1830).<br />
Another fund tracks the Community Action Program (Fund 1820) grant funds received from<br />
Maricopa County. A Transportation Grant (Fund 1650) fund is used to track grant activity for<br />
projects covered by the Glendale Onboard transportation program and a fund titled Airport<br />
Capital Grants (Fund 2<strong>12</strong>0) is used for any grant related project involving the <strong>city</strong> airport. The<br />
three-year federal stimulus grants that were started in FY 2010 are tracked within a fund titled<br />
ARRA (American Recovery and Reform Act) Stimulus Grants (Fund 1842).<br />
Most other grants are tracked through the Other State and Local Grants Fund (Fund 1840).<br />
These grant funds come in on a reimbursement basis, so these funds typically do not carry a fund<br />
balance from year to year unless a specified grant award is expended over multiple fiscal years.<br />
RICO (Fund 1860): Federal anti-racketeering laws permit law enforcement agencies to seize<br />
and sell property and proceeds acquired by individuals as a result <strong>of</strong> their involvement in certain<br />
types <strong>of</strong> criminal activities such as the sale <strong>of</strong> illegal drugs. The <strong>city</strong>’s RICO Fund tracks the<br />
revenue generated from such seizures as governed by the Racketeer Influenced and Corrupt<br />
Organizations Act. Expenditures backed by this revenue source must be made for purposes that<br />
improve public safety or crime prevention programs and cannot be used to supplant existing<br />
funding for law enforcement purposes.<br />
Parks & Recreation Self-Sustaining (Fund 1880): This fund tracks the collection and use <strong>of</strong><br />
revenues related to self-sustaining programs administered by the Parks & Recreation Department<br />
37<br />
Return to TOC
BUDGET SUMMARY<br />
Budget Summary<br />
for sports, aquatics and special interest type classes for which fees are charged. In FY 20<strong>12</strong><br />
projected revenues <strong>of</strong> $1,078,360 will be <strong>of</strong>fset by projected expenditures totaling $1,073,201.<br />
Parks & Recreation Designated (Fund 1885): The Parks and Recreation Department has<br />
agreements with several local school districts to cover the maintenance <strong>of</strong> <strong>city</strong> pools located on<br />
school property and jointly owned <strong>city</strong>/school district parks. The school districts and the <strong>city</strong><br />
make payments into the fund to cover major maintenance and restoration costs. The fund<br />
balance is projected to decrease from $342,433 to $166,582 in FY 20<strong>12</strong> as a result <strong>of</strong> planned<br />
expenditures related to designated facilities. This fund also includes a separate division used to<br />
track the costs associated with the maintenance <strong>of</strong> the Elsie McCarthy Park in accordance with a<br />
generous donation made by a private party and designated for this purpose only.<br />
Debt Service Fund Group:<br />
Bond financing is the primary source used to finance long-term capital projects and<br />
infrastructure. The City’s debt management plan is an important tool for one <strong>of</strong> the main<br />
financing sources <strong>of</strong> the CIP. Outstanding debt, debt limitations, voter authorization and cash<br />
flow projections are reviewed as part <strong>of</strong> the capital <strong>budget</strong>ing process, while the <strong>annual</strong> debt<br />
service payments are incorporated into the debt service <strong>budget</strong>. Depending on the need and the<br />
type <strong>of</strong> project being financed, several different types <strong>of</strong> bonds are available to the City.<br />
Separate funds are used to track payments made on the <strong>city</strong>’s outstanding debt obligations. Each<br />
type <strong>of</strong> debt (General Obligation, Revenue Bonds and Municipal Property Corporation) is<br />
tracked separately. Fund balances fluctuate according to established debt payment schedules.<br />
The <strong>city</strong>’s debt policies and long-range debt management plans are described in detail in the<br />
Capital Improvement Plan section <strong>of</strong> this document and the associated debt schedules that show<br />
the principal and interest payments by year are included in the Schedules section.<br />
General Obligation (G.O.) Bond Debt (Fund 1900): G.O. bonds require voter authorization<br />
and are backed by the taxing authority <strong>of</strong> the City. These bonds finance projects that City<br />
Council select as part <strong>of</strong> the <strong>budget</strong> process every year. Arizona law limits the amount <strong>of</strong> G.O.<br />
bonds the City can have outstanding based on the secondary assessed valuation <strong>of</strong> both<br />
commercial and residential property located within the <strong>city</strong> limits. Financing for the following<br />
types <strong>of</strong> projects are limited to 20% <strong>of</strong> the <strong>city</strong>’s secondary assessed valuation: parks and<br />
recreation, open space and trails, flood control, water and sewer, streets and transportation, and<br />
public safety. Financing for general government, economic development, libraries and cultural<br />
and historic projects is limited to 6% <strong>of</strong> the secondary assessed valuation. Secondary property<br />
tax revenue is recorded directly into this fund and used to pay G.O. bond debt.<br />
The balance in this fund has grown over time as the timing <strong>of</strong> bond issuances and the<br />
commencement <strong>of</strong> capital construction occurred later than originally planned. This fund balance<br />
will be used to address the shortfall between the revenue generated from the secondary property<br />
tax rate and the <strong>annual</strong> debt service requirements for the next 5 fiscal years. Staff will be<br />
38<br />
Return to TOC
BUDGET SUMMARY<br />
Budget Summary<br />
reviewing secondary property tax options with Council in the fall in order to ensure that future<br />
tax rates are set in accordance with required debt service obligations. See the Capital<br />
Improvement Plan section for a more in-depth discussion.<br />
Public Facilities Corp (PFC) Bond Debt (Fund 1930): The PFC is a non-pr<strong>of</strong>it corporation<br />
organized under the laws <strong>of</strong> the State <strong>of</strong> Arizona to assist the City to finance, construct and equip<br />
the Camelback Ranch spring training baseball facility. City Council retains oversight and must<br />
approve all PFC debt upon recommendation from the PFC’s Board <strong>of</strong> Directors, which consists<br />
<strong>of</strong> four City employees and one private citizen. Although the PFC is a legally separate entity<br />
from the City, the PFC is reported as if it is part <strong>of</strong> the primary government because it sole<br />
purpose is to finance and construct public facilities for the City.<br />
The fund is new in the FY 20<strong>12</strong> <strong>budget</strong> <strong>book</strong>. Although the Camelback Ranch Facility opened in<br />
FY 2010, capitalized interest (i.e. excess bond proceeds) from the initial bond sale were used to<br />
make the initial principal and interest payments. The remaining capitalized interest will cover<br />
the majority <strong>of</strong> the FY 20<strong>12</strong> debt service payment. However, the remainder <strong>of</strong> the debt service<br />
payment, or $380,000, has been appropriated and it is funded with a transfer from the General<br />
Fund.<br />
Municipal Property Corp (MPC) Bond Debt (Fund 1940): The MPC is a non-pr<strong>of</strong>it<br />
corporation organized under the laws <strong>of</strong> the State <strong>of</strong> Arizona to assist the City in the acquisition<br />
and financing <strong>of</strong> municipal projects and facilities. MPC bonds require City Council approval but<br />
do not require voter authorization. These bonds are backed by the <strong>city</strong>’s excise taxes. For some<br />
MPC issuances, the excise tax revenue generated at the location where improvements were<br />
funded with MPC bonds is used to <strong>of</strong>fset the respective debt service payment (e.g., Jobing.com<br />
Arena and the Zanjero development). The amount <strong>of</strong> MPC bonds that can be issued is limited by<br />
the <strong>city</strong>’s ability to repay the bonds. These bonds <strong>of</strong>ten have restrictive covenants requiring a<br />
reserve <strong>of</strong> pledged revenues equal to some multiple <strong>of</strong> the maximum debt service payment on the<br />
bonds.<br />
Street (Fund 1920) and Transportation Revenue Bond Debt (Fund 1970): The<br />
Transportation Revenue Bond Debt Fund is for the payment <strong>of</strong> debt service on revenue bonds<br />
used to finance projects that are backed by the designated <strong>city</strong> sales tax for transportation. This<br />
type <strong>of</strong> bond does not require voter authorization.<br />
Highway User Revenue Fund (HURF) bonds were used for street projects that are backed by a<br />
pledge <strong>of</strong> the HURF monies the <strong>city</strong> receives from the state. Street capital projects financed with<br />
HURF monies require voter authorization. Coverage <strong>of</strong> HURF debt service with HURF monies<br />
is being phased back in for FY 20<strong>12</strong>. HURF monies will cover $1.35 million and the remaining<br />
debt service will be paid by secondary property tax revenue ($1.35 million), transportation<br />
special sales tax revenue ($1 million) and roadway development impact fee revenues ($1<br />
million). Given the uncertainty regarding how future HURF revenue will be distributed, these<br />
contributions will be monitored closely going forward.<br />
39<br />
Return to TOC
BUDGET SUMMARY<br />
Budget Summary<br />
Capital Fund Group:<br />
Construction funds account for financial resources used for the acquisition or construction <strong>of</strong><br />
major capital facilities and equipment. They are based on the type <strong>of</strong> general obligation bonds<br />
and other types <strong>of</strong> long-term financing that the <strong>city</strong> issues. Considerable detail on planned<br />
capital projects, their potential operating impacts on the General Fund, Enterprise Funds, debt<br />
policies and tax implications are included in the Capital Improvement Plan section <strong>of</strong> this<br />
document. Any remaining fund balances in the capital construction funds are appropriated to<br />
contingency to cover unanticipated project costs or the unanticipated acceleration <strong>of</strong> key<br />
projects.<br />
Development impact fees are another major source <strong>of</strong> funds used for constructing major <strong>city</strong><br />
infrastructure. These are based on the type <strong>of</strong> development impact fees the <strong>city</strong> collects from<br />
developers to address the <strong>city</strong>’s capital costs associated with accommodating growth. Separate<br />
funds are used to track the collection <strong>of</strong> fees associated with the construction <strong>of</strong> libraries, fire and<br />
police facilities, parks, roadway improvements, etc. Further information about these types <strong>of</strong><br />
funds is included in the Capital Improvement Plan section <strong>of</strong> this document.<br />
Trust Fund Group:<br />
Cemetery Perpetual (Fund 2280): The purpose <strong>of</strong> this fund is to provide future monies<br />
sufficient to pay all or a portion <strong>of</strong> the operational and maintenance expenses <strong>of</strong> the Glendale<br />
Memorial Park Cemetery when operations no longer produce revenue. All revenues from sales<br />
<strong>of</strong> lots, headstones, domes, appurtenances and services provided through the operation <strong>of</strong> the<br />
cemetery are deposited to the <strong>city</strong>’s General Fund. However, fund balance invested pursuant to<br />
the <strong>city</strong> investment policy and their related investment earnings accumulate in the perpetual care<br />
fund. Although monies may be withdrawn from the fund for cemetery expansion and<br />
improvements, none are <strong>budget</strong>ed in FY 20<strong>12</strong>. Interest income totaling $22,217 will increase the<br />
projected FY 20<strong>12</strong> ending fund balance to $5.6 million <strong>of</strong> which the entire amount is<br />
appropriated as contingency and can only be used pursuant to the perpetual care fund ordinance.<br />
Enterprise Fund Group:<br />
Water/Sewer (Funds 2360, 2380, 2400 & 2420): The Water/Sewer Enterprise Fund supports<br />
the provision <strong>of</strong> water and sewer service to Glendale residents and businesses. It is completely<br />
self-supported through water sales, sewer user fees and other related user fees. The fund<br />
receives no tax revenue and pays an <strong>annual</strong> contribution to the General Fund for administrative<br />
support services such as personnel, finance and legal services that General Fund departments<br />
provide. If the General Fund departments did not provide these services, the enterprise fund<br />
would have to contract with outside vendors to receive the services.<br />
All revenues and expenditures associated solely with providing water services to citizens and<br />
businesses in Glendale is captured in Fund 2400 (Water). All activity associated solely with<br />
providing sewer services is recorded in Fund 2420 (Sewer). Fund 2380 (Water & Sewer bond<br />
40<br />
Return to TOC
BUDGET SUMMARY<br />
Budget Summary<br />
Debt Service) is used to track activity related to revenue bond financings covering capital<br />
improvement projects. Fund 2360 (Water/Sewer) is used to capture any expenditures that are<br />
incurred on behalf <strong>of</strong> both water and sewer operations. For example, administration costs<br />
associated with providing oversight to both operations, as well as the expenses associated with<br />
the customer service division <strong>of</strong> the Finance Department, which handles the billing accounts for<br />
both water and sewer operations, is recorded in Fund 2360.<br />
The Water/Sewer Enterprise Fund balance is expected to decrease from $56.5 million to $7.9<br />
million (ending fund balance plus contingency appropriation) in FY 20<strong>12</strong> because <strong>of</strong> planned<br />
capital expenditures totaling $53.2 million and the debt service requirements associated with<br />
revenue bond funded projects totaling $27.0 million. Examples <strong>of</strong> capital projects include<br />
groundwater treatment plant improvements, water reclamation facility improvements, system<br />
security enhancements, as well as planned line replacements and extensions. A revenue <strong>budget</strong><br />
<strong>of</strong> $79.3 million helps cover the previous expenditures, in addition to the operating <strong>budget</strong> which<br />
accounts for salaries, electri<strong>city</strong>, chemical treatments, supplies, etc. totaling $47.8 million.<br />
Landfill (Fund 2440): The Landfill Enterprise Fund supports the operation <strong>of</strong> the Glendale<br />
Landfill. City departments, and all private haulers pay tipping fees (based on tonnage disposed)<br />
to use the <strong>city</strong>’s landfill. Non-<strong>city</strong> customers pay higher tipping fees. City Code requires that<br />
any excess <strong>of</strong> <strong>budget</strong>ed revenues over <strong>budget</strong>ed expenditures be reserved each year for major<br />
landfill improvements, major equipment purchases and the eventual closure costs. The <strong>city</strong>'s<br />
successful recycling program has helped to extend the life <strong>of</strong> the landfill and contribute to our<br />
community’s effort to improve the environment.<br />
Sanitation (Fund 2480): This fund supports refuse collection and disposal services to homes<br />
and businesses in the <strong>city</strong>. It is supported through monthly charges paid by sanitation customers.<br />
The divisions in the Sanitation Enterprise Fund pay the Landfill Fund to dispose <strong>of</strong> solid waste at<br />
the landfill. The fund balance is expected to decrease from about $5.9 million to $4.5 million<br />
(ending fund balance and contingency appropriation) in FY 20<strong>12</strong> as planned expenditures for<br />
large capital equipment (i.e., roll-<strong>of</strong>f trucks, front and side-load trucks, loose trash equipment,<br />
etc.) will be made using some <strong>of</strong> the fund balance.<br />
Community Housing Services (Fund 2500): The Housing Fund supports Glendale’s public<br />
housing program that is part <strong>of</strong> the Community Partnerships Department. The fund is almost<br />
entirely financed by federal housing revenue/grants but it also receives a yearly transfer from the<br />
General Fund to help cover personnel administrative expenses. The scheduled transfer for FY<br />
20<strong>12</strong> is $307,000.<br />
Internal Service Fund Group:<br />
Risk Management (Fund 2540) and Workers’ Compensation (Fund 2560): The Risk<br />
Management and Workers’ Compensation Trust Funds support the provision <strong>of</strong> liability<br />
insurance and worker’s compensation coverage for the <strong>city</strong>. Income to the funds comes from<br />
premiums charged to each <strong>city</strong> department based upon a number <strong>of</strong> factors including the number<br />
41<br />
Return to TOC
BUDGET SUMMARY<br />
Budget Summary<br />
<strong>of</strong> employees, job classifications, size <strong>of</strong> operating <strong>budget</strong>, actual claims history, etc. The funds<br />
are used to pay claims against the <strong>city</strong> and to cover premiums for certain types <strong>of</strong> outside<br />
insurance coverage.<br />
Benefits Trust (Fund 2580): The Benefits Trust Fund was created in FY 2001. An actuarial<br />
study <strong>of</strong> health insurance funding recommended the creation <strong>of</strong> a separate fund would be the best<br />
way to develop reserves to meet future cost increases for health-related insurance. During the<br />
course <strong>of</strong> the year, employer and employee contributions for medical, dental and vision<br />
insurance are deposited into this fund. Income to the fund comes from premiums charged to<br />
each <strong>city</strong> department based upon employee coverage elections made each year during open<br />
enrollment (employer portion). The fund also receives contributions from employees, both<br />
current and retired. Premium payments to insurance carriers and related claims expenses are<br />
made directly from the fund. The ending fund balance and any contingency appropriation serves<br />
as a reserve to cover incurred but not reported claims, as well as a buffer against rising health<br />
care costs.<br />
42<br />
Return to TOC
BUDGET SUMMARY<br />
Revenues<br />
REVENUES<br />
Total revenues available to the <strong>city</strong> in FY 20<strong>12</strong> from all sources are estimated at $452 million, <strong>of</strong><br />
which $131.2 million or 29.3% goes into the General Fund (GF). Table 1 shows changes<br />
expected in the revenue funds included in the table. Please note that numbers in parentheses<br />
denote a projected decrease in revenues in FY 20<strong>12</strong> from FY <strong>2011</strong>.<br />
Table 1: Total Revenues by Fund—FY <strong>2011</strong> vs. 20<strong>12</strong><br />
(All Dollars in Thousands)<br />
Fund<br />
FY <strong>2011</strong> FY 20<strong>12</strong> Change FY 11<br />
Estimate Projection to FY <strong>12</strong><br />
1000-General $143,6<strong>12</strong> $131,174 ($<strong>12</strong>,438)<br />
1040-General Services $9,087 $8,934 ($153)<br />
1100-Telephone Services $990 $904 ($86)<br />
1<strong>12</strong>0-Vehicle Replacement $2,267 $1,938 ($329)<br />
1140-PC Replacement $2,049 $1,755 ($294)<br />
<strong>12</strong>40-Court Security/Bonds $351 $351 $0<br />
<strong>12</strong>81-Stadium Event Operations $1,055 $905 ($150)<br />
<strong>12</strong>82-Arena Event Operations $274 $5,278 $5,004<br />
1340-Highway User Gas Tax $13,600 $11,416 ($2,184)<br />
1650-Transportation Grants $1,657 $6,465 $4,807<br />
1660-Transportation Sales Tax $19,214 $20,043 $828<br />
1700-Police Sales Tax $11,940 $<strong>12</strong>,262 $322<br />
1720-Fire Sales Tax $5,961 $6,<strong>12</strong>2 $161<br />
1740-Civic Center $354 $410 $56<br />
1770-Zanjero Special Revenue $1,249 $1,283 $34<br />
1780-Arena Special Revenue $4,521 $8,502 $3,982<br />
1790-Stadium City Sales Tax - AZSTA $1,700 $1,746 $46<br />
2360-Water and Sewer $104,500 $79,323 ($25,177)<br />
2440-Landfill $8,333 $8,253 ($80)<br />
2480-Sanitation $15,104 $15,068 ($36)<br />
2500-Pub Housing Budget Activities $13,108 $13,243 $135<br />
2540-Risk Management Self Insurance $2,540 $2,543 $3<br />
2560-Workers Comp. Self Insurance $1,015 $1,018 $3<br />
2580-Benefits Trust Fund $21,897 $21,896 ($1)<br />
Total Operating $386,378 $360,831 ($25,547)<br />
Capital and Other Revenue $56,434 $91,218 $34,784<br />
Grand Total $442,8<strong>12</strong> $452,049 $9,237<br />
43<br />
Return to TOC
BUDGET SUMMARY<br />
Revenues<br />
General Fund Group<br />
General Fund (Fund 1000): Total resources available in FY 20<strong>12</strong> to support GF services<br />
include the estimated beginning fund balance <strong>of</strong> $24.9 million and revenues <strong>of</strong> $131.2 million.<br />
The <strong>city</strong> expects to collect $143.6 million in total GF revenue in FY <strong>2011</strong>. Of that amount, $<strong>12</strong>.6<br />
million is one-time revenue as a result <strong>of</strong> the amended parking agreement for the mixed use<br />
development in the sports and entertainment district that City Council approved in January <strong>2011</strong>.<br />
Excluding this onetime revenue, total general fund collections for FY <strong>2011</strong> is estimated to be<br />
$131 million, relatively flat compared the FY 20<strong>12</strong> projected revenue.<br />
The average <strong>annual</strong> growth rate for total ongoing GF revenue was a robust 8% between FY 2002<br />
and FY 2008. This rate was the result <strong>of</strong> very strong growth in <strong>city</strong> sales tax and state income<br />
tax receipts, with more moderate growth in state sales tax, motor vehicle in lieu fees, and<br />
development-related permits and fees. The phenomenal growth Glendale experienced through<br />
FY 2008 was the direct result <strong>of</strong> Council’s strategic goal <strong>of</strong> one community with quality<br />
economic development. The healthy growth meant the <strong>city</strong> could support and maintain superior<br />
<strong>city</strong> services and contributed to a high quality <strong>of</strong> life for the Glendale community.<br />
From FY 2008 through the end <strong>of</strong> FY <strong>2011</strong>, total GF revenue is expected to experience a decline<br />
<strong>of</strong> almost $40 million or 22%, a clear reflection <strong>of</strong> the economic challenges brought on by the<br />
recession. A return to healthy growth is expected to occur over several years because Arizona<br />
was hit particularly hard by the economic downturn. Factors contributing to a long and gradual<br />
recovery include constrained job growth, weak personal income growth, weak consumer<br />
confidence and a weak real estate market.<br />
The two major sources <strong>of</strong> revenue for the GF continue to be <strong>city</strong> sales taxes and state-shared<br />
revenues. They have comprised between two-thirds and three-fourths <strong>of</strong> the GF revenue since<br />
FY 2002 and are expected to continue to do so for FY 20<strong>12</strong>.<br />
The <strong>city</strong>’s GF revenue projection is based on many factors including the following:<br />
• historic trend data;<br />
• projected changes in state and local population, disposable personal income, retail sales<br />
and inflation;<br />
• economic forecasts <strong>of</strong> state and local economic activity provided by experts on the<br />
Arizona economy;<br />
• economic forecasts <strong>of</strong> overall national economic activity; and<br />
• statistical analyses.<br />
44<br />
Return to TOC
BUDGET SUMMARY<br />
Revenues<br />
Sales Tax<br />
41%<br />
Summary <strong>of</strong> General Fund<br />
Revenue<br />
(Excludes Street Funds)<br />
Development Fees<br />
2%<br />
Property Tax<br />
2%<br />
Miscellaneous<br />
11%<br />
Court/Lic./Fees<br />
6%<br />
Franchise Fees<br />
4%<br />
State Shared<br />
34%<br />
City Sales Tax: City sales tax represents 40.7% <strong>of</strong> the GF revenue sources and is Glendale’s<br />
largest source <strong>of</strong> revenue for FY 20<strong>12</strong>. The majority <strong>of</strong> sales tax revenues are derived from retail<br />
businesses (approximately 51% <strong>of</strong> total <strong>city</strong> sales tax collections). Other major classes <strong>of</strong> sales<br />
tax activity include transportation, communications and utilities, rental businesses and<br />
restaurants and bars. The GF receives 1.2%<br />
Thousands<br />
City Sales Tax<br />
10-Year Fiscal History<br />
<strong>of</strong> the <strong>city</strong>’s 2.2% sales tax with the<br />
remaining 1.0% designated for public safety<br />
(0.5%) and transportation (0.5%).<br />
$70,000<br />
$60,000<br />
$50,000<br />
$40,000<br />
$30,000<br />
$20,000<br />
$10,000<br />
The <strong>city</strong> collected $63.3 million in <strong>city</strong> sales<br />
tax revenue in FY 2007, the highest level <strong>of</strong><br />
receipts over a ten-year period. In FY 2008,<br />
collections began declining with rapid<br />
deterioration occuring over the summer and<br />
fall <strong>of</strong> 2008. Since FY 2009, <strong>city</strong> sales tax<br />
receipts have leveled <strong>of</strong>f at the $50 million<br />
level, which was last experienced in FY 2004.<br />
$0<br />
The estimate for FY <strong>2011</strong> is $50.5 million, or<br />
'03 '04 '05 '06 '07 '08 '09 '10 '11 '<strong>12</strong><br />
almost even with the FY 2010 actuals. This<br />
conservative estimate is based on the<br />
assumption that the economy is still relatively weak due to the volatility <strong>of</strong> gas prices and other<br />
45<br />
Return to TOC
BUDGET SUMMARY<br />
Revenues<br />
essential commodities that tend to lower consumer spending in other areas. The FY 20<strong>12</strong><br />
projection is $53.4 million and includes $1.5 million in anticipated revenue from a canvass <strong>of</strong><br />
<strong>city</strong> businesses. After excluding the $1.5 million expected from the canvass, the FY 20<strong>12</strong><br />
projection is $51.9 million and represents a modest 2.7% increase over the FY <strong>2011</strong> estimate <strong>of</strong><br />
$50.5 million.<br />
State-Shared Revenues: State-shared revenues include state income tax, state sales tax and<br />
motor vehicle in-lieu tax. These three revenue sources are shared with all cities and towns<br />
throughout the state. The average<br />
Thousands<br />
$70,000<br />
$60,000<br />
$50,000<br />
$40,000<br />
$30,000<br />
$20,000<br />
$10,000<br />
$0<br />
State Shared Revenue<br />
10-Year Fiscal History<br />
'03 '04 '05 '06 '07 '08 '09 '10 '11 '<strong>12</strong><br />
MV In-lieu Income Sales<br />
<strong>annual</strong> growth rate for the <strong>city</strong>’s share<br />
<strong>of</strong> state shared revenue was 6%<br />
between FY 2002 and FY 2008.<br />
However, starting in FY 2009, a<br />
decline started and is expected to<br />
continue through FY 20<strong>12</strong>. FY <strong>2011</strong><br />
receipts are expected to be $49.8<br />
million and a further decline to $43.9<br />
million is expected in FY 20<strong>12</strong> as a<br />
result <strong>of</strong> the two year lag in the<br />
distribution <strong>of</strong> income tax receipts and<br />
the impact <strong>of</strong> the 2010 Census. With<br />
the FY 20<strong>12</strong> projection <strong>of</strong> $43.9<br />
million, this critical revenue source has<br />
shrunk $21.7 million or 32.9% since<br />
the peak <strong>of</strong> $66.1 million in FY 2008.<br />
The distribution <strong>of</strong> state sales and income tax revenue is based upon the relation <strong>of</strong> the <strong>city</strong>’s<br />
population to the total state population while the distribution <strong>of</strong> motor vehicle in-lieu revenue is<br />
based on the <strong>city</strong>’s population in relation to the total incorporated population <strong>of</strong> Maricopa County.<br />
Prior to the 2010 Census, Glendale was just under 5% <strong>of</strong> the state’s total population; with the<br />
2010 Census, Glendale is now about 4.5% <strong>of</strong> the state’s population. While the distribution<br />
method is proportional on a per person basis, more mature cities like Glendale typically<br />
experience a decrease in their portion <strong>of</strong> state-shared tax revenues as rapidly growing cities<br />
receive a greater share <strong>of</strong> the revenue distribution.<br />
The most significant component <strong>of</strong> state- shared revenue is income tax and it is primarily driven<br />
by personal income rather than business income as personal income tax receipts comprise about<br />
two-thirds <strong>of</strong> all Arizona income tax receipts. Income tax revenue distribution to the cities lags<br />
by two years. This means the state income tax distribution for FY 20<strong>12</strong> will reflect the income<br />
tax the state collected in FY 2010, and the state’s 2010 income tax receipts were lower than the<br />
2009 receipts. Glendale’s share <strong>of</strong> state income tax revenue is expected to decrease 18.2% or<br />
$4.3 million from $23.7 million in FY <strong>2011</strong> to $19.3 million in FY 20<strong>12</strong>. The <strong>city</strong> last had<br />
income tax receipts at the $19 million level in FY 2004.<br />
46<br />
Return to TOC
BUDGET SUMMARY<br />
Revenues<br />
State sales tax and motor vehicle in lieu revenues are distributed to cities and towns based on<br />
current year collections. State sales tax distribution is based on a formula by which varying<br />
percentages <strong>of</strong> different types <strong>of</strong> sales taxes – such as retail – are used to calculate the<br />
distribution amount. The FY <strong>2011</strong> estimate is $17.7 million and is almost even with the FY<br />
2010 actuals. This revenue also is projected to remain essentially flat for FY 20<strong>12</strong>. The <strong>city</strong> last<br />
had state sales tax receipts in the $17 million range in FY 2003.<br />
The FY 20<strong>12</strong> motor vehicle in lieu tax projection <strong>of</strong> $7.6 million is 10% less than the $8.5<br />
million estimate for FY <strong>2011</strong> and represents the lowest level in the last ten years for this revenue<br />
source. This revenue is based on fees collected for the licensing <strong>of</strong> vehicles, with the value <strong>of</strong><br />
the vehicle used as the basis for the license cost.<br />
Primary Property Tax: Arizona’s property tax system consists <strong>of</strong> two tiers. The primary<br />
property tax levy has state- mandated maximum limits, and a <strong>city</strong> can adopt a rate anywhere<br />
between $0.0000 and the rate that yield the maximum limit under state law. Primary property<br />
Thousands<br />
$4,500<br />
$4,000<br />
$3,500<br />
$3,000<br />
$2,500<br />
$2,000<br />
$1,500<br />
$1,000<br />
$500<br />
Primary Property Tax & SRP In-Lieu<br />
10-Year Fiscal History<br />
$0<br />
'03 '04 '05 '06 '07 '08 '09 '10 '11 '<strong>12</strong><br />
Property Tax<br />
SRP In-Lieu<br />
tax revenue can be used by a <strong>city</strong> for<br />
any purpose. The primary property tax<br />
revenue is included in the GF operating<br />
<strong>budget</strong>.<br />
The secondary property tax revenue can<br />
be used only to pay the principal,<br />
interest and redemption charges on<br />
bonded indebtedness or other lawful<br />
long-term obligations that are issued or<br />
incurred for a specific capital purpose.<br />
The secondary property tax revenue<br />
funds the <strong>city</strong>’s General Obligation<br />
bond portion <strong>of</strong> the <strong>city</strong>’s capital<br />
improvement plan (CIP).<br />
The <strong>city</strong> primary property tax rate will<br />
remain at $0.2252 in FY 20<strong>12</strong> although the <strong>city</strong> expects to lose more than $780,000 because <strong>of</strong> a<br />
22.6% decline in the primary assessed valuation <strong>of</strong> existing property. This drop is in addition to<br />
the 11% or about $459,000 decline from FY 2010 to FY <strong>2011</strong>.<br />
Salt River Project (SRP) in-lieu revenue represents the quasi-governmental agency’s payment in<br />
lieu <strong>of</strong> a property tax, which it is exempt from paying. This revenue source amounts to a<br />
projected $31,236 for FY 20<strong>12</strong> and represents only 1% <strong>of</strong> the primary property tax and SRP inlieu<br />
revenue grouping.<br />
Development Fees: Development-related fees include building permits, right-<strong>of</strong>-way permits,<br />
plan check fees, planning and zoning fees, engineering and traffic engineering plan check fees,<br />
fire service related development fees and miscellaneous development related fees. These sources<br />
essentially reflect a range <strong>of</strong> activities related to commercial and residential development and<br />
47<br />
Return to TOC
BUDGET SUMMARY<br />
Revenues<br />
construction. The <strong>city</strong> experienced its peak collection <strong>of</strong> development fees in FY 2008 with $6.9<br />
million in receipts. The FY 20<strong>12</strong> projection is $3 million and is flat with the FY <strong>2011</strong> estimate.<br />
For the development<br />
Thousands<br />
$7,000<br />
$6,000<br />
$5,000<br />
$4,000<br />
$3,000<br />
$2,000<br />
$1,000<br />
$0<br />
Development Fee Revenue<br />
10-Year Fiscal History<br />
Fire Dept CD Fees<br />
Traffic Eng.<br />
Engineering<br />
Rezoning<br />
Plan Check<br />
fees category, the<br />
largest revenue source<br />
in prior years was<br />
building permit fees.<br />
The same is true for<br />
FY <strong>2011</strong> and FY 20<strong>12</strong><br />
with just over $1<br />
million expected in<br />
each <strong>of</strong> the two years.<br />
The next largest<br />
source <strong>of</strong> revenue in<br />
this category was, and<br />
is expected to<br />
continue to be, plan<br />
check fees.<br />
'03 '04 '05 '06 '07 '08 '09 '10 '11 '<strong>12</strong><br />
The decline <strong>of</strong> over<br />
56% from the peak<br />
collection in FY 2008<br />
is the result <strong>of</strong> the sizeable drop <strong>of</strong>f in commercial and residential construction activity across the<br />
metropolitan Phoenix area as a result <strong>of</strong> the recession.<br />
ROW<br />
Bdg Permits<br />
Franchise Fees: Franchise<br />
fees are paid to the <strong>city</strong> by<br />
the electric, gas and cable<br />
companies operating within<br />
the <strong>city</strong>. These fees<br />
increase in response to rate<br />
increases by the various<br />
utilities and, to a lesser<br />
extent, population growth.<br />
In all cases, the fees due to<br />
the <strong>city</strong> are based on gross<br />
receipts for the franchised<br />
organization. The <strong>city</strong><br />
anticipates collecting $4.7<br />
million in franchise fees<br />
revenues in FY 20<strong>12</strong>, a<br />
modest increase <strong>of</strong><br />
$520,000 or <strong>12</strong>.5% from<br />
the FY <strong>2011</strong> estimate.<br />
Thousands<br />
$5,000<br />
$4,500<br />
$4,000<br />
$3,500<br />
$3,000<br />
$2,500<br />
$2,000<br />
$1,500<br />
$1,000<br />
$500<br />
Franchise Fee Revenue<br />
10-Year Fiscal History<br />
$0<br />
'03 '04 '05 '06 '07 '08 '09 '10 '11 '<strong>12</strong><br />
Gas/Elec.<br />
Cable<br />
48<br />
Return to TOC
BUDGET SUMMARY<br />
Revenues<br />
Thousands<br />
$7,000<br />
$6,000<br />
$5,000<br />
$4,000<br />
$3,000<br />
$2,000<br />
$1,000<br />
$0<br />
License and Fee Revenue<br />
10-Year Fiscal History<br />
'03 '04 '05 '06 '07 '08 '09 '10 '11 '<strong>12</strong><br />
Recreation<br />
License and Fee<br />
Revenues: This<br />
revenue category<br />
includes business and<br />
pr<strong>of</strong>essional licenses,<br />
business regulatory<br />
licenses, sales tax<br />
licenses, liquor licenses,<br />
recreation fees, fire<br />
department fees not<br />
related to construction<br />
development, library<br />
fines and fees, cemetery<br />
fees, and rental income<br />
from the use <strong>of</strong> <strong>city</strong><br />
facilities. Miscellaneous<br />
arena and stadium<br />
related fees were included in FY 2004 to FY 2007 and are now accounted for in a separate fund.<br />
Stadium security fee was included in FY 2007 only. As a group these sources are expected to<br />
generate $5.2 million in FY 20<strong>12</strong>. These revenues have been relatively flat since or FY 2009.<br />
Rent<br />
Bus/Pr<strong>of</strong><br />
Cemetery<br />
Library<br />
Fire<br />
Bus. Lic.<br />
Liquor<br />
Sales Tax<br />
Arena & Stad<br />
Court Revenues: The Glendale<br />
City Court collects fines for<br />
parking and traffic violations,<br />
and civil and misdemeanor<br />
criminal cases. Traffic fines<br />
represent the largest portion <strong>of</strong><br />
court revenues. The revenue<br />
generated from fines is subject<br />
to statutory changes made by<br />
the Arizona state legislature<br />
and can be affected by changes<br />
in traffic enforcement practices.<br />
Court revenue is estimated to<br />
remain flat at $3.4 million in<br />
FY 20<strong>12</strong>.<br />
Thousands<br />
$4,000<br />
$3,500<br />
$3,000<br />
$2,500<br />
$2,000<br />
$1,500<br />
$1,000<br />
$500<br />
$0<br />
Court Revenue<br />
10-Year Fiscal History<br />
'03 '04 '05 '06 '07 '08 '09 '10 '11 '<strong>12</strong><br />
Other Revenues: This revenue category includes interest earnings, staff and administrative<br />
chargebacks, capital lease proceeds (if any), sale <strong>of</strong> assets (if any) and miscellaneous revenues.<br />
The projection calls for FY 20<strong>12</strong> revenues <strong>of</strong> approximately $14.2 million, compared to $23.6<br />
million expected to be generated in FY <strong>2011</strong>. FY <strong>2011</strong> includes the $<strong>12</strong>.6 million in one-time<br />
revenue as a result <strong>of</strong> the amended parking agreement for the mixed use development in the<br />
sports and entertainment district that City Council approved in January <strong>2011</strong>.<br />
49<br />
Return to TOC
BUDGET SUMMARY<br />
Revenues<br />
Special Revenue Fund Group:<br />
Police and Fire Sales Tax (Funds 1700 and 1720): The source <strong>of</strong> revenue for these funds is<br />
the 0.5% designated sales for police and fire services. The tax was originally adopted by voters<br />
in 1994 at a 0.1% rate. In September 2007 Glendale voters approved an increase to 0.5%<br />
effective November 1, 2007.<br />
The original one-tenth rate<br />
includes food for home<br />
consumption (e.g., groceries)<br />
while the additional four-tenths<br />
rate excludes food for home<br />
consumption. Two-thirds <strong>of</strong><br />
the revenue is allocated to<br />
police and one-third to fire.<br />
Thousands<br />
$7,000<br />
$6,000<br />
$5,000<br />
$4,000<br />
Fire Special Revenue<br />
10-Year Fiscal History<br />
This revenue is subject to the<br />
same fluctuations as the general<br />
sales tax although the<br />
performance can be somewhat<br />
different because 80% <strong>of</strong> the<br />
rate excludes food for home<br />
consumption.<br />
$3,000<br />
$2,000<br />
$1,000<br />
$0<br />
'03 '04 '05 '06 '07 '08 '09 '10 '11 '<strong>12</strong><br />
The FY 20<strong>12</strong> projection is $18.4 million with $<strong>12</strong>.3 million for police and $6.1 million for fire.<br />
The FY 20<strong>12</strong> projection reflects growth <strong>of</strong> 2.7% from the FY <strong>2011</strong> estimate <strong>of</strong> $17.9 million.<br />
Thousands<br />
Police Special Revenue<br />
10-Year Fiscal History<br />
$14,000<br />
$<strong>12</strong>,000<br />
$10,000<br />
$8,000<br />
$6,000<br />
$4,000<br />
$2,000<br />
$0<br />
'03 '04 '05 '06 '07 '08 '09 '10 '11 '<strong>12</strong><br />
50<br />
Return to TOC
BUDGET SUMMARY<br />
Revenues<br />
Transportation Sales Tax (Fund 1660): The primary source <strong>of</strong> this fund’s revenue for<br />
operations is sales tax receipts from the designated transportation sales tax (0.5%) that voters<br />
approved in 2001. This dedicated sales tax funds the Glendale Onboard (GO) Transportation<br />
Program, and is expected to generate an estimated $19.3 million in FY 20<strong>12</strong> as compared to<br />
$18.5 million estimated for FY <strong>2011</strong>. This is a modest increase <strong>of</strong> $510,000 or 2.7% excluding<br />
the sales tax refund estimated in FY <strong>2011</strong>. This revenue source is dedicated to funding various<br />
transportation and transit-related projects.<br />
Other sources <strong>of</strong> FY 20<strong>12</strong> revenue within the Transportation Sales Tax Fund include $<strong>12</strong>8,000 in<br />
transit revenues, $516,432 in grant revenues and $98,137 in interest earnings. In total,<br />
transportation sales tax fund revenues are projected to be $20.0 million in FY 20<strong>12</strong> about<br />
$828,000 less than the FY<strong>2011</strong> estimated revenue. This fund is supplemented with $900,000<br />
from the General Fund, as required by the 2001 election, to help sustain the delivery <strong>of</strong><br />
transportation services.<br />
The state’s FY 20<strong>12</strong><br />
<strong>budget</strong> continues to<br />
exclude the Local<br />
Transportation<br />
Assistance Fund<br />
(LTAF) monies that<br />
the state used to<br />
distribute to local<br />
governments. The<br />
state eliminated the<br />
distribution <strong>of</strong> this<br />
revenue source with<br />
the FY <strong>2011</strong> <strong>budget</strong>.<br />
The City <strong>of</strong> Glendale<br />
had used this revenue<br />
to pay for Dial-A-<br />
Ride and fixed route<br />
bus services. A<br />
Transport. Tax<br />
71%<br />
Transportation Funding Sources<br />
Grant Funds<br />
18%<br />
General Fund<br />
3%<br />
Misc.<br />
8%<br />
combination <strong>of</strong> one-time savings, federal credits, and federal transit operations grant funds were<br />
used in FY <strong>2011</strong> and will continue to be used in FY 20<strong>12</strong> to avoid significant service cutbacks.<br />
A determination <strong>of</strong> longer-term service options will be made during FY 20<strong>12</strong> based on the<br />
availability <strong>of</strong> other funding opportunities and further route evaluations.<br />
Streets (Fund 1340): The source <strong>of</strong> this fund’s revenue is the state’s Highway User Revenue<br />
Fund (HURF). HURF is commonly called the gasoline tax although there are several additional<br />
transportation-related fees that comprise this revenue source, including a portion <strong>of</strong> vehicle<br />
license taxes. Overall, much <strong>of</strong> this revenue source is based on the volume <strong>of</strong> fuel sold rather<br />
than the price <strong>of</strong> fuel.<br />
51<br />
Return to TOC
BUDGET SUMMARY<br />
Revenues<br />
Thousands<br />
$18,000<br />
$16,000<br />
$14,000<br />
$<strong>12</strong>,000<br />
$10,000<br />
$8,000<br />
HURF Revenue<br />
10-Year Fiscal History<br />
The state distributes the revenue based on<br />
a complex distribution formula that<br />
spreads a portion <strong>of</strong> the money across the<br />
state solely on the basis <strong>of</strong> population<br />
while the remaining money flows to those<br />
areas with the highest gasoline and other<br />
fuel sales. This revenue must be<br />
accounted for separately and used only for<br />
eligible street and highway purposes.<br />
$6,000<br />
$4,000<br />
$2,000<br />
$0<br />
HURF collections are affected by the<br />
general health <strong>of</strong> the economy, as well as<br />
the vigor <strong>of</strong> specific industries such as<br />
tourism and trucking. The Arizona state<br />
'03 '04 '05 '06 '07 '08 '09 '10 '11 '<strong>12</strong><br />
legislature has made formula<br />
modifications from time to time that have<br />
affected Glendale’s share <strong>of</strong> HURF dollars. In fact, the Arizona Legislature reduced the amount<br />
<strong>of</strong> funds allocated to cities for FY 2010 and FY <strong>2011</strong> and again for FY 20<strong>12</strong>. The Streets Fund<br />
received $13.8 million in FY 2010. The <strong>city</strong> expects to collect about the same amount in<br />
revenue for FY <strong>2011</strong>. For FY 20<strong>12</strong>, Glendale’s share <strong>of</strong> HURF dollars will be reduced by $2.2<br />
million or 16.1% to $11.4 million in total revenue collection.<br />
Thousands<br />
$600<br />
$500<br />
$400<br />
$300<br />
$200<br />
$100<br />
Airport User Revenue<br />
10-Year Fiscal History<br />
Airport (Fund 1760): Airport<br />
revenues consist <strong>of</strong> user fees (1.0%),<br />
lease proceeds (76.0%), commercial<br />
activities and other fees (11%) and a<br />
transfer from the GF (<strong>12</strong>.0%).<br />
Airport user fee revenue comes from<br />
activities such as transient tie down<br />
fees and conference room fees from<br />
tenants. The majority <strong>of</strong> revenue<br />
comes from lease activities such as<br />
land rental and <strong>of</strong>fice rental.<br />
Glendale is now aggressively<br />
$0<br />
pursuing additional airport facility<br />
'03 '04 '05 '06 '07 '08 '09 '10 '11 '<strong>12</strong><br />
users with an ultimate goal <strong>of</strong> airport<br />
self-sufficiency. Sporting events as<br />
well as concerts that are being held at Jobing.com Arena and University <strong>of</strong> Phoenix Stadium<br />
continue to attract corporate jet customers and are expected to provide additional business<br />
opportunities for the airport. Revenues for FY 20<strong>12</strong> are projected to be $466,491.<br />
52<br />
Return to TOC
BUDGET SUMMARY<br />
Revenues<br />
Enterprise Fund Group<br />
Water/Sewer (Funds 2360, 2400 & 2420): In FY 20<strong>12</strong>, water sales and sewer fees will make<br />
up $77.9 million <strong>of</strong> total revenues for this fund. No bond sale is planned for FY 20<strong>12</strong>.<br />
Development impact fees (DIF) revenue is projected at $700,000 for FY 20<strong>12</strong>. Other revenue<br />
sources totaling about $876,275 include interest earnings and miscellaneous fees and charges.<br />
Overall revenues for the Water/Sewer Fund amount to $79.3 million in FY 20<strong>12</strong>.<br />
Water & Sewer Revenues<br />
Dev. Fees<br />
1%<br />
Water<br />
Revenue<br />
59%<br />
Sewer<br />
Revenue<br />
39%<br />
Other<br />
Revenue<br />
1%<br />
Thousands<br />
Water & Sewer Revenue<br />
10-Year Fiscal History<br />
$140,000<br />
$<strong>12</strong>0,000<br />
$100,000<br />
$80,000<br />
$60,000<br />
$40,000<br />
$20,000<br />
$0<br />
'03 '04 '05 '06 '07 '08 '09 '10 '11 '<strong>12</strong><br />
Sewer<br />
Water<br />
The <strong>city</strong> <strong>annual</strong>ly hires an independent consulting firm to review the utilities’ financial status and<br />
recommend rate adjustments if needed. As a result <strong>of</strong> the study undertaken during FY <strong>2011</strong>,<br />
there will not be any rate increases for FY 20<strong>12</strong>. The median single family customer rate will<br />
remain at $61.14 per month.<br />
53<br />
Return to TOC
BUDGET SUMMARY<br />
Revenues<br />
Landfill (Fund 2440): The <strong>city</strong> <strong>annual</strong>ly reviews the five-year financial plan for the Landfill<br />
Enterprise Fund. This <strong>annual</strong> evaluation takes into account operating and capital costs,<br />
equipment replacement, rate structures and service demands. Budget decisions are largely based<br />
on this long-range plan.<br />
Glendale <strong>city</strong> departments are charged an internal rate <strong>of</strong> $18.00 per ton for the use <strong>of</strong> the <strong>city</strong><br />
landfill. Glendale residents pay a tipping fee <strong>of</strong> $15.79 per ton for load weighing more than one<br />
ton in waste material. These internal and residential tipping fees are projected to generate $2.5<br />
million in revenue for the Landfill Fund in FY 20<strong>12</strong>.<br />
City Internal Tipping Fees<br />
10-Year Fiscal History<br />
External User Tipping Fees<br />
10-Year Fiscal History<br />
Thousands<br />
Thousands<br />
$4,000<br />
$4,000<br />
$3,500<br />
$3,500<br />
$3,000<br />
$3,000<br />
$2,500<br />
$2,500<br />
$2,000<br />
$2,000<br />
$1,500<br />
$1,500<br />
$1,000<br />
$1,000<br />
$500<br />
$500<br />
$0<br />
$0<br />
'03 '04 '05 '06 '07 '08 '09 '10 '11 '<strong>12</strong><br />
'03 '04 '05 '06 '07 '08 '09 '10 '11 '<strong>12</strong><br />
The tipping fees paid by private haulers, as well as businesses and individuals not located in<br />
Glendale, will continue to pay $32.25 per ton in FY20<strong>12</strong>. This tipping fee will generate $3.0<br />
million in revenue for the Landfill Fund in FY 20<strong>12</strong>. The <strong>city</strong> collected $2.8 million in FY 2010<br />
and is expected to collect $3.0 million in FY<strong>2011</strong>.<br />
Recycling<br />
22%<br />
Landfill Revenues<br />
Misc.<br />
11%<br />
Internal<br />
Charges<br />
30%<br />
External<br />
Charges<br />
37%<br />
In FY 20<strong>12</strong>, the recycling<br />
sales program is projected<br />
to bring in $1.8 million.<br />
This amount is slightly<br />
lower than the actual<br />
recycling sales revenue <strong>of</strong><br />
$1.9 million collected in<br />
FY 2010. The decline is<br />
mostly related to a decline<br />
in the amount <strong>of</strong> tonnage<br />
processed and sold at the<br />
recyclables processing<br />
facility.<br />
54<br />
Return to TOC
BUDGET SUMMARY<br />
Revenues<br />
Additional miscellaneous revenue comes from interest earnings, DIF’s, chargebacks and other<br />
fees, and accounts for $896,000. Total projected revenues for FY 20<strong>12</strong> are $8.3 million.<br />
Residential<br />
70%<br />
Sanitation Revenues<br />
Misc.<br />
3%<br />
Commercial<br />
27%<br />
Sanitation (Fund 2480): The <strong>city</strong><br />
<strong>annual</strong>ly reviews the five-year<br />
financial plan for the Sanitation<br />
Enterprise Fund. This <strong>annual</strong><br />
evaluation takes into account<br />
operating and capital costs,<br />
equipment replacement, rate<br />
structures and service demands.<br />
Budget decisions are largely based<br />
on this long-range plan. Landfill<br />
fees for the disposal <strong>of</strong> the solid<br />
waste collected from residences and<br />
businesses represent a significant<br />
part <strong>of</strong> the expenses incurred by the<br />
sanitation enterprise operation.<br />
Consequently, adjustments to landfill rates have a major impact on sanitation rates.<br />
Glendale’s residential sanitation rate for FY <strong>2011</strong> is $16.30 and includes weekly trash and<br />
recycling collection as well as monthly loose trash collection. The last rate change occurred in<br />
January 2005. Due to a healthy fund balance maintained by the fund and significantly lower<br />
equipment repair and replacement costs, the sanitation rate for FY20<strong>12</strong> will remain at $16.30.<br />
The FY 20<strong>12</strong> revenues <strong>of</strong> $14.6 million come primarily from two sources: residential collection<br />
fees, projected at $10.5 million, and commercial collection fees, projected at $4.1 million. The<br />
residential and commercial collection programs account for 97% <strong>of</strong> the sanitation revenues.<br />
Thousands<br />
$<strong>12</strong>,000<br />
$10,000<br />
$8,000<br />
$6,000<br />
$4,000<br />
$2,000<br />
$0<br />
Residential Sanitation Fees<br />
10-Year Fiscal History<br />
'03 '04 '05 '06 '07 '08 '09 '10 '11 '<strong>12</strong><br />
Valley Sanitation Rates<br />
(Based on FY 2010 Published Rates)<br />
$30.00<br />
$25.00<br />
$20.00<br />
$15.00<br />
$10.00<br />
$5.00<br />
$0.00<br />
Peoria<br />
Chandler<br />
Scottsdale<br />
Glendale<br />
Gilbert<br />
Tempe<br />
Avondale<br />
Mesa<br />
Phoenix<br />
55<br />
Return to TOC
BUDGET SUMMARY<br />
Expenditures<br />
The FY 20<strong>12</strong> Operating Budget<br />
EXPENDITURES<br />
The FY 20<strong>12</strong> operating <strong>budget</strong> totals $362.1 million, which is an increase <strong>of</strong> 6.7% ($22.6<br />
million) from the FY <strong>2011</strong> <strong>budget</strong> <strong>of</strong> $339.5 million. It is important to note that the FY 20<strong>12</strong><br />
general fund group included operating <strong>budget</strong> decreases totaling $7.1 million that were <strong>of</strong>fset by<br />
the addition <strong>of</strong> a $20 million arena management fee that is new for FY 20<strong>12</strong>. The special<br />
revenue fund group will increase $7.3 million due to federal and state related grant appropriation<br />
increases pertaining to the new Neighborhood Stabilization Program III funding, as well as<br />
additional planned spending within the Police Sales Tax and RICO funds. The Public Housing<br />
<strong>budget</strong> will increase by $4.1 million within the enterprise group due to additional state funding<br />
being provided for community housing services. A comparison <strong>of</strong> the operating <strong>budget</strong> fund<br />
group changes from FY <strong>2011</strong> to FY 20<strong>12</strong> appears below.<br />
$200,000<br />
$150,000<br />
Operating Budgets by Fund Group<br />
($'s in Thousands)<br />
$170,960<br />
$158,038<br />
$100,000<br />
$81,430<br />
$74,<strong>12</strong>4<br />
$78,546<br />
$82,079<br />
$50,000<br />
$28,732<br />
$27,593<br />
$0<br />
$39<br />
General Special Revenue Capital Enterprise Internal Service<br />
$39<br />
FY <strong>2011</strong> FY 20<strong>12</strong><br />
The starting point for the FY 20<strong>12</strong> operating base <strong>budget</strong> is the current fiscal year’s ongoing base<br />
<strong>budget</strong>. It continues to focus on the Mayor and Council strategic goals and will carry on the<br />
process <strong>of</strong> transforming the vision <strong>of</strong> one community into reality. The operating <strong>budget</strong> also<br />
reflects the constrained and challenging economic conditions that the nation currently faces.<br />
Several expenditure management measures and <strong>budget</strong> reductions have been incorporated into<br />
the balanced operating <strong>budget</strong> and are discussed in detail in the section <strong>of</strong> this <strong>book</strong> titled City<br />
Manager’s Budget Message. These measures were implemented while keeping our focus on<br />
providing key services that sustain Council’s strategic goals while we manage the current<br />
economic downturn.<br />
56<br />
Return to TOC
BUDGET SUMMARY<br />
Expenditures<br />
Operating Budget Summary<br />
In most cases, Glendale’s fund structure coincides with the <strong>city</strong>’s organizational and program<br />
structure. Table 2 shows the year over year changes in the operating <strong>budget</strong>s for some <strong>of</strong> the<br />
City’s largest operating funds. It is sorted in descending order based upon the size <strong>of</strong> the FY<br />
20<strong>12</strong> operating <strong>budget</strong> within each fund grouping. It also calculates the percentage change for<br />
the fund from the FY <strong>2011</strong> operating base <strong>budget</strong>.<br />
Table 2: Comparison <strong>of</strong> Operating Budgets<br />
FY <strong>2011</strong> vs. FY 20<strong>12</strong><br />
(All Dollars in Thousands)<br />
Fund Name FY <strong>2011</strong> FY 20<strong>12</strong> % Change<br />
General (1000) $130,658 $<strong>12</strong>3,525 -5.5%<br />
Arena Event Operations (<strong>12</strong>82) $1,202 $21,204 1664.4%<br />
General Services (1040) $9,081 $8,934 -1.6%<br />
Technology Replacement (1140) $3,510 $3,5<strong>12</strong> 0.0%<br />
Vehicle Replacement (1<strong>12</strong>0) $3,030 $3,030 0.0%<br />
Stadium Event Operations (<strong>12</strong>81) $2,965 $2,967 0.1%<br />
Stadium City Sales Tax - AZSTA (1790) $1,700 $1,746 2.7%<br />
Public Safety Training Center (2530) $1,445 $1,545 6.9%<br />
Telephone Services (1100) $977 $979 0.2%<br />
Civic Center (1740) $748 $767 2.4%<br />
All Other Funds $2,722 $2,751 1.1%<br />
Sub-Total General Fund Group $158,038 $170,960 8.2%<br />
Other Federal and State Grants (1840) $17,661 $18,995 7.6%<br />
Police Sales Tax (1700) $<strong>12</strong>,587 $14,174 <strong>12</strong>.6%<br />
Transportation Sales Tax (1660) $<strong>12</strong>,203 $11,841 -3.0%<br />
Highway User Gas Tax (1340) $8,462 $8,218 -2.9%<br />
Fire Sales Tax (1720) $6,136 $6,396 4.2%<br />
RICO Funds (1860) $1,324 $3,895 194.1%<br />
C.D.B.G. (1320) $3,541 $3,719 5.0%<br />
N'hood Stabilization Pgm III (1311) $0 $3,368 n/a<br />
ARRA Stimulus Grants (1842) $3,967 $2,672 -32.7%<br />
Neighborhood Stabilization Pgm (1310) $4,184 $2,118 -49.4%<br />
All Other Funds $4,058 $6,035 48.7%<br />
Sub-Total Special Rev Fund Group $74,<strong>12</strong>4 $81,430 9.9%<br />
Sub-Total Capital Fund Group $39 $39 0.0%<br />
57<br />
Return to TOC
BUDGET SUMMARY<br />
Expenditures<br />
Fund Name FY <strong>2011</strong> FY 20<strong>12</strong> % Change<br />
Water/Sewer (2360/2400/2420) $49,<strong>12</strong>3 $47,790 -2.7%<br />
Landfill (2440) $7,043 $7,099 0.8%<br />
Sanitation (2480) $13,893 $14,581 4.9%<br />
Pub Housing Budget Activities (2500) $8,487 $<strong>12</strong>,609 48.6%<br />
Sub-Total Enterprise Fund Group $78,546 $82,079 4.5%<br />
Benefits Trust Fund (2580) $24,481 $23,118 -5.6%<br />
Risk Management Self Insurance (2540) $2,844 $3,068 7.9%<br />
Workers Comp. Self Insurance (2560) $1,407 $1,407 0.0%<br />
Sub-Total Internal Svc Fund Group $28,732 $27,593 -4.0%<br />
Grand Total: Operating Budget $339,479 $362,100 6.7%<br />
The majority <strong>of</strong> the general fund group’s operating <strong>budget</strong> expenditures are included in the<br />
General (Fund 1000), which encompasses 72% <strong>of</strong> that group’s total operating <strong>budget</strong>. This fund,<br />
along with the Highway User Gas Tax (Fund 1340) that is part <strong>of</strong> the special revenue group,<br />
were the main focus <strong>of</strong> the City Council <strong>budget</strong> workshop presentations and are <strong>of</strong>ten<br />
collectively referred to as the “General and Streets Fund” operating <strong>budget</strong> for the <strong>city</strong>. These<br />
two funds are discussed in more detail in the following pages starting with Table 3: Comparison<br />
<strong>of</strong> General and Streets Fund Operating Budgets.<br />
The increase in the Arena Event Operations operating <strong>budget</strong> is the direct result <strong>of</strong> the $20<br />
million arena management fee that was added in FY 20<strong>12</strong>. In FY <strong>2011</strong>, this fund included the<br />
operating expenses associated with providing police, fire and transportation related services<br />
during events held at Jobing.com Arena. At the time this <strong>budget</strong> <strong>book</strong> was produced, a tentative<br />
agreement was in place related to the sale <strong>of</strong> the NHL Coyotes hockey team that included new<br />
contractual payments from the <strong>city</strong> for arena management services.<br />
As mentioned previously, the FY 20<strong>12</strong> operating <strong>budget</strong> includes ample grant-related<br />
appropriation increases to accommodate the <strong>city</strong> aggressively pursuing grant opportunities that<br />
may arise during the year, or those that have already been awarded to the <strong>city</strong>. Other Federal and<br />
State Grants (1840), Neighborhood Stabilization Program III (1311) and C.D.B.G. (1320) drove<br />
a net increase in grant related appropriation totaling $3.5 million within the special revenue<br />
group. It is important to note that the <strong>city</strong> only pursues grant opportunities that are in line with<br />
council goals and objectives and that make strong financial business sense. Grant appropriation<br />
cannot be spent unless the <strong>city</strong> applies for and actually receives the corresponding grant monies.<br />
The Police Sales Tax and RICO fund operating <strong>budget</strong>s increased $4.2 million to accommodate<br />
police related purchases using existing fund balances.<br />
Table 3 includes a tabular comparison <strong>of</strong> the largest General & Streets Fund departmental<br />
operating base <strong>budget</strong>s over the last two fiscal years and calculates the percentage change for the<br />
department from the FY <strong>2011</strong> operating base <strong>budget</strong>.<br />
58<br />
Return to TOC
BUDGET SUMMARY<br />
Expenditures<br />
Table 3: Comparison <strong>of</strong> General and Streets Funds<br />
Operating Budgets: FY <strong>2011</strong> vs. FY 20<strong>12</strong><br />
(All Dollars in Thousands)<br />
Department Name FY <strong>2011</strong> FY 20<strong>12</strong> % Change<br />
Police Services $47,136 $47,636 1.1%<br />
Fire Services $23,639 $24,157 2.2%<br />
Leisure & Cultural $15,1<strong>12</strong> $14,331 -5.2%<br />
Public Works $13,0<strong>12</strong> $<strong>12</strong>,438 -4.4%<br />
Development Services $4,979 $4,577 -8.1%<br />
Financial Services $8,044 $3,862 -52.0%<br />
Transportation Services $3,748 $3,783 0.9%<br />
City Court $3,578 $3,388 -5.3%<br />
City Attorney $2,840 $2,853 0.5%<br />
Technology & Innovation $3,049 $2,757 -9.6%<br />
Communications $2,957 $2,620 -11.4%<br />
Human Resources & Risk Mgt $1,9<strong>12</strong> $1,946 1.8%<br />
Economic Development $1,802 $1,469 -18.5%<br />
Mayor & Council $1,256 $1,424 13.4%<br />
N'Hood & Human Services $1,019 $1,092 7.2%<br />
City Manager $1,395 $1,047 -24.9%<br />
Non-Departmental $1,964 $765 -61.0%<br />
Intergovt. Programs $722 $687 -4.8%<br />
City Clerk $676 $618 -8.5%<br />
Compliance & Asset Mgt $254 $265 4.3%<br />
Water Services $27 $27 0.0%<br />
Total General and Streets Funds $139,<strong>12</strong>0 $131,743 -5.3%<br />
The reductions above are consistent with the <strong>city</strong>’s <strong>budget</strong> strategy for steering the <strong>city</strong> through<br />
the rest <strong>of</strong> the economic downturn and will continue to keep the <strong>city</strong> ready for the eventual<br />
economic turnaround. This strategy and the specific reductions are discussed extensively in the<br />
City Manager’s Budget Message.<br />
It is important to note the all departments within the General and Streets Funds participated in<br />
FY 20<strong>12</strong> base <strong>budget</strong> reductions. However, changes in departmental staffing levels associated<br />
with the FY 2010 FTE reduction exercise that was finalized during the first quarter <strong>of</strong> FY <strong>2011</strong>,<br />
coupled with an organizational re-alignment that occurred at the end FY <strong>2011</strong>, caused several<br />
departments to have shifts in the salary and benefits component <strong>of</strong> their operating <strong>budget</strong> from<br />
FY <strong>2011</strong> to FY 20<strong>12</strong> that effected their year over year percentage changes.<br />
59<br />
Return to TOC
BUDGET SUMMARY<br />
Expenditures<br />
The 52% decrease in the Financial Services department is a result <strong>of</strong> decreased staffing and a<br />
planned restructuring <strong>of</strong> existing lease debt. The remaining principal and interest payments were<br />
spread out over a longer time period resulting in a reduction <strong>of</strong> $3.8M in the operating <strong>budget</strong><br />
from FY<strong>2011</strong> to FY 20<strong>12</strong>. Schedule Eight in the back <strong>of</strong> the <strong>budget</strong> <strong>book</strong> includes all scheduled<br />
lease payments planned for the next five years and beyond. The 61% decrease in Non-<br />
Departmental is due to the re-allocation <strong>of</strong> an electri<strong>city</strong> and utilities reserve <strong>budget</strong> totaling<br />
$1.1M that was moved out <strong>of</strong> this <strong>budget</strong> and into Field Operations, Transportation and Parks &<br />
Recreation where these expenses are primarily paid from.<br />
Percentage <strong>of</strong> Operating Budget<br />
by Dept for All Funds<br />
All Other Depts<br />
N'Hood & Human 8.3%<br />
Svcs<br />
7.3%<br />
Financial Svcs<br />
8.1%<br />
Police Services<br />
20.5%<br />
Miscellaneous<br />
Grants<br />
2.9%<br />
HR & Risk Mgt<br />
8.2%<br />
Fire Services<br />
10.1%<br />
Leisure & Cultural<br />
4.8%<br />
Water Services<br />
<strong>12</strong>.3%<br />
Public Works<br />
<strong>12</strong>.9%<br />
Transportation<br />
Svcs<br />
4.7%<br />
The largest operating department, regardless <strong>of</strong> funding source, is the Police Services, which<br />
accounts for $74.2 million or 20.5% <strong>of</strong> the total operating <strong>budget</strong>. The Police Department<br />
provides police protection and related support services such as 9-1-1 dispatch, short-term<br />
detention and community education. It is accredited through the independent Commission on<br />
Accreditation for Law Enforcement.<br />
The second largest department is Public Works at $46.6 million, which makes up <strong>12</strong>.9% <strong>of</strong> the<br />
total operating <strong>budget</strong>. This department is made up <strong>of</strong> Field Operations and Engineering staff.<br />
Among the many services that this department provides are the following:<br />
• solid waste collection and disposal services and processing <strong>of</strong> recyclable products;<br />
• building and equipment maintenance services for <strong>city</strong> vehicles and facilities;<br />
• street and right-<strong>of</strong>-way maintenance;<br />
• fuel services, custodial services and graffiti removal; and<br />
• design and construction management for all <strong>city</strong> capital projects.<br />
60<br />
Return to TOC
BUDGET SUMMARY<br />
Expenditures<br />
The next largest department is Water Services at $44.6 million, which makes up <strong>12</strong>.3% <strong>of</strong> the<br />
total operating <strong>budget</strong>. This department is responsible for treating and distributing potable water<br />
that meets all federal and state standards, collecting and treating wastewater in compliance with<br />
all regulatory requirements, implementing odor and pest infestation control measures and reading<br />
all water meters on a daily basis. Environmental Services provides water conservation programs,<br />
water quality testing services for the <strong>city</strong>’s drinking water and reclaimed water services, and<br />
long-term water resource planning.<br />
Fire Services accounts for $36.7 million or 10.1% <strong>of</strong> the total operating <strong>budget</strong>. This<br />
department provides fire protection, emergency medical services and natural disaster planning.<br />
It also provides core life safety services involving fire suppression, property preservation, basic<br />
and advanced life support (paramedics), h<strong>az</strong>ardous and technical response teams, fire code<br />
enforcement, fire investigation and child safety car seat installation. It is accredited by the<br />
Commission <strong>of</strong> Fire Accreditation International.<br />
The fifth largest department is Human Resources & Risk Management. It totals $29.6 million<br />
or 8.2% <strong>of</strong> the total operating <strong>budget</strong>. The department provides proactive customer service and<br />
consultation in the areas <strong>of</strong> total compensation, organizational development, employee relations<br />
and staffing. The Human Resources Department also administers the self insured employee<br />
health benefits, risk management and workers’ compensation programs and services.<br />
Budget & Financial Services totals $29.2 million or 8.1% <strong>of</strong> the total operating <strong>budget</strong>. They<br />
provide information to the public, state agencies, bondholders, grantors, auditors, City Council<br />
and management. This department is responsible for <strong>budget</strong> development and management,<br />
banking services and investment management, debt management as well as administering the<br />
sales tax code. Additional functions include preparation <strong>of</strong> external financial reports, managing<br />
the <strong>city</strong> payroll and accounts payable processes and maintaining, updating and testing accounting<br />
and <strong>budget</strong> input system changes and upgrades.<br />
The next largest department is Neighborhood & Human Services at $26.5 million, which<br />
makes up 7.3% <strong>of</strong> the total operating <strong>budget</strong>. This department provides direct <strong>city</strong> services that<br />
maintain the quality <strong>of</strong> life and build stronger neighborhoods for all residents. Some <strong>of</strong> the<br />
services these divisions provide include:<br />
• addressing the housing needs <strong>of</strong> over 4,400 Glendale residents by operating three public<br />
housing complexes and a Section 8 voucher program;<br />
• providing affordable housing, housing rehabilitation assistance and emergency home<br />
repair for eligible Glendale residents; and<br />
• administering the federal Community Development Block Grant (CDBG), the<br />
Community Action Program (CAP) and other related federal programs.<br />
The Leisure & Cultural Department provides services that are probably the most visible to the<br />
public and includes library services and parks, open space and recreational activities for<br />
residents. This department accounts for $17.3 million or 4.8% <strong>of</strong> the total operating <strong>budget</strong>. The<br />
library serves Glendale citizens by providing <strong>book</strong>s, programming, audio-visual materials and<br />
61<br />
Return to TOC
BUDGET SUMMARY<br />
Expenditures<br />
electronic resources that inform, educate and entertain residents. The department also <strong>of</strong>fers<br />
opportunities to enhance the social, physical, mental and economic health <strong>of</strong> the community by<br />
<strong>of</strong>fering a wide variety <strong>of</strong> programs and events. They also maintain, protect and manage parks,<br />
open spaces, trails and aquatic and recreational facilities located throughout the community.<br />
The next largest department is Transportation Services at $16.9 million, which makes up 4.7%<br />
<strong>of</strong> the total operating <strong>budget</strong>. This department is responsible for transportation planning, traffic<br />
engineering, traffic signals, signs, striping, street lighting, transit services and educational<br />
program services to meet the transportation needs <strong>of</strong> the <strong>city</strong>. This department is also<br />
responsible for operating the Glendale Municipal Airport. The airport is a regional general<br />
aviation facility that provides hangar facilities, aviation planning, maintenance, safety and<br />
educational tours.<br />
Miscellaneous Grants expenses round out the top ten departments and this area accounts for<br />
another $10.3 million or 2.9% <strong>of</strong> the operating <strong>budget</strong>. However, $8.6 million <strong>of</strong> this amount<br />
includes grant reserve appropriation that can be used only to the extent that the <strong>city</strong> successfully<br />
obtains federal or state grant funded monies during the fiscal year.<br />
The remaining departments in the all other category include: Technology & Innovation,<br />
Development Services, Communications, City Court, City Attorney, Economic Development,<br />
Mayor/Council, City Manager, Transportation Grants, Non-Departmental, Intergovernmental<br />
Programs, City Clerk and Compliance/Asset Management (listed in descending order based on<br />
the size <strong>of</strong> their respective operating <strong>budget</strong>). These departments make up the remaining $30.2<br />
million or 8.3% <strong>of</strong> the total operating <strong>budget</strong>.<br />
The Operating Budget section in this <strong>budget</strong> <strong>book</strong> includes more detailed information on all the<br />
departments mentioned in this section.<br />
Staffing and Personnel Issues<br />
As with any service organization, personnel costs are a significant part <strong>of</strong> the total operating<br />
<strong>budget</strong> <strong>of</strong> the <strong>city</strong>. In fact, 75% <strong>of</strong> the FY 20<strong>12</strong> operating <strong>budget</strong> for the General and Streets<br />
funds is attributable to wages, salaries and benefits.<br />
The FY <strong>2011</strong> General Fund <strong>budget</strong> included 22 frozen public safety positions. These 22<br />
positions will be frozen for another year in the FY 20<strong>12</strong> <strong>budget</strong>. In addition, staff has identified<br />
another 64 General Fund positions that will be frozen in FY 20<strong>12</strong>. Of the additional 64<br />
positions, only 5 are sworn with the remaining 59 non-sworn. It is important to note that these<br />
86 frozen positions are still included in the Full-Time Equivalent (FTE) counts that appear on the<br />
following pages. Only the salary and benefits associated with the frozen positions are removed<br />
from the department’s respective operating <strong>budget</strong>s. This is done because the positions are still<br />
authorized by City Council to be filled when the economy and revenue collections improve to<br />
the point where it makes business sense to fund the positions once again.<br />
62<br />
Return to TOC
BUDGET SUMMARY<br />
Expenditures<br />
Table 4 provides a comparison <strong>of</strong> staffing levels in recent years for all funds which accounts for<br />
all changes in authorized staffing <strong>city</strong>-wide. The overall staffing level decreased by 4.63 FTE’s<br />
due to minimal staffing changes made across six different funds from FY <strong>2011</strong> to FY 20<strong>12</strong>.<br />
Table 4: Staffing Levels by Fund<br />
(Full-Time Equivalents)<br />
Fund 2007-08 2008-09 2009-10 2010-11 <strong>2011</strong>-<strong>12</strong><br />
General-1000 1,411.76 1,403.76 1,389.76 1,202.26 1,198.88<br />
Water and Sewer-2360/2400/2420 241.25 242.25 242.25 242.25 242.25<br />
Police Special Revenue-1700 42.00 118.00 118.00 118.00 118.00<br />
Sanitation-2480 75.00 78.00 80.00 80.00 79.00<br />
Highway User Gas Tax-1340 97.00 98.00 90.00 67.00 65.00<br />
Fire Special Revenue-1720 21.00 50.00 50.00 51.00 51.00<br />
Transportation Sales Tax-1660 50.25 50.25 50.25 49.25 49.25<br />
Landfill-2440 43.00 41.00 41.00 44.00 44.00<br />
General Services-1040 42.00 42.00 41.00 37.00 34.00<br />
Pub Housing Budget Activities-2500 25.00 25.00 25.00 24.00 24.00<br />
Training Facility Revenue Fund-2530 <strong>12</strong>.00 <strong>12</strong>.00 <strong>12</strong>.00 10.00 <strong>12</strong>.00<br />
C.D.B.G.-1320 8.75 8.75 8.75 8.75 8.75<br />
CAP Grant-1820 7.00 7.00 7.00 7.00 7.00<br />
Parks & Recreation Self Sust-1880 5.00 5.00 5.00 7.00 7.00<br />
Civic Center-1740 7.00 7.00 7.00 6.00 6.00<br />
Airport Special Revenue-1760 5.00 5.00 5.00 5.00 5.00<br />
Risk Mgt Self Insurance-2540 1.00 3.75<br />
Grants-1840 4.00 4.00 3.00 3.00 3.00<br />
Court Security/Bonds-<strong>12</strong>40 1.00 1.00 1.00 2.00 2.00<br />
Stadium Event Operations-<strong>12</strong>81 2.00 2.00 2.00 2.00<br />
Arena Event Operations-<strong>12</strong>82 2.00 2.00 2.00 2.00<br />
Telephone Services-1100 1.00 1.00 1.00 1.00 1.00<br />
PC Replacement-1140 1.00 1.00 1.00 1.00 1.00<br />
RICO Funds-1860 0.50 0.50 0.50 0.50 0.50<br />
Total 2,100.51 2,204.51 2,182.51 1,971.01 1,966.38<br />
63<br />
Return to TOC
BUDGET SUMMARY<br />
Expenditures<br />
The <strong>city</strong> has historically taken a conservative approach to adding new positions and expanding<br />
its service delivery system to ensure that basic services can be sustained regardless <strong>of</strong> revenue<br />
and expense fluctuations. Therefore, staff increases are typically closely tied to population<br />
growth. However, severe economic downturns can impact staffing levels given the fact that a<br />
high percentage <strong>of</strong> overall operating costs are staffing related. Glendale is not immune to<br />
reductions in force. City-wide authorized staffing experienced ten straight years <strong>of</strong> modest<br />
growth before staffing reductions were implemented in FY 2010 and FY <strong>2011</strong>.<br />
The FY 2010 staffing per<br />
1,000 increased because the<br />
2010 census numbers came in<br />
23,090 less than the previous<br />
year’s population figure, in<br />
addition, the vacant positions<br />
accumulated in all funds were<br />
not eliminated from the <strong>budget</strong><br />
until the following fiscal year.<br />
The FY <strong>2011</strong> <strong>budget</strong> included<br />
a decrease in total authorized<br />
staffing by 211.5 FTEs across<br />
all funds. The majority <strong>of</strong> the<br />
staffing decreases related to<br />
the elimination <strong>of</strong> vacant GF<br />
positions and <strong>city</strong>-wide <strong>budget</strong> reductions. The FY 20<strong>12</strong> staffing per 1,000 population<br />
remained flat year over year. Schedule 6, found in the Schedules section <strong>of</strong> this document,<br />
provides detail on the <strong>city</strong>’s authorized staffing by position for all departments and funding<br />
sources.<br />
<strong>12</strong>.0<br />
9.0<br />
6.0<br />
3.0<br />
does so without sacrificing the quality <strong>of</strong> services provided to residents.<br />
10<br />
Staffing Per 1,000 Population<br />
FY <strong>2011</strong> - Valley Cities<br />
6.3 6.6<br />
Avondale<br />
Chandler<br />
7.1<br />
Peoria<br />
Mesa<br />
9<br />
8<br />
7<br />
6<br />
5<br />
8.2 8.5<br />
FY<strong>12</strong>-COG<br />
COG Authorized Staffing Per 1,000 Population<br />
10-Year Fiscal History<br />
'03 '04 '05 '06 '07 '08 '09 '10 '11 '<strong>12</strong><br />
9.9 10.1 10.4<br />
Tempe<br />
Scottsdale<br />
Phoenix<br />
The total authorized<br />
staffing <strong>of</strong> 1,966.38 FTE<br />
positions will serve an<br />
estimated population <strong>of</strong><br />
231,763 at the start <strong>of</strong> FY<br />
20<strong>12</strong>. This results in a<br />
staffing ratio <strong>of</strong> 8.48<br />
employees per 1,000<br />
residents in FY 20<strong>12</strong>. As<br />
the accompanying graph<br />
indicates, Glendale<br />
continues to maintain a low<br />
staff to population ratio<br />
compared to Phoenix,<br />
Scottsdale and Tempe and<br />
64<br />
Return to TOC
BUDGET SUMMARY<br />
Expenditures<br />
Please note that the ratio for all staffing-per-each-1,000 residents is from FY <strong>2011</strong> adopted<br />
<strong>budget</strong> numbers except for the City <strong>of</strong> Glendale, which represents the FY 20<strong>12</strong> ratio. This is<br />
done because the FY 20<strong>12</strong> adopted <strong>budget</strong> numbers for other cities was not known at the time<br />
this <strong>budget</strong> <strong>book</strong> was published.<br />
General and Streets Fund Operating Expenditures<br />
The total operating <strong>budget</strong> for FY 20<strong>12</strong> is $131.7 million. Police Services, at 36.2% or $47.6<br />
million, is the largest component <strong>of</strong> the General Fund <strong>budget</strong>, followed by Fire Services at<br />
approximately 18.3% or $24.2 million, Leisure & Cultural at 10.9% or $14.3 million and finally<br />
Public Works at 9.4% or $<strong>12</strong>.4 million. These four departments comprise 74.8% or $98.5<br />
million <strong>of</strong> the total General and Streets Fund operating <strong>budget</strong>s. The remaining 25.2% or $33.2<br />
million <strong>of</strong> the $131.7 million <strong>budget</strong> is within the Development Services, Transportation, Budget<br />
& Financial Services and All Other Departments categories.<br />
The All Other category includes City Court, City Attorney, Technology & Innovation,<br />
Communications, Human Resources & Risk Management, Economic Development, Mayor &<br />
Council, Neighborhood & Human Services, City Manager, Intergovernmental Programs, City<br />
Clerk, Compliance & Asset Management and Water Services departments. The accompanying<br />
graph displays the General and Streets Fund <strong>budget</strong>s by department as a percentage <strong>of</strong> the whole.<br />
% <strong>of</strong> General & Streets Fund Budget by Dept<br />
Transportation<br />
Services<br />
2.9%<br />
Public Works<br />
9.4%<br />
All Other Depts<br />
15.9%<br />
Police Services<br />
36.2%<br />
Leisure &<br />
Cultural<br />
10.9%<br />
Budget &<br />
Financial Svcs<br />
2.9%<br />
Fire Services<br />
18.3%<br />
Development<br />
Services<br />
3.5%<br />
65<br />
Return to TOC
BUDGET SUMMARY<br />
Expenditures<br />
All street-related costs eligible for the Highway User Revenue Fund (HURF) allocation are<br />
<strong>budget</strong>ed as expenses <strong>of</strong> the Streets Fund and are included in the Public Works and<br />
Transportation Departments. The following table compares the FY 20<strong>12</strong> General and Streets<br />
Fund operating <strong>budget</strong>s by department to FY <strong>2011</strong> in tabular form.<br />
Table 5: General Fund Budget By Dept Comparison<br />
(All Dollars in Thousands)<br />
Dept Name<br />
FY <strong>2011</strong> FY 20<strong>12</strong> FY 20<strong>12</strong><br />
Budget Budget % <strong>of</strong> Total<br />
Police Services $48,390 $47,636 36.2%<br />
Fire Services $24,601 $24,157 18.3%<br />
Leisure & Cultural $15,785 $14,331 10.9%<br />
Public Works $13,065 $<strong>12</strong>,438 9.4%<br />
Development Services $5,045 $4,577 3.5%<br />
Financial Svcs $7,771 $3,862 2.9%<br />
Transportation Services $3,770 $3,783 2.9%<br />
City Court $3,618 $3,388 2.6%<br />
City Attorney $2,840 $2,853 2.2%<br />
Tech. & Innovation $3,058 $2,757 2.1%<br />
Communications $3,036 $2,620 2.0%<br />
HR & Risk Mgt $2,080 $1,946 1.5%<br />
Economic Development $1,499 $1,469 1.1%<br />
Mayor & Council $1,338 $1,424 1.1%<br />
N'Hood & Human Svcs $906 $1,092 0.8%<br />
City Manager $1,408 $1,047 0.8%<br />
Non-Departmental $795 $765 0.6%<br />
Intergovt. Programs $498 $687 0.5%<br />
City Clerk $717 $618 0.5%<br />
Compliance & Asset Mgt $256 $265 0.2%<br />
Water Services $34 $27 0.0%<br />
Total $140,510 $131,743 100.0%<br />
General and Streets Funds Transfers to Other Funds<br />
The General and Streets Funds support a number <strong>of</strong> other funds within the <strong>city</strong>. The amount <strong>of</strong><br />
support can vary from year to year based on projected revenue for the supported funds as well as<br />
debt service schedules. A net transfer amount <strong>of</strong> $32.3 million is projected to be transferred to<br />
other funds in FY 20<strong>12</strong>. This amount is $19.6 million more than the net GF transfers included in<br />
the FY <strong>2011</strong> <strong>budget</strong> due to a one-time <strong>of</strong>fset <strong>of</strong> $6 million that was transferred into the General<br />
Fund. In addition, the transfer from the General Fund to the Arena Event Operations Fund was<br />
increased by $15 million to cover the arena management fee.<br />
66<br />
Return to TOC
BUDGET SUMMARY<br />
Expenditures<br />
Also included in the $32.3 million transfer is $10.2 million to the Municipal Property<br />
Corporation debt service fund to cover principal and interest payments related to several capital<br />
projects such as the Glendale Media Center and Expo Hall, Convention Center and Parking<br />
Garage in the west area, infrastructure for the Zanjero development, the Jobing.com Arena and a<br />
portion <strong>of</strong> the Glendale Regional Public Safety Training Center. The $10.2 million is the net<br />
amount after accounting for expected revenue per the respective development agreements for the<br />
various facilities named above.<br />
A total transfer <strong>of</strong> $3.3 million is projected for the Stadium, Youth Sports Complex and Arena<br />
Operations funds (excluding the arena management fee discussed previously). $1.4 million will<br />
be transferred from the Streets Fund to the Street Debt Service Fund to help pay the principal and<br />
interest payments for previously funded HURF bond projects. Another $900,000 will go to the<br />
Transportation Fund and is done <strong>annual</strong>ly per the 2001 election approving the transportation<br />
sales tax. A transfer <strong>of</strong> $320,145 will be made to the Marketing Special Events Fund to support<br />
the special events held in downtown Glendale. Other transfers will go to the Civic Center,<br />
Airport, Housing, Employee Group and various other grant funds. Transfers between funds are<br />
detailed in Schedule 4 <strong>of</strong> the Schedules section <strong>of</strong> this document.<br />
Police and Fire Sales Tax Fund Expenditures<br />
These fund resources are designated to support the salaries <strong>of</strong> additional police <strong>of</strong>ficers and<br />
firefighters, as well as the equipment and services needed to support those positions. A total <strong>of</strong><br />
$14.2 million will be appropriated from the Police Special Revenue Fund to provide police<br />
services. An additional $6.4 million from the Fire Special Revenue Fund is designated to<br />
provide fire protection and emergency medical services. The Police fund supports 118<br />
authorized police staffing positions while the Fire fund supports 51 fire staffing positions.<br />
Transportation Fund Expenditures<br />
The Transportation Fund includes<br />
operating, capital and debt<br />
service expenses related to<br />
providing a range <strong>of</strong><br />
transportation services in<br />
accordance with the ballot<br />
initiative that Glendale voters<br />
approved in a 2001 election.<br />
Although the majority <strong>of</strong><br />
expenditures totaling $45 million<br />
are <strong>budget</strong>ed for capital outlays<br />
(including grant funded capital<br />
projects), the total operating<br />
<strong>budget</strong> <strong>of</strong> $<strong>12</strong>.6 million is used<br />
for Fixed Route services (public<br />
Capital<br />
69.3%<br />
Transportation Fund Budget<br />
Operating<br />
19.4%<br />
Debt Svc<br />
11.3%<br />
67<br />
Return to TOC
BUDGET SUMMARY<br />
Expenditures<br />
transportation) at $5.2 million and Dial-A-Ride at $2.4 million. The latter program serves<br />
physically challenged residents and individuals with special transportation needs.<br />
The Transportation Program Management division includes funding for the streetlight<br />
maintenance contract and program audit services, as well as various other items and has a total<br />
<strong>budget</strong> <strong>of</strong> $2.3 million. The remaining $2.7 million, or 21% <strong>of</strong> the operating <strong>budget</strong>, is used for<br />
traffic engineering, safety education, traffic mitigation, management oversight and grant related<br />
operating appropriation. Debt service payments totaling $7.3 million are <strong>budget</strong>ed for FY 20<strong>12</strong><br />
and represent the final appropriation component.<br />
Airport Fund Expenditures<br />
The Airport Fund operating <strong>budget</strong> is $527,326 that is funded by airport revenues <strong>of</strong> $466,491<br />
with the remaining $60,835 covered through a transfer from the General Fund. Much <strong>of</strong> these<br />
appropriations fund daily operations at the airport, including fulfilling FAA safety regulations.<br />
Continuing efforts to develop more revenue sources, coupled with prudent cost control measures,<br />
have brought the airport much closer to self-sufficiency when comparing revenue sources<br />
generated and actual expenditures. Once runway and facility improvements are completed, and<br />
the economy recovers, staff believes the Glendale Airport will attract more corporate jet<br />
customers. When these improvements are coupled with uses from pr<strong>of</strong>essional football, hockey<br />
and baseball spring training, as well as other major national events occurring in Glendale, the<br />
<strong>city</strong>’s airport is expected to be a fully self-sustaining transportation hub for the West Valley.<br />
Water/Sewer Fund Expenditures<br />
In Arizona’s desert environment, water treatment and delivery is one <strong>of</strong> the most essential<br />
services the <strong>city</strong> provides. Glendale is fortunate to have reliable, long-term sources <strong>of</strong> water<br />
from the Salt River Project, the Central<br />
Arizona Project (Colorado River<br />
water) and groundwater. Although<br />
water from these sources is becoming<br />
more expensive to obtain and treat,<br />
Glendale water rates are reasonable<br />
when compared to both local and<br />
national standards.<br />
The operating <strong>budget</strong> for this fund is<br />
$47.8 million for FY 20<strong>12</strong>. Almost<br />
half <strong>of</strong> this <strong>budget</strong>, or $18.6 million, is<br />
used to support the Oasis Water<br />
Campus; the Cholla and Pyramid Peak<br />
Water Treatment Plants; the West Area<br />
Capital<br />
40.0%<br />
Water/Sewer Fund Budget<br />
Operations<br />
35.9%<br />
Debt Service<br />
20.3%<br />
Contingency<br />
3.8%<br />
and Arrowhead Wastewater Treatment Plants; and the regional sewer treatment facility that the<br />
City <strong>of</strong> Phoenix operates through the Sub-Regional Operating Group (SROG). In addition, water<br />
68<br />
Return to TOC
BUDGET SUMMARY<br />
Expenditures<br />
distribution, wastewater collection, customer service and utilities administration costs make up<br />
another $20.6 million. The remaining $8.6 million <strong>of</strong> the operating <strong>budget</strong> is used for meter<br />
maintenance, central system control, water quality testing and information management services.<br />
Many significant capital projects are planned for FY 20<strong>12</strong> and they account for the $53.2 million<br />
in capital expenditures, as well as the corresponding $27 million in debt service payments<br />
required for those capital projects. The Capital Improvement Plan <strong>of</strong> this <strong>book</strong> includes project<br />
descriptions and detailed cost estimates for all planned water and sewer capital projects. A $5<br />
million contingency appropriation is supported by fund balance and will be used at the direction<br />
<strong>of</strong> City Council for any unplanned emergencies or if any capital construction projects get ahead<br />
<strong>of</strong> schedule.<br />
Landfill Fund Expenditures<br />
The total operating <strong>budget</strong> for FY 20<strong>12</strong> is $7.1 million, relatively unchanged from the $7 million<br />
in FY <strong>2011</strong>. Landfill operations total $3.2 million, the materials recycling facility accounts for<br />
$2 million and other recycling at $937,523, all <strong>of</strong> which accounts for 86.2% <strong>of</strong> the operating<br />
<strong>budget</strong>. The remaining amount, or $977,584, is used for solid waste administration and landfill<br />
gas management. The FY 20<strong>12</strong> capital <strong>budget</strong> totals $1.7 million and the Landfill Fund also has<br />
a $2.0 million contingency appropriation to be used at City Council discretion for any unplanned<br />
emergencies.<br />
FY 20<strong>12</strong> will be the tenth full year <strong>of</strong> operation for the recycling program, which includes the<br />
recycling education and inspection programs and the full cost <strong>of</strong> the materials recycling facility.<br />
Recycling accomplishes a number <strong>of</strong> objectives such as improving the environment, extending<br />
the useful life <strong>of</strong> Glendale’s landfill, and generating revenue from the sale <strong>of</strong> reusable materials.<br />
Sanitation Fund Expenditures<br />
Operations,<br />
86%<br />
Sanitation Fund Budget<br />
Capital, 11%<br />
Cont., 3%<br />
The total operating <strong>budget</strong><br />
for FY 20<strong>12</strong> is $14.6<br />
million, which represents a<br />
5% increase from the $13.9<br />
million in FY <strong>2011</strong>, but it is<br />
in line with the $14.5 million<br />
in FY 2010. Residential<br />
curb service includes trash,<br />
recycling and loose trash<br />
collection and accounts for<br />
$10.4 million or 71% <strong>of</strong> the<br />
operating <strong>budget</strong>. The<br />
commercial front-load and<br />
roll-<strong>of</strong>f divisions account for<br />
another $4.2 million. The<br />
69<br />
Return to TOC
BUDGET SUMMARY<br />
Expenditures<br />
FY 20<strong>12</strong> capital <strong>budget</strong> includes $1.9 million for the purchase <strong>of</strong> side load refuse trucks and<br />
replacement pickup trucks, which makes up 11% <strong>of</strong> the total operating <strong>budget</strong>. The Sanitation<br />
Fund has a $500,000 contingency appropriation to be used at City Council discretion for any<br />
unplanned emergencies.<br />
Benefits Trust Fund Expenditures<br />
The Benefits Trust Fund is used to track <strong>city</strong> and employee health care contribution payments<br />
and to pay health insurance policy premiums for employees and retirees. The fund currently<br />
administers the medical, dental, life insurance and vision plans and coverage for both premiums<br />
and claims related expenses. The fund has an operating <strong>budget</strong> <strong>of</strong> $23.1 million for FY 20<strong>12</strong>.<br />
The City <strong>of</strong> Glendale will contribute $14.2 million to this fund in FY 20<strong>12</strong> <strong>of</strong> which $9.2 million<br />
is from the GF employer contributions. Additional revenue in this fund includes employee<br />
contributions totaling $4.3 million and retiree contributions totaling $3.4 million. Modest interest<br />
earnings projected at $17,588 bring total revenues into the fund to $21.9 million for FY 20<strong>12</strong>.<br />
The beginning fund balance is projected to be approximately $2.6 million and the fund is<br />
projected to end the year with $1.4 million. This reduction in fund balance is a direct result <strong>of</strong><br />
management’s decision to keep benefit rates flat year over year by using some fund balance to<br />
cover any medical and dental expenditures over the $21.9 million coming into the fund as<br />
revenue. The FY 20<strong>12</strong> operating <strong>budget</strong> is $23.1 million, which is a reduction <strong>of</strong> $5.6 million<br />
from the FY <strong>2011</strong> operating <strong>budget</strong> <strong>of</strong> $28.7 million.<br />
Capital Improvement Plan Expenditures<br />
The total capital improvement <strong>budget</strong> for FY 20<strong>12</strong> is $144.2 million, and 91.4% <strong>of</strong> this amount<br />
relates to transportation, public safety, flood control, and water and sewer projects. The $144.2<br />
million includes carryover appropriation from FY <strong>2011</strong> <strong>of</strong> $94.6 million to complete existing<br />
projects and $49.7 million for new projects. This is a decrease <strong>of</strong> $50.2 million, or 25.8%,<br />
compared to the FY <strong>2011</strong> capital improvement <strong>budget</strong> <strong>of</strong> $194.4 million. The reduction was<br />
primarily driven by a year over year reduction in the new funding included in the FY <strong>2011</strong><br />
capital <strong>budget</strong> ($97.4 million) versus FY 20<strong>12</strong> ($49.7 million) that accounted for $47.7 million<br />
<strong>of</strong> the decrease. A decrease in funding for carryover capital projects <strong>of</strong> $2.5 million accounted<br />
for the remaining year over year reduction.<br />
The graph below shows the percentage <strong>of</strong> capital improvement plan projects by type and as a<br />
percentage <strong>of</strong> the whole. The graph includes new funding and carryover for FY 20<strong>12</strong>. For more<br />
details, please refer to the Capital Improvement Plan section <strong>of</strong> this document.<br />
70<br />
Return to TOC
BUDGET SUMMARY<br />
Expenditures<br />
Percentage <strong>of</strong> Capital Improvement Plan<br />
Projects by Type<br />
Trans./ Streets<br />
46% Economic<br />
Development<br />
1%<br />
Flood Control<br />
7%<br />
Other<br />
7%<br />
Public Safety<br />
2%<br />
Water/Sewer<br />
37%<br />
Debt Service Expenditures<br />
The City has used debt financing for a number <strong>of</strong> years to finance most capital projects. The<br />
amount <strong>of</strong> debt incurred must be compatible with the City’s goals pertaining to the capital<br />
program, the financial plan and the operating <strong>budget</strong>.<br />
The Government Finance Officers Association recommends local governments develop a formal<br />
comprehensive debt management plan. The City maintains a formal Debt Management Plan,<br />
which is a separate document that the Finance Department develops in conjunction with the<br />
Management and Budget Department. The Debt Management Plan is designed to manage the<br />
issuance <strong>of</strong> the <strong>city</strong>’s debt obligations in order to maintain the City’s ability to incur debt and<br />
other long-term obligations at favorable interest rates for capital improvements, facilities and<br />
equipment beneficial to the <strong>city</strong> and necessary for essential services. This section is not intended<br />
to review the City’s total debt position. That discussion is found in the Debt Management Plan.<br />
The total debt service <strong>budget</strong> for FY 20<strong>12</strong> is $85.1 million, compared to $84.8 million in FY<br />
<strong>2011</strong>. The accompanying graph illustrates how the debt service <strong>budget</strong> is divided among<br />
different types <strong>of</strong> debt service categories. For a discussion about these debt service categories,<br />
please see the Financing the Capital Improvement Plan section in this <strong>budget</strong> document.<br />
71<br />
Return to TOC
BUDGET SUMMARY<br />
Expenditures<br />
Debt Service Budget<br />
G.O. Bonds<br />
28%<br />
MPC/PFC Bonds<br />
26%<br />
Transportation<br />
Revenue Bonds<br />
9%<br />
HURF Bonds<br />
5%<br />
Water & Sewer<br />
Revenue Bonds<br />
32%<br />
CONCLUSION<br />
This Budget Summary is intended to provide a general overview <strong>of</strong> the FY 20<strong>12</strong> <strong>budget</strong><br />
document and to highlight some <strong>of</strong> the more significant program changes and policy issues<br />
addressed in the <strong>budget</strong> document. The sections that follow the Budget Summary section provide<br />
more detailed information about the <strong>city</strong>’s organizational structure, its goals and objectives, and<br />
operating <strong>budget</strong>s for each <strong>city</strong> department.<br />
Documents comprising the foundation for Glendale’s <strong>annual</strong> <strong>budget</strong>ing process have been<br />
included in this <strong>budget</strong> document as well. The Financial Plan and Financial Policies documents<br />
identi<strong>fy</strong> and explain the strategies used to meet and stabilize <strong>city</strong> revenues and expenses, and<br />
ensure the continuity and reliability <strong>of</strong> basic services. The Five-Year Forecast addresses the<br />
long-term financial projection for <strong>city</strong> revenues and expenditures.<br />
In addition, the <strong>city</strong> continues to implement <strong>of</strong> the business-based approach to providing and<br />
evaluating <strong>city</strong> services. Accompanying this approach are departmental business plans that were<br />
initiated in FY 2004 and continue to be based on the City Council’s strategic priorities. In future<br />
<strong>city</strong> <strong>budget</strong>s, the Mayor and Council’s vision for the community will continue to be outlined and<br />
then translated into specific actions and programs through departmental business plans. This will<br />
then guide the <strong>budget</strong> process to ensure the Council goals are achieved through each dollar spent<br />
by the <strong>city</strong>.<br />
The long-range blueprint for the financing and construction <strong>of</strong> large projects is contained in the<br />
Capital Improvement Plan. The Schedules section contains detailed information about the City<br />
<strong>of</strong> Glendale's fund accounting system, operating revenues and expenditures, debt service and<br />
authorized staffing levels.<br />
72<br />
Return to TOC
BUDGET SUMMARY<br />
Expenditures<br />
A Frequently Asked Questions (FAQ) guide is included in the appendix to help clari<strong>fy</strong> the words<br />
and phrases that may have specialized meaning when applied to municipal government<br />
<strong>budget</strong>ing practices. This FAQ document is a good primer for those who wish to brush up on<br />
their financial terminology or want to find parallels between their own personal <strong>budget</strong>s and the<br />
<strong>city</strong>’s overall <strong>budget</strong>.<br />
The City <strong>of</strong> Glendale publishes several other documents that may be <strong>of</strong> interest and assistance in<br />
understanding <strong>city</strong> operations. These include the Comprehensive Annual Financial Report and<br />
Debt Management Plan, available from the Finance Department; the Glendale General Plan,<br />
which was overwhelmingly approved by voters in 2002 and is available from the Planning<br />
Department; and the Glendale Annual Report distributed by the Marketing Department.<br />
Questions, comments or observations regarding this Annual Budget document should be directed<br />
in writing to:<br />
City <strong>of</strong> Glendale<br />
Management and Budget Department<br />
6829 North 58 th Drive, Suite 200<br />
Glendale, Arizona 85301<br />
Phone: (623) 930-2264<br />
Fax: (623) 915-2694<br />
Email: aweathersby@<strong>glendale</strong><strong>az</strong>.com<br />
73<br />
Return to TOC
FINANCIAL<br />
GUIDELINES<br />
FY <strong>2011</strong>-<strong>12</strong><br />
CITY OF GLENDALE, AZ<br />
PRELIMINARY<br />
ANNUAL BUDGET<br />
BOOK
FINANCIAL GUIDELINES<br />
Five-Year Forecast<br />
FIVE-YEAR FORECAST<br />
INTRODUCTION<br />
Glendale’s <strong>annual</strong> and long range <strong>budget</strong>ing process is shaped and guided by the three key<br />
foundation documents contained within the Annual Budget. They are the City <strong>of</strong> Glendale’s<br />
Five-Year Forecast, Financial Plan and Financial Policies. Together these documents help the<br />
City Council ensure that, regardless <strong>of</strong> changing economic times, <strong>city</strong> government has the<br />
financial stability and economic resources it needs to provide essential services and maintain<br />
Glendale’s high quality <strong>of</strong> life in future years.<br />
This section focuses on the General Fund (GF) given the extent <strong>of</strong> GF operations. Nevertheless,<br />
much <strong>of</strong> what is discussed in this section also applies to <strong>city</strong> operations that are not directly<br />
supported by GF revenues, such as the enterprise and special revenue fund operations.<br />
WHY DO WE DO FORECASTS?<br />
Forecasting is such an automatic part <strong>of</strong> our lives that most <strong>of</strong> us do it every day without giving<br />
the process much conscious thought. For example, if you drive to work, you will make many<br />
assumptions and predictions about how various factors will affect the length <strong>of</strong> time it will take<br />
to make the trip. These activities are the most basic elements <strong>of</strong> the forecasting process.<br />
From past experience, you can reasonably predict how long the trip takes under normal<br />
circumstances assuming you drive at the legal speed limit and meet all traffic requirements such<br />
as red lights and stop signs. You might adjust your travel forecast and leave home a little earlier<br />
on Mondays when traffic is usually heavier, or if it is raining, or you have to pick up a co-worker<br />
on that particular day. You might factor in some extra time for unanticipated but common events<br />
such as a traffic accident, a closed freeway lane on your route or other events that might slow<br />
your progress and increase your travel time.<br />
Once you are on the road, you will be continually fine-tuning your forecast. As you drive you<br />
might look ahead to the short-term future, checking the progress <strong>of</strong> the cars in front <strong>of</strong> you, and<br />
periodically changing traffic lanes to stay on your projected schedule. You might also look a<br />
little further into the future, to the next traffic light or the freeway on-ramp. If the access ramp<br />
looks too congested, you might decide to alter your route to avoid a possible freeway backup.<br />
Continuous monitoring and fine-tuning adjustments are also characteristic <strong>of</strong> the <strong>budget</strong><br />
forecasting process.<br />
If past experiences, assumptions and predictions regarding future events were reasonably<br />
accurate, resulting in a reliable forecast, you should expect to arrive at work on time. However,<br />
even with the best information and forecasting tools, there may be rough spots in the road—those<br />
unknown or uncontrollable variables that can never be predicted in advance. For instance, your<br />
actual versus forecast results will be very different if, when you try to start your car in the<br />
morning, you discover the battery is dead.<br />
74<br />
Return to TOC
FINANCIAL GUIDELINES<br />
Five-Year Forecast<br />
Forecasting our individual, daily routines is relatively simple. However, forecasting becomes<br />
increasingly difficult as goals and objectives become more varied and complex, and less reliable<br />
as the forecast period lengthens. The number <strong>of</strong> and potential for unpredictable events and<br />
uncontrollable variables also becomes much greater. For example, it is harder to forecast for a<br />
vacation next year than to forecast your daily trip to work. It is harder still to plan for that<br />
vacation in a way that will not have a negative effect on other, longer-range objectives, such as<br />
saving enough money to purchase a home in five years.<br />
Most cities go through this type <strong>of</strong> forecasting process on a much grander scale, using more<br />
sophisticated tools to evaluate their current status in relation to their short and long-range goals<br />
and objectives. They also make predictions about how future events and circumstances will or<br />
may affect their financial stability.<br />
THE CITY’S FORECAST<br />
The Five-Year Forecast is guided by City Council’s continued vision <strong>of</strong> ‘one community’ and<br />
the supporting strategic goals and key objectives. The Management and Budget Department<br />
updates the forecast each year to adjust for changes in national and local economic conditions<br />
and trends, changes in Council priorities and policies, and other variables that might affect the<br />
<strong>city</strong>’s ability to provide needed services and maintain its financial integrity in future years.<br />
Consequently, the Five-Year Forecast identifies the direction in which the <strong>city</strong> is headed based<br />
on information known at the time it is updated for the <strong>annual</strong> <strong>budget</strong> document.<br />
The forecasting process is continuous, with fine-tuning adjustments made each year as part <strong>of</strong> the<br />
normal <strong>budget</strong>ing process. Forecasting is one <strong>of</strong> the most powerful tools we have available to<br />
help us make informed decisions, based on available information, to ensure the <strong>city</strong>’s future<br />
vitality and economic stability.<br />
Shifts in demographics, economic conditions, and societal values impact how the <strong>city</strong> operates.<br />
This is especially notable in growing communities such as Glendale, where the City must<br />
continually assess its ability to support existing services and address new service needs well into<br />
the future. By evaluating important trends and economic conditions included in long-range<br />
forecasting models, the City is better able to gauge its ability to provide essential services over<br />
an extended period <strong>of</strong> time.<br />
LONG RANGE FORECASTING MODELS<br />
In order to provide the most accurate and timely data, the Management and Budget Department<br />
uses a long-range forecasting model for the GF. The model is updated and refined each year<br />
before the <strong>city</strong>’s <strong>annual</strong> <strong>budget</strong>ing process begins. Similar forecasts and rate setting models are<br />
used for the enterprise funds. These models are used to calculate the likely financial effects <strong>of</strong><br />
changing internal and external conditions on the <strong>city</strong>’s fund balances over a five-year period.<br />
75<br />
Return to TOC
FINANCIAL GUIDELINES<br />
Five-Year Forecast<br />
The GF financial projection in the upcoming five-year period is based on a number <strong>of</strong><br />
meaningful economic and demographic factors, as well as a series <strong>of</strong> assumptions about expected<br />
operational needs. The local economic outlook is largely based on expert forecasts from<br />
economists at the Economic & Business Research Program at the University <strong>of</strong> Arizona, JP<br />
Morgan Chase Economy Outlook Center, the L. William Seidman Research Institute at Arizona<br />
State University and the Joint Legislative Budget Committee at the State <strong>of</strong> Arizona.<br />
Glendale’s forecasting model is made up <strong>of</strong> three primary components: the revenue module, the<br />
expenditure module and the fund summary module. Whenever new data is entered into each<br />
module, the modeling program generates updated fiscal projections. The enterprise fund models<br />
include many <strong>of</strong> the same components. However, because an enterprise fund is a self-contained<br />
business unit, these models incorporate all capital costs, debt service requirements, fixed asset<br />
information and customer data for the specific funds.<br />
Glendale’s forecasting models enable staff to provide City Council and executive leadership with<br />
the results <strong>of</strong> “what-if” scenarios. These “what-if” scenarios in the revenue and cost modules<br />
help generate estimates with likely short-term and long-term financial consequences and overall<br />
fund balances. As with all financial models, the projections are defined by the specific criteria<br />
and assumptions used and the respective limitations associated with both. Nevertheless, the<br />
<strong>city</strong>’s forecasting models have been successfully used to explore questions such as:<br />
• How will current national and local economies affect the <strong>city</strong>'s operating <strong>budget</strong> and fund<br />
balances?<br />
• Can a new service or program that will increase our ongoing costs be added to the<br />
operating <strong>budget</strong> without jeopardizing basic service levels in future years?<br />
• What long-term costs are associated with changes in employee pay and benefit-related<br />
policies?<br />
HOW ARE REVENUES AND EXPENDITURES ESTIMATED?<br />
In order to achieve the most reasonable projections for anticipated revenues and expenditures,<br />
income and expense categories are analyzed using the most appropriate methodology for each<br />
category. Management and <strong>budget</strong> staff considers all applicable limitations and requirements in<br />
projecting each individual revenue and expense source. One or more <strong>of</strong> the following factors<br />
may play an important role in developing revenue and expenditure forecasts.<br />
Legal or Mandated Requirements<br />
Some revenue and expense categories are defined by specific legal requirements or restrictions.<br />
For example, state statutes place restrictions on the primary property tax levy—the total amount<br />
collected—and therefore affects the primary property tax rate charged on property in Glendale.<br />
Department Staff Estimates<br />
Management and <strong>budget</strong> staff asks departments to identi<strong>fy</strong> key future staffing needs to<br />
accommodate population growth and related equipment costs that will affect the operating<br />
<strong>budget</strong> over the next five years. A strong emphasis is placed on the operating impacts associated<br />
76<br />
Return to TOC
FINANCIAL GUIDELINES<br />
Five-Year Forecast<br />
with new capital projects scheduled to come on line over the forecast period. The experience<br />
and expertise <strong>of</strong> department managers also are crucial for accurately projecting expected<br />
revenues from sources such as inspection fees, building permits and court fees.<br />
Statistical Analysis<br />
Linear regression and other statistical methods are used to refine prediction results. For example,<br />
regression analysis showed that historical data on Arizona per capita disposable income is a<br />
reliable indicator for projecting <strong>city</strong> sales tax revenues. Staff uses other factors such as Glendale<br />
population growth, Arizona’s rate <strong>of</strong> growth in employment, inflation for urban areas <strong>of</strong> the<br />
western United States (the Consumer Price Index or CPI), growth in Glendale’s primary assessed<br />
valuation and Glendale’s actual collections for various revenue sources over the past 5-10 years.<br />
Causally Related Formulas<br />
Specific <strong>city</strong> revenues and expenses are directly affected by demographic and economic factors<br />
such as local population growth and commercial and residential development. For example,<br />
population growth is almost always accompanied by an increase in <strong>city</strong> and state sales tax<br />
revenue, as well as an increased demand for services and additional infrastructure improvements.<br />
Balanced Budget Requirement<br />
Arizona state law and Glendale <strong>city</strong> financial policies require that each <strong>annual</strong> <strong>city</strong> <strong>budget</strong> be a<br />
balanced <strong>budget</strong>. This means that within the forecast period expenditures cannot exceed<br />
unrestricted revenue resources.<br />
Furthermore, <strong>city</strong> policy recommends the maintenance <strong>of</strong> a specific level <strong>of</strong> contingency<br />
appropriation—equal to 10% <strong>of</strong> the <strong>city</strong>’s GF revenue <strong>budget</strong> for the upcoming fiscal year—and<br />
the funds to back that appropriation, for emergencies and unanticipated expenses. This<br />
requirement provides the <strong>city</strong> with a cushion to <strong>of</strong>fset unexpected shortfalls in revenue caused by<br />
an economic downturn, or other unexpected events, that may occur in any given year.<br />
GF EXPENDITURE FORECAST<br />
In order to develop a comprehensive Five-Year Forecast, assumptions must be made about a<br />
number <strong>of</strong> complex and <strong>of</strong>ten uncontrollable cost and revenue variables. These assumptions<br />
include, but are not limited to, the present and future condition <strong>of</strong> the economy, population<br />
growth rates and changes in federal, state and local policies that may affect municipal operations.<br />
In addition, the ongoing costs <strong>of</strong> prior commitments to provide services, and the ongoing costs<br />
for new capital facilities under construction, must be considered.<br />
The quality and reliability <strong>of</strong> the long-range forecast are largely dependent upon the accuracy <strong>of</strong><br />
the cost and revenue assumptions used in the forecast. This section and the following section<br />
(GF Revenue Forecast) provide explanations <strong>of</strong> the key assumptions employed in the current GF<br />
forecasting model, as well as the key issues that underlie the GF forecast.<br />
77<br />
Return to TOC
FINANCIAL GUIDELINES<br />
Five-Year Forecast<br />
INFLATION RATES<br />
Inflation has a major impact on all <strong>city</strong> revenues and expenditures. Salaries, supplies, equipment<br />
and contracted services are all subject to inflationary pressures. Therefore, the cumulative<br />
effects <strong>of</strong> general inflation are considered in the forecasting process.<br />
Because good historical data is available, and the Western Region Consumer Price Index for<br />
Urban Users (CPI-U) is adjusted for regional influences, the forecast model relies on this source<br />
<strong>of</strong> inflation data. The CPI-U assesses consumer patterns by judging the cost <strong>of</strong> a theoretical<br />
“market basket” <strong>of</strong> goods using a specific base year and comparing it with future years. In terms<br />
<strong>of</strong> real purchasing power, $103.60 in goods purchased in 1984 would cost approximately<br />
$221.20 in 2010, an increase <strong>of</strong> 113.52%.<br />
The following table shows the historical percentage increase in the CPI-U since 1984 as reported<br />
by the U.S. Department <strong>of</strong> Labor, Bureau <strong>of</strong> Labor Statistics.<br />
CPI - Urban Users (Western Region)<br />
Year Index % Increase Year Index % Increase Year Index % Increase<br />
1984 103.6 Base Year 1995 153.5 2.61% 2006 205.7 3.42%<br />
1985 108.0 4.25% 1996 157.6 2.67% 2007 2<strong>12</strong>.2 3.17%<br />
1986 110.5 2.31% 1997 161.4 2.41% 2008 219.6 3.49%<br />
1987 114.3 3.44% 1998 164.4 1.86% 2009 218.8 -0.38%<br />
1988 119.0 4.11% 1999 168.9 2.74% 2010 221.2 1.09%<br />
1989 <strong>12</strong>4.6 4.71% 2000 174.8 3.49% Jan '11 223.1 0.88%<br />
1990 131.5 5.54% 2001 181.2 3.66% Feb '11 224.4 0.57%<br />
1991 137.3 4.41% 2002 184.7 1.93% 1984 - 2010 Total 113.52%<br />
1992 142.0 3.42% 2003 188.6 2.11% 1984 - 2010 Avg 2.97%<br />
1993 146.2 2.96% 2004 193.0 2.33% 2003 - 2010 Total 17.29%<br />
1994 149.6 2.33% 2005 198.9 3.06% 2003 - 2010 Avg 2.29%<br />
The average <strong>annual</strong> inflation rate has been averaging about 2.97% since 1984. From 2003 to<br />
2010, the average inflation rate has been lower, averaging 2.29%. 2009 marked the first time<br />
since 1984 that the average inflation rate declined year over year. However, that trend was short<br />
lived as 2010 say an increase <strong>of</strong> 1.09% from 2009. During the first two months <strong>of</strong> <strong>2011</strong>, the<br />
inflation factors increased by .88% and .57%, meaning that when the first two months <strong>of</strong> the year<br />
are combined they already surpass the percentage increase we saw in all <strong>of</strong> 2010.<br />
POPULATION CHANGES<br />
Arizona experienced rapid population growth over the past two decades. Glendale’s population<br />
was no exception as it almost doubled over 20 years, from 117,348 residents in 1984, to<br />
approximately 233,281 residents in 2004—a 99% increase. Population growth leveled <strong>of</strong>f from<br />
the high growth experienced in the 1990s and the early years <strong>of</strong> the current decade given that the<br />
2005 – 2009 average <strong>annual</strong> increase was a more moderate 1.39%. In 2010, the census figures<br />
78<br />
Return to TOC
FINANCIAL GUIDELINES<br />
Five-Year Forecast<br />
released for the <strong>city</strong> were much lower than projected. The current population is estimated at<br />
226,721 which is a 9.24% decrease from the 2009 figure. This loss in population had an adverse<br />
impact on our state-shared revenues that are distributed based on a proportion <strong>of</strong> population.<br />
The following table shows the historical and projected population growth and percentage<br />
increases for years 1984 through 2016, measured as <strong>of</strong> the beginning <strong>of</strong> the fiscal year. The data<br />
included in the table was supplied by the Glendale Planning Department.<br />
City <strong>of</strong> Glendale Population at Start <strong>of</strong> Fiscal Year<br />
Year Population % Increase Year Population % Increase<br />
1984 117,348 4.49% d 2000 218,8<strong>12</strong> 5.15%<br />
a 1985 <strong>12</strong>2,392 4.30% 2001 224,703 2.69%<br />
1986 <strong>12</strong>7,486 4.16% 2002 227,763 1.36%<br />
1987 132,581 4.00% 2003 231,288 1.55%<br />
1988 137,675 3.84% 2004 233,281 0.86%<br />
1989 142,769 3.70% e 2005 242,369 3.90%<br />
b 1990 148,134 3.76% 2006 243,737 0.56%<br />
1991 151,558 2.31% 2007 246,396 1.09%<br />
1992 155,916 2.88% 2008 248,745 0.95%<br />
1993 161,688 3.70% 2009 249,811 0.43%<br />
1994 168,874 4.44% f 2010 226,721 -9.24%<br />
c 1995 182,615 8.14% * <strong>2011</strong> 229,468 1.21%<br />
1996 186,500 2.13% * 20<strong>12</strong> 231,763 1.00%<br />
1997 191,6<strong>12</strong> 2.74% * 2013 234,080 1.00%<br />
1998 196,820 2.72% * 2014 236,421 1.00%<br />
1999 208,095 5.73% * 2015 238,785 1.00%<br />
* 2016 241,173 1.00%<br />
Notes:<br />
a 1985 Special Census e 2005 Special Census (September 1)<br />
b 1990 Census<br />
f 2010 Census<br />
c 1995 Special Census - includes Luke AFB * Projected Population Figures<br />
d 2000 Census<br />
All population counts and estimates from 1995 forward include Luke AFB<br />
EMPLOYEE SALARY ADJUSTMENTS<br />
The forecasting models are normally programmed to include pay range or “market” adjustments<br />
for <strong>city</strong> employees. With the guidance <strong>of</strong> the Human Resources Department, Council sets a<br />
target <strong>of</strong> providing a pay range adjustment that is based on a market survey <strong>of</strong> other Valley cities<br />
and therefore may vary depending on whether a job classification is below market, at market or<br />
above market. Prior to the implementation <strong>of</strong> this practice a few years ago, the pay range<br />
adjustment was tied solely to the consumer price index and the western region inflation rate.<br />
79<br />
Return to TOC
FINANCIAL GUIDELINES<br />
Five-Year Forecast<br />
Pay range adjustments and merit increases are not automatically given to non-step plan<br />
employees. Council must specifically approve merit and/or pay range adjustments for non-step<br />
plan employees for the upcoming fiscal year as part <strong>of</strong> the <strong>budget</strong> development process. Both<br />
increases are also based on the <strong>city</strong>’s ability to pay in any given year. For FY 20<strong>12</strong>, no pay<br />
increases are included in the forecast. In fact, a two and a half percent reduction in base salary<br />
has been included in the forecast through the use <strong>of</strong> 52 hours <strong>of</strong> mandatory furlough (equivalent<br />
to 6.5 eight-hour work days) as recommended by management and approved by Council.<br />
For FY 2006, City Council approved new pay plans for both police and fire sworn personnel to<br />
ensure we obtain the most highly qualified staff to provide public safety services to our<br />
residential and business communities. They are called “step plans” and apply to sworn positions<br />
not classified as managerial. These pay plans are based upon years <strong>of</strong> service, or steps, and merit<br />
increases are automatic as the employee completes each year <strong>of</strong> service within the <strong>city</strong>. In<br />
addition, public safety personnel representatives meet with the <strong>city</strong> manager each year to discuss<br />
other employment issues. Any changes in employee compensation derived from these meetings<br />
are incorporated into the <strong>annual</strong> <strong>budget</strong> through an agreed upon memorandum <strong>of</strong> understanding.<br />
During the course <strong>of</strong> FY <strong>2011</strong>, an addendum to the two-year Memorandum <strong>of</strong> Understanding<br />
with the police and fire represented groups was reached that identified reductions in step plan<br />
deferred compensation. The Police and Fire Departments agreed to eliminate half <strong>of</strong> their<br />
deferred compensation in FY 20<strong>12</strong>. These measures were made in good faith by the respective<br />
departments in working together with the <strong>city</strong> manager and were a key component in the FY<br />
20<strong>12</strong> balanced <strong>budget</strong>.<br />
In addition, the <strong>city</strong>’s performance management system works on the basis <strong>of</strong> merit increases,<br />
typically in 4% or 5% increments, for those who receive “meets” or “exceeds expectations” on<br />
their respective <strong>annual</strong> performance evaluations. As mentioned previously, these increases are<br />
not included in the FY 20<strong>12</strong> <strong>budget</strong> nor are they included in the Five-Year Forecast. However,<br />
in normal years employees that fall into these categories would receive a merit increase based<br />
upon their performance evaluation. As in previous years, if an employee “does not meet<br />
expectations” that employee would not receive a merit increase. This methodology covers all<br />
employees not included in the public safety step plans.<br />
EXPECTED CHANGES TO EXPENDITURES<br />
The identification <strong>of</strong> issues and concerns that will affect the overall cost <strong>of</strong> providing the high<br />
quality services that our citizens have come to expect is a critical part <strong>of</strong> the forecasting process.<br />
For example, residential and commercial growth and aging infrastructure are critical cost factors<br />
that warrant careful consideration during the forecasting process. New residential and<br />
commercial development and the maintenance <strong>of</strong> existing infrastructure will continue to<br />
challenge our ability to expand, sustain and improve existing levels <strong>of</strong> service in future years.<br />
The City <strong>of</strong> Glendale approved an increase in the dedicated Public Safety Sales Tax from 1/10 th<br />
<strong>of</strong> one cent to one-half <strong>of</strong> one cent in order to accelerate the enhancement <strong>of</strong> public safety<br />
80<br />
Return to TOC
FINANCIAL GUIDELINES<br />
Five-Year Forecast<br />
services for the community. This new tax was approved by the voters in September 2007 and<br />
became effective November 2007. Public safety is using this funding to implement their needs<br />
assessments as additional funds from the tax become available. In addition to these funds, the<br />
GF will continue to support public safety operations based upon Council direction.<br />
VEHICLE/TECHNOLOGY REPLACEMENT FUNDS<br />
These replacement funds were designed to allow the <strong>city</strong> to replace outdated, or worn out<br />
equipment at regular intervals. The Field Operations and Information Technology Departments<br />
are the administrators <strong>of</strong> the vehicle and technology replacement programs, respectively.<br />
Due to the economic downturn that began in late 2001, GF contributions to these funds were<br />
halted for seven months in FY 2003, and for all <strong>of</strong> FY 2004, for a total <strong>of</strong> nineteen months. (The<br />
enterprise funds continued to pay into these replacement funds at the 100% level and continued<br />
to receive regularly scheduled replacements.) GF contributions were phased in as follows:<br />
• at the 50% level in FY 2005 (half in ongoing funds and half in one-time funds),<br />
• at the 75% in FY 2006 (50% ongoing and 25% one-time), and<br />
• at the 100% in FY 2007 (75% ongoing and 25% one-time), and<br />
• at the 100% in FY 2008 (75% ongoing and 25% one-time).<br />
However, for FY 2009, the funding level was once again lowered to 75% (50% ongoing and<br />
25% one-time) and the FY 2010 and FY <strong>2011</strong> GF contributions will remain at the 50% ongoing<br />
level. In FY 20<strong>12</strong>, the GF contributions will be decreased another 10%, bringing the overall GF<br />
contribution rate to 40%. This reduction in the GF contribution level was needed to fund other<br />
critical items identified in the <strong>city</strong> manager’s recommended balanced <strong>budget</strong> such as electric rate<br />
increases. Other measures that have been implemented regarding the replacement funds include<br />
the following:<br />
• Non-public safety technology, vehicles and equipment will have their useful lives<br />
extended where appropriate until the GF contribution level can be built back into the<br />
<strong>budget</strong>.<br />
• A <strong>city</strong>-wide motor pool was developed that required departments with vehicles that had<br />
low mileage or utilization to be returned for <strong>city</strong>-wide use on a first come, first serve,<br />
sign-in and sign-out basis.<br />
• The technology replacement fund will only replace the computer monitors when they<br />
break or malfunction as monitors will no longer be replaced automatically with the<br />
scheduled replacement <strong>of</strong> the computer central processing unit.<br />
DEBT SERVICE OBLIGATIONS<br />
The forecast includes the scheduled increases and decreases in capital lease debt service<br />
payments associated with capital equipment and land purchases. The capital lease debt service<br />
payments are included in the departmental operating <strong>budget</strong>s. Refer to Schedule 8 at the back <strong>of</strong><br />
81<br />
Return to TOC
FINANCIAL GUIDELINES<br />
Five-Year Forecast<br />
this <strong>budget</strong> <strong>book</strong> for a complete listing <strong>of</strong> the capital lease debt service for the <strong>city</strong>’s various<br />
funds.<br />
The forecast also includes changes in existing, long-term Municipal Property Corporation (MPC)<br />
debt service financings associated with the new regional public safety training facility,<br />
infrastructure improvements for the Zanjero development, and the new convention center/media<br />
center/parking garage facilities at the Westgate development.<br />
Public Facilities Corporation (PFC) debt service associated with the new Camelback Ranch<br />
Spring Training Baseball Complex had a significant impact on FY 2013 thru FY 2016 <strong>of</strong> the<br />
forecast period. Capitalized interest was used to make the initial debt services payments after the<br />
complex opened. FY 2013 forward will mark the first year that a full payment is required. The<br />
payment ranges from $13 million to $18 million each year. Refer to Schedule 7 for a detailed<br />
listing <strong>of</strong> the current principal and interest payments related to the City’s existing debt service<br />
agreements at the time the <strong>annual</strong> <strong>budget</strong> document was produced.<br />
GENERAL FUND REVENUE FORECAST<br />
The local and national economy has changed significantly over the past year. In the spring <strong>of</strong><br />
2008 we knew the housing market was in flux as a new equilibrium point between buyers and<br />
sellers was being established. Credit also had tightened for consumers and, to some extent, the<br />
business community. Business investment had slowed but not stopped. While these conditions<br />
were present, they were not pervasive and had not significantly impacted Glendale’s sales tax<br />
collections.<br />
These national conditions deteriorated rapidly during the summer and fall <strong>of</strong> 2008 and continued<br />
into 2009 as the credit markets froze for consumers and businesses resulting in a precipitous<br />
decline in business investment and consumer spending. Then the ranks <strong>of</strong> the unemployed began<br />
to grow and have continued to swell into the spring <strong>of</strong> 2010. All <strong>of</strong> this meant that revenue<br />
growth was unlikely, so the FY <strong>2011</strong> revenue <strong>budget</strong> was essentially flat year over year.<br />
For the local economy, the impact <strong>of</strong> the current recession is reflected in Glendale’s sales tax<br />
collections. Through February <strong>2011</strong>, <strong>city</strong> and state sales tax collections, which comprise over<br />
one-half <strong>of</strong> the current fiscal year’s General Fund (GF) revenue <strong>budget</strong>, receded to levels last<br />
experienced in FY 2005. The good news is that these revenue collections are slightly better than<br />
<strong>budget</strong> through February <strong>2011</strong>. This information, coupled with the fact that housing prices have<br />
leveled <strong>of</strong>f and national earnings reports <strong>of</strong> leading companies are starting to turn around, allowed<br />
the <strong>city</strong> to build a modest 2.7% increase in <strong>city</strong> sales tax collections for FY 20<strong>12</strong>.<br />
The following graph provides historical data as well as projections for the major revenues sources<br />
<strong>of</strong> the GF. The graph also includes highway user revenues fees, commonly known as HURF<br />
monies. The graph illustrates the relative importance <strong>of</strong> <strong>city</strong> sales tax and state-shared revenues<br />
82<br />
Return to TOC
FINANCIAL GUIDELINES<br />
Five-Year Forecast<br />
in comparison to our overall GF revenue base. These main revenue sources have comprised<br />
between two-thirds and three-fourths <strong>of</strong> the GF ongoing revenue since FY 2002, and they are<br />
expected to continue to do so for foreseeable future. The other notable GF revenue sources<br />
include various fees (municipal court, user fees and charges for <strong>city</strong> services like building<br />
inspections, plan reviews, recreation classes, etc.), the primary property tax and a category called<br />
“other” (interest income, <strong>city</strong> property rental income, bond/lease proceeds, staff/admin chargebacks<br />
and miscellaneous revenues).<br />
$200,000<br />
General and Streets Funds<br />
Summary <strong>of</strong> Major Revenue Sources<br />
In Thousands ($000's)<br />
$150,000<br />
$100,000<br />
$50,000<br />
$0<br />
'07 '08 '09 '10 '11 '<strong>12</strong> '13 '14 '15 '16<br />
Other Fees HURF Prim Prop Tax State Shared City Sales Tax<br />
City Sales Tax<br />
City sales tax is “elastic” revenue, meaning it varies directly with the economy. During times <strong>of</strong><br />
economic expansion, elastic tax revenues increase, due to higher levels <strong>of</strong> consumer spending.<br />
During an economic downturn, the opposite is true and tax revenue levels decline. City sales tax<br />
receipts comprise 37.4% <strong>of</strong> the <strong>city</strong>’s GF revenue <strong>budget</strong> for FY 20<strong>12</strong> (including HURF). This<br />
percentage is projected to remain stable for the forecast period, fluctuating between 37.1% and<br />
38.1%.<br />
City sales tax for the forecast period is projected using a combination <strong>of</strong> econometric modeling<br />
and formula calculations. The Management and Budget Department obtains its initial projection<br />
from a linear regression model, using state disposable personal income as a primary variable.<br />
The resulting figures are modified to account for other key variables directly related to the <strong>city</strong>.<br />
For example, since increased employment is usually accompanied by a rise in consumer and<br />
business purchasing volume and therefore increased sales tax revenue, Maricopa County’s fiveyear<br />
employment growth estimate is incorporated into the <strong>city</strong>’s sales tax forecasting model.<br />
83<br />
Return to TOC
FINANCIAL GUIDELINES<br />
Five-Year Forecast<br />
The growth rate for <strong>city</strong> sales tax collections declined from $63.6 million in FY 2007 to $50.6<br />
million in FY 2010, or 20%. The revised FY <strong>2011</strong> <strong>city</strong> sales tax revenue projection is essentially<br />
flat with FY 2010 coming in $50.5 million. However, FY 20<strong>12</strong> includes a modest increase <strong>of</strong><br />
2.7% with the remaining years in the forecast period fluctuating between 3.5% and 5.1%. This<br />
expectation is based on the continued expansion <strong>of</strong> Glendale’s sports, entertainment, <strong>of</strong>fice and<br />
retail destination area, and the continued attraction <strong>of</strong> diverse job growth industries to the <strong>city</strong>. It<br />
also is based on the expected growth in Arizona’s population and disposable personal income as<br />
projected by various experts on the Arizona economy.<br />
The graph below provides a historical look at <strong>city</strong> sales tax revenue, as well as the projected<br />
revenues for <strong>city</strong> sales tax over the forecast period.<br />
70,000<br />
City Sales Tax Revenue<br />
In Thousands ($000's)<br />
60,000<br />
50,000<br />
40,000<br />
30,000<br />
'07 '08 '09 '10 '11 '<strong>12</strong> '13 '14 '15 '16<br />
Actual<br />
Projected<br />
State-Shared Revenue<br />
Cities and towns in Arizona are beneficiaries <strong>of</strong> a state-shared revenue program that distributes<br />
state-collected revenues to Arizona municipalities. State-shared revenues in this document<br />
specifically refer to state sales tax, state income tax and motor vehicle in-lieu receipts. State<br />
shared revenue receipts comprise about 31.1% or $44.3 million <strong>of</strong> the <strong>city</strong>’s GF revenue <strong>budget</strong><br />
for FY 20<strong>12</strong>. This is a precipitous drop from the 39.5% level or $64.4 million that was collected<br />
in FY 2009. The forecast period assumes a percentage between 31.1% and 33.8% over the<br />
forecast period due to a decrease in Glendale’s population figures coupled with increases in<br />
population growth <strong>of</strong> other outlying valley cities. This revenue source is projected to rebound by<br />
$4.6 million in FY 2013 and total $48.9 million due primarily to a projected increase in state<br />
income tax receipts. The projection for FY 2014 through FY 2016 is for more modest growth<br />
averaging $2.1 million per year.<br />
84<br />
Return to TOC
FINANCIAL GUIDELINES<br />
Five-Year Forecast<br />
The forecast for each state revenue source is developed separately and compared to the state’s<br />
forecast for these revenue sources. State income tax projections are based on a trend forecast<br />
and adjusted for the revenue actually collected by the state as its distribution to the cities lags by<br />
two years. Forecasts done by Arizona economists, who use projected state personal income<br />
growth as a key variable, are also considered in the development <strong>of</strong> our projections. State sales<br />
tax estimates are based on a model similar to the <strong>city</strong> sales tax forecast. The forecast model<br />
assumes that the motor vehicle in-lieu will increase at its historic rate.<br />
The average <strong>annual</strong> growth rate for state shared revenue collections was 8.9% between FY 2005<br />
and FY 2008. In the next three fiscal years, the average growth rate decreased by 8.9% (FY<br />
2009 – FY <strong>2011</strong>) and is projected to decrease by another 11.1% in FY 20<strong>12</strong> before rebounding in<br />
FY 2013. State-shared revenues are directly affected by the economic climate as well as<br />
legislative changes such as income tax rate reductions and/or adjustments to distribution<br />
formulas – both <strong>of</strong> which have occurred over the last several years. The forecast assumes an<br />
<strong>annual</strong> average growth rate <strong>of</strong> 5.7% in FY 2013 - FY 2016 as the national economy rebounds.<br />
70,000<br />
State-Shared Revenue Summary<br />
In Thousands ($000's)<br />
60,000<br />
50,000<br />
40,000<br />
30,000<br />
'07 '08 '09 '10 '11 '<strong>12</strong> '13 '14 '15 '16<br />
Actual<br />
Projected<br />
Property Tax<br />
Arizona’s property tax levy consists <strong>of</strong> two tiers. The primary property tax levy has statemandated<br />
maximum limits, but it can be used by a <strong>city</strong> for any lawful purpose. It is the primary<br />
property tax revenue that is included in the GF. The secondary property tax is an unlimited levy<br />
that can be used only to pay the principal, interest and redemption charges on bonded<br />
indebtedness or other lawful long-term obligations that are issued or incurred for a specific<br />
capital purpose.<br />
85<br />
Return to TOC
FINANCIAL GUIDELINES<br />
Five-Year Forecast<br />
Primary property tax revenue is a relatively small revenue source for the GF as it comprises only<br />
2.1% <strong>of</strong> the total, or $2.9 million for FY 20<strong>12</strong>. This percentage <strong>of</strong> the total is a slight decrease<br />
from the 2.3% rate experienced from FY 2007 to FY <strong>2011</strong>. The <strong>city</strong>’s property tax projection<br />
must consider the rate <strong>of</strong> growth in assessed valuation, the assessment ratios for different types<br />
<strong>of</strong> property, and the components <strong>of</strong> growth associated with new properties as well as<br />
appreciation <strong>of</strong> existing properties. Property tax revenue can be challenging to predict because<br />
<strong>of</strong> the number and types <strong>of</strong> variables that affect this revenue source such as exemptions and<br />
assessment ratios, both <strong>of</strong> which are set by the Arizona Legislature. Nevertheless, the driving<br />
force in forecasting property tax revenue is the assessed valuation <strong>of</strong> property.<br />
For FY 20<strong>12</strong>, Glendale’s total property tax will remain unchanged at $1.5951. This rate is made<br />
up <strong>of</strong> the primary property tax rate <strong>of</strong> $0.2252 and the secondary property tax rate <strong>of</strong> $1.3699.<br />
The secondary property tax rate is not included in the GF revenue forecast.<br />
The Management and Budget Department analyzes historical property tax data to arrive at<br />
reasonable assumptions about long-range trends in assessed valuation. Despite Glendale’s<br />
historical growth in assessed valuation <strong>of</strong> the past several years, we know the current imbalance<br />
between supply and demand in the housing industry will take some time to right itself. Our<br />
projection includes a 21% decline in primary property tax revenue for FY 20<strong>12</strong>, followed by<br />
14% declines in each <strong>of</strong> FY 2013 and FY 2014. Modest increases in FY 2015 and FY 2016<br />
averaging 3% in primary property tax revenue round out the forecast period.<br />
5,000<br />
Primary Property Tax Revenue<br />
In Thousands ($000's)<br />
4,000<br />
3,000<br />
2,000<br />
1,000<br />
'07 '08 '09 '10 '11 '<strong>12</strong> '13 '14 '15 '16<br />
Actual<br />
Projected<br />
86<br />
Return to TOC
FINANCIAL GUIDELINES<br />
Five-Year Forecast<br />
Highway User Revenue Fees (HURF)<br />
This source is commonly referred to as the gasoline tax although there are several additional<br />
transportation-related fees that comprise this revenue, including a portion <strong>of</strong> vehicle license<br />
taxes. Overall, much <strong>of</strong> this revenue source is based on the volume <strong>of</strong> fuel sold rather than the<br />
price <strong>of</strong> fuel. The Arizona state constitution restricts the use <strong>of</strong> HURF revenue to street and<br />
highway purposes such as right-<strong>of</strong>-way acquisition, construction, reconstruction, maintenance,<br />
repair, and the payment <strong>of</strong> the interest and principal on HURF bonds.<br />
In the past, the Arizona Legislature has altered, and may in the future alter, (1) the type and/or<br />
rate <strong>of</strong> taxes, fees and charges to be deposited into the Arizona Highway Revenue Fund and (2)<br />
the allocation <strong>of</strong> such monies among the Arizona Department <strong>of</strong> Transportation, Arizona cities<br />
and counties and other purposes. In fact, the Arizona Legislature reduced the amount <strong>of</strong> funds<br />
allocated to cities for FY 2009.<br />
In FY <strong>2011</strong> the <strong>city</strong> expects to receive $13.6 million in HURF revenue, which is only a 1.3%<br />
decrease from FY 2010 but is 18.5% below FY 2008 levels. HURF revenues are projected to<br />
decline another 16.1% in FY 20<strong>12</strong> and they will comprise 8% or $11.4 million <strong>of</strong> GF revenue.<br />
This amount is expected to grow modestly to $11.8 million by the end <strong>of</strong> the forecast period.<br />
Given the uncertainty about the state’s FY 20<strong>12</strong> <strong>budget</strong> and the state <strong>of</strong> the economy, we have<br />
assumed a 0.8% average growth rate for the remainder <strong>of</strong> the forecast period. This conservative<br />
forecast is based on the assumption that consumers will continue to change their driving habits to<br />
smaller, more fuel efficient vehicles and to greater use <strong>of</strong> public transit as the price <strong>of</strong> fuel<br />
continues to escalate.<br />
Fees and Charges<br />
This category covers a variety <strong>of</strong> <strong>city</strong> fees and charges for <strong>city</strong> services such as building permits,<br />
right-<strong>of</strong>-way permits, construction plan check reviews, barricade fees, business and sales tax<br />
licenses, liquor licenses, fire fees, park and recreation fees, court fees and fines, library fees and<br />
fines, and fees related to planning and zoning issues. This category also includes revenues from<br />
cable, gas and electric franchise fees, income from the rental <strong>of</strong> <strong>city</strong> facilities, cemetery services<br />
and the miscellaneous category.<br />
Total projected fees and charges are expected to be $15.9 million in FY 20<strong>12</strong>, about 11.2% <strong>of</strong><br />
total GF revenue. By FY 2016, revenue from fees and charges is expected to grow to $17.1<br />
million. FY 20<strong>12</strong> revenue is projected to increase by 2.4% over the previous fiscal year, but the<br />
average growth rate for the remainder <strong>of</strong> the forecast period is 1.8%.<br />
Other Revenue<br />
This category includes interest income, capital lease proceeds, <strong>city</strong> rental income, general staff<br />
and administrative service charges and other miscellaneous or one time revenues, like the sale <strong>of</strong><br />
87<br />
Return to TOC
FINANCIAL GUIDELINES<br />
Five-Year Forecast<br />
land. Staff and administrative chargeback revenues comprise the largest component <strong>of</strong> the other<br />
revenue category.<br />
Departments whose operations are supported by the General Fund, such as the Finance, Human<br />
Resources, City Attorney, Management and Budget and Facilities Management Division <strong>of</strong> Field<br />
Operations, provide services to the <strong>city</strong>’s water/sewer, sanitation and landfill enterprise funds as<br />
well as the self-supporting Transportation Fund (supported by the transportation sales tax).<br />
These are services that enterprise fund operations would have to pay outside contractors to<br />
provide if <strong>city</strong> departments did not provide them. Consequently, each <strong>of</strong> the identified<br />
operations is required to pay its fair share <strong>of</strong> the cost for these services, which are called general<br />
staff and administrative service charges.<br />
The Management and Budget Department established these charges based on an indirect cost<br />
allocation model that uses various accepted allocation methods and is updated <strong>annual</strong>ly. The<br />
charges are applied against enterprise fund’s operating <strong>budget</strong> in equal amounts (i.e. 1/<strong>12</strong>) each<br />
month. The City Auditor’s Office reviewed the cost allocation model during FY 2005 to assess<br />
the validity and reasonableness <strong>of</strong> the model and determined it was a reasonable method to<br />
allocate GF costs. During FY 2009, the model was again evaluated but by an outside firm that<br />
performs audits <strong>of</strong> public sector entities. The FY 2009 evaluation found the model to be a<br />
reasonable and valid method for allocating GF costs, as well as a generally accepted <strong>budget</strong> and<br />
financing practice that cities and other government agencies commonly use.<br />
The total general staff and administrative service charges for FY 20<strong>12</strong> are $8.9 million and<br />
comprise about 60.8% <strong>of</strong> the “other” revenue category but only 10.2% <strong>of</strong> all GF revenue. This<br />
amount is anticipated to decline by 6.3% in FY 2013 and then grow by an average <strong>of</strong> 2.7% each<br />
year through the forecast period. The remaining $5.7 million or 39.2% <strong>of</strong> this revenue category<br />
is made up <strong>of</strong> interest, <strong>city</strong> property rental and miscellaneous income.<br />
NET REVENUES & EXPENSES<br />
The final step in completing the Five-Year Forecast is the comparison <strong>of</strong> the net effects <strong>of</strong> the<br />
projected revenues and expenses on the General and Streets Fund balances. Over the five-year<br />
period <strong>of</strong> this forecast, the <strong>city</strong>’s operating and capital <strong>budget</strong>s are balanced. However, due to<br />
the national economic downturn that we are experiencing the initial two years in the five-year<br />
forecast rely heavily on a combination <strong>of</strong> the use <strong>of</strong> fund balance reserves and cost reduction/cost<br />
saving measures to balance the <strong>budget</strong>.<br />
The <strong>city</strong> is well aware that use <strong>of</strong> remaining fund balance to maintain an ongoing program would<br />
significantly alter the long-range forecast and have a lasting impact on the capa<strong>city</strong> <strong>of</strong> the <strong>city</strong> to<br />
maintain projected levels <strong>of</strong> services in a balanced <strong>budget</strong> environment. Therefore, management<br />
and Council have pledged that future incremental ongoing revenues that come to the <strong>city</strong> as we<br />
exit the economic downturn will be used to cover existing ongoing base <strong>budget</strong> needs and the<br />
replenishment <strong>of</strong> fund balances/reserves before being applied to other areas.<br />
88<br />
Return to TOC
FINANCIAL GUIDELINES<br />
Five-Year Forecast<br />
CONCLUSION<br />
Long-range forecasting and modeling are powerful management and decision-making tools. A<br />
key objective in long-range forecasting is to estimate the future consequences <strong>of</strong> past and present<br />
decisions. The Five-Year Forecast process reminds us to lift our eyes from the road directly<br />
ahead, cast a glance in the rear-view mirror to see where we have been and take a look through<br />
the windshield into the future to assess where we are going.<br />
The current Five-Year Forecast indicates that if we continue to exercise fiscal discretion and<br />
restraint, examine carefully any projects that entail ongoing expenses, practice prudent fiscal<br />
management and remain conservative in our financial and strategic planning, we can continue to<br />
achieve the following:<br />
• Accomplish City Council’s strategic goals and objectives set for the <strong>budget</strong> year;<br />
• Maintain our quality <strong>of</strong> service commitments to Glendale residents in future years;<br />
• Ensure the <strong>city</strong>’s capa<strong>city</strong> to meet its future growth and infrastructure needs even in times<br />
<strong>of</strong> national economic uncertainty; and<br />
• Balance our <strong>annual</strong> <strong>budget</strong>s while retaining adequate contingency reserves.<br />
In order to go significantly beyond the commitments outlined earlier in this section, the <strong>city</strong><br />
would have to increase its revenue base by adding new revenue sources or experience betterthan-anticipated<br />
economic performance, and/or decrease its operating expenses by reducing or<br />
curtailing programs and services that the <strong>city</strong> currently provides.<br />
89<br />
Return to TOC
FINANCIAL GUIDELINES<br />
Financial Plan<br />
FINANCIAL PLAN<br />
INTRODUCTION<br />
The foundation for our FY 20<strong>12</strong> operating and capital <strong>budget</strong>s reflects Council’s vision <strong>of</strong> ‘one<br />
community.’ That foundation is supported by additional strategic goals and key objectives, as<br />
discussed in the Mayor’s and City Manager’s <strong>budget</strong> messages, including the continuation <strong>of</strong><br />
fiscally sound financial management practices. Glendale’s Financial Plan addresses the critical<br />
issues that must be addressed with each fiscal year’s <strong>budget</strong>, as well as the strategies that are<br />
used to sustain Council’s strategic goals while accommodating fluctuations in the economy.<br />
It is critical for a local government to respond quickly and comprehensively to changes in the<br />
political and economic environment so that <strong>city</strong> services are not compromised. The City <strong>of</strong><br />
Glendale engages in financial planning in order to avoid curtailing basic services or delaying<br />
needed infrastructure improvements when revenue sources are adversely affected. The<br />
following discussion highlights the principal issues facing the <strong>city</strong> (operating <strong>budget</strong> constraints)<br />
and the long-term and short-term key strategies for addressing the changing economic and<br />
political environment in which we operate.<br />
OPERATING BUDGET CONSIDERATIONS<br />
Operating Revenue Considerations<br />
A <strong>city</strong>’s ability to generate additional revenue from existing sources, or create new revenue<br />
sources, is limited by social and economic conditions, state statutes, City Council policies and<br />
public sentiment. Municipal tax rates and bonding (borrowing) capa<strong>city</strong> also are limited by state<br />
law and require citizen support and/or voter approval. In addition, some revenues are legally<br />
restricted and therefore must be used for specific purposes. Examples <strong>of</strong> special-purpose<br />
revenues include public safety and transportation sales tax revenues, highway user revenue fees<br />
(HURF), water, sewer, landfill, and sanitation user fees and development impact fees.<br />
The General Fund covers costs for essential <strong>city</strong> services like police, fire, parks/recreation,<br />
library services and neighborhood preservation, as well as critical support functions like<br />
financial and <strong>budget</strong> management services, human resources and legal services. Many <strong>city</strong><br />
departments must rely exclusively on General Fund revenues to finance their operating costs,<br />
whereas others receive a lesser amount <strong>of</strong> General Fund financial support.<br />
The <strong>city</strong>’s primary ongoing General Fund revenue sources are state-shared revenues and <strong>city</strong><br />
sales taxes. These sources typically account for approximately two-thirds to three-fourths <strong>of</strong> the<br />
<strong>city</strong>’s ongoing General Fund revenue <strong>budget</strong>. State-shared revenues and local sales tax revenues<br />
can be sensitive to changes in national, regional and local economic conditions. When the state<br />
and local economies are healthy, state-shared and <strong>city</strong> sales tax revenues normally increase.<br />
When the economy enters a downward cycle or recessionary period, these revenue sources could<br />
decline, although that is not always the case.<br />
90<br />
Return to TOC
FINANCIAL GUIDELINES<br />
Financial Plan<br />
State-shared revenues are comprised <strong>of</strong> state income tax and state sales tax revenues, as well as<br />
state motor vehicle licensing revenue. The state <strong>of</strong> Arizona distributes to incorporated towns and<br />
cities a portion <strong>of</strong> these state receipts based on each entity’s population in proportion to the<br />
state’s total population <strong>of</strong> incorporated areas. State-shared revenue is subject to fluctuation due<br />
to changes in the economic environment, as well as the political environment, as evidenced by<br />
prior legislative discussions to modi<strong>fy</strong> the amount <strong>of</strong> state-shared income tax revenue to be<br />
distributed to municipalities. For FY 20<strong>12</strong>, state-shared revenue is expected to be distributed in<br />
the same manner used for the FY <strong>2011</strong> distributions.<br />
For the most part, past reductions in state-shared revenue allocations have been the result <strong>of</strong><br />
negotiations between the state and the cities. In addition, past reductions occurred with state<br />
income tax revenue that provided Glendale and other cities sufficient time to plan for the<br />
reduction. Income tax revenue distribution to the cities lags by two years. This means the state<br />
income tax receipts for FY 20<strong>12</strong> will reflect the income tax the state collected in FY 2010<br />
Other sources <strong>of</strong> <strong>city</strong> revenue, such as property taxes, franchise fees, and development permits<br />
and fees, are also subject to external economic and political factors. For example, property tax<br />
revenues are dependent on total assessed valuation, appreciation <strong>of</strong> existing property, and the<br />
amount and type <strong>of</strong> new construction, as well as the property tax rate approved by Glendale’s<br />
City Council. State limits on property tax rates also constrain the use <strong>of</strong> this revenue source for<br />
General Fund operations. Therefore, we took a prudent approach to projecting these other<br />
revenues for FY 20<strong>12</strong>. A more detailed discussion <strong>of</strong> these other revenue sources and the<br />
projection for FY 20<strong>12</strong> is found in the Budget Revenue Summary section.<br />
Population Growth<br />
Arizona has experienced phenomenal growth in the past few decades. It is consistently rated in<br />
the top tier <strong>of</strong> the states experiencing the highest levels <strong>of</strong> growth in the nation. Growth in<br />
population is <strong>of</strong>ten accompanied by job growth, which is <strong>of</strong>ten a reflection <strong>of</strong> a healthy local and<br />
regional economy. A growing population tends to fuel consumer spending as homes are<br />
purchased, and consumer goods for those homes are bought. In addition, the state-shared<br />
revenues discussed in the previous section are based on a <strong>city</strong>’s population in comparison to the<br />
total population, so there is an unintended incentive to encourage population growth in order to<br />
receive more state-shared revenue.<br />
Nevertheless, growth is <strong>of</strong>ten a double-edged sword. Rapid and prolonged population growth<br />
places a great deal <strong>of</strong> strain on existing resources. This kind <strong>of</strong> population growth can make it<br />
difficult for the <strong>city</strong> to maintain current levels <strong>of</strong> services, repair and replace existing<br />
infrastructure as it ages and finance future growth-related needs. The <strong>city</strong> employs various<br />
financing strategies and mechanisms to equitably apportion the costs <strong>of</strong> growth among various<br />
sectors <strong>of</strong> the community, as well as among current and future Glendale residents. The financing<br />
strategies include bond financing, development impact fee assessments, and the creation <strong>of</strong><br />
improvement districts. These are discussed in more detail in the Ten-Year Capital Improvement<br />
Plan section.<br />
91<br />
Return to TOC
FINANCIAL GUIDELINES<br />
Financial Plan<br />
Large, expensive projects like recreation facilities, libraries, water and sewer treatment facilities,<br />
and public safety facilities require a long-term commitment <strong>of</strong> resources for ongoing operating<br />
costs <strong>of</strong> these new facilities. For these kinds <strong>of</strong> projects, the <strong>city</strong> staggers the opening <strong>of</strong> them in<br />
order to adequately absorb the additional operating costs that come with their operation. Also,<br />
Glendale prefers to use conservative population estimates in its planning process to ensure the<br />
revenues needed to operate the facility are available when the project is completed. When<br />
unusual growth occurs, the <strong>city</strong> has several short-term, rapid-impact strategies it can employ to<br />
accelerate the provision <strong>of</strong> services and/or infrastructure development.<br />
Routine Operating Expenses<br />
The cost associated with many routine operating necessities, such as utilities, are continuing to<br />
rise. While Glendale has taken a proactive approach to minimizing the impact <strong>of</strong> such cost<br />
increases, some level <strong>of</strong> cost escalation is inevitable in order to maintain a high level <strong>of</strong> service<br />
for the Glendale community. In developing the operating <strong>budget</strong>, these routine operating cost<br />
increases were at the top <strong>of</strong> the list <strong>of</strong> items that had to be addressed before allocating funds for<br />
other purposes.<br />
Capital Expense Considerations<br />
Large capital improvement projects take many years to plan, finance and complete. Funds for<br />
these projects <strong>of</strong>ten will be needed long before the number <strong>of</strong> residents moving into the area can<br />
support the construction costs although it might be several more years before population growth<br />
is sufficient to generate the revenue needed for ongoing operating expenses. Under virtually any<br />
population growth scenario, traditional bond financing and development impact fee revenues<br />
would be hard pressed to keep up with the normal demand for new or expanded streets, storm<br />
sewers, fire stations and other facilities.<br />
To meet the need for the construction <strong>of</strong> new capital facilities, Glendale has pursued some<br />
unique partnering arrangements to cover the capital costs. For example, Glendale partnered with<br />
the cities <strong>of</strong> Avondale, Surprise, and Peoria, as well as the Maricopa County Community College<br />
District, to enhance the function and value <strong>of</strong> the Glendale Regional Public Safety Training<br />
Facility that opened in FY 2007. The facility currently trains new fire recruits and both police<br />
and fire personnel conduct advanced training exercises for the protection <strong>of</strong> our growing<br />
communities. The four partner agencies signed formal, written commitments to share the costs<br />
<strong>of</strong> construction and operations.<br />
Another example <strong>of</strong> partnership in capital construction is found with the Youth Sports Field<br />
facilities just to the east <strong>of</strong> Glendale’s pr<strong>of</strong>essional sports facilities, the University <strong>of</strong> Phoenix<br />
Stadium and Jobing.com Arena. Both the Fiesta Bowl college football organization and the<br />
Arizona Sports and Tourism Authority contributed funds to the construction <strong>of</strong> this project.<br />
Glendale also continues partnering opportunities with local school districts in the construction <strong>of</strong><br />
parks, playgrounds and sports facilities adjacent to school facilities.<br />
Glendale also assesses development impact fees for commercial and residential construction.<br />
These fees are used to supplement property tax revenues for the construction <strong>of</strong> public safety<br />
facilities, parks and recreation facilities, libraries and other capital projects. By using this<br />
92<br />
Return to TOC
FINANCIAL GUIDELINES<br />
Financial Plan<br />
approach, the <strong>city</strong> takes steps to ensure that new developments pay their fair share for the costs<br />
associated with the <strong>city</strong> services needed to support such developments.<br />
Finally, Glendale pursues grant funds to enhance capital projects. Recent examples include state<br />
<strong>of</strong> Arizona Heritage Funds and federal Bureau <strong>of</strong> Reclamation dollars for parks, trails and open<br />
space projects. As a result <strong>of</strong> these outside grant dollars, the planned capital projects were<br />
accelerated and/or expanded to provide better facilities for the Glendale community.<br />
Administering a Sound Financial Plan<br />
If a prolonged economic downturn occurs, and <strong>annual</strong> revenues cannot support the cost <strong>of</strong><br />
essential services and infrastructure development, the <strong>city</strong>’s options might include:<br />
• Increasing revenues from existing sources such as sales and property taxes or creating<br />
new taxing sources;<br />
• Delaying future growth-related infrastructure development;<br />
• Reducing operating expenses by cutting <strong>budget</strong>s for <strong>city</strong> services.<br />
The purpose <strong>of</strong> a financial plan is to minimize those times when a <strong>city</strong> must resort to the above<br />
alternatives, except in the most extreme circumstances. It also should include short-term<br />
financial strategies that are useful in responding to unanticipated <strong>budget</strong>ary needs <strong>of</strong> short<br />
duration, such as single-year revenue and expense anomalies, damage caused by weather<br />
emergencies, or unexpected population growth spurts.<br />
While developing the <strong>city</strong>’s financial plan, it is important to keep the following caveats in mind:<br />
• It is almost impossible to pinpoint service demands and their costs for the distant future;<br />
• The reliability <strong>of</strong> all predictions will decrease in direct proportion to the increase in the<br />
length <strong>of</strong> the time period involved;<br />
• It is not prudent to make predictions using only a single variable, such as population<br />
growth, when other factors, such as economic conditions, play an important role in future<br />
events; and<br />
• It is important to design short- and long-term strategies that are flexible enough to meet a<br />
broad range <strong>of</strong> possible outcomes.<br />
93<br />
Return to TOC
FINANCIAL GUIDELINES<br />
Financial Plan<br />
LONG-TERM STRATEGIES<br />
Adjusting Staff Levels<br />
Although Glendale has one <strong>of</strong> the Valley’s lowest ratios <strong>of</strong> <strong>city</strong> authorized staff positions to<br />
population (8.57:1,000) personnel-related costs account for 77% <strong>of</strong> the <strong>city</strong>’s General Fund<br />
operating expenses. The adjustment <strong>of</strong> staffing levels is an ineffective method for addressing<br />
short-term <strong>budget</strong> deficits because it requires lead-time to implement effectively and it may<br />
adversely affect the <strong>city</strong>’s ability to maintain quality services. However, downsizing, when<br />
combined with other strategies, can be an effective method <strong>of</strong> dealing with prolonged economic<br />
slowdowns.<br />
The City <strong>of</strong> Glendale’s leadership team carefully reviews every new position request. When a<br />
new position is needed to provide new or expanded services, both the initial (one-time) and<br />
ongoing costs associated with providing and maintaining the service must be included with the<br />
position request. These procedures help ensure that added services and positions will be<br />
sustainable in future years.<br />
Alternatives to Permanent Staff Increases<br />
The selective use <strong>of</strong> temporary and contract workers is one <strong>of</strong> several useful alternatives to<br />
meeting predictable but time-limited workload increases without adding regular status<br />
employees. It is important to have a definitive policy that limits the length <strong>of</strong> time a position can<br />
be filled by a temporary employee. It also is important to closely monitor the time limit to<br />
ensure compliance with the policy.<br />
One example <strong>of</strong> the selective use <strong>of</strong> temporary employees deals with the staffing <strong>of</strong> polling sites<br />
during <strong>city</strong> elections. The <strong>city</strong>’s equalization strategy dictates that the predictable costs for these<br />
workers be <strong>budget</strong>ed as an ongoing operating expense spread evenly between election and nonelection<br />
years. Another example <strong>of</strong> the selective use <strong>of</strong> contract employees is the establishment<br />
<strong>of</strong> contract positions for building inspections services at the construction sites for the intense<br />
development at Westgate. These contract positions expired once the construction activity was<br />
materially complete.<br />
In some cases, contracting for outside services can be less expensive than adding permanent staff<br />
to provide selected <strong>city</strong> services. A further advantage is that it is faster and easier to vary<br />
contract amounts on a year-to-year basis than it is to manipulate permanent staffing levels and<br />
overhead costs for equipment and building space. For these reasons, Glendale has placed<br />
increasing emphasis on negotiating service contracts for areas like parks landscape maintenance,<br />
custodial cleaning <strong>of</strong> <strong>city</strong> facilities, and specialized legal work.<br />
Equalizing Predictable Expenses<br />
Two additional strategies the <strong>city</strong> uses to moderate peaks in ongoing expenses are<br />
• the spreading <strong>of</strong> routine periodic expenses over multiple <strong>budget</strong> years; and<br />
94<br />
Return to TOC
FINANCIAL GUIDELINES<br />
Financial Plan<br />
• the pre-funding <strong>of</strong> replacement equipment such as vehicles and technology equipment<br />
(e.g., PCs, servers, etc.) through a rental rate structure that spreads the cost <strong>of</strong> the<br />
replacement over several years.<br />
As noted earlier in this discussion, the City Clerk’s Office accrues half <strong>of</strong> the next election cost<br />
in the non-election year to reduce biennial election expense peaks. This amount is carried over<br />
and added to an equal amount that is <strong>budget</strong>ed in the actual election year. Although election<br />
expenses will continue to rise as our voter population increases, this practice <strong>of</strong> dividing known<br />
costs across several years substantially levels out the expense curve for scheduled elections. As<br />
a result <strong>of</strong> this approach, the need for one-time election appropriations every two years has been<br />
eliminated, leaving only special election expenses, such as bond elections—which occur<br />
infrequently—to the one-time <strong>budget</strong>ing process.<br />
Prior to the implementation <strong>of</strong> the technology and vehicle replacement programs, the <strong>city</strong>’s<br />
ability to replace <strong>city</strong> vehicles and technological equipment cycled up and down with the local<br />
economy. In lean years, urgently needed replacement equipment was purchased at the expense<br />
<strong>of</strong> capital projects or the operating <strong>budget</strong>. Then, when economic conditions improved, the <strong>city</strong><br />
would engage in massive “catch-up” efforts.<br />
To eliminate this problem, the replacement funds were designed to allow the <strong>city</strong> to replace<br />
outdated, or worn out equipment at regular intervals. Two replacement fund line items were<br />
added to each department’s <strong>annual</strong> operating <strong>budget</strong> to accrue funds for vehicle and technology<br />
replacements, respectively. Experience has shown that many vehicles are not replaced as<br />
originally scheduled because <strong>of</strong> low mileage or good maintenance history, and we expect that<br />
experience will continue into the future. In these cases, we extend the useful life <strong>of</strong> the vehicle.<br />
Nevertheless, we closely monitor this replacement fund to ensure that it provides sufficient funds<br />
to replace essential vehicles and equipment as needed.<br />
The technology replacement fund balance not only covers the systematic replacement <strong>of</strong> desktop<br />
computers, but also <strong>annual</strong> s<strong>of</strong>tware licensing costs for a wide range <strong>of</strong> s<strong>of</strong>tware used in <strong>city</strong><br />
operations, virus and security maintenance costs, <strong>city</strong>wide data storage, database servers, and<br />
cable/video equipment and presentation systems. As is the case with the vehicle replacement<br />
fund, experience has shown that the useful life <strong>of</strong> some technology equipment can be extended<br />
and thus the fund accumulates a level <strong>of</strong> reserve funding which is used for emergency<br />
replacements and/or upgrades to existing inventory.<br />
Capital Improvement Plan Development<br />
Conservative population and revenue growth projections are used for long-range capital planning<br />
to determine when, where, and how capital projects will be implemented because most large<br />
capital construction projects permanently increase the <strong>city</strong>’s ongoing operating costs for staff,<br />
maintenance, repair, utilities, etc. For example, the operating <strong>budget</strong> impact <strong>of</strong> the Foothills<br />
Library and the Downtown Civic Center, both <strong>of</strong> which opened in the 1990s, were carefully<br />
considered prior to initiation <strong>of</strong> these projects to ensure revenue growth would cover the<br />
increased operating costs. Glendale also analyzes the long-term financial projections <strong>of</strong> debt<br />
service costs prior to every bond sale.<br />
95<br />
Return to TOC
FINANCIAL GUIDELINES<br />
Financial Plan<br />
Major capital projects can be planned, scheduled, and financed in ways that will not deplete<br />
needed resources from the <strong>annual</strong> operating <strong>budget</strong> or require an increase in Glendale’s<br />
secondary property tax. Short-term financial strategies, such as various financing instruments or<br />
the acceleration or deceleration <strong>of</strong> project schedules, can help us meet unusual population growth<br />
or service demands. The introduction to Glendale’s 20<strong>12</strong>-2021 Capital Improvement Plan<br />
provides an explanation <strong>of</strong> the capital project process.<br />
Property Tax Stabilization<br />
For over a decade, Council policy has been to stabilize the property tax rate and structure at<br />
reasonable levels so that property tax revenue is sufficient to meet long-term, foreseeable<br />
revenue needs without requiring intermittent adjustments. Capital improvement projects are<br />
planned, financed and scheduled for implementation so that the secondary property tax rate can<br />
remain relatively stable over the coming decade.<br />
Arizona’s property tax levy consists <strong>of</strong> two tiers. The primary property tax levy has statemandated<br />
maximum limits, but it can be used by a <strong>city</strong> for any lawful purpose. The primary<br />
property tax revenue is included in the General Fund. However, because Glendale has<br />
minimized its use <strong>of</strong> the primary property tax levy, this revenue source is expected to be less<br />
than 3% <strong>of</strong> the <strong>city</strong>’s anticipated General Fund revenues in FY 20<strong>12</strong>.<br />
The secondary property tax is an unlimited levy that can be used only to retire the principal and<br />
interest on a municipality’s General Obligation bond debt. This revenue source provides more<br />
‘bang for the buck’ because it can be leveraged to borrow more funds to pay for capital projects.<br />
Therefore, the secondary property tax levy is optimized in relation to the primary property tax<br />
levy.<br />
Although many cities in other parts <strong>of</strong> the country use the property tax rate to make short-term<br />
operating <strong>budget</strong> adjustments, changes in Glendale’s tax structure or rates are viewed as longterm<br />
financial strategies. Arizona’s tax limitation statute, the relatively minor role <strong>of</strong> primary<br />
property tax revenue on Glendale’s operating <strong>budget</strong>, and the <strong>city</strong>’s property tax stabilization<br />
policy combine to make property tax adjustment an ineffective short-term strategic tool.<br />
As a practical matter, it might take up to a year for a property tax change to be implemented and<br />
longer to produce a significant increase in revenues. Growth in the tax base and changes in the<br />
assessed valuation rate determined by the county <strong>of</strong>ten have a larger impact on the level <strong>of</strong><br />
revenues raised through property taxation.<br />
Given these facts, increasing Glendale’s property tax rate is a more appropriate alternative for<br />
addressing a chronic structural imbalance between revenues and expenses than for balancing a<br />
single year’s operating <strong>budget</strong>. For example, when the <strong>city</strong> reaches full build-out much less<br />
revenue will be generated from new tax base growth. If this decrease were not accompanied by<br />
sufficient growth in assessed valuation or <strong>of</strong>fset by increases in other revenues or a reduction in<br />
operating expenses, a serious imbalance might occur that might trigger a property tax increase.<br />
96<br />
Return to TOC
FINANCIAL GUIDELINES<br />
Financial Plan<br />
As noted above, secondary property taxes are used to repay voter-authorized General Obligation<br />
bond debt. With efficient scheduling <strong>of</strong> bond sales and capital projects, the Ten-Year Capital<br />
Improvement Plan is designed to keep the secondary property tax rate level. Changes in capital<br />
construction schedules, interest rates and several other variables might necessitate a property tax<br />
rate adjustment over the longer term; however, most <strong>of</strong> these situations can be addressed by finetuning<br />
the primary tax rate and directing the flow <strong>of</strong> interest earnings on bond proceeds between<br />
construction and debt service funds.<br />
While Glendale’s total property tax rate remained unchanged at $1.72 per $100 <strong>of</strong> assessed<br />
valuation from FY 2001 to FY 2007, the <strong>city</strong> adjusted the two components <strong>of</strong> the overall<br />
property tax rate. Specifically, the <strong>city</strong> continued to lower the primary property tax rate and<br />
increase the secondary property tax rate so that all assessed valuation growth due to appreciation<br />
(versus new construction) is shifted to the secondary property tax rate. By doing so, the <strong>city</strong><br />
remained in compliance with the state’s Truth in Taxation law.<br />
In FY 2007, Glendale received approximately $23.1 million in property tax revenue from the<br />
$1.72 total property tax rate. The primary property tax amount totaled approximately $3.7<br />
million and the remaining $19.4 million came from the secondary rate. The combined property<br />
tax rate for FY 2009 was lowered to $1.5951 per $100 <strong>of</strong> assessed valuation. It generated $4.0<br />
million from the primary property tax rate and $28.9 million from the secondary property tax<br />
rate.<br />
The property tax rate will remain unchanged in FY 20<strong>12</strong> at $1.5951. The rate is expected to<br />
generate a total <strong>of</strong> $20.9 million, $2.9 million from the primary property tax and $18.0 million<br />
from the secondary property tax.<br />
The graph at the right shows a<br />
10-year history <strong>of</strong> both the<br />
primary and secondary property<br />
tax rate assessed by the City <strong>of</strong><br />
Glendale.<br />
$2 .0 000<br />
Property T ax Rates<br />
10-Year Fiscal History<br />
(Per $100 <strong>of</strong> Assessed Valuation)<br />
$1 .7 500<br />
$1 .5 000<br />
$1 .2 500<br />
$1 .0 000<br />
$0 .7 500<br />
$0 .5 000<br />
$0 .2 500<br />
$0 .0 000<br />
'03 '04 '05 '06 '07 '08 '09 '10 '11 '<strong>12</strong><br />
Primary<br />
S ec ond ar y<br />
97<br />
Return to TOC
FINANCIAL GUIDELINES<br />
Financial Plan<br />
SHORT-TERM STRATEGIES<br />
The following short-term financial strategies play an important role in: (1) maintaining the<br />
delicate year-to-year equilibrium between revenues and expenses; (2) responding to temporary<br />
changes in economic conditions; and/or (3) absorbing or avoiding anticipated revenue shortfalls.<br />
Sales Tax Stabilization<br />
Sales tax revenues fluctuate and are subject to sudden economic changes like a sudden downturn<br />
in the economy, as occurred after September 11, 2001. Prior to FY 2004, Glendale’s<br />
stabilization policy required the use <strong>of</strong> the actual amount <strong>of</strong> sales tax revenue collected in the<br />
prior twelve months as its sales tax revenue base estimate for developing the next year’s<br />
operating <strong>budget</strong>, with no growth rate factor for <strong>budget</strong>ing purposes.<br />
This conservative approach to estimating sales tax revenue minimized the likelihood that <strong>annual</strong><br />
<strong>budget</strong>ed operating expenses would significantly exceed actual sales tax revenues in any given<br />
year. In fact, actual receipts usually were higher than the prior year because tax revenue<br />
increases were attributable to growth in the tax base (i.e. population growth). When actual<br />
receipts exceeded the base estimate, excess revenue was applied to the operating capital <strong>budget</strong><br />
or used to increase the <strong>city</strong>’s GF fund balance.<br />
For the FY 2004 <strong>budget</strong>, a different approach was taken to establishing the FY 2004 revenue<br />
<strong>budget</strong> for <strong>city</strong> sales tax receipts. The FY 2004 revenue <strong>budget</strong> for <strong>city</strong> sales taxes included a<br />
full year <strong>of</strong> estimated sales tax receipts from new development that was expected to open by the<br />
start <strong>of</strong> FY 2004 or shortly after the start <strong>of</strong> the fiscal year. This approach was taken to avoid<br />
severely impacting service levels as a result <strong>of</strong> sluggish growth in state shared revenues. For the<br />
FY 2005 - FY 2008 <strong>budget</strong>s, this approach was further modified because this revenue source had<br />
performed so strongly in recent years, as shown in the chart below.<br />
Fiscal Year<br />
City Sales Tax Receipts<br />
Percent Change From<br />
Prior FY<br />
2002-03 $43.5 M --<br />
2003-04 $49.8 M 14.5%<br />
2004-05 $52.5 M 5.4%<br />
2005-06 $59.7 M 13.7%<br />
2006-07 $63.6 M 6.5%<br />
2007-08 $61.3M (3.6%)<br />
2008-09 $51.6 M (15.8%)<br />
2009-10. $50.5 M (2.1%)<br />
2010-11 Est. $50.5 M --<br />
<strong>2011</strong>-<strong>12</strong> Proj. $53.4 M 5.7%<br />
98<br />
Return to TOC
FINANCIAL GUIDELINES<br />
Financial Plan<br />
The average <strong>annual</strong> growth rate for <strong>city</strong> sales tax collections was 7% between FY 2002 and FY<br />
2008. However, FY 2009 collections dropped 15.8% as the national economy hit a severe<br />
downturn. FY 2010 declined by another 2.1%. For FY 20<strong>12</strong> this revenue source is expected to<br />
increase 5.7%.<br />
Operating Capital Management<br />
Operating capital is <strong>of</strong>ten referred to as "pay-as-you-go" capital because projects and equipment<br />
in this category are funded directly from operating revenues. Operating capital is used to pay for<br />
• building maintenance and replacement items such as air conditioners, ro<strong>of</strong>ing, and floor<br />
furnishings,<br />
• specialized equipment not in the vehicle replacement program, such as sanitation trucks<br />
and street resurfacing vehicles, and<br />
• selected routine infrastructure maintenance activities such as the street resurfacing<br />
program.<br />
In addition, the initial purchase <strong>of</strong> a vehicle is funded with operating capital. For example, if a<br />
new inspector position is approved for the Building Safety Department, that inspector will need a<br />
vehicle. The UinitialU purchase <strong>of</strong> the new vehicle for the new inspector position is funded with<br />
operating capital because it is an addition to the <strong>city</strong>’s fleet (versus a replacement). Subsequent<br />
replacement <strong>of</strong> that vehicle is then funded through the vehicle replacement program.<br />
Unlike personnel costs, it is relatively fast and easy to make adjustments to operating equipment<br />
<strong>budget</strong>s without reducing the <strong>city</strong>’s service capa<strong>city</strong> or quality. Adjustments to the rate at which<br />
operating capital is spent can function as an effective short-term shock absorber to level out<br />
temporary revenue fluctuations. Glendale residents will not be materially affected if <strong>city</strong> fleet<br />
vehicle replacements are delayed or accelerated in a single <strong>budget</strong> year, as long as the<br />
replacement program continues and repair and maintenance costs for these vehicles are not<br />
unreasonable. For example, delaying a portion <strong>of</strong> the street resurfacing program in one year<br />
does not have major negative consequences if the program is accelerated in the following year.<br />
An ongoing, stable revenue source is much less critical for operating capital than it is for<br />
maintaining service levels for police, fire and emergency services. It is important to keep in<br />
mind that maintaining adequate operating capital levels and adjusting the rate <strong>of</strong> capital spending<br />
minimizes the need to reduce the operating <strong>budget</strong> or deplete other fund resources. When<br />
possible, operating capital <strong>budget</strong>s are restored before any new programs or employees are added<br />
to the ongoing <strong>budget</strong>.<br />
Building and Maintaining Adequate Fund Balance<br />
By law, Arizona cities are required to prepare and operate under a City Council-approved<br />
balanced <strong>budget</strong> that must be filed <strong>annual</strong>ly with the state’s Auditor General. City government is<br />
prohibited from spending more than the total amount appropriated in its <strong>annual</strong> <strong>budget</strong><br />
document. This limitation raises several interesting questions about how the <strong>city</strong> can<br />
successfully maintain an <strong>annual</strong>ly balanced <strong>budget</strong> in years when General Fund revenue deficits<br />
or surpluses occur.<br />
99<br />
Return to TOC
FINANCIAL GUIDELINES<br />
Financial Plan<br />
General Fund revenue surpluses accrued in one year can be reserved and used to <strong>of</strong>fset revenue<br />
deficits that might occur in a subsequent year. The accounting mechanism Glendale uses to<br />
reserve General Fund surplus revenues is referred to as the General Fund’s fund balance. Every<br />
fiscal year, a portion <strong>of</strong> fund balance is established as a General Fund contingency appropriation.<br />
A similar contingency appropriation is established each year for other <strong>city</strong> funds like the<br />
enterprise operations (e.g., sanitation fund and landfill fund). This mechanism enables the <strong>city</strong> to<br />
meet the legal constraints <strong>of</strong> a balanced <strong>annual</strong> <strong>budget</strong> and provides a source to address<br />
emergencies and other unanticipated expenses.<br />
Like operating capital, fund balance can function as a financial shock absorber to smooth out<br />
short-term revenue and expense fluctuations. When sluggish economic conditions result in<br />
lower-than-projected revenues, a portion <strong>of</strong> fund balance can be allocated to cover <strong>budget</strong>ed<br />
operating expenses. When the economy is healthy, and revenues are higher than predicted for<br />
<strong>annual</strong> <strong>budget</strong>ing purposes, the excess revenues can be added to the fund balance for future use.<br />
City Council policies discourage the routine use <strong>of</strong> fund balance to support long-term or ongoing<br />
expenses in the operating <strong>budget</strong>. The City’s financial policy requires the <strong>city</strong>’s contingency<br />
appropriation be equal to 10% <strong>of</strong> General Fund revenues. If fund balances are used for one-time<br />
projects, restoring them becomes the highest <strong>budget</strong>ing priority after assuring that adequate<br />
operating funds are available to support essential services and infrastructure needs.<br />
The sales tax stabilization strategy produces a domino-like effect that supports the <strong>city</strong>’s ability<br />
to maintain adequate fund balance during times <strong>of</strong> high revenue growth. Conservative revenue<br />
estimates result in conservative <strong>annual</strong> <strong>budget</strong> estimates. Conservative <strong>budget</strong> estimates limit<br />
growth in non-essential operations, and this practice permits a portion <strong>of</strong> the excess sales tax<br />
revenue to be allocated to contingency reserves. These reserves can <strong>of</strong>fset drops in other<br />
revenue tax sources, such as building permits, or augment sales tax revenue when unpredictable<br />
downturns occur. Once reserves reach the 10% <strong>of</strong> revenues target level, any further amounts are<br />
usually added to the operating capital <strong>budget</strong>.<br />
Fund-related financial information is summarized in Schedule One, which is entitled Fund<br />
Balance Analysis. Detailed descriptions <strong>of</strong> each fund in Glendale’s financial system, including<br />
the General Fund, enterprise funds and special revenue funds, are contained in the Budget<br />
Summary section <strong>of</strong> this document.<br />
CONCLUSION<br />
During the economic downturn that began in late 2001 and continued through early 2003,<br />
Glendale employed some <strong>of</strong> the short-term strategies outlined in the previous sections. By FY<br />
2006, it was clear that the economy had rebounded. The record setting growth that we<br />
experienced during this time ended during FY 2008. In order to deal with this most recent<br />
slowdown in the economy, we have continued to follow many <strong>of</strong> the cost-saving measures that<br />
were implemented in FY 2003, including<br />
• No transfers <strong>of</strong> salary savings to operating <strong>budget</strong>s except in very limited instances.<br />
100<br />
Return to TOC
FINANCIAL GUIDELINES<br />
Financial Plan<br />
• Non public-safety staffing positions are reviewed by upper management to make sure<br />
they still are serving current business needs and demands as they become vacant before<br />
the recruitment process actually begins for those positions.<br />
• No un<strong>budget</strong>ed carryover savings – all carryover will be returned to the General Fund<br />
• Capital projects are reviewed for all operating and maintenance costs impacting the<br />
General Fund<br />
These strategies, coupled with prudent <strong>budget</strong>ing practices, allowed Glendale to deal with the<br />
recent economic downturn without severely hampering current services and programs.<br />
Continuation <strong>of</strong> these strategies will see us through the future.<br />
101<br />
Return to TOC
FINANCIAL GUIDELINES<br />
Financial Policies<br />
FINANCIAL POLICIES<br />
The financial policies establish the framework for overall fiscal planning and management and<br />
set forth guidelines for both current activities and long-range planning. These policies are<br />
reviewed <strong>annual</strong>ly to ensure the highest standards <strong>of</strong> fiscal management. The City Manager and<br />
the leadership team have the primary role <strong>of</strong> reviewing financial actions and providing guidance<br />
on financial issues to the City Council.<br />
OVERALL GOALS<br />
The overall financial goals underlying these policies are:<br />
1. Fiscal Conservatism: To ensure that the <strong>city</strong> is in a solid financial condition at all times.<br />
This can be defined as:<br />
A. Cash Solvency - the ability to pay existing bills<br />
B. Budgetary Solvency - the ability to balance the <strong>budget</strong> (all operating, capital and debt<br />
service expenditures should be covered by the appropriate revenue sources and meet all<br />
statutory requirements prior to the beginning <strong>of</strong> the year)<br />
C. Long Run Solvency - the ability to pay future bills<br />
D. Service Level Solvency - the ability to provide needed and desired services<br />
2. Flexibility: To ensure that the <strong>city</strong> is in a position to respond to changes in the economy or<br />
new service challenges without an undue amount <strong>of</strong> financial stress.<br />
3. Adherence to the Highest Accounting and Management Practices: To comply with the<br />
Government Finance Officers' Association (GFOA) standards for financial reporting and<br />
<strong>budget</strong>ing, the Governmental Accounting Standards Board and other pr<strong>of</strong>essional standards.<br />
OPERATING BUDGET<br />
1. Ongoing operating costs should be supported by ongoing, stable revenue sources. This<br />
protects the <strong>city</strong> from fluctuating service levels and avoids crises when one-time revenues<br />
are reduced or removed. Some corollaries to this policy are:<br />
A. Fund balance should be used only for one-time expenditures, such as capital equipment<br />
and building improvements, or contingency appropriations and related purposes.<br />
B. Ongoing maintenance costs such as vehicle repair and maintenance, building<br />
maintenance, and swimming pool replastering should be financed through operating<br />
revenues, rather than through the issuance <strong>of</strong> debt.<br />
C. Fluctuating federal and state grants should not be used to fund ongoing programs.<br />
2. Revenues from growth or development should be targeted to costs related to<br />
development, or invested in improvements that will benefit future residents or make future<br />
102<br />
Return to TOC
FINANCIAL GUIDELINES<br />
Financial Policies<br />
service provision efficient. While it is tempting to use growth-related revenue to support<br />
current operations, doing so can lead to a crisis when the growth rate decreases. This policy<br />
implies a commitment to identi<strong>fy</strong>ing the portions <strong>of</strong> the <strong>city</strong>'s revenue stream that result<br />
from growth.<br />
3. General Fund appropriations, including sales tax funds, should include a contingency<br />
appropriation equal to at least 10% <strong>of</strong> projected revenues for the upcoming fiscal year. This<br />
contingency appropriation essentially serves as the City’s revenue stabilization account (i.e.,<br />
rainy day account). As such, it can help to minimize the impact <strong>of</strong> prolonged fluctuations in<br />
sales tax revenues, which is the revenue source most sensitive to changes in the economy. It<br />
also can be used to mitigate the negative effects <strong>of</strong> unforeseeable and unexpected financial<br />
situations.<br />
4. Enterprise Funds should include a sufficient unappropriated fund balance to absorb<br />
fluctuations in <strong>annual</strong> revenue. Enterprise funds should also be charged directly for<br />
overhead services whenever possible, rather than using an indirect cost allocation. These<br />
services include expenses related to employee fringe benefits, risk management and workers<br />
compensation insurance costs, telephone charges, and technology and vehicle replacement<br />
charges. Provisions should also be made for interdepartmental charges for services such as<br />
solid waste collection and disposal, as well as vehicle maintenance and repair.<br />
5. Replacement <strong>of</strong> vehicles and technological equipment will be done through the Vehicle<br />
Replacement and Technology Replacement Funds. A rental rate structure will be<br />
established <strong>annual</strong>ly to provide sufficient funds for replacement <strong>of</strong> covered equipment.<br />
New equipment added to the existing fleet should be paid initially with operating capital by<br />
the requesting department. In addition, a corresponding rental rate payment for the new<br />
equipment should be included within the requesting department’s operating <strong>budget</strong> on an<br />
ongoing basis. The Field Operations Department should review all vehicle-related<br />
purchases and the Information Technology Department all technology related purchases.<br />
6. A financial forecasting model should be maintained to test the ability <strong>of</strong> the <strong>city</strong> to absorb<br />
operating costs due to capital improvements, and to react to changes in the economy or<br />
service demands. This forecast should cover at least five years and be updated <strong>annual</strong>ly.<br />
7. Salary policy and structure should emphasize the provision <strong>of</strong> predictable salary increases,<br />
sustainable over time, that serve to recognize and reward the contributions <strong>of</strong> experienced<br />
and well-trained staff. To this end, the merit pay policy provides for merit increases <strong>of</strong> up to<br />
6% <strong>annual</strong>ly to qualified employees based on the <strong>city</strong>'s ability to pay. To reflect increases<br />
related to market pay range adjustments and inflation, Council sets a target that is based on a<br />
Human Resources market survey <strong>of</strong> other Valley cities and therefore will vary depending on<br />
whether the majority <strong>of</strong> <strong>city</strong> job classifications are below market, at market or above market.<br />
8. Laws and policies related to limitations on revenue sources should be explicitly<br />
addressed in the <strong>budget</strong> process. These include:<br />
103<br />
Return to TOC
FINANCIAL GUIDELINES<br />
Financial Policies<br />
A. One-third <strong>of</strong> <strong>annual</strong> Local Transportation Assistance Funds (LTAF) must be devoted<br />
to transit (Regional Public Transportation Authority).<br />
B. No more than one-half <strong>of</strong> the prior year's Highway User Revenue Fund (HURF) can be<br />
used for debt service (A.R.S. 48-689).<br />
C. The <strong>city</strong> must maintain its level <strong>of</strong> General Fund support in street maintenance and<br />
operations, as provided by state law.<br />
9. Debt Management<br />
A. Short-term borrowing or lease/purchase contracts should be considered for financing<br />
major operating capital equipment when the Executive Director for Budget and Finance<br />
Services, along with the <strong>city</strong>'s financial advisors, determines that this is in the <strong>city</strong>'s best<br />
financial interest. Lease/purchase decisions should have the concurrence <strong>of</strong> the<br />
appropriate operating manager.<br />
B. Short-term debt should not exceed 5% <strong>of</strong> revenue or 20% <strong>of</strong> total debt. The short-term<br />
debt for the <strong>city</strong> is documented in Schedule 8 <strong>of</strong> this <strong>budget</strong> <strong>book</strong>.<br />
C. Long-term debt. The City will maintain a secondary property tax rate to support<br />
existing and future property tax supported debt. The City should maintain a general<br />
obligation debt service fund balance <strong>of</strong> at least 10% <strong>of</strong> next year's property tax supported<br />
debt service. The long-term debt for the <strong>city</strong> is documented in Schedule 7 <strong>of</strong> this <strong>budget</strong><br />
<strong>book</strong>.<br />
10. Budget Amendment Policies<br />
A. Total fund appropriation changes must be approved by the City Council. These<br />
amendments must also comply with the <strong>city</strong>'s Alternative Expenditure Limitation. In<br />
order to provide flexibility, 10% <strong>of</strong> the total General Fund revenue <strong>budget</strong> for the<br />
upcoming fiscal year should be set aside as a contingency appropriation as long as this<br />
contingency is backed by available fund balances.<br />
B. Uses <strong>of</strong> contingency appropriations must be specifically approved by the City Council.<br />
C. Shifts in appropriations within fund totals may be done administratively on the<br />
authority <strong>of</strong> the City Manager. In most cases the City Manager will request City<br />
Council concurrence with these changes since the item prompting the change will<br />
usually go to the City Council (e.g., award <strong>of</strong> contract, addition <strong>of</strong> staff, contract change<br />
order). Procedures for appropriations transfers and delegation <strong>of</strong> <strong>budget</strong> responsibility<br />
will be set by the City Manager. Inter-fund transfers must be specifically approved by<br />
City Council. Any inter-fund transfer that was not approved by City Council during the<br />
fiscal year (e.g., council communication for award <strong>of</strong> contract, contract change order)<br />
shall be included on the fiscal year end Clean-Up Ordinance to be approved by City<br />
Council.<br />
104<br />
Return to TOC
FINANCIAL GUIDELINES<br />
Financial Policies<br />
D. Salary savings transfers must be approved by the <strong>city</strong> manager and are prohibited<br />
during the first 6 months <strong>of</strong> any given fiscal year. However, in the event <strong>of</strong> an<br />
extenuating circumstance, the <strong>city</strong> manager may override this policy and authorize a<br />
salary savings transfer during the first 6 months <strong>of</strong> the fiscal year.<br />
11. A Budgetary Control System will be maintained to ensure compliance with the adopted<br />
<strong>budget</strong>. Quarterly <strong>budget</strong> status reports will be presented to, and reviewed by the City<br />
Council to ensure that the <strong>city</strong> finances are on track with the adopted <strong>budget</strong>.<br />
<strong>12</strong>. Revenue Policies<br />
A. Diversified and stable revenues will be maintained to ensure fiscal health and absorb<br />
short-run fluctuations in any one revenue source.<br />
B. User fees for all operations will be examined <strong>annual</strong>ly to ensure that fees cover direct<br />
and indirect costs <strong>of</strong> service. Rate adjustments for enterprise operations will be based on<br />
five-year enterprise fund plans and/or other comprehensive rate studies.<br />
C. Development fees for one-time capital expenses attributable to new development will<br />
be reviewed periodically to ensure that fees match development-related expenses.<br />
CAPITAL BUDGET<br />
1. A long-range capital improvement plan should be prepared and updated each year. The<br />
first five years <strong>of</strong> the 10-year plan should identi<strong>fy</strong> projects that can be completed with<br />
identified funding sources, with only the first year <strong>of</strong> the plan actually appropriated. This<br />
10-year plan may include unfunded projects in the last five years <strong>of</strong> the plan as placeholders<br />
that carry out the <strong>city</strong>'s long-term strategic and general plans. All projects are assessed<br />
<strong>annual</strong>ly regarding their necessity, priority, compatibility with Council goals, long-range<br />
plans <strong>of</strong> various departments and the City’s financing capabilities.<br />
2. When planning capital projects, each department must estimate the associated impact on<br />
the <strong>city</strong>'s operating <strong>budget</strong>. Examples include any associated staffing, utilities, water,<br />
landscape, building and equipment maintenance, computer/vehicle ongoing replacement,<br />
insurance costs, etc.<br />
3. Amendments to capital appropriations fall under the same guidelines as changes to the<br />
operating <strong>budget</strong> noted above.<br />
105<br />
Return to TOC
OPERATING BUDGET<br />
FY <strong>2011</strong>-<strong>12</strong><br />
CITY OF GLENDALE, AZ<br />
PRELIMINARY<br />
ANNUAL BUDGET<br />
BOOK
Mission and Performance Measure<br />
Mayor and City Council<br />
MAYOR AND CITY COUNCIL<br />
The Mayor and City Council constitute the elected legislative and policy making body <strong>of</strong> the<br />
<strong>city</strong>. The Mayor is elected at-large every four years. Council members also are elected to fouryear<br />
terms from one <strong>of</strong> six electoral districts in Glendale.<br />
One <strong>of</strong> the highest priorities <strong>of</strong> the Mayor and Council is to involve the public in their decision<br />
making process. They regularly appoint citizens to 17 advisory boards and commissions and<br />
<strong>of</strong>ten form public committees to address specific <strong>city</strong>wide issues.<br />
The Mayor and Council each become involved in the support and economic development <strong>of</strong><br />
Glendale’s six districts. The Mayor hosts numerous community events throughout the year.<br />
Councilmembers host meetings in their districts or meet with small groups <strong>of</strong> citizens throughout<br />
the year to resolve local issues. These meetings ensure citizens are informed on projects in and<br />
around their homes and businesses and give the Mayor and Council input and feedback from<br />
their constituents. The Mayor and Council also communicate with citizens through electronic<br />
media such as Web sites, electronic bulletins and programming on Glendale 11, the <strong>city</strong>’s cable<br />
station.<br />
The Mayor and Council represent Glendale as members and leaders on numerous <strong>city</strong>, regional<br />
and national organizations and committees.<br />
City staff that support the Mayor and Council work closely with constituents to resolve any<br />
issues or questions they have about <strong>city</strong> programs and services.<br />
The Mayor and City Council determines strategic goals that guide the future vision and policy<br />
direction for the <strong>city</strong>.<br />
City Council Strategic Goals<br />
Our Vision for Glendale:<br />
• One Community That Is Fiscally Sound<br />
• One Community With Strong Neighborhoods<br />
• One Community Committed To Public Safety<br />
• One Community With Quality Economic Development<br />
• One Community With A Vibrant City Center<br />
• One Community With An Active Partnership With Luke Air Force Base<br />
• One Community With High Quality Services For Citizens<br />
106<br />
Return to TOC
Mission and Performance Measure<br />
Mayor and City Council<br />
Accomplishments<br />
Fiscally Sound<br />
• Reduced the <strong>city</strong> <strong>budget</strong> by $249 million over the past three fiscal years through a variety<br />
<strong>of</strong> methods including the evaluation <strong>of</strong> business practices and implementation <strong>of</strong> cost<br />
savings brought forward through Innovate, an employee program focused on innovation.<br />
• Volunteers provided <strong>12</strong>0,744 hours <strong>of</strong> service, which, if paid, would be valued at $2.5<br />
million.<br />
• Reduced fuel usage by more than <strong>12</strong>9,300 gallons through measures such as reducing the<br />
number <strong>of</strong> vehicles the <strong>city</strong> operates, downsizing 200 vehicles from V-8 to 4 cylinder<br />
models, including 300 vehicles that operate on E85 fuel, driving fewer miles, piloting the<br />
use <strong>of</strong> hybrid vehicles, creating a motor pool <strong>of</strong> 21 vehicles, and adhering to a rigorous<br />
maintenance schedule.<br />
• Received, for the twenty-second consecutive year, the Government Finance Officers<br />
Association <strong>of</strong> the United States and Canada’s Certificate <strong>of</strong> Achievement for Excellence<br />
in Financial Reporting for the Comprehensive Annual Financial Report.<br />
Strong Neighborhoods<br />
• Engaged citizens by hosting community events such as Community Conversations with<br />
Mayor Scruggs, Council District meetings and Legislative Link meetings.<br />
• Recognized neighborhood leaders, community volunteers and businesses that have<br />
contributed to their community and improved the quality <strong>of</strong> the <strong>city</strong>’s neighborhoods with<br />
Glendale’s <strong>annual</strong> Spark Awards.<br />
• Continued to support Glendale’s 192 registered neighborhoods and HOAs.<br />
• Celebrated “Getting Arizona Involved in Neighborhoods” (GAIN) Night with many <strong>of</strong><br />
Glendale’s 173 Neighborhood Watch Groups.<br />
Public Safety<br />
• Glendale Ranked #10 on Forbes “America’s Safest Cities” list. Forbes based their ranking<br />
from an analysis <strong>of</strong> violent crimes and fatal traffic accidents within the larger cities<br />
throughout America.<br />
• Received $136,960 in federal stimulus funding to enhance the ability <strong>of</strong> the Police<br />
Department to investigate and support the successful prosecution <strong>of</strong> domestic violence<br />
<strong>of</strong>fenders.<br />
• Hosted the first Annual Statewide Domestic Violence Training Summit with $41,000 in<br />
grant money from the Governor’s Office on Children, Youth and Families.<br />
• Glendale became the first municipal police department in the valley to utilize in-car<br />
video technology in its full fleet <strong>of</strong> patrol cars. The dash-mounted cameras capture visual<br />
and audio recordings that can prove useful for crime prevention and in investigations.<br />
Funding came from a $940,000 federal appropriation in 2008.<br />
• Supported the Glendale Police and Fire Departments in their community education and<br />
prevention efforts. Departments held dozens <strong>of</strong> community events covering identity theft<br />
prevention, children’s safety, auto theft prevention, fire prevention, hands only CPR and<br />
personal safety.<br />
107<br />
Return to TOC
Mission and Performance Measure<br />
Mayor and City Council<br />
Quality Economic Development<br />
• Filled more than one million square feet <strong>of</strong> <strong>of</strong>fice and industrial space and attracted more<br />
than 1,000 jobs in two targeted industries: healthcare and education in spite <strong>of</strong> slow<br />
economic growth nationwide.<br />
• Celebrated the opening <strong>of</strong> DeVry University’s fourth Arizona location at Westgate City<br />
Center. The campus occupies approximately 18,000 square feet <strong>of</strong> space and brings<br />
dozens <strong>of</strong> new pr<strong>of</strong>essional jobs to the <strong>city</strong>.<br />
• Opened the new 51,000 square-foot headquarters <strong>of</strong> Waterous, one <strong>of</strong> the world’s leading<br />
mobile firefighting equipment manufacturers, in Glendale.<br />
• Selected by Linamar Solar Systems for its new Power Conversion Unit (PCU) production<br />
facility. Linamar Solar signed a five-year lease for a 76,000 square-foot industrial<br />
building in Glendale’s Airpark.<br />
• Welcomed millions <strong>of</strong> travelers to the West Valley for sports and entertainment events in<br />
Glendale, boosting the economy with tourism dollars.<br />
A Vibrant City Center<br />
• Transformed the 10-year old Glendale Visitor Center into a state-sanctioned Convention<br />
and Visitors Bureau.<br />
• Welcomed Southwest Ambulance to Downtown Glendale. Arizona’s largest ambulance<br />
provider has chosen Glendale’s Centerline as the location for its West Valley Operations<br />
Facility.<br />
• Continued to support Glendale’s signature special events which draw 500,000 people per<br />
year to the downtown.<br />
• Completed the Centerline Walkway Project, a beautifully landscaped walkway between<br />
Glendale Avenue and Glenn Drive, complete with seating areas, brick walkways and new<br />
lighting funded by the American Recovery and Reinvestment Act (ARRA).<br />
• Approved the Glendale Overlay District which helps support businesses in the centerline<br />
district.<br />
• Developed Artwerks Lateral 58, a new element <strong>of</strong> the Glendale Centerline, designed to<br />
bring artists to the area and highlight the downtown shops and restaurants while<br />
showcasing artists and their work.<br />
An Active Partnership with Luke Air Force Base<br />
• Continued to administer the state and federal consulting/lobbying contract for the West<br />
Valley Partners, a group <strong>of</strong> 14 West Valley communities.<br />
• Advanced the statewide “Luke Forward” campaign to bring the new F-35 joint strike<br />
fighter mission to Luke Air Force Base. In its first <strong>12</strong> months, over 20,000 supporters<br />
registered on LukeForward.com and nearly $25,000 has been raised to privately<br />
underwrite the initiative.<br />
108<br />
Return to TOC
Mission and Performance Measure<br />
Mayor and City Council<br />
• Worked with Fighter Country Partnership to engage the public to participate in the F-35<br />
Environmental Impact Study (EIS) process. As a result, Luke’s first EIS meetings posted<br />
a record for the number <strong>of</strong> written citizen comments submitted in support <strong>of</strong> the F-35<br />
mission.<br />
• Mayor Scruggs continued to lobby on behalf <strong>of</strong> the <strong>city</strong> for congressional and Pentagon<br />
support for bringing the F-35 mission to Luke AFB.<br />
High Quality Services for Citizens<br />
• Continued the process <strong>of</strong> updating the Parks and Recreation Master Plan with input from<br />
local interest groups, community organizations and businesses, public <strong>of</strong>ficials and<br />
private citizens.<br />
• Renovated and redesigned the sports complex at Sahuaro Ranch Park. Upgrades focused<br />
on shade; “green” improvements; and efficiencies in electrical, water and other costs. The<br />
design added two multi-purpose fields to the original ball field design to support youth<br />
soccer, football and other organized activities. The new design increases comfort and<br />
capa<strong>city</strong> <strong>of</strong> the seating areas for viewing events and the fields are now completely<br />
handicapped accessible. Approximately 72,000 games have been played at the complex<br />
since it opened in 1986.<br />
• Expanded Glendale’s recycling program to include Plastics #1-7. By including<br />
PLASTICS 1-7, the overall amount recycled will increase and the amount <strong>of</strong> waste going<br />
to the landfill will be reduced.<br />
• Offered help to Glendale families who were homeless or in danger <strong>of</strong> losing a safe place to<br />
live with an additional $316,132 <strong>of</strong> funds awarded to the <strong>city</strong> <strong>of</strong> Glendale. The federal funds<br />
were part <strong>of</strong> the American Recovery and Reinvestment Act.<br />
• For the 16th consecutive year, received a “high performer” rating from the U.S.<br />
Department <strong>of</strong> Housing and Urban Development (HUD) for Glendale’s Community<br />
Housing Division.<br />
• Continued GO Transportation program efforts which have resulted in expanded transit<br />
services, enhanced traffic flow and safety on Glendale streets and at intersections, and<br />
further development <strong>of</strong> bicycle and pedestrian enhancements throughout the <strong>city</strong>.<br />
• Received federal grant funding for transit projects that otherwise may have been cut as<br />
fixed route bus service was impacted in all Valley cities.<br />
• With a Department <strong>of</strong> Energy grant, completed the conversion to LED lights throughout<br />
Glendale. The grant enabled 30 intersections to be converted, making all <strong>of</strong> Glendale’s<br />
190 signalized intersections equipped with LED lighting. The higher quality lamps will<br />
require less maintenance, resulting in fewer lane closures due to repairs.<br />
• Received a $1.2 million boost from federal grants awarded to improve air quality and<br />
reduce roadway congestion. The grants, which funded the design phase <strong>of</strong> five projects,<br />
expanded the <strong>city</strong>’s use <strong>of</strong> Intelligent Transportation Systems (ITS) for its traffic<br />
network.<br />
• Garnered an Energy Efficiency Conservation Block Grant (EECBG) to expand Glendale’s<br />
educational <strong>of</strong>ferings beyond water conservation to other topics <strong>of</strong> green living.<br />
109<br />
Return to TOC
Mission and Performance Measure<br />
Mayor and City Council<br />
Interesting Facts<br />
The Glendale Civic Center broke all attendance records this past year, and once again, was voted<br />
one <strong>of</strong> the best venues in the state for meetings, events, weddings and conferences in the Phoenix<br />
Business Journal’s “Ranking Arizona.”<br />
Camelback Ranch – Glendale, the home <strong>of</strong> the Chicago White Sox and Los Angeles Dodgers, was<br />
named winner <strong>of</strong> a 2010 WESTMARC Best <strong>of</strong> the West Award in the “Attractions, Entertainment &<br />
Destinations” category in the West Valley.<br />
110<br />
Return to TOC
City <strong>of</strong> Glendale<br />
Budget Summary by Department<br />
Mayor<br />
FUND NUMBER /<br />
BUDGET BY PROGRAM<br />
FY 2010<br />
Actual<br />
FY <strong>2011</strong><br />
Budget<br />
FY <strong>2011</strong><br />
Estimate<br />
FY 20<strong>12</strong><br />
Budget<br />
Percent Over<br />
FY <strong>2011</strong> Budget<br />
(1000) Office <strong>of</strong> the Mayor<br />
$339,466 $334,216 $334,216 $333,342 0%<br />
Total - Mayor $339,466 $334,216 $334,216 $333,342 0%<br />
BUDGET BY CATEGORIES<br />
OF EXPENDITURES<br />
FY 2010<br />
Actual<br />
FY <strong>2011</strong><br />
Budget<br />
FY <strong>2011</strong><br />
Estimate<br />
FY 20<strong>12</strong><br />
Budget<br />
Percent Over<br />
FY <strong>2011</strong> Budget<br />
Wages/Salaries/Benefits $309,306 $323,181 $323,181 $335,289 4%<br />
Supplies and Contracts $23,5<strong>12</strong> $18,087 $18,087 $18,087 0%<br />
Internal Premiums $3,329 $3,5<strong>12</strong> $3,5<strong>12</strong> $3,427 -2%<br />
Internal Service Charges $3,319 $3,076 $3,076 $2,821 -8%<br />
Work Order Credits ($13,640) ($13,640) ($26,282) 93%<br />
Total - Mayor $339,466 $334,216 $334,216 $333,342 0%<br />
STAFFING BY PROGRAM<br />
FY 2010<br />
Actual<br />
FY <strong>2011</strong><br />
Budget<br />
FY <strong>2011</strong><br />
Estimate<br />
FY 20<strong>12</strong><br />
Budget<br />
Percent Over<br />
FY <strong>2011</strong> Budget<br />
(1000) Office <strong>of</strong> the Mayor 4<br />
4 4 4 0%<br />
Total -Mayor 4 4 4 4 0%<br />
111<br />
Return to TOC
City <strong>of</strong> Glendale<br />
Budget Summary by Department<br />
Council Office<br />
FUND NUMBER /<br />
BUDGET BY PROGRAM<br />
FY 2010<br />
Actual<br />
FY <strong>2011</strong><br />
Budget<br />
FY <strong>2011</strong><br />
Estimate<br />
FY 20<strong>12</strong><br />
Budget<br />
Percent Over<br />
FY <strong>2011</strong> Budget<br />
(1000) Barrel District<br />
$72,452 $69,187 $54,162 $99,446 44%<br />
(1000) Cactus District<br />
$74,501 $94,377 $79,693 $99,213 5%<br />
(1000) Cholla District<br />
$65,160 $74,685 $59,656 $104,581 40%<br />
(1000) Council Office<br />
$511,669 $445,694 $445,694 $489,998 10%<br />
(1000) Ocotillo District<br />
$66,586 $92,131 $75,988 $99,223 8%<br />
(1000) Sahuaro District<br />
$76,257 $76,829 $56,923 $99,264 29%<br />
(1000) Yucca District<br />
$80,694 $69,352 $55,337 $99,258 43%<br />
Total - Council Office $947,319 $922,255 $827,453 $1,090,983 18%<br />
BUDGET BY CATEGORIES<br />
OF EXPENDITURES<br />
FY 2010<br />
Actual<br />
FY <strong>2011</strong><br />
Budget<br />
FY <strong>2011</strong><br />
Estimate<br />
FY 20<strong>12</strong><br />
Budget<br />
Percent Over<br />
FY <strong>2011</strong> Budget<br />
Wages/Salaries/Benefits $791,145 $745,504 $745,504 $820,134 10%<br />
Supplies and Contracts $133,082 $174,969 $80,167 $298,933 71%<br />
Internal Premiums $<strong>12</strong>,218 $14,858 $14,858 $14,865 0%<br />
Internal Service Charges $10,874 $10,322 $10,322 $9,764 -5%<br />
Work Order Credits ($23,398) ($23,398) ($52,713) <strong>12</strong>5%<br />
Total - Council Office $947,319 $922,255 $827,453 $1,090,983 18%<br />
STAFFING BY PROGRAM<br />
FY 2010<br />
Actual<br />
FY <strong>2011</strong><br />
Budget<br />
FY <strong>2011</strong><br />
Estimate<br />
FY 20<strong>12</strong><br />
Budget<br />
Percent Over<br />
FY <strong>2011</strong> Budget<br />
(1000) Barrel District 1<br />
1 1 1 0%<br />
(1000) Cactus District 1<br />
1 1 1 0%<br />
(1000) Cholla District 1<br />
1 1 1 0%<br />
(1000) Council Office 7<br />
6 7 7 17%<br />
(1000) Ocotillo District 1<br />
1 1 1 0%<br />
(1000) Sahuaro District 1<br />
1 1 1 0%<br />
(1000) Yucca District 1<br />
1 1 1 0%<br />
Total -Council Office 13 <strong>12</strong> 13 13 8%<br />
1<strong>12</strong><br />
Return to TOC
Mission and Performance Measure<br />
City Attorney's Office<br />
CITY ATTORNEY'S OFFICE<br />
Craig Tindall<br />
Mission Statement:<br />
Provide the highest level <strong>of</strong> legal services to the <strong>city</strong> and its <strong>of</strong>ficials by adhering to pr<strong>of</strong>essional<br />
standards, garnering strong understanding <strong>of</strong> <strong>city</strong> operations and incorporating all relevant<br />
information into the legal advice and guidance provided.<br />
To serve the people <strong>of</strong> Arizona by prosecuting violations <strong>of</strong> the <strong>city</strong> code and misdemeanor<br />
violations <strong>of</strong> state law in an ethical manner in order to assure that justice is done.<br />
Department Description:<br />
The City Attorney is appointed by the City Council and acts as legal adviser to the <strong>city</strong>, its<br />
<strong>of</strong>ficials, departments, as well as boards and commissions on matters that affect the conduct <strong>of</strong><br />
<strong>city</strong> business. The City Attorney’s Office represents the <strong>city</strong> in all legal proceedings and directs<br />
the legal services provided by outside counsel. The Office also prepares resolutions, ordinances<br />
and related legal documents for City Council consideration in order to implement adopted <strong>city</strong><br />
policy, draft and review all contracts considered by the <strong>city</strong>, and issue opinions on a variety <strong>of</strong><br />
municipal matters.<br />
The City Attorney’s Office works closely with the police department with ongoing training <strong>of</strong> its<br />
<strong>of</strong>ficers relating to state and <strong>city</strong> laws. The <strong>of</strong>fice is responsible for prosecuting any<br />
misdemeanor violation that occurs within the <strong>city</strong> limits including violations <strong>of</strong> Glendale City<br />
Code, DUI and domestic violence cases. The Office also handles conflict cases for other cities<br />
as well as the Maricopa County Attorney’s Office.<br />
FISCAL YEAR 20<strong>12</strong><br />
Goal<br />
Related Council Goal<br />
Activities<br />
Expected Outcomes<br />
(Perf. Measures)<br />
Time Commitment<br />
Expected Challenges<br />
GOALS<br />
Provide high-quality, pr<strong>of</strong>essional and timely legal services<br />
to the Mayor, Council and <strong>city</strong> staff.<br />
One community with high quality services for its citizens.<br />
Continue to provide excellent legal and procedural guidance<br />
to City Council and administrative bodies as needed for <strong>city</strong><br />
operations. Attend 100% <strong>of</strong> the meetings or hearings as<br />
needed or requested.<br />
Develop strong relationships with departments and<br />
Goal is an ongoing effort.<br />
None.<br />
113<br />
Return to TOC
Mission and Performance Measure<br />
City Attorney's Office<br />
Goal<br />
Related Council Goal<br />
Activities<br />
Expected Outcomes<br />
(Perf. Measures)<br />
Time Commitment<br />
Expected Challenges<br />
Work to ensure the consistent and ethical application <strong>of</strong><br />
criminal justice.<br />
One community focused on public safety for citizens and<br />
visitors.<br />
Continue to aggressively prosecute City Code and state law<br />
misdemeanor violations.<br />
Obtain 80% conviction rate or plea agreements on<br />
misdemeanor charges. When appropriate, facilitate<br />
resolution <strong>of</strong> cases by mediation and successful completion<br />
<strong>of</strong> diversion programs.<br />
Goal is an ongoing effort.<br />
Budget constraints.<br />
FISCAL YEAR <strong>2011</strong><br />
Area <strong>of</strong> Innovation:<br />
• Through a Governor’s Office <strong>of</strong> Highway Safety grant, laptops and printers were<br />
purchased and wireless hubs installed in the court house for the prosecutors. The<br />
equipment made it possible to create plea agreements, receive documents from the<br />
Motor Vehicle Division, receive and communicate with the <strong>of</strong>fice by e-mail, access the<br />
Office JustWare program and print while anywhere in the Courthouse. Consequently,<br />
the prosecutors have seen an improvement in their overall management <strong>of</strong> their cases<br />
as well as improvement reduction in the amount <strong>of</strong> time required by both prosecutors<br />
and support staff to complete their duties.<br />
Accomplishments:<br />
• Continued to represent the <strong>city</strong> in litigation brought by third parties.<br />
• Vigorously prosecuted all <strong>city</strong> code violations and misdemeanor violations <strong>of</strong> state law<br />
that are supported by probable cause and ensure that justice is served.<br />
Goal<br />
Related Council Goal<br />
Was the goal met?<br />
What were the<br />
Performance Measures?<br />
Obstacles/Challenges<br />
GOAL UPDATES<br />
Provide high-quality, pr<strong>of</strong>essional and timely legal services to the<br />
Mayor, City Council and City Staff.<br />
One community with high quality services for its citizens.<br />
Yes.<br />
Attend 100% <strong>of</strong> the meetings/hearings as needed or requested.<br />
None.<br />
114<br />
Return to TOC
Mission and Performance Measure<br />
City Attorney's Office<br />
Goal<br />
Related Council Goal<br />
Was the goal met?<br />
What were the<br />
Performance Measures?<br />
Obstacles/Challenges<br />
Serve the people <strong>of</strong> Arizona by assuring the consistent and ethical<br />
application <strong>of</strong> criminal justice.<br />
One community focused on public safety for citizens and visitors.<br />
Yes.<br />
Obtain 85% conviction rate or plea agreements on misdemeanor<br />
charges.<br />
Budget constraints.<br />
FISCAL YEAR 2010<br />
Area <strong>of</strong> Innovation:<br />
• Continue to utilize the case management system for the City Prosecutor’s Office along<br />
with using law student interns.<br />
Accomplishments:<br />
• Continued to represent the <strong>city</strong> in litigation brought by third parties.<br />
• Vigorously prosecuted all <strong>city</strong> code violations and misdemeanor violations <strong>of</strong> state law<br />
that are supported by probable cause and ensure that justice is served.<br />
Goal<br />
Related Council Goal<br />
Was the goal met?<br />
What were the<br />
Performance Measures?<br />
Obstacles/Challenges<br />
Goal<br />
Related Council Goal<br />
Was the goal met?<br />
What were the<br />
Performance Measures?<br />
Obstacles/Challenges<br />
GOAL UPDATES<br />
Provide high-quality, pr<strong>of</strong>essional and timely legal services to the<br />
mayor, <strong>city</strong> council and <strong>city</strong> staff.<br />
One community with high quality services for citizens.<br />
Yes.<br />
Attend 100% <strong>of</strong> the meetings/hearings as needed or requested.<br />
None.<br />
Serve the people <strong>of</strong> Arizona by assuring the consistent and ethical<br />
application <strong>of</strong> criminal justice.<br />
One community focused on public safety.<br />
Yes.<br />
Obtain 85% conviction rate or plea agreements on misdemeanor<br />
charges.<br />
None.<br />
115<br />
Return to TOC
City <strong>of</strong> Glendale<br />
Budget Summary by Department<br />
City Attorney<br />
FUND NUMBER /<br />
BUDGET BY PROGRAM<br />
FY 2010<br />
Actual<br />
FY <strong>2011</strong><br />
Budget<br />
FY <strong>2011</strong><br />
Estimate<br />
FY 20<strong>12</strong><br />
Budget<br />
Percent Over<br />
FY <strong>2011</strong> Budget<br />
(1000) Attorney-Spec Proj Fees/Costs<br />
$3,527,908 $0 $0 $0 NA<br />
(1000) City Attorney<br />
$2,321,104 $2,339,684 $2,458,342 $2,353,306 1%<br />
(1000) Outside Legal Fees<br />
$0 $500,000 $500,000 $500,000 0%<br />
Total - City Attorney $5,849,0<strong>12</strong> $2,839,684 $2,958,342 $2,853,306 0%<br />
BUDGET BY CATEGORIES<br />
OF EXPENDITURES<br />
FY 2010<br />
Actual<br />
FY <strong>2011</strong><br />
Budget<br />
FY <strong>2011</strong><br />
Estimate<br />
FY 20<strong>12</strong><br />
Budget<br />
Percent Over<br />
FY <strong>2011</strong> Budget<br />
Wages/Salaries/Benefits $2,190,800 $2,290,892 $2,409,550 $2,461,073 7%<br />
Supplies and Contracts $3,617,525 $628,336 $628,336 $596,919 -5%<br />
Internal Premiums $32,558 $32,802 $32,802 $30,586 -7%<br />
Internal Service Charges $8,<strong>12</strong>9 $8,340 $8,340 $7,818 -6%<br />
Work Order Credits ($<strong>12</strong>0,686) ($<strong>12</strong>0,686) ($243,090) 101%<br />
Total - City Attorney $5,849,0<strong>12</strong> $2,839,684 $2,958,342 $2,853,306 0%<br />
STAFFING BY PROGRAM<br />
FY 2010<br />
Actual<br />
FY <strong>2011</strong><br />
Budget<br />
FY <strong>2011</strong><br />
Estimate<br />
FY 20<strong>12</strong><br />
Budget<br />
Percent Over<br />
FY <strong>2011</strong> Budget<br />
(1000) City Attorney 28<br />
26 27 27 4%<br />
Total -City Attorney 28 26 27 27 4%<br />
116<br />
Return to TOC
Mission and Performance Measure<br />
City Clerk's Department<br />
CITY CLERK'S DEPARTMENT<br />
Pam Hanna<br />
Mission Statement:<br />
To constantly maintain superior service to the citizens, elected <strong>of</strong>ficials and staff by providing an<br />
accurate and current legislative record including the City Code Book; a comprehensive and<br />
accessible records management system; a responsible and effective public notification program;<br />
an impartial and efficient municipal election, campaign finance, and redistricting process and<br />
other public services such as processing public record requests, recording documents, preparing<br />
City Council minutes and retaining permanent <strong>city</strong> records.<br />
Department Description:<br />
The City Clerk’s Department informs the public regarding:<br />
• What the <strong>city</strong> is planning by publishing and posting meeting agendas and public notices<br />
to both the <strong>of</strong>ficial notice board and City Clerk’s internet page.<br />
• The actions taken at public meetings by preparing the minutes <strong>of</strong> the City Council<br />
meetings and making the minutes <strong>of</strong> all meetings available. All City Council and other<br />
<strong>city</strong> board minutes are posted on the City Clerk’s internet page.<br />
The City Clerk’s Department manages:<br />
• The City Charter and Code Book and makes it available in our <strong>of</strong>fice and on the internet<br />
so the public can research and know the laws, processes and regulations <strong>of</strong> the <strong>city</strong>. The<br />
City Clerk’s staff responds to inquiries regarding public notices, minutes, agendas,<br />
ordinances, resolutions, contracts, elections, charter and code <strong>book</strong>.<br />
• The <strong>city</strong>’s records management program; staff directs the processing, organizing, and<br />
storing <strong>of</strong> all the records. The Records Center is where thousands <strong>of</strong> records are stored,<br />
scanned and/or micr<strong>of</strong>ilmed. Public records are made available upon request.<br />
The City Clerk’s Department plans and conducts municipal elections protecting our citizens’<br />
right to participate in municipal government. Voter outreach is conducted through in person<br />
voter registration and permanent early voter events. Permanent early voting is emphasized for<br />
two reasons – it makes voting easier for citizens and voter turnout increases. Voters are also<br />
educated about <strong>city</strong> elections using the webpage, legal notices and press releases to the media.<br />
Assistance is also <strong>of</strong>fered to citizens who may wish to run for <strong>of</strong>fice.<br />
FISCAL YEAR 20<strong>12</strong><br />
Goal<br />
GOALS<br />
Successful completion <strong>of</strong> City Charter. State and Federal<br />
statutes mandate redistricting <strong>of</strong> the existing six Council<br />
districts to reflect changes in population and demographics<br />
pursuant to the 2010 Decennial Census.<br />
117<br />
Return to TOC
Mission and Performance Measure<br />
City Clerk's Department<br />
Related Council Goal<br />
Activities<br />
Expected Outcomes<br />
(Perf. Measures)<br />
Time Commitment<br />
Expected Challenges<br />
Goal<br />
Related Council Goal<br />
Activities<br />
Expected Outcomes<br />
(Perf. Measures)<br />
Time Commitment<br />
One community with high-quality services for citizens.<br />
Coordination <strong>of</strong> interdepartmental Redistricting Committee;<br />
coordination <strong>of</strong> consultants activities; data<br />
collection/analysis; development <strong>of</strong> data base/mapping;<br />
scheduling/hosting public meetings; development/ execution<br />
<strong>of</strong> Internet page and citizen outreach plan, and managing<br />
submittal process to Maricopa County/Justice Department.<br />
City Council and Justice Department approval <strong>of</strong> <strong>2011</strong> City<br />
<strong>of</strong> Glendale Redistricting Proposal.<br />
Anticipated time commitment daily for six months is<br />
anticipated as follows: 50% or more for City Clerk; 45%<br />
Deputy City Clerk; 35% for Record Supervisor; 20%<br />
Management Aide and 6 hours monthly for each <strong>of</strong> the 7<br />
interdepartmental members <strong>of</strong> the Redistricting Committee.<br />
The greatest challenges are the time constraints imposed by<br />
the Oct. 1, <strong>2011</strong> submittal deadline to the Justice Department<br />
and Maricopa County; this complex process involves input<br />
from citizens, <strong>city</strong> <strong>of</strong>ficials, key staff, as well as mandated<br />
legal requirements and public meetings.<br />
Completion <strong>of</strong> Parks and Recreation Department Pilot<br />
Project group that is conducting an electronic purging <strong>of</strong><br />
expired documents according to the <strong>city</strong>’s retention<br />
schedules. The goal <strong>of</strong> this endeavor is to create a<br />
reproducible manual that can be used to conduct electronic<br />
purges <strong>of</strong> department files on a regular basis. The long-term<br />
goal is to hold an <strong>annual</strong> Electronic Records Purge Day.<br />
One community with high-quality services for citizens.<br />
A step-by-step electronic purging process is being developed<br />
and implemented within the City Clerk’s Department. This<br />
electronic purging process will be documented and is the<br />
basis <strong>of</strong> a pilot project in the Parks and Recreation<br />
Administration Division. Eligible documents will be<br />
identified per the retention schedule. The records will be<br />
documented and then electronically purged.<br />
This pilot project will demonstrate how a reduction in<br />
expired documents can measurably replenish server space and<br />
reduce organizational costs, as well as save employee time<br />
when searching for information.<br />
The pilot project will include training, electronic document<br />
identification, and documentation <strong>of</strong> documents purged. Time<br />
spent will be intermittent for three staff members and it is<br />
anticipated that it will be completed in a 6 month timeframe.<br />
118<br />
Return to TOC
Mission and Performance Measure<br />
City Clerk's Department<br />
Additional projects will follow in other departments.<br />
Expected Challenges<br />
The expected challenges are scheduling the time necessary<br />
and ensuring all steps are completed.<br />
FISCAL YEAR <strong>2011</strong><br />
Area <strong>of</strong> Innovation:<br />
• Searching capabilities were improved by adding an additional field to the electronic<br />
record management contract index. Due to the increasing number <strong>of</strong> requests for<br />
contracts and additional questions about the City Council meeting approval dates, the<br />
contract process was modified to include this information as an ongoing searchable<br />
field at no additional cost to the <strong>city</strong>.<br />
Accomplishments:<br />
• Updated the City Clerk Services manual. The manual is an aid to employees <strong>of</strong> other<br />
departments doing business with the City Clerk’s Department; training on City Clerk’s<br />
Services held with the objective <strong>of</strong> the familiarizing employees with our processes, the<br />
Services Manual, and to answer specific questions.<br />
• The 2010 Primary and General Elections were completed, with the approval <strong>of</strong> the<br />
Canvass <strong>of</strong> Votes by the City Council. Election process includes a myriad <strong>of</strong> legal,<br />
managerial, and intergovernmental processes.<br />
• Purge Day was held in January, partnering with Field Operations, Landfill, MRF and<br />
Materials controls. The City Clerk’s Department and 26 departments purged 459<br />
banker boxes or 84 recycle cans, resulting in 17,300 pounds <strong>of</strong> recycled paper.<br />
Goal<br />
Related Council Goal<br />
Was the goal met?<br />
What were the<br />
Performance Measures?<br />
Obstacles/Challenges<br />
GOAL UPDATES<br />
Plan and initiate voter outreach events.<br />
One community with high quality services for citizens.<br />
Yes, with events occurring in August 2010 at Freshman<br />
Orientation Day at ASU West; March <strong>2011</strong> at the Green Festival<br />
at the Main Library; April <strong>2011</strong> at the International Festival at<br />
Glendale Community College and West CultureFest at ASU West.<br />
All voter outreach events were located within the <strong>city</strong> hosting<br />
regional events held during peak time such as weekend or evening<br />
for greatest potential contact; support by three volunteers from<br />
Mayor Youth Advisory and two volunteers from local<br />
colleges/universities.<br />
These events were held on nights and weekends and it was a<br />
challenge to hold more due to limited staff availability at these<br />
119<br />
Return to TOC
Mission and Performance Measure<br />
City Clerk's Department<br />
times.<br />
Goal<br />
Related Council Goal<br />
Was the goal met?<br />
What were the<br />
Performance Measures?<br />
Obstacles/Challenges<br />
Plan and conduct records management classes for the<br />
organization.<br />
One community with high quality services for citizens.<br />
Yes. Two classes were held, one focused on records management<br />
and one City Clerk Services class conducted for the organization.<br />
Classes were interactive with questions and discussion. The<br />
Records Management Class had 17 participants from <strong>12</strong><br />
departments. The City Clerk Services class had 53 participants<br />
from 19 departments.<br />
Due to limited staff time and conflicting meeting times, lower<br />
attendance was noticed at these classes.<br />
FISCAL YEAR 2010<br />
Area <strong>of</strong> Innovation:<br />
• Scanned closed court case files to reduce <strong>of</strong>fsite storage fees.<br />
Accomplishments:<br />
• City Court scanning project resulted in over 8000 case files being available through<br />
scanning s<strong>of</strong>tware.<br />
• Voter outreach was conducted at 11 different sites including libraries, colleges,<br />
universities, shopping centers and <strong>city</strong> community centers. Voters were given<br />
information about registering, changing addresses and signing up for the permanent<br />
early voter list.<br />
Goal<br />
Related Council Goal<br />
Was the goal met?<br />
What were the<br />
Performance Measures?<br />
GOAL UPDATES<br />
Per Arizona State record schedules, reduce the volume <strong>of</strong> records<br />
maintained on servers and drives; recapture storage space to<br />
extend the life <strong>of</strong> servers and postpone additional server and hard<br />
drive purchases. Limit purge <strong>of</strong> records to records retained past<br />
the retention period and duplicate records.<br />
One community with high quality services for citizens.<br />
The City Clerk’s Department as a pilot project, created a step-bystep<br />
purging process for electronic files. Documentation was<br />
created and forwarded to the Information Technology Department<br />
outlining the process used and issues identified. Deleted 1,600<br />
files, 55 folders, and 1 KB <strong>of</strong> memory.<br />
30% reduction in organizational electronic records stored on <strong>city</strong><br />
servers and hard drives.<br />
<strong>12</strong>0<br />
Return to TOC
Mission and Performance Measure<br />
City Clerk's Department<br />
Obstacles/Challenges<br />
Goal<br />
Related Council Goal<br />
Was the goal met?<br />
What were the<br />
Performance Measures?<br />
Obstacles/Challenges<br />
Determining the value <strong>of</strong> electronic records when located in more<br />
than one searchable area.<br />
The City Clerk Department will plan and conduct organizational<br />
records management training in various subject modules.<br />
One community with high quality services for citizens.<br />
Yes, two classes were <strong>of</strong>fered on January 20, 2010. Topics<br />
included records management, retention, purging and using<br />
scanning and retention s<strong>of</strong>tware. Information was posted on the<br />
<strong>city</strong>’s intranet site to inform departments <strong>of</strong> the services, training<br />
and information available from the City Clerk department.<br />
A minimum <strong>of</strong> two classes <strong>of</strong>fered <strong>annual</strong>ly.<br />
None.<br />
<strong>12</strong>1<br />
Return to TOC
City <strong>of</strong> Glendale<br />
Budget Summary by Department<br />
City Clerk<br />
FUND NUMBER /<br />
BUDGET BY PROGRAM<br />
FY 2010<br />
Actual<br />
FY <strong>2011</strong><br />
Budget<br />
FY <strong>2011</strong><br />
Estimate<br />
FY 20<strong>12</strong><br />
Budget<br />
Percent Over<br />
FY <strong>2011</strong> Budget<br />
(1000) City Clerk<br />
$379,779 $397,551 $397,551 $372,249 -6%<br />
(1000) Elections<br />
$1,499 $137,723 $55,108 $111,556 -19%<br />
(1000) Records Management<br />
$143,981 $140,727 $140,727 $134,634 -4%<br />
Total - City Clerk $525,259 $676,001 $593,386 $618,439 -9%<br />
BUDGET BY CATEGORIES<br />
OF EXPENDITURES<br />
FY 2010<br />
Actual<br />
FY <strong>2011</strong><br />
Budget<br />
FY <strong>2011</strong><br />
Estimate<br />
FY 20<strong>12</strong><br />
Budget<br />
Percent Over<br />
FY <strong>2011</strong> Budget<br />
Wages/Salaries/Benefits $450,997 $492,954 $492,954 $488,853 -1%<br />
Supplies and Contracts $57,149 $194,196 $111,581 $166,092 -14%<br />
Internal Premiums $<strong>12</strong>,849 $10,862 $10,862 $9,139 -16%<br />
Internal Service Charges $4,264 $3,427 $3,427 $3,203 -7%<br />
Work Order Credits ($25,438) ($25,438) ($48,848) 92%<br />
Total - City Clerk $525,259 $676,001 $593,386 $618,439 -9%<br />
STAFFING BY PROGRAM<br />
FY 2010<br />
Actual<br />
FY <strong>2011</strong><br />
Budget<br />
FY <strong>2011</strong><br />
Estimate<br />
FY 20<strong>12</strong><br />
Budget<br />
Percent Over<br />
FY <strong>2011</strong> Budget<br />
(1000) City Clerk 4<br />
4 4 4 0%<br />
(1000) Records Management 2<br />
2 2 2 0%<br />
Total -City Clerk 6 6 6 6 0%<br />
<strong>12</strong>2<br />
Return to TOC
Mission and Performance Measure<br />
City Court<br />
CITY COURT<br />
Judge Finn<br />
Mission Statement:<br />
To provide a forum for prompt, fair and just resolution <strong>of</strong> cases in a pr<strong>of</strong>essional, efficient and<br />
courteous manner.<br />
Department Description:<br />
Glendale City Court adjudicates criminal misdemeanors, City Code violations, traffic violations,<br />
and certain juvenile <strong>of</strong>fenses committed in the <strong>city</strong> <strong>of</strong> Glendale. In cases <strong>of</strong> domestic violence<br />
and harassment, the Court issues protective orders. The Court has the authority to issue search<br />
warrants for misdemeanors and felonies. Glendale City Court collaborates with numerous<br />
internal and external justice and community agencies to develop and implement programs to<br />
reduce recidivism and promote safe communities. Approximately <strong>12</strong>0,000 customers enter the<br />
Court each year to conduct business.<br />
FISCAL YEAR 20<strong>12</strong><br />
Goal<br />
Related Council Goal<br />
Activities<br />
Expected Outcomes<br />
(Perf. Measures)<br />
Time Commitment<br />
Expected Challenges<br />
Goal<br />
Related Council Goal<br />
Activities<br />
GOALS<br />
Continue to process and adjudicate cases in accordance with<br />
state statutes, rules <strong>of</strong> the Supreme Court and the US<br />
Constitution, while maintaining superior customer service.<br />
One community with high-quality services for citizens.<br />
Compile a monthly DUI case aging report to monitor<br />
adjudication status. Continually review docket settings to<br />
insure sufficient trial and pre-trial conference calendar<br />
volume levels are maintained.<br />
No backlog observed on court calendared cases. Individual<br />
case terminations will continue to exceed case filings.<br />
This is an ongoing goal requiring daily review by Court<br />
Operations managers and staff as they prepare and<br />
disseminate all courtroom calendars.<br />
The Court strives to maintain high efficiency levels in all<br />
business practices despite decreasing staffing levels.<br />
Develop additional electronic court forms to reduce costs<br />
and maximize staffing resources. Q<br />
One community that is fiscally sound.<br />
Use information technology solutions to create new<br />
electronic forms and improve existing forms.<br />
<strong>12</strong>3<br />
Return to TOC
Mission and Performance Measure<br />
City Court<br />
Expected Outcomes<br />
(Perf. Measures)<br />
Time Commitment<br />
Expected Challenges<br />
Decreased duplicating costs.<br />
This is an ongoing activity involving review and<br />
implementation by Court Administration and the Court’s<br />
Systems Analyst.<br />
Extensive training on new forms will be conducted with all<br />
court clerks to alleviate apprehension and uncertainty with<br />
associated changes in policies and procedures.<br />
FISCAL YEAR <strong>2011</strong><br />
Area <strong>of</strong> Innovation:<br />
• Glendale City Court has increased the flexibility, frequency, and cost effectiveness <strong>of</strong><br />
training its staff to meet <strong>annual</strong> judicial education requirements mandated by the<br />
Supreme Court. The Court’s Training Coordinator organized a Faculty Skills<br />
Development (FSD) Training Team to conduct in-house training courses on a variety<br />
<strong>of</strong> judicial education topics. The FSD Training Team <strong>of</strong>fers at least one training class<br />
per month to staff to supplement the Court’s ongoing training calendar. During 2010,<br />
the Training Coordinator accredited 74 different classes, e-learning opportunities and<br />
independent learning modules including 29 on-site courses. Adding to its menu <strong>of</strong><br />
training opportunities, Glendale City Court serves as a satellite receptor site for<br />
statewide broadcast events sponsored by the Arizona Supreme Court and other entities.<br />
Accomplishments:<br />
• Arizona law enables misdemeanant domestic violence <strong>of</strong>fenders with one prior<br />
conviction to be placed on felony-level supervision <strong>of</strong>fered by the Maricopa County<br />
Adult Probation Department. In Glendale City Court, a caseload <strong>of</strong> such defendants is<br />
actively supervised in the community by a specialized domestic violence probation<br />
<strong>of</strong>ficer/surveillance <strong>of</strong>ficer team. In late 2010 this probation team assisted the Court in<br />
developing a monthly review calendar for all second-<strong>of</strong>fense domestic violence<br />
<strong>of</strong>fenders. These individuals are summoned to Court for a formal review <strong>of</strong> their<br />
compliance status toward counseling orders and financial sanctions. Noncompliant<br />
defendants face added punishment, such as community service and incarceration.<br />
Since this process was implemented, probation <strong>of</strong>ficers report that defendants are more<br />
actively engaged in complying with the conditions <strong>of</strong> their probation directives.<br />
• Glendale’s Treatment Court Program for DUI and domestic violence defendants<br />
recorded its 5,000th successful graduate this year. For six years, this specialized court<br />
has insured <strong>of</strong>fender accountability through frequent judicial oversight and close<br />
monitoring <strong>of</strong> sentencing conditions. Looking forward through fiscal years <strong>2011</strong> and<br />
20<strong>12</strong>, the Court will phase out all DUI cases from the Treatment Court program and<br />
instead closely monitor these cases under separate review hearings. The result will be<br />
a specialized Treatment Court dedicated solely to monitoring domestic violence<br />
<strong>12</strong>4<br />
Return to TOC
Mission and Performance Measure<br />
City Court<br />
defendants. A recent court study on program outcomes and effectiveness <strong>of</strong> Treatment<br />
Court helped initiate this change, which will lead to better allocation <strong>of</strong> court staffing<br />
resources. Treatment Court is a past recipient <strong>of</strong> the Arizona Supreme Court’s “Justice<br />
for a Better Arizona” Achievement Award.<br />
Goal<br />
Related Council Goal<br />
Was the goal met?<br />
What were the<br />
Performance Measures?<br />
Obstacles/Challenges<br />
Goal<br />
Related Council Goal<br />
Was the goal met?<br />
GOAL UPDATES<br />
Increase defendant compliance rates with court financial<br />
obligations.<br />
One community that is fiscally sound.<br />
An automated financial contracts module has been designed and<br />
deployed through the Court’s AZTEC Wizard case management<br />
system. Phone calls to defendants are now triggered after the first<br />
missed payment. The contracts module is saving staff time<br />
through reduced direct contact with the public.<br />
Implemented new fines collection strategies to increase defendant<br />
compliance.<br />
Comprehensive training and project updates were necessary to<br />
insure staff was comfortable with new business practices.<br />
Sufficient staffing levels are directly correlated to effectively<br />
processing the volume <strong>of</strong> revenue-generating phone calls arising<br />
from the new contracts module. However, reduced staffing levels<br />
have accompanied deployment <strong>of</strong> the contracts module.<br />
Increase the operational efficiency <strong>of</strong> jail court services and<br />
reduce jail court costs.<br />
One community committed to public safety.<br />
One community that is fiscally sound.<br />
• Jail Court calendaring modifications allowed the<br />
elimination <strong>of</strong> inmate transportation to Jail Court each Thursday<br />
morning, which achieves direct cost savings for the Police<br />
Department’s prisoner maintenance <strong>budget</strong>.<br />
• The Court Jail Efficiencies Committee worked with the<br />
City Prosecutors Office to recommend changes in custody policies<br />
to save additional jail costs. When automated detention databases<br />
reveal a Glendale inmate is also being held in custody from<br />
another jurisdiction, that defendant is now released on their own<br />
recognizance to insure Glendale does not incur the incarceration<br />
costs. The defendant remains in custody on the alternate<br />
jurisdiction’s charge. Since June 2010, <strong>book</strong>ings <strong>of</strong> 83 Glendale<br />
defendants were avoided due to custody holds from other<br />
jurisdictions. Had these defendants been <strong>book</strong>ed, a minimum <strong>of</strong><br />
<strong>12</strong>5<br />
Return to TOC
Mission and Performance Measure<br />
City Court<br />
$15,600 in costs would have been incurred for the first jail day<br />
alone.<br />
• Jail expenditures paid by the Glendale Police Department<br />
to the Maricopa County Sheriff’s Office were reduced by more<br />
than $214,000 between fiscal years 2009 and 2010, in part due to<br />
the work <strong>of</strong> the Court Jail Efficiencies Committee.<br />
What were the<br />
Performance Measures?<br />
Obstacles/Challenges<br />
• Home detention with electronic monitoring and random<br />
alcohol testing continues to provide substantial cost savings.<br />
During 2010, 305 defendants successfully completed their home<br />
detention sentencing requirements for a total <strong>of</strong> 9,069 days <strong>of</strong><br />
electronic monitoring in lieu <strong>of</strong> incarceration. Had these 9,069<br />
days been spent in jail, more than $667,000 would have been<br />
incurred in jail costs. All defendants are carefully screened to<br />
preclude home detention participation by violent <strong>of</strong>fenders.<br />
Reduced jail court operational costs for the City <strong>of</strong> Glendale.<br />
Proposed legislative bills on home detention require close<br />
monitoring for potential impacts on court and detention<br />
operations.<br />
FISCAL YEAR 2010<br />
Area <strong>of</strong> Innovation:<br />
• Glendale City Court is collaborating with the Police Department to recruit a fulltime,<br />
grant funded Protective Order Service Coordinator. This unique position will work<br />
with five other area courts and their police agencies to increase the rates <strong>of</strong> successful<br />
protective order service in the West Valley, thus enhancing the safety and wellbeing <strong>of</strong><br />
domestic violence victims. The Protective Order Service Coordinator is one <strong>of</strong> several<br />
domestic violence services and program enhancements funded by a $400,000 grant<br />
from the U.S. Department <strong>of</strong> Justice.<br />
Accomplishments:<br />
• Glendale’s Treatment Court for DUI and domestic violence defendants recorded its<br />
4,200th program graduate this year. For six years, this specialized court has insured<br />
<strong>of</strong>fender accountability through frequent judicial status hearings and close monitoring<br />
<strong>of</strong> counseling and other sentencing conditions. Noncompliant participants receive<br />
swift consequences such as additional jail time or community restitution. Treatment<br />
Court is a past recipient <strong>of</strong> the Arizona Supreme Court’s “Justice for a Better Arizona”<br />
achievement award.<br />
• The Court has expanded its community restitution program to include projects with the<br />
<strong>city</strong>’s Community Partnerships Department and the Housing Assistance Program.<br />
<strong>12</strong>6<br />
Return to TOC
Mission and Performance Measure<br />
City Court<br />
Community restitution projects to aid nonpr<strong>of</strong>it agencies are a common sanction<br />
imposed on noncompliant Treatment Court participants. These defendants are now<br />
performing landscaping, painting, alley cleanup and other services at public housing<br />
sites, in addition to community restitution projects at several nonpr<strong>of</strong>it agencies in<br />
Glendale. During FY 2010 more than 600 community restitution project orders were<br />
issued in Treatment Court that will help to improve the quality <strong>of</strong> life in Glendale’s<br />
neighborhoods.<br />
Goal<br />
Related Council Goal<br />
Was the goal met?<br />
What were the<br />
Performance Measures?<br />
Obstacles/Challenges<br />
Goal<br />
Related Council Goal<br />
Was the goal met?<br />
What were the<br />
Performance Measures?<br />
GOAL UPDATES<br />
Achieve full compliance to the Arizona Supreme Court’s DUI<br />
case processing plan.<br />
One community focused on public safety.<br />
This goal was met as it pertained to resolving active DUI cases<br />
within 180 days <strong>of</strong> filing.<br />
During the first quarter <strong>of</strong> FY 2010, Glendale City Court resolved<br />
80% <strong>of</strong> its active DUI cases within <strong>12</strong>0 days and 91% <strong>of</strong> its active<br />
DUI cases within 180 days. During the second quarter, the Court<br />
resolved 81% <strong>of</strong> its active DUI cases within <strong>12</strong>0 days and 92% <strong>of</strong><br />
its active DUI cases within 180 days. A Caseflow Management<br />
Committee comprised <strong>of</strong> <strong>city</strong> judges, the <strong>city</strong> prosecutor, a public<br />
defender, police representatives and court administration is<br />
chaired by the deputy court administrator. The Committee is<br />
tasked with reviewing the DUI Case Processing Plan to insure that<br />
the Court maintains high DUI case resolution levels. As part <strong>of</strong> a<br />
bigger task, the committee identifies trends and necessary changes<br />
that must be made in the Court calendar to enhance the processing<br />
<strong>of</strong> all cases.<br />
Delayed evidence laboratory test results from the Department <strong>of</strong><br />
Public Safety crime lab and other discovery issues contributed to<br />
case processing delays.<br />
Achieve <strong>budget</strong>ary self-sufficiency for court security costs and<br />
some court improvements through an increased court<br />
improvement fee.<br />
One community that is fiscally sound.<br />
Yes.<br />
The special revenue account currently provides for the expenses <strong>of</strong><br />
contracted court security, a full-time Glendale Police Officer<br />
designated as the Courts Security Officer and a contract Systems<br />
Analyst. In October 2009, a new security contract was<br />
implemented with CBI Security Services. The new contract has<br />
achieved monthly savings <strong>of</strong> $7,717 resulting in an <strong>annual</strong> savings<br />
<strong>of</strong> approximately $93,000. These savings will help contribute to<br />
<strong>12</strong>7<br />
Return to TOC
Mission and Performance Measure<br />
City Court<br />
the overall goal <strong>of</strong> self-sufficiency related to security costs.<br />
Obstacles/Challenges<br />
Revenues to this account have not met earlier projections. This<br />
could be a result <strong>of</strong> reduced filings seen this past fiscal year as<br />
well as an increase in the inability for defendants to pay their<br />
fines. As <strong>of</strong> December 2009, we have projected a minor deficit in<br />
this account. Staff is currently reviewing options to cover this<br />
shortage.<br />
<strong>12</strong>8<br />
Return to TOC
City <strong>of</strong> Glendale<br />
Budget Summary by Department<br />
City Court<br />
FUND NUMBER /<br />
BUDGET BY PROGRAM<br />
FY 2010<br />
Actual<br />
FY <strong>2011</strong><br />
Budget<br />
FY <strong>2011</strong><br />
Estimate<br />
FY 20<strong>12</strong><br />
Budget<br />
Percent Over<br />
FY <strong>2011</strong> Budget<br />
(1000) City Court<br />
$3,868,393 $3,578,010 $3,578,010 $3,387,792 -5%<br />
(<strong>12</strong>40) Court Security<br />
$267,285 $393,300 $278,500 $398,469 1%<br />
(<strong>12</strong>40) Court Time Payments<br />
$23,659 $<strong>12</strong>7,394 $93,765 $<strong>12</strong>8,391 1%<br />
(<strong>12</strong>40) Fill the Gap<br />
$58,840 $57,000 $9,000 $57,000 0%<br />
Total - City Court $4,218,177 $4,155,704 $3,959,275 $3,971,652 -4%<br />
BUDGET BY CATEGORIES<br />
OF EXPENDITURES<br />
FY 2010<br />
Actual<br />
FY <strong>2011</strong><br />
Budget<br />
FY <strong>2011</strong><br />
Estimate<br />
FY 20<strong>12</strong><br />
Budget<br />
Percent Over<br />
FY <strong>2011</strong> Budget<br />
Wages/Salaries/Benefits $3,5<strong>12</strong>,619 $3,682,198 $3,682,198 $3,492,263 -5%<br />
Supplies and Contracts $636,928 $552,826 $355,850 $682,441 23%<br />
Internal Premiums $31,524 $31,940 $31,940 $30,163 -6%<br />
Internal Service Charges $37,106 $57,251 $57,798 $43,079 -25%<br />
Work Order Credits ($168,511) ($168,511) ($276,294) 64%<br />
Total - City Court $4,218,177 $4,155,704 $3,959,275 $3,971,652 -4%<br />
STAFFING BY PROGRAM<br />
FY 2010<br />
Actual<br />
FY <strong>2011</strong><br />
Budget<br />
FY <strong>2011</strong><br />
Estimate<br />
FY 20<strong>12</strong><br />
Budget<br />
Percent Over<br />
FY <strong>2011</strong> Budget<br />
(1000) City Court 48<br />
42.75 40.75 40.75 -5%<br />
(<strong>12</strong>40) Court Security 1<br />
1 1 1 0%<br />
(<strong>12</strong>40) Court Time Payments 1 1 1 0%<br />
Total -City Court 49 44.75 42.75 42.75 -4%<br />
<strong>12</strong>9<br />
Return to TOC
Mission and Performance Measure<br />
Finance<br />
Budget & Financial<br />
Services<br />
Management<br />
& Budget<br />
FINANCE<br />
Diane Goke<br />
Finance<br />
Mission Statement:<br />
The Finance Department’s mission is to provide responsible financial management and<br />
exemplary customer services with integrity.<br />
Department Description:<br />
The Finance Department’s main responsibilities are debt management, banking services,<br />
investment management, and financial analysis for the <strong>city</strong>. Finance also provides financial<br />
information to the public, state agencies, bond holders, grantors, auditors, <strong>city</strong> management, and<br />
the City Council. The Accounting Division prepares external financial reports, manages the <strong>city</strong><br />
payroll process, pays vendors, and provides financial management consulting to departments.<br />
The Tax and Licensing Division administers the sales tax code to ensure compliance and is<br />
responsible for the collection <strong>of</strong> accounts receivable. The Billing Services and Customer<br />
Relations Divisions bill customers for utility services, processes cash receipts and provides<br />
overall customer service to citizens.<br />
FISCAL YEAR 20<strong>12</strong><br />
Goal<br />
Related Council Goal<br />
Activities<br />
Expected Outcomes<br />
(Perf. Measures)<br />
Time Commitment<br />
GOALS<br />
Eliminate routine paper checks.<br />
One community that is fiscally sound.<br />
Promote and advocate the benefits <strong>of</strong> e-payments, electronically paid<br />
payroll.<br />
Direct measure in staff hours used to print, fold, stuff, dispense, mail<br />
and follow-up on paper checks. Measurement in cost savings <strong>of</strong><br />
postage, envelops, check forms, and banking hours spent on<br />
reconciliation <strong>of</strong> payroll checks.<br />
This goal could be implemented within a few months.<br />
130<br />
Return to TOC
Mission and Performance Measure<br />
Finance<br />
Expected Challenges<br />
If not mandated by management the process will be difficult to<br />
impossible to achieve. Those employees that currently remain on<br />
paper checks are those most resistant to utilizing other methods <strong>of</strong><br />
receiving their paychecks.<br />
Goal<br />
Related Council Goal<br />
Activities<br />
Expected Outcomes<br />
(Perf. Measures)<br />
Time Commitment<br />
Expected Challenges<br />
Goal<br />
Related Council Goal<br />
Activities<br />
Expected Outcomes<br />
(Perf. Measures)<br />
Time Commitment<br />
Expected Challenges<br />
Implement a sales tax filing process that is online and automated.<br />
One community that is fiscally sound.<br />
Implement electronic sales tax system, set up taxpayer registration<br />
and log-in, publicize the service and engage in other taxpayer<br />
education efforts.<br />
Reduced volume <strong>of</strong> mail, walk-in customers and number <strong>of</strong> sales tax<br />
returns and payments processed manually.<br />
The goal requires an on-going effort, but the first year will focus on<br />
attaining 25% <strong>of</strong> taxpayer participation.<br />
Earning taxpayer trust and willingness to participate; unforeseen<br />
technical issues that come with electronic system implementations.<br />
Transition outlying departments to a more self-sufficient centralized<br />
cashiering process.<br />
One community that is fiscally sound.<br />
Create and promote a pilot program <strong>of</strong> one outlying department<br />
recording their deposits via central cashier system.<br />
Pilot department will enter daily receipts saving transportation time<br />
<strong>of</strong> paperwork to City Hall.<br />
Six months.<br />
Training resources and time due to limited staff.<br />
FISCAL YEAR <strong>2011</strong><br />
Area <strong>of</strong> Innovation:<br />
• Due to enhanced functionality in the cities new municipal billing system, customers’<br />
final bills are processed at an expedited rate enabling them to receive their deposit<br />
refund weeks earlier compared to the cities previous municipal billing system.<br />
Accomplishments:<br />
• On February 7, <strong>2011</strong> the Sales Tax Division implemented a new sales tax system-“Tax<br />
Mantra.” Tax Mantra provides effective, flexible management <strong>of</strong> the <strong>city</strong>’s current and<br />
131<br />
Return to TOC
Mission and Performance Measure<br />
Finance<br />
future tax and licensing needs. Special features include E-Tax- an electronic online tax<br />
return service for customer and I Capture- which takes a visual scan <strong>of</strong> information and<br />
converts it into electronic data. Benefits <strong>of</strong> Tax Mantra include: integration <strong>of</strong> e-<br />
commerce capabilities like online license applications, online tax return filing,<br />
customer account detail self-management, and online tax return payments. Tax Mantra<br />
also allows for payments <strong>of</strong> other system balances, dynamic query and reporting<br />
capabilities for management, integration with other <strong>city</strong> database systems, daily<br />
postings to the general ledger, data mining capabilities, document management and<br />
ADA compliance.<br />
• Successfully cross trained Accounts Payable and Cashiering staff so they have the<br />
skills and knowledge to be utilized at high peak times between the two business units.<br />
High peak times constitute heavy lobby traffic in Customer Service lobby and/or<br />
Lockbox for Utility and Sales Tax payments. High peak times in the Accounts Payable<br />
department constitute seasonal peak periods during fiscal year end and <strong>annual</strong><br />
reporting in January.<br />
Goal<br />
Related Council Goal<br />
Was the goal met?<br />
What were the Performance<br />
Measures?<br />
Obstacles/Challenges<br />
GOAL UPDATES<br />
Compile the information to produce an approved<br />
Comprehensive Annual Financial Report (CAFR).<br />
One community that is fiscally sound.<br />
Goal was met.<br />
City received the GFOA Certificate <strong>of</strong> Achievement.<br />
Implementing the Governmental Accounting Standards<br />
Board’s new pronouncements for accounting for intangible<br />
assets.<br />
To document and complete an implementation plan for the<br />
Goal<br />
Government Accounting Standards Boards (GASB)<br />
Statement No. 54.<br />
Related Council Goal One community that is fiscally sound.<br />
Was the goal met? On track to meeting the goal at fiscal year end 6/30/<strong>2011</strong>.<br />
What were the Performance<br />
Measures?<br />
Completion <strong>of</strong> an implementation plan that meets or<br />
exceeds the GASB standards.<br />
Obstacles/Challenges None.<br />
132<br />
Return to TOC
Mission and Performance Measure<br />
Finance<br />
FISCAL YEAR 2010<br />
Area <strong>of</strong> Innovation:<br />
• The Accounting Division <strong>of</strong>fered SurePay as a payment option to retirees for their<br />
health insurance payments. This option automated the system and created efficiencies<br />
in the division.<br />
Accomplishments:<br />
• Created the ability to log utility field service orders electronically, which provided realtime<br />
updates for customer service inquiries.<br />
• Provided customers with new tools on the utility billing website that enables them to<br />
view their utility bills and water usage in text and graphical formats.<br />
Goal<br />
Related Council Goal<br />
Was the goal met?<br />
What were the<br />
Performance Measures?<br />
Obstacles/Challenges<br />
Goal<br />
Related Council Goal<br />
Was the goal met?<br />
What were the<br />
Performance Measures?<br />
Obstacles/Challenges<br />
GOAL UPDATES<br />
To educate citizens in the use <strong>of</strong> the new utility billing system<br />
scheduled for implementation in summer <strong>of</strong> 2009.<br />
One community with high quality services for citizens.<br />
Yes. The billing system was implemented and reduced the number<br />
<strong>of</strong> customers receiving bills through the mail.<br />
Reduced the number <strong>of</strong> utility bills mailed to customers and the<br />
number <strong>of</strong> calls handled by staff by 5% in the first six months <strong>of</strong><br />
implementation.<br />
Economic conditions, such as home foreclosures increased the<br />
number <strong>of</strong> calls.<br />
Compile the information to produce an award winning approved<br />
CAFR.<br />
One community that is fiscally sound.<br />
Yes.<br />
Received the GFOA Certificate <strong>of</strong> Achievement for Excellence in<br />
Financial Reporting.<br />
None.<br />
133<br />
Return to TOC
City <strong>of</strong> Glendale<br />
Budget Summary by Department<br />
Finance<br />
FUND NUMBER /<br />
BUDGET BY PROGRAM<br />
FY 2010<br />
Actual<br />
FY <strong>2011</strong><br />
Budget<br />
FY <strong>2011</strong><br />
Estimate<br />
FY 20<strong>12</strong><br />
Budget<br />
Percent Over<br />
FY <strong>2011</strong> Budget<br />
(1000) Accounting Services<br />
$865,271 $9<strong>12</strong>,836 $9<strong>12</strong>,836 $848,492 -7%<br />
(1000) Finance Administration<br />
$497,667 $394,610 $498,438 $531,275 35%<br />
(1000) L.I.D. Administration<br />
$0 $9,000 $9,000 $0 -100%<br />
(1000) License/Collection<br />
$869,194 $805,900 $805,900 $665,368 -17%<br />
(<strong>12</strong>82) Arena Management Fee<br />
$0 $0 $0 $20,000,000 NA<br />
(1780) Arena Renewal and Replacement<br />
$332,000 $550,000 $550,000 $550,000 0%<br />
(1790) AZSTA - Stadium Tax Refund<br />
$1,627,000 $1,700,000 $1,700,000 $1,745,900 3%<br />
(2360) Customer Service Office<br />
$2,318,790 $2,659,473 $2,598,968 $2,963,088 11%<br />
Total - Finance $6,509,922 $7,031,819 $7,075,142 $27,304,<strong>12</strong>3 288%<br />
BUDGET BY CATEGORIES<br />
OF EXPENDITURES<br />
FY 2010<br />
Actual<br />
FY <strong>2011</strong><br />
Budget<br />
FY <strong>2011</strong><br />
Estimate<br />
FY 20<strong>12</strong><br />
Budget<br />
Percent Over<br />
FY <strong>2011</strong> Budget<br />
Wages/Salaries/Benefits $3,799,768 $4,100,628 $4,205,456 $4,111,403 0%<br />
Supplies and Contracts $2,736,431 $3,092,321 $3,030,816 $23,393,660 657%<br />
Internal Premiums $67,926 $74,922 $74,922 $87,901 17%<br />
Internal Service Charges $32,466 $49,107 $49,107 $37,418 -24%<br />
Work Order Credits ($<strong>12</strong>6,669) ($285,159) ($285,159) ($326,259) 14%<br />
Total - Finance $6,509,922 $7,031,819 $7,075,142 $27,304,<strong>12</strong>3 288%<br />
STAFFING BY PROGRAM<br />
FY 2010<br />
Actual<br />
FY <strong>2011</strong><br />
Budget<br />
FY <strong>2011</strong><br />
Estimate<br />
FY 20<strong>12</strong><br />
Budget<br />
Percent Over<br />
FY <strong>2011</strong> Budget<br />
(1000) Accounting Services 19<br />
16 15 15 -6%<br />
(1000) Finance Administration 8<br />
4 6 6 50%<br />
(1000) License/Collection 11<br />
8.5 7 7 -18%<br />
(2360) Customer Service Office 35.5<br />
35.5 35.5 35.5 0%<br />
Total -Finance 73.5 64 63.5 63.5 -1%<br />
134<br />
Return to TOC
City <strong>of</strong> Glendale<br />
Budget Summary by Department<br />
Lease Pmts/OtherFees<br />
FUND NUMBER /<br />
BUDGET BY PROGRAM<br />
FY 2010<br />
Actual<br />
FY <strong>2011</strong><br />
Budget<br />
FY <strong>2011</strong><br />
Estimate<br />
FY 20<strong>12</strong><br />
Budget<br />
Percent Over<br />
FY <strong>2011</strong> Budget<br />
(1000) 1000 Advisor Fees<br />
$85,568 $<strong>12</strong>9,687 $<strong>12</strong>9,687 $90,000 -31%<br />
(1000) Lease Payments<br />
$1,717,724 $4,236,574 $4,236,574 $403,075 -90%<br />
(1000) Merchant Fees<br />
$259,910 $160,000 $160,000 $199,687 25%<br />
(1980) 1980 Advisor Fees<br />
$1,599 $6,066 $6,066 $6,066 0%<br />
(2000) 2000 Advisor Fees<br />
$0 $1,030 $1,030 $1,030 0%<br />
(2040) 2040 Advisor Fees<br />
$1,219 $2,000 $2,000 $2,000 0%<br />
(2060) 2060 Advisor Fees<br />
$430 $6,857 $6,857 $6,857 0%<br />
(2080) 2080 Advisor Fees<br />
$324 $2,000 $2,000 $2,000 0%<br />
(2100) 2100 Advisor Fees<br />
$290 $2,000 $2,000 $2,000 0%<br />
(2180) 2180 Advisor Fees<br />
$4,484 $5,213 $5,213 $5,213 0%<br />
(2210) 2210 Advisor Fees<br />
$10,756 $13,568 $13,568 $13,568 0%<br />
(2360) 2360 Advisor Fees<br />
$1,410 $3,289 $3,289 $3,289 0%<br />
(2400) 2400 Advisor Fees<br />
$3,075 $17,222 $4,722 $17,222 0%<br />
(2420) 2420 Advisor Fees<br />
$824 $17,514 $5,014 $17,514 0%<br />
Total - Lease Pmts/OtherFees $2,087,613 $4,603,020 $4,578,020 $769,521 -83%<br />
BUDGET BY CATEGORIES<br />
OF EXPENDITURES<br />
FY 2010<br />
Actual<br />
FY <strong>2011</strong><br />
Budget<br />
FY <strong>2011</strong><br />
Estimate<br />
FY 20<strong>12</strong><br />
Budget<br />
Percent Over<br />
FY <strong>2011</strong> Budget<br />
Supplies and Contracts $2,087,613 $4,603,020 $4,578,020 $769,521 -83%<br />
Total - Lease Pmts/OtherFees $2,087,613 $4,603,020 $4,578,020 $769,521 -83%<br />
135<br />
Return to TOC
Mission and Performance Measure<br />
Management & Budget<br />
Management<br />
& Budget<br />
Budget & Financial<br />
Services<br />
Finance<br />
MANAGEMENT & BUDGET<br />
Sherry Schurhammer<br />
Mission Statement:<br />
Management and Budget helps the <strong>city</strong> to accomplish its financial management objectives by:<br />
• promoting integrity and public accountability in the <strong>budget</strong> planning and implementation<br />
process;<br />
• increasing public trust in the <strong>city</strong>’s fiscal planning and implementation efforts by<br />
presenting information in a clear and understandable manner<br />
• improving the efficiency and effectiveness <strong>of</strong> <strong>city</strong>wide business processes to ensure<br />
prudent fiscal management <strong>of</strong> the <strong>city</strong>’s resources.<br />
• assisting <strong>city</strong> departments with cost effective and efficient services in warehousing,<br />
inventory, the disposal <strong>of</strong> surplus <strong>city</strong> assets and other logistical support services; and<br />
• augmenting the effectiveness <strong>of</strong> the tax dollar in the purchase <strong>of</strong> materials and services<br />
within the requirements <strong>of</strong> <strong>city</strong> code and state law.<br />
Department Description:<br />
The Management and Budget department provides internal <strong>budget</strong> guidance and support services<br />
to all <strong>of</strong> the 34 departments within the <strong>city</strong>. Budget spearheads the <strong>budget</strong> planning and<br />
implementation process for the <strong>city</strong> as a whole, presents <strong>budget</strong> related information to the public<br />
in a clear and understandable way, and provides pr<strong>of</strong>essional expertise to Mayor and Council on<br />
financial management decisions. The Budget department provides citizens with information that<br />
is key to understanding the goals and priorities <strong>of</strong> the <strong>city</strong>.<br />
FISCAL YEAR 20<strong>12</strong><br />
Goal<br />
Related Council Goal<br />
Activities<br />
GOALS<br />
Collect, analyze and provide accurate and useful information<br />
to <strong>city</strong> departments, <strong>city</strong> management, and the Mayor and<br />
City Council as it relates to the <strong>city</strong> <strong>budget</strong>.<br />
One community that is fiscally sound.<br />
• Prepare the <strong>annual</strong> Council workshop materials<br />
relating to the operating and capital <strong>budget</strong>s.<br />
136<br />
Return to TOC
Mission and Performance Measure<br />
Management & Budget<br />
Expected Outcomes<br />
(Perf. Measures)<br />
Time Commitment<br />
Expected Challenges<br />
Goal<br />
Related Council Goal<br />
Activities<br />
• Prepare reports on capital-related <strong>budget</strong> items, such<br />
as capital <strong>budget</strong> financial options and property tax<br />
rate options as needed.<br />
• Work with individual departments on rate studies for<br />
the enterprise funds and other departments that are<br />
supported in whole or in part by fees.<br />
• Maintain an open and responsive relationship with<br />
management, Council, and departments in order to<br />
anticipate information needs.<br />
• Monthly expenditure and revenue reports are<br />
evaluated and follow up with departments occurs as<br />
needed. The FY 20<strong>12</strong> operating and capital <strong>budget</strong>s<br />
and quarterly reports to Mayor and Council presented<br />
accurately and in a timely manner.<br />
• Positive recognition from GFOA on <strong>annual</strong> <strong>budget</strong><br />
<strong>book</strong>.<br />
This goal reflects an ongoing time commitment from the<br />
<strong>budget</strong> department. Preparation <strong>of</strong> <strong>budget</strong> information is a<br />
consistent requirement <strong>of</strong> this department.<br />
Interpreting and presenting <strong>budget</strong> information in a way that<br />
is understandable can be challenging especially when dealing<br />
with complex <strong>budget</strong>ary issues.<br />
Leverage s<strong>of</strong>tware technology systems that minimize manual<br />
processes, improve the accuracy and breadth <strong>of</strong> data collected,<br />
and enhance the evaluation and analysis <strong>of</strong> <strong>budget</strong> related<br />
data.<br />
One community that is fiscally sound.<br />
• Participate in the HRMS implementation and testing<br />
project scheduled for FY 20<strong>12</strong> with an emphasis <strong>of</strong><br />
improving the salary forecasting data used for the<br />
salary forecast model.<br />
• Continue participating on the core team for the TALIS<br />
(new sales tax and license s<strong>of</strong>tware system)<br />
implementation to ensure the integrity <strong>of</strong> newly<br />
developed sales tax revenue reports as further system<br />
enhancements are implemented. The new sales tax<br />
revenue reports are expected to improve significantly<br />
the breadth <strong>of</strong> data collected and analyzed for revenue<br />
performance compared to <strong>budget</strong> as well as revenue<br />
forecasts.<br />
• Continue exploring and implementing improvements<br />
to the Business Intelligence system reporting abilities<br />
137<br />
Return to TOC
Mission and Performance Measure<br />
Management & Budget<br />
Expected Outcomes<br />
(Perf. Measures)<br />
Time Commitment<br />
Expected Challenges<br />
to enhance the <strong>budget</strong> to actuals reports that<br />
departments use.<br />
• Work with departments to explore technology- based<br />
solutions to eliminate shadow systems and improve<br />
the analysis <strong>of</strong> <strong>budget</strong> related data.<br />
• Minimize “shadow systems” used for <strong>budget</strong> data in<br />
<strong>city</strong> departments.<br />
• Minimize manual processes and reduce potential errors<br />
due to the multiple entry <strong>of</strong> data or missing data.<br />
• Enhance the capabilities <strong>of</strong> s<strong>of</strong>tware technology<br />
systems to improve the evaluation and analysis <strong>of</strong><br />
<strong>budget</strong>-related data.<br />
This goal reflects an ongoing time commitment from the<br />
Budget Department.<br />
Limited resources, implementation challenges, and unforeseen<br />
impacts all present potential challenges.<br />
FISCAL YEAR <strong>2011</strong><br />
Area <strong>of</strong> Innovation:<br />
• Cross trained two individuals in Budget to assist the Finance department during<br />
Budget’s <strong>of</strong>f peak time. These staff members specifically focused on analysis related<br />
to a residential rental canvas <strong>of</strong> the <strong>city</strong>. This creative use <strong>of</strong> staff helped mitigate<br />
reduced staffing levels in Finance, provided development opportunities for Budget staff<br />
and generated $15,318 <strong>of</strong> residential rental tax bills that were past due. It also created a<br />
potential future rental tax <strong>of</strong> $7,003 <strong>annual</strong>ly from the 25 audited rental properties.<br />
• Created enhanced Business Intelligence reports for expenditure to <strong>budget</strong> data that<br />
improves the evaluation and analytic tools for departments across the <strong>city</strong>. This<br />
innovation allows departments to drill down into expenditure data details immediately<br />
as opposed to opening a new screen and sifting through volumes <strong>of</strong> data to see their<br />
particular expenditure details. This enhancement has made it much easier for<br />
departments to view and analyze their expenditure and <strong>budget</strong> data.<br />
Accomplishments:<br />
• Received the GFOA Distinguished Budget Award for the FY <strong>2011</strong> <strong>budget</strong> document<br />
by achieving the highest rating in accordance with award criteria. Received outstanding<br />
ratings from GFOA for sections within the <strong>budget</strong> document related to the <strong>book</strong> as a<br />
policy document, a financial plan, an operations guide and a communications device.<br />
138<br />
Return to TOC
Mission and Performance Measure<br />
Management & Budget<br />
Goal<br />
Related Council Goal<br />
Was the goal met?<br />
What were the<br />
Performance Measures?<br />
Obstacles/Challenges<br />
GOAL UPDATES<br />
Collect, analyze and provide accurate and useful information to<br />
<strong>city</strong> departments, <strong>city</strong> management and the Mayor and City<br />
Council as it relates to the <strong>city</strong> <strong>budget</strong>.<br />
One community that is fiscally sound.<br />
Yes.<br />
• Monthly expenditure and revenue reports were consistently<br />
completed in a timely and accurate manner.<br />
• The FY <strong>2011</strong> recommended operating and capital <strong>budget</strong>s<br />
and quarterly reports to Mayor and Council were presented<br />
accurately and in a timely manner.<br />
• The FY <strong>2011</strong> <strong>annual</strong> <strong>budget</strong> <strong>book</strong> received the GFOA’s<br />
Distinguished Budget Presentation Award.<br />
None.<br />
FISCAL YEAR 2010<br />
Area <strong>of</strong> Innovation:<br />
• The BI tool was rolled out in FY 2010 with the completion <strong>of</strong> Phase I. Considerable<br />
time was spent during FY 2010 by Administrative Services Group staff to ensure that<br />
this daily extraction <strong>of</strong> financial information was accurate and summarized correctly in<br />
all aspects <strong>of</strong> the BI application. The BI tool allows users to view the interactive<br />
dashboards, graphs and reports and provides the ability to drill up, down and through<br />
different layers <strong>of</strong> financial data. In addition, staff in the Budget and Research<br />
Division has been trained to modi<strong>fy</strong> dashboards and create additional financial reports<br />
that can be pushed out to consumer license holders in other departments. See below<br />
for two examples <strong>of</strong> additional financial reports that have been or are in the process <strong>of</strong><br />
being created through the BI tool.<br />
• Budget and Research Division staff developed a CIP report on expenditure versus<br />
<strong>budget</strong> activity that replaced a report that was manually produced on a monthly basis<br />
and provided only a snapshot <strong>of</strong> activity at that one point in time. The new CIP report<br />
in BI is updated daily and can be drilled down to the detail expenditure level activity<br />
by project.<br />
• As <strong>of</strong> May 2010, Budget and Research Division staff is developing a BI report that<br />
would provide a fund balance analysis, including <strong>budget</strong> and expenditure activity, for a<br />
variety <strong>of</strong> special revenue funds. This report will be updated daily. This report is<br />
intended to replace the reports that staff currently produces manually on a quarterly<br />
basis.<br />
139<br />
Return to TOC
Mission and Performance Measure<br />
Management & Budget<br />
• Budget and Research Division staff developed a CIP report on expenditure versus<br />
<strong>budget</strong> activity that replaced a report that was manually produced on a monthly basis<br />
and provided only a snapshot <strong>of</strong> activity at that one point in time. The new CIP report<br />
in BI is updated daily and can be drilled down to the detail expenditure level activity<br />
by project.<br />
• Budget and Research Division staff developed a BI report that provides a fund balance<br />
analysis, including <strong>budget</strong> and expenditure activity, for a variety <strong>of</strong> special revenue<br />
funds. This report will be available on a daily basis and replaces the manual reports<br />
that staff currently produces on a quarterly basis.<br />
Accomplishments:<br />
• Received the GFOA Distinguished Budget Award for the FY 2010 <strong>budget</strong> document<br />
by achieving the highest rating in accordance with award criteria. Also received<br />
special recognition from GFOA for the CIP section <strong>of</strong> the FY 2010 <strong>budget</strong> document.<br />
Received outstanding ratings from GFOA for sections within the <strong>budget</strong> document<br />
relating to the <strong>book</strong> as a policy document, a financial plan, an operations guide and a<br />
communications device.<br />
• Incorporated the Utilities Department and Fire Department’s (customer owned)<br />
inventory into the <strong>city</strong>’s secure warehouse for more effective management <strong>of</strong> resources<br />
from the purchase to the use <strong>of</strong> the materials.<br />
Goal<br />
Related Council Goal<br />
Was the goal met?<br />
What were the<br />
Performance Measures?<br />
GOAL UPDATES<br />
• Collect, analyze and provide accurate and useful<br />
information to <strong>city</strong> departments, <strong>city</strong> management and the<br />
Mayor and City Council as it relates to the <strong>city</strong> <strong>budget</strong>.<br />
• Produce an accurate, reliable <strong>annual</strong> <strong>budget</strong> document that<br />
meets the financial objectives <strong>of</strong> the <strong>city</strong>.<br />
One community that is fiscally sound.<br />
Yes.<br />
• The FY 2010 <strong>annual</strong> <strong>budget</strong> <strong>book</strong> was presented the<br />
Government Finance Officers Association’s Distinguished<br />
Budget Presentation Award for exemplary <strong>budget</strong><br />
documentation, with special recognition <strong>of</strong> the capital<br />
<strong>budget</strong>.<br />
• Monthly expenditure and revenue reports were completed<br />
on time and disseminated to <strong>city</strong> departments and <strong>city</strong><br />
management.<br />
• Quarterly expenditure and revenue reports were completed<br />
on time and presented to <strong>city</strong> council.<br />
• The recommended FY <strong>2011</strong> operating and capital <strong>budget</strong>s<br />
were completed on time and presented to City Council<br />
140<br />
Return to TOC
Mission and Performance Measure<br />
Management & Budget<br />
Obstacles/Challenges<br />
None.<br />
over the course <strong>of</strong> two <strong>budget</strong> workshops in March 2010.<br />
Adoption <strong>of</strong> these plans occurred in June 2010.<br />
Goal<br />
Related Council Goal<br />
Was the goal met?<br />
What were the<br />
Performance Measures?<br />
Obstacles/Challenges<br />
Actively participate in the development, testing and<br />
implementation <strong>of</strong> a new sales tax and business license reporting<br />
system.<br />
One community that is fiscally sound.<br />
Yes.<br />
• A contract for the development and implementation <strong>of</strong> a<br />
new sales tax and license system was awarded in<br />
November 2009.<br />
• A senior analyst from the <strong>budget</strong> division serves on the<br />
core team that is evaluating current processes to develop a<br />
new database system that maximizes customization and<br />
minimizes manual processes.<br />
• The new system is scheduled to be implemented and fully<br />
operational by October 2010.<br />
None.<br />
141<br />
Return to TOC
City <strong>of</strong> Glendale<br />
Budget Summary by Department<br />
Management & Budget<br />
FUND NUMBER /<br />
BUDGET BY PROGRAM<br />
FY 2010<br />
Actual<br />
FY <strong>2011</strong><br />
Budget<br />
FY <strong>2011</strong><br />
Estimate<br />
FY 20<strong>12</strong><br />
Budget<br />
Percent Over<br />
FY <strong>2011</strong> Budget<br />
(1000) Budget & Research<br />
$636,466 $646,768 $646,768 $622,329 -4%<br />
(1000) Grants Administration<br />
$142,038 $65,164 $65,164 $58,653 -10%<br />
(1840) Grant Match Funds - Mgt & Bdgt<br />
$57,271 $0 $0 $0 NA<br />
Total - Management & Budget $835,775 $711,932 $711,932 $680,982 -4%<br />
BUDGET BY CATEGORIES<br />
OF EXPENDITURES<br />
FY 2010<br />
Actual<br />
FY <strong>2011</strong><br />
Budget<br />
FY <strong>2011</strong><br />
Estimate<br />
FY 20<strong>12</strong><br />
Budget<br />
Percent Over<br />
FY <strong>2011</strong> Budget<br />
Wages/Salaries/Benefits $755,673 $709,218 $709,218 $721,164 2%<br />
Supplies and Contracts $66,664 $28,206 $28,206 $22,037 -22%<br />
Internal Premiums $10,703 $7,539 $7,539 $7,066 -6%<br />
Internal Service Charges $2,735 $4,936 $4,936 $4,700 -5%<br />
Work Order Credits ($37,967) ($37,967) ($73,985) 95%<br />
Total - Management & Budget $835,775 $711,932 $711,932 $680,982 -4%<br />
STAFFING BY PROGRAM<br />
FY 2010<br />
Actual<br />
FY <strong>2011</strong><br />
Budget<br />
FY <strong>2011</strong><br />
Estimate<br />
FY 20<strong>12</strong><br />
Budget<br />
Percent Over<br />
FY <strong>2011</strong> Budget<br />
(1000) Budget & Research 6<br />
6 6 6 0%<br />
(1000) Grants Administration 1.5<br />
1 1 1 0%<br />
Total -Management & Budget 7.5 7 7 7 0%<br />
142<br />
Return to TOC
City <strong>of</strong> Glendale<br />
Budget Summary by Department<br />
Grants<br />
FUND NUMBER /<br />
BUDGET BY PROGRAM<br />
FY 2010<br />
Actual<br />
FY <strong>2011</strong><br />
Budget<br />
FY <strong>2011</strong><br />
Estimate<br />
FY 20<strong>12</strong><br />
Budget<br />
Percent Over<br />
FY <strong>2011</strong> Budget<br />
(1840) DV Pilot Project Grant<br />
$161,630 $66,606 $66,606 $68,219 2%<br />
(1840) Miscellaneous Grants<br />
$596,802 $7,274,833 $5,490,730 $8,626,542 19%<br />
(1842) ARWRF Facility UV System Imp<br />
$0 $986,000 $180,000 $806,000 -18%<br />
(1842) Build Safe Engy Prog Enhance<br />
$0 $35,000 $2,401 $87,599 150%<br />
(1842) Energy Matters Public Educat<br />
$731 $172,519 $8,882 $162,906 -6%<br />
(1842) Main Library Lighting<br />
$0 $431,831 $295,000 $136,831 -68%<br />
(1842) Program Manager<br />
$2,813 $234,150 $13,311 $218,026 -7%<br />
(1842) Public Safety/Court Lighting<br />
$0 $88,000 $56,000 $32,000 -64%<br />
(1842) Sports Courts Lighting Retr<strong>of</strong>i<br />
$0 $140,000 $65,000 $75,000 -46%<br />
(1842) Traffic Signal LED Conversion<br />
$41,210 $84,000 $0 $42,790 -49%<br />
(1842) WebPortal<br />
$0 $55,000 $0 $0 -100%<br />
(1842) Well 43 Variable Drive Retr<strong>of</strong>i<br />
$0 $97,500 $22,500 $75,000 -23%<br />
Total - Grants $803,186 $9,665,439 $6,200,430 $10,330,913 7%<br />
BUDGET BY CATEGORIES<br />
OF EXPENDITURES<br />
FY 2010<br />
Actual<br />
FY <strong>2011</strong><br />
Budget<br />
FY <strong>2011</strong><br />
Estimate<br />
FY 20<strong>12</strong><br />
Budget<br />
Percent Over<br />
FY <strong>2011</strong> Budget<br />
Wages/Salaries/Benefits $132,506 $489,441 $220,7<strong>12</strong> $466,844 -5%<br />
Supplies and Contracts $671,018 $9,178,983 $5,982,703 $9,865,570 7%<br />
Work Order Credits ($338) ($2,985) ($2,985) ($1,501) -50%<br />
Total - Grants $803,186 $9,665,439 $6,200,430 $10,330,913 7%<br />
STAFFING BY PROGRAM<br />
FY 2010<br />
Actual<br />
FY <strong>2011</strong><br />
Budget<br />
FY <strong>2011</strong><br />
Estimate<br />
FY 20<strong>12</strong><br />
Budget<br />
Percent Over<br />
FY <strong>2011</strong> Budget<br />
(1840) DV Pilot Project Grant 1<br />
1 1 1 0%<br />
Total -Grants 1 1 1 1 0%<br />
143<br />
Return to TOC
Mission and Performance Measure<br />
City Manager's Office<br />
CITY MANAGER'S OFFICE<br />
Ed Beasley<br />
Mission Statement:<br />
To enhance the quality <strong>of</strong> life for Glendale residents by providing collaborative and supportive<br />
leadership for the organization as it implements City Council policy and goals in the provision <strong>of</strong><br />
valued services to the community.<br />
Department Description:<br />
The City Manager’s Office is responsible for seeking policy direction from Council and<br />
preparing recommendations for Council action in accordance with established Strategic Goals<br />
and Key Objectives; ensuring effective and efficient internal operations <strong>city</strong>-wide; and<br />
establishing value-added programs and services for the citizens <strong>of</strong> Glendale.<br />
FISCAL YEAR 20<strong>12</strong><br />
Goal<br />
Related Council Goal<br />
Activities<br />
Expected Outcomes<br />
(Perf. Measures)<br />
Time Commitment<br />
Expected Challenges<br />
Goal<br />
GOALS<br />
Expand the INNOVATE program to include community<br />
outreach and communication; integration <strong>of</strong> technology; and,<br />
continued employee education on LEAN methodology.<br />
One community with high quality services for citizens.<br />
• Continue utilizing Glendale University as a channel for<br />
communicating about INNOVATE.<br />
• Create a public access internet page with INNOVATE<br />
information.<br />
• Utilize LEAN events to examine processes prior to<br />
implementation <strong>of</strong> new business systems <strong>city</strong>-wide.<br />
• Continue to conduct <strong>annual</strong> recruitment and training<br />
and provide LEAN demonstrations to all departments.<br />
Educate Glendale citizens on the efforts that employees are<br />
making to ensure fiscal accountability and sustainability;<br />
ensure that funding spent on technology is effective; and<br />
ensure that all employees have an understanding <strong>of</strong> the<br />
INNOVATE program and toolkit.<br />
It is expected that these activities will be completed within the<br />
fiscal year.<br />
Ensuring appropriate resources are available to devote to these<br />
activities and enlisting continued support for the organizational<br />
culture change.<br />
Utilize the INNOVATE program to examine the internal<br />
Council Agenda preparation process to create a simplified and<br />
144<br />
Return to TOC
Mission and Performance Measure<br />
City Manager's Office<br />
Related Council Goal<br />
Activities<br />
Expected Outcomes<br />
(Perf. Measures)<br />
Time Commitment<br />
Expected Challenges<br />
more efficient process for departments to submit items for<br />
Council agendas; and, decrease the level <strong>of</strong> difficulty in<br />
producing the final agenda.<br />
One community with high quality services for citizens.<br />
• Participate in a LEAN event.<br />
• Review and consider INNOVATE team<br />
recommendations.<br />
• Communicate impacts with affected parties.<br />
• Provide appropriate training and implement changes.<br />
• Create a process that reduces the amount <strong>of</strong> staff time<br />
necessary to submit an agenda item to the Manager’s<br />
Office.<br />
• Eliminate duplication <strong>of</strong> work.<br />
• Reduce the quantity <strong>of</strong> printed materials necessary in<br />
the process.<br />
• Improve the quality <strong>of</strong> the final product for Council and<br />
citizens.<br />
• Create a simplified process that supports internal crosstraining<br />
efforts.<br />
Because this project will impact all departments within the<br />
organization, the City Council, and citizens, it is expected to<br />
require 4-6 months for complete implementation.<br />
Effectively communicating changes to the impacted<br />
stakeholders and enlisting their support.<br />
FISCAL YEAR <strong>2011</strong><br />
Area <strong>of</strong> Innovation:<br />
• Discontinued the practice <strong>of</strong> numbering Council Agenda items to accommodate the<br />
ability to add or remove items as needed without creating the need to re-number all<br />
items. This change has provided greater flexibility in the preparation process and<br />
reduced the amount <strong>of</strong> staff time required to accommodate unanticipated changes.<br />
Accomplishments:<br />
• Successfully executed a unique City Council retreat where line level employees made<br />
presentations on innovative solutions that have been implemented in their areas. This<br />
event was very informative and provided an opportunity to share a story with the City<br />
Council and the community about the importance <strong>of</strong> nurturing an innovative culture, as<br />
well as the simplistic nature <strong>of</strong> finding ways to work smarter and save money.<br />
• Continued to maintain value-added services and amenities for Glendale citizens despite<br />
the economic downturn by absorbing internal vacancies, being creative in service<br />
delivery, and capitalizing on opportunities to realign resources and services.<br />
145<br />
Return to TOC
Mission and Performance Measure<br />
City Manager's Office<br />
Goal<br />
Related Council Goal<br />
Was the goal met?<br />
What were the<br />
Performance Measures?<br />
Obstacles/Challenges<br />
Goal<br />
Related Council Goal<br />
Was the goal met?<br />
What were the<br />
Performance Measures?<br />
Obstacles/Challenges<br />
GOAL UPDATES<br />
Encourage organizational change by empowering employees to<br />
utilize the INNOVATE program (Lean methodology) for<br />
streamlining everyday business practices to increase operational<br />
efficiency and explore new business concepts.<br />
One community with high quality services for citizens.<br />
Under the new leadership structure with Chair and Co-Chair<br />
positions, the INNOVATE team implemented new program<br />
enhancements, recruited and trained new members, planned and<br />
coordinated the Council Retreat presentations, and continued to<br />
take on several new projects.<br />
Implemented 5 program enhancements, trained 11 new team<br />
members, received positive feedback on the Council Retreat<br />
presentations, and took on 11 new projects.<br />
Retaining INNOVATE team members has been a challenge due to<br />
the fact that many employees are absorbing duties <strong>of</strong> other<br />
positions and have found it difficult to remain actively engaged on<br />
the team.<br />
Implement Council policy direction related to protecting and<br />
promoting the economic development and vitality <strong>of</strong> our<br />
community and safeguarding current economic investments.<br />
One community that is fiscally sound.<br />
This is an ongoing goal, staff has worked continuously throughout<br />
the year to retain key tenants and bring new tenants to Glendale to<br />
support economic vitality.<br />
A total <strong>of</strong> 1,085 new jobs have been located in Glendale through<br />
six employer expansion projects and three new business locates.<br />
The economic downturn has created challenges as well as<br />
ensuring the community has a good understanding <strong>of</strong> the <strong>city</strong>’s<br />
investment in strategic development and the losses that could<br />
result if we discontinue pursuing the protection <strong>of</strong> those<br />
investments.<br />
FISCAL YEAR 2010<br />
Area <strong>of</strong> Innovation:<br />
• This year’s United Way Committee, overseen by the City Manager’s Office,<br />
implemented a fun and successful organizational campaign while minimizing<br />
expenditures to less than $500 by promoting creative events like the Chili Cook-<strong>of</strong>f.<br />
• Worked with our community partners to “package” organizational memberships and<br />
146<br />
Return to TOC
Mission and Performance Measure<br />
City Manager's Office<br />
activities so that Glendale has an opportunity to maintain the same level <strong>of</strong> visibility<br />
within the community while reducing costs associated with those activities.<br />
Accomplishments:<br />
• Negotiated Memorandums <strong>of</strong> Understanding with potential buyers <strong>of</strong> the NHL Coyotes<br />
to purchase the team to keep it in Glendale and provided updates to Council in both<br />
executive session and public voting meetings.<br />
• Coordinated three successful public <strong>budget</strong> input meetings to gather citizen feedback<br />
on proposed General Fund reductions and presented the findings <strong>of</strong> those meetings to<br />
Council as part <strong>of</strong> the <strong>budget</strong> process.<br />
Goal<br />
Related Council Goal<br />
Was the goal met?<br />
What were the<br />
Performance Measures?<br />
Obstacles/Challenges<br />
Goal<br />
Related Council Goal<br />
Was the goal met?<br />
What were the<br />
Performance Measures?<br />
Obstacles/Challenges<br />
GOAL UPDATES<br />
Provide leadership and accountability for the organization through<br />
vigilant oversight <strong>of</strong> the <strong>city</strong>’s <strong>budget</strong> during economic downturn.<br />
One community that is fiscally sound.<br />
Yes.<br />
Timely review and distribution <strong>of</strong> quarterly reports aided in the<br />
appropriate decision making related to mid-year adjustments;<br />
staffing and programmatic changes, and preparation for the FY<br />
<strong>2011</strong> <strong>budget</strong> which incorporated public input sessions and was<br />
presented to and accepted by Council in two public workshops.<br />
This year, departments were challenged to identi<strong>fy</strong> new revenue<br />
generating opportunities to help reduce operational impacts.<br />
Ensuring the basis for evaluating staffing and programmatic<br />
changes were best practices and sound business decisions.<br />
Develop, support and implement business processes and initiatives<br />
that foster diversity.<br />
One community with high quality services for citizens.<br />
Yes.<br />
The rollout <strong>of</strong> the new diversity core competency is complete and<br />
all positions at the supervisory level and above will be evaluated<br />
on this new component. Additionally, this year the Diversity<br />
Committee coordinated and hosted a new program called<br />
“Diversity Dialogue” that addressed a wide array <strong>of</strong> topics<br />
including presentations about unique positions within the <strong>city</strong>,<br />
such as a pr<strong>of</strong>ile <strong>of</strong> our military personnel, and exploring multigenerational<br />
communications.<br />
Finding fun and exciting ways to ensure that employees engage in<br />
active participation <strong>of</strong> developing organizational diversity.<br />
147<br />
Return to TOC
City <strong>of</strong> Glendale<br />
Budget Summary by Department<br />
City Manager<br />
FUND NUMBER /<br />
BUDGET BY PROGRAM<br />
FY 2010<br />
Actual<br />
FY <strong>2011</strong><br />
Budget<br />
FY <strong>2011</strong><br />
Estimate<br />
FY 20<strong>12</strong><br />
Budget<br />
Percent Over<br />
FY <strong>2011</strong> Budget<br />
(1000) City Manager<br />
$1,072,710 $959,252 $959,252 $895,<strong>12</strong>4 -7%<br />
Total - City Manager $1,072,710 $959,252 $959,252 $895,<strong>12</strong>4 -7%<br />
BUDGET BY CATEGORIES<br />
OF EXPENDITURES<br />
FY 2010<br />
Actual<br />
FY <strong>2011</strong><br />
Budget<br />
FY <strong>2011</strong><br />
Estimate<br />
FY 20<strong>12</strong><br />
Budget<br />
Percent Over<br />
FY <strong>2011</strong> Budget<br />
Wages/Salaries/Benefits $963,793 $852,046 $852,046 $859,242 1%<br />
Supplies and Contracts $87,854 $138,466 $138,466 $114,574 -17%<br />
Internal Premiums $8,967 $9,894 $9,894 $7,335 -26%<br />
Internal Service Charges $4,459 $5,068 $5,068 $2,543 -50%<br />
Operating Capital $7,637<br />
Work Order Credits ($46,222) ($46,222) ($88,570) 92%<br />
Total - City Manager $1,072,710 $959,252 $959,252 $895,<strong>12</strong>4 -7%<br />
STAFFING BY PROGRAM<br />
FY 2010<br />
Actual<br />
FY <strong>2011</strong><br />
Budget<br />
FY <strong>2011</strong><br />
Estimate<br />
FY 20<strong>12</strong><br />
Budget<br />
Percent Over<br />
FY <strong>2011</strong> Budget<br />
(1000) City Manager 9<br />
7 7 7 0%<br />
Total -City Manager 9 7 7 7 0%<br />
148<br />
Return to TOC
City <strong>of</strong> Glendale<br />
Budget Summary by Department<br />
Admin Svcs Admin.<br />
FUND NUMBER /<br />
BUDGET BY PROGRAM<br />
FY 2010<br />
Actual<br />
FY <strong>2011</strong><br />
Budget<br />
FY <strong>2011</strong><br />
Estimate<br />
FY 20<strong>12</strong><br />
Budget<br />
Percent Over<br />
FY <strong>2011</strong> Budget<br />
(1000) Administration Services Admin.<br />
$443,943 $435,786 $349,858 $152,316 -65%<br />
Total - Admin Svcs Admin. $443,943 $435,786 $349,858 $152,316 -65%<br />
BUDGET BY CATEGORIES<br />
OF EXPENDITURES<br />
FY 2010<br />
Actual<br />
FY <strong>2011</strong><br />
Budget<br />
FY <strong>2011</strong><br />
Estimate<br />
FY 20<strong>12</strong><br />
Budget<br />
Percent Over<br />
FY <strong>2011</strong> Budget<br />
Wages/Salaries/Benefits $436,314 $448,383 $343,555 $144,459 -68%<br />
Supplies and Contracts $4,837 $7,088 $25,988 $15,453 118%<br />
Internal Premiums $2,444 $3,316 $3,316 $4,264 29%<br />
Internal Service Charges $348 $895 $895 $2,645 196%<br />
Work Order Credits ($23,896) ($23,896) ($14,505) -39%<br />
Total - Admin Svcs Admin. $443,943 $435,786 $349,858 $152,316 -65%<br />
STAFFING BY PROGRAM<br />
FY 2010<br />
Actual<br />
FY <strong>2011</strong><br />
Budget<br />
FY <strong>2011</strong><br />
Estimate<br />
FY 20<strong>12</strong><br />
Budget<br />
Percent Over<br />
FY <strong>2011</strong> Budget<br />
(1000) Administration Services Admin. 4<br />
4 2 2 -50%<br />
Total -Admin Svcs Admin. 4 4 2 2 -50%<br />
149<br />
Return to TOC
City <strong>of</strong> Glendale<br />
Budget Summary by Department<br />
Fac & Fin Mgmt<br />
FUND NUMBER /<br />
BUDGET BY PROGRAM<br />
FY 2010<br />
Actual<br />
FY <strong>2011</strong><br />
Budget<br />
FY <strong>2011</strong><br />
Estimate<br />
FY 20<strong>12</strong><br />
Budget<br />
Percent Over<br />
FY <strong>2011</strong> Budget<br />
(1000) Facilities & Financial Mgmt<br />
Total - Fac & Fin Mgmt<br />
$221,567 $0 $0 $0 NA<br />
$221,567<br />
BUDGET BY CATEGORIES<br />
OF EXPENDITURES<br />
FY 2010<br />
Actual<br />
FY <strong>2011</strong><br />
Budget<br />
FY <strong>2011</strong><br />
Estimate<br />
FY 20<strong>12</strong><br />
Budget<br />
Percent Over<br />
FY <strong>2011</strong> Budget<br />
Wages/Salaries/Benefits $213,230<br />
Supplies and Contracts $3,398<br />
Internal Premiums $2,676<br />
Internal Service Charges $2,263<br />
Total - Fac & Fin Mgmt $221,567<br />
STAFFING BY PROGRAM<br />
FY 2010<br />
Actual<br />
FY <strong>2011</strong><br />
Budget<br />
FY <strong>2011</strong><br />
Estimate<br />
FY 20<strong>12</strong><br />
Budget<br />
Percent Over<br />
FY <strong>2011</strong> Budget<br />
(1000) Facilities & Financial Mgmt<br />
2<br />
Total -Fac & Fin Mgmt 2<br />
150<br />
Return to TOC
Mission and Performance Measure<br />
Glendale Civic Center<br />
Communications<br />
Glendale<br />
Civic Center<br />
Marketing<br />
GLENDALE CIVIC CENTER<br />
Julie Frisoni<br />
Mission Statement:<br />
The Civic Center will provide high-quality meeting, event, banquet facilities and services to<br />
encourage local economic growth and promote a positive identity for the <strong>city</strong> <strong>of</strong> Glendale.<br />
Department Description:<br />
The Glendale Civic Center provides top-quality meeting, event, banquet facilities and services<br />
for Glendale’s growing population and the entire West Valley.<br />
Located in historic downtown Glendale, the Civic Center has served more than one million<br />
attendees since our opening. The Civic Center fulfills its mission by providing superb guest<br />
services, products and facilities. In addition, the Civic Center maintains a high degree <strong>of</strong> fiscal<br />
responsibility that benefits not only the City, but the entire community.<br />
FISCAL YEAR 20<strong>12</strong><br />
Goal<br />
Related Council Goal<br />
Activities<br />
GOALS<br />
Increase facility usage and revenue at the Glendale Civic<br />
Center.<br />
One community that is fiscally sound and that has a vibrant<br />
<strong>city</strong> center.<br />
Increase the Civic Center’s identity through the Internet,<br />
cable programming, increased facility tours, sales collateral<br />
and face-to-face marketing at community and <strong>city</strong>wide<br />
functions. The Center will continue with our new e-blasts<br />
on a bi-monthly basis to advertise specials and increase<br />
market awareness. Increase involvement with the<br />
Convention and Visitors Bureau and the Glendale Chamber<br />
<strong>of</strong> Commerce. Increase marketing opportunities by working<br />
with the Civic Center’s new caterer for in-house client<br />
receptions and other potential marketing and advertising<br />
sources.<br />
151<br />
Return to TOC
Mission and Performance Measure<br />
Glendale Civic Center<br />
Expected Outcomes<br />
(Perf. Measures)<br />
Time Commitment<br />
Expected Challenges<br />
Goal<br />
Related Council Goal<br />
Activities<br />
Expected Outcomes<br />
(Perf. Measures)<br />
Time Commitment<br />
Expected Challenges<br />
Increase facility usage by 2% and increase the Civic<br />
Center’s revenue production by 3 % over FY <strong>2011</strong>.<br />
This goal will be achieved through the efforts <strong>of</strong> the Civic<br />
Center staff throughout the fiscal year. This is a daily<br />
function <strong>of</strong> Civic Center staff and will be worked on<br />
accordingly.<br />
Economy-related issues, especially in the hospitality<br />
industry, have been challenging. The Civic Center staff will<br />
assess market trends and adjust efforts accordingly.<br />
The Civic Center has two revenue opportunities through<br />
technology services. The Audio Visual Division is now<br />
positioned to be a full-time in-house audio team for all<br />
clients. This will assist clients with all A/V needs, create<br />
revenue and make the Civic Center a one-stop shop for<br />
rental needs.<br />
The second revenue opportunity is to use newly installed<br />
electronic reader boards to sell advertising. These high<br />
quality television monitors are located in public areas <strong>of</strong> the<br />
facility. They are viewed as directional signage and have<br />
the capability to <strong>of</strong>fer advertising as well. We will promote<br />
this capability to local downtown businesses. Advertisers<br />
taking advantage <strong>of</strong> the opportunity will be showcased to<br />
attendees during Civic Center events throughout the year.<br />
One community that is fiscally sound.<br />
Working to expand menu items <strong>of</strong> A/V services for clients.<br />
Also, work with the Convention and Visitors Bureau to<br />
create an advertising program to sell the new electronic<br />
reader boards.<br />
By the end <strong>of</strong> the fiscal year, we look to the A/V Division to<br />
increase revenue by 20% from the previous year.<br />
For the electronic reader boards, we aim to solicit, at<br />
minimum, 15 downtown merchants to purchase the new<br />
advertising opportunity.<br />
This goal will be achieved through the efforts <strong>of</strong> the Civic<br />
Center staff in conjunction with the Convention and Visitors<br />
Bureau throughout the fiscal year.<br />
As with the entire business community, market conditions<br />
will affect the success <strong>of</strong> this goal.<br />
152<br />
Return to TOC
Mission and Performance Measure<br />
Glendale Civic Center<br />
FISCAL YEAR <strong>2011</strong><br />
Area <strong>of</strong> Innovation:<br />
• Due to the downturn in the economy, businesses have been cutting back on just about<br />
everything, but most obviously on holiday functions for their staff. During the 2010<br />
holiday season, the Glendale Civic Center in conjunction with its caterer, Arizona<br />
Catering, hosted its first <strong>annual</strong> Dine and Glitter holiday celebration. This event was<br />
marketed to businesses throughout the West Valley by utilizing the Civic Center and<br />
the Glendale Chamber <strong>of</strong> Commerce databases. We were successful in attracting five<br />
businesses owners and 150 <strong>of</strong> their employees. This function coincided with the<br />
Glendale Glitters celebration and for its first year it was considered a success. We<br />
partnered this event with this existing downtown attraction as added value to the<br />
businesses and their attendees.<br />
Accomplishments:<br />
• The Civic Center was rated in the top 5 meeting and convention centers in the entire<br />
state <strong>of</strong> Arizona through a business poll conducted by Arizona Business Mag<strong>az</strong>ine.<br />
• Wedding Wire named the Civic Center one <strong>of</strong> the top venues in the state as part <strong>of</strong> its<br />
<strong>2011</strong> Bride’s Choice Awards.<br />
Goal<br />
Related Council Goal<br />
Was the goal met?<br />
What were the<br />
Performance Measures?<br />
Obstacles/Challenges<br />
Goal<br />
Related Council Goal<br />
Was the goal met?<br />
What were the<br />
Performance Measures?<br />
Obstacles/Challenges<br />
GOAL UPDATES<br />
Increase facility usage and overcome obstacles set forth by<br />
downturn in local and state economies.<br />
One community that is fiscally sound and that has a vibrant <strong>city</strong><br />
center.<br />
Yes.<br />
Increased attendance at the Civic Center by an estimated 23,000<br />
people (a 50% increase over last year) and increased event days by<br />
7% over the previous year.<br />
The current economy has resulted in some clients having to scale<br />
back their events due to their organizational <strong>budget</strong> restrictions.<br />
Promote and sell the Civic Center’s new audio-visual capabilities<br />
to clients.<br />
One community that is fiscally sound.<br />
Yes.<br />
Increased Audio Visual revenue by 25% over FY 2010.<br />
Some clients have pulled back or forgone AV due to the tight<br />
economy and restricted <strong>budget</strong>s.<br />
153<br />
Return to TOC
Mission and Performance Measure<br />
Glendale Civic Center<br />
FISCAL YEAR 2010<br />
Area <strong>of</strong> Innovation:<br />
• Now that the <strong>city</strong>’s audio-visual staff has joined the Civic Center team, the facility is<br />
now a “one-stop shop” for clients. Before clients had to outsource, or use an outside<br />
vendor if the Civic Center could not meet their audio-visual needs. This new addition<br />
allows the <strong>city</strong> to be the exclusive audio-visual provider for the Civic Center. This is<br />
not only convenient for guests but has also created a new revenue stream for the Civic<br />
Center. Providing top-notch, high-end audio-visual services also keeps the Civic<br />
Center competitive with other meeting facilities across the Valley.<br />
Accomplishments:<br />
• WeddingWire named the Civic Center one <strong>of</strong> the top venues in the state as part <strong>of</strong> its<br />
2010 Bride's Choice Awards.<br />
• Held the first <strong>annual</strong> Glendale Civic Center Car Show in March 2010.<br />
• Worked with Glendale 11 to create a promotional video tour that highlights the<br />
Glendale Civic Center and why it is the place to <strong>book</strong> your event. It is available to view<br />
online.<br />
• Glendale Civic Center was featured on the Glendale 11 program - Glendale A-Z. An<br />
extensive photo shoot <strong>of</strong> the facility was completed that will be used in all future print,<br />
online, promotional and collateral pieces to highlight and market the facility.<br />
Goal<br />
Related Council Goal<br />
Was the goal met?<br />
What were the<br />
Performance Measures?<br />
Obstacles/Challenges<br />
Goal<br />
Related Council Goal<br />
Was the goal met?<br />
What were the<br />
Performance Measures?<br />
Obstacles/Challenges<br />
GOAL UPDATES<br />
Increase facility usage <strong>of</strong> the Civic Center.<br />
One community with a vibrant <strong>city</strong> center.<br />
Attendance at the Civic Center stayed the same from FY 2009 to<br />
FY 2010.<br />
Event days at the Civic Center are at about 90% <strong>of</strong> where they<br />
were last year. The staff also increased the client database by 3%<br />
over last year.<br />
Economy related issues especially in the hospitality industry have<br />
been challenging. The Civic Center staff is working hard to<br />
increase business in conjunction with the caterer, Fabulous Food.<br />
Maintain a high level <strong>of</strong> customer satisfaction demonstrated<br />
through customer service evaluations.<br />
One community with high quality services for citizens.<br />
Yes.<br />
The Civic Center has maintained a 98% customer approval rating<br />
in client evaluations surveys for 2010.<br />
None.<br />
154<br />
Return to TOC
City <strong>of</strong> Glendale<br />
Budget Summary by Department<br />
Civic Center<br />
FUND NUMBER /<br />
BUDGET BY PROGRAM<br />
FY 2010<br />
Actual<br />
FY <strong>2011</strong><br />
Budget<br />
FY <strong>2011</strong><br />
Estimate<br />
FY 20<strong>12</strong><br />
Budget<br />
Percent Over<br />
FY <strong>2011</strong> Budget<br />
(1740) Civic Center<br />
$840,701 $748,497 $748,497 $766,817 2%<br />
Total - Civic Center $840,701 $748,497 $748,497 $766,817 2%<br />
BUDGET BY CATEGORIES<br />
OF EXPENDITURES<br />
FY 2010<br />
Actual<br />
FY <strong>2011</strong><br />
Budget<br />
FY <strong>2011</strong><br />
Estimate<br />
FY 20<strong>12</strong><br />
Budget<br />
Percent Over<br />
FY <strong>2011</strong> Budget<br />
Wages/Salaries/Benefits $625,425 $553,721 $553,721 $562,736 2%<br />
Supplies and Contracts $188,616 $185,936 $185,936 $185,140 0%<br />
Internal Premiums $<strong>12</strong>,388 $<strong>12</strong>,910 $<strong>12</strong>,910 $<strong>12</strong>,024 -7%<br />
Internal Service Charges $14,272 $14,151 $14,151 $16,422 16%<br />
Work Order Credits ($18,221) ($18,221) ($9,505) -48%<br />
Total - Civic Center $840,701 $748,497 $748,497 $766,817 2%<br />
STAFFING BY PROGRAM<br />
FY 2010<br />
Actual<br />
FY <strong>2011</strong><br />
Budget<br />
FY <strong>2011</strong><br />
Estimate<br />
FY 20<strong>12</strong><br />
Budget<br />
Percent Over<br />
FY <strong>2011</strong> Budget<br />
(1740) Civic Center 7<br />
6 6 6 0%<br />
Total -Civic Center 7 6 6 6 0%<br />
155<br />
Return to TOC
Mission and Performance Measure<br />
Marketing/Communications<br />
Communications<br />
Glendale<br />
Civic Center<br />
Marketing<br />
MARKETING/COMMUNICATIONS<br />
Julie Frisoni<br />
Mission Statement:<br />
To develop and implement marketing and public relations programs, resident communications<br />
and visitor services that promote Glendale and ensure the <strong>city</strong>’s key messages are delivered to<br />
target audiences in an accurate, timely and cost-effective manner.<br />
Department Description:<br />
The Marketing/Communications Department consists <strong>of</strong> nine divisions, including the Public<br />
Relations Office, Special Events, Tourism and the new Glendale Convention & Visitors Bureau,<br />
Glendale 11,Glendale Media Center, Web Services, Creative Services, Glendale Civic Center<br />
and Administration. Marketing/Communications produces and oversees Glendale’s print and<br />
electronic communications with the public and the media, as well as develops communication<br />
strategies and marketing campaigns that enhance the <strong>city</strong>’s image. The <strong>city</strong>’s special events,<br />
produced in this department, draw about one-half million visitors to downtown Glendale<br />
<strong>annual</strong>ly.<br />
FISCAL YEAR 20<strong>12</strong><br />
Goal<br />
Related Council Goal<br />
Activities<br />
GOALS<br />
Develop new strategic partnerships that can help crosspromote<br />
the <strong>city</strong>’s events and CVB efforts. Potential<br />
partners include the Centerline Arts Community; other<br />
Valley cities and CVBs; businesses in the Sports &<br />
Entertainment district and historic downtown Glendale;<br />
Camelback Ranch Glendale; Arrowhead Mall and the<br />
Education community.<br />
One community with quality economic development and<br />
high quality services for residents.<br />
Partner with other businesses and community groups to<br />
raise awareness or increase exposure on <strong>city</strong> campaigns,<br />
events and CVB activities. Use partner databases to reach<br />
156<br />
Return to TOC
Mission and Performance Measure<br />
Marketing/Communications<br />
larger audiences and coordinate joint events.<br />
Expected Outcomes<br />
(Perf. Measures)<br />
Time Commitment<br />
Expected Challenges<br />
Goal<br />
Related Council Goal<br />
Activities<br />
Expected Outcomes<br />
(Perf. Measures)<br />
Time Commitment<br />
Expected Challenges<br />
Additional dollars or in-kind trade from partners for joint<br />
events valued at $100,000; 3 joint familiarization media<br />
tours in support <strong>of</strong> tourism; at least 5 regional stories in<br />
Valleywide Republic for increased exposure.<br />
This is an ongoing effort <strong>of</strong> the Public Relations Office,<br />
CVB and Special Events; staff is committed to daily<br />
outreach.<br />
Coverage in some travel publications involve high expenses<br />
- a partnership can leverage some <strong>of</strong> these costs. City use <strong>of</strong><br />
partners’ databases or social media could be limited.<br />
Attracting new events to the area is a high priority goal for<br />
the Office <strong>of</strong> Special Events this year.<br />
One community with a vibrant <strong>city</strong> center and quality<br />
economic development.<br />
These efforts require event research not only <strong>of</strong> the other<br />
cities, facilities and promoters in the region, but also <strong>of</strong><br />
cities elsewhere in the state and country. We are looking to<br />
find events and activities that have the potential to be<br />
successful in such areas as the Historic Downtown,<br />
Westgate City Center and Camelback Ranch Glendale. We<br />
are also looking for promoters who are having success<br />
elsewhere with a particular format or event program that<br />
would consider relocating or adding one <strong>of</strong> their event<br />
productions to Glendale. Q<br />
The goal is attracting at least three new events to the <strong>city</strong><br />
this year.<br />
At least two staff members will devote several hours weekly<br />
to research events and outreach to promoters.<br />
We compete with other locations, cities and facilities<br />
everyday to become the preferred site and/or partner in<br />
hosting new or relocated events in our <strong>city</strong>. Challenges<br />
include the limited <strong>budget</strong>s <strong>of</strong> festival producers and less<br />
willingness to expand events to new locations.<br />
FISCAL YEAR <strong>2011</strong><br />
Area <strong>of</strong> Innovation:<br />
• A paid parking program was initiated for the first time at the two downtown garages<br />
during Glendale Festivals. This process was conceptualized from an idea generated by<br />
157<br />
Return to TOC
Mission and Performance Measure<br />
Marketing/Communications<br />
the Marketing Department to generate revenue for the <strong>city</strong>’s General Fund and<br />
implemented by the Office <strong>of</strong> Special Events.<br />
• The Department continues to expand the use <strong>of</strong> digital and social media in a variety <strong>of</strong><br />
ways. Examples include the CVB use <strong>of</strong> Twitter & Face<strong>book</strong>, downloadable brochures,<br />
e-newsletters and collateral; Glendale 11’s establishment <strong>of</strong> a secure online FTP site<br />
that allows media and clients to download video material 24/7 via a digital address<br />
provided by the <strong>city</strong> at minimal cost, and the Web Division’s use <strong>of</strong> special url’s that<br />
enable more accurate tracking <strong>of</strong> online advertising performance without paying for<br />
additional statistical reporting.<br />
Accomplishments:<br />
• The Marketing Department leveraged the <strong>2011</strong> Bowl Games for $2.2 million worth <strong>of</strong><br />
local, regional and national media coverage on a <strong>budget</strong> <strong>of</strong> $7,500.<br />
• Glendale’s signature events won 6 national awards from the International Festivals and<br />
Events Association for Special Events and Glendale 11 programming. These awards<br />
are the highest recognition in festivals around the world, competing against such events<br />
as the Rose Bowl and the Kentucky Derby.<br />
• Glendale 11 and the Web team developed a special live streaming video feed <strong>of</strong> the<br />
BCS championship game day, the Glitter & Glow Festival and the Chocolate Affaire;<br />
this allowed anyone with access to the internet to click on what’s happening in<br />
Glendale to see live video <strong>of</strong> these special events.<br />
GOAL UPDATES<br />
Transition the Glendale Visitors Center into a new Glendale<br />
Goal Convention & Visitors Bureau (CVB) to enhance tourism<br />
marketing efforts.<br />
Related Council Goal One community with quality economic development<br />
Was the goal met? The transition formally took place on July 1, 2010.<br />
What were the The GCVB Membership Drive is underway and on track with a<br />
Performance Measures? goal <strong>of</strong> 100 members for the first year.<br />
The tight economy has business and CVB partners also facing<br />
Obstacles/Challenges<br />
limited <strong>budget</strong>s.<br />
Goal<br />
Related Council Goal<br />
Was the goal met?<br />
Develop partnerships with businesses to maintain quality <strong>of</strong> <strong>city</strong><br />
festivals.<br />
One community with a vibrant <strong>city</strong> center.<br />
The Office <strong>of</strong> Special Events has established new partnerships<br />
with businesses such as ABC15, Bookmans, Music & Arts and<br />
Arizona Catering which have increased publi<strong>city</strong>, advertising and<br />
exposure, as well as enhanced our programming and onsite<br />
interactive <strong>of</strong>ferings to attendees and the <strong>city</strong>’s attractiveness as a<br />
festival destination.<br />
158<br />
Return to TOC
Mission and Performance Measure<br />
Marketing/Communications<br />
What were the<br />
Performance Measures?<br />
Obstacles/Challenges<br />
Special Events increased the dollar value <strong>of</strong> the TV promotional<br />
schedule and the TV website value; included live studio interview<br />
segments before every event; planned remote weather broadcasts<br />
at each event and greatly enhanced publi<strong>city</strong> from the new TV<br />
partner ABC15. The division also procured new <strong>budget</strong>-relieving<br />
trade support from Music & Arts on sheet music and related items;<br />
new <strong>budget</strong>-relieving programming and kids craft support from<br />
Bookmans and a new cooking demonstration program from<br />
Arizona Catering at the Civic Center was provided at no cost to<br />
events.<br />
Although many businesses are reticent to take on new marketing<br />
costs, which can provide us with <strong>budget</strong> relief, we were fortunate<br />
in what we were able to accomplish this year. We feel strongly<br />
this is due in great part to the <strong>city</strong> <strong>of</strong> Glendale’s reputation as a<br />
major festival producer. This, combined with a strong history <strong>of</strong><br />
attendance while providing great marketing value via community<br />
relations and branding exposure, is still a strong incentive for<br />
some <strong>of</strong> these partners to work with our festivals.<br />
FISCAL YEAR 2010<br />
Area <strong>of</strong> Innovation:<br />
• In an effort to reduce paper and ink cartridge costs, the creative services division now<br />
emails project “pro<strong>of</strong>s,” such as brochures, flyers and logo designs, to client<br />
departments in PDF format, rather than print a hard copy as was done in the past.<br />
Accomplishments:<br />
• The public relations <strong>of</strong>fice developed and implemented centennial-themed promotions<br />
and events throughout the year in recognition <strong>of</strong> Glendale’s 100th anniversary.<br />
• Marketing/Communications served as the liaison between the <strong>city</strong> and World<br />
Wrestling Entertainment in coordinating logistical support and <strong>city</strong> services for<br />
Wrestlemania XXVI. The event, which was held March 28, 2010, was the bestattended,<br />
highest-grossing entertainment event in the history <strong>of</strong> University <strong>of</strong> Phoenix<br />
Stadium. The event attracted 72,219 fans, about one thousand more than attended<br />
Super Bowl XLII in the same building.<br />
Goal<br />
Related Council Goal<br />
GOAL UPDATES<br />
Increase membership in the West Valley Events Coalition. This<br />
group was recently formed to position the region as a preferred<br />
year-round destination for conventions, meetings and major<br />
events.<br />
One community with quality economic development.<br />
159<br />
Return to TOC
Mission and Performance Measure<br />
Marketing/Communications<br />
Was the goal met?<br />
What were the<br />
Performance Measures?<br />
Obstacles/Challenges<br />
Goal<br />
Related Council Goal<br />
Was the goal met?<br />
What were the<br />
Performance Measures?<br />
Obstacles/Challenges<br />
Yes.<br />
The coalition has grown from 6 partners to more than 150 partners<br />
from the West Valley. Representatives include hoteliers,<br />
restaurateurs, meeting planners, venues and attractions.<br />
Continuing outreach to the entire West Valley and implementing a<br />
comprehensive print advertising campaign with limited funds.<br />
Maintain level <strong>of</strong> users for <strong>city</strong>’s three websites and continue cross<br />
promoting sites.<br />
One community with high quality services for citizens.<br />
Yes.<br />
Visitor numbers were maintained as major sports and<br />
entertainment district events and news items played a large role in<br />
cross promoting the <strong>city</strong>’s three websites. In addition, the Arizona<br />
Cardinals run to the Super Bowl attracted a tremendous amount <strong>of</strong><br />
visitors to the <strong>city</strong>’s websites.<br />
None.<br />
160<br />
Return to TOC
City <strong>of</strong> Glendale<br />
Budget Summary by Department<br />
Marketing and Comm.<br />
FUND NUMBER /<br />
BUDGET BY PROGRAM<br />
FY 2010<br />
Actual<br />
FY <strong>2011</strong><br />
Budget<br />
FY <strong>2011</strong><br />
Estimate<br />
FY 20<strong>12</strong><br />
Budget<br />
Percent Over<br />
FY <strong>2011</strong> Budget<br />
(1000) Audio/Visual<br />
$0 $208,8<strong>12</strong> $211,414 $188,922 -10%<br />
(1000) Cable Communications<br />
$716,250 $707,169 $707,169 $666,655 -6%<br />
(1000) City-Wide Special Events<br />
$310,474 $304,676 $304,676 $277,840 -9%<br />
(1000) Marketing<br />
$1,053,346 $934,636 $987,264 $853,849 -9%<br />
(1000) Special Events Prod. Support<br />
$40,481 $0 $0 $0 NA<br />
(1000) Tourism<br />
$420,205 $335,747 $283,119 $215,385 -36%<br />
(<strong>12</strong>81) Mkt'g - Stadium Events<br />
$166,668 $106,500 $106,500 $106,500 0%<br />
(1870) Audio/Visual - Self Sust.<br />
$0 $31,118 $31,118 $0 -100%<br />
(1870) Chocolate Affaire<br />
$110,987 $104,000 $104,000 $104,000 0%<br />
(1870) Convention & Visitors Bureau<br />
$0 $30,000 $30,000 $30,000 0%<br />
(1870) Enchanted Evening<br />
$81,280 $44,700 $44,700 $75,818 70%<br />
(1870) Glitter and Glow<br />
$83,263 $95,500 $45,500 $94,000 -2%<br />
(1870) Glitter Spectacular<br />
$<strong>12</strong>0,397 $99,000 $99,000 $99,000 0%<br />
(1870) Glitters Light<br />
$152,000 $155,798 $155,798 $155,798 0%<br />
(1870) J<strong>az</strong>z Festival<br />
$183,231 $158,000 $158,000 $158,000 0%<br />
(1870) Other Special Events<br />
$<strong>12</strong>7,405 $30,000 $30,000 $30,000 0%<br />
(1870) Summer Band<br />
$1,506 $0 $1,500 $1,500 NA<br />
(1870) Tourism - Souvenir Program<br />
$2,967 $5,000 $5,000 $5,000 0%<br />
Total - Marketing and Comm. $3,570,460 $3,350,656 $3,304,758 $3,062,267 -9%<br />
BUDGET BY CATEGORIES<br />
OF EXPENDITURES<br />
FY 2010<br />
Actual<br />
FY <strong>2011</strong><br />
Budget<br />
FY <strong>2011</strong><br />
Estimate<br />
FY 20<strong>12</strong><br />
Budget<br />
Percent Over<br />
FY <strong>2011</strong> Budget<br />
Wages/Salaries/Benefits $2,211,254 $2,384,707 $2,382,732 $2,200,166 -8%<br />
Supplies and Contracts $1,230,746 $941,322 $892,797 $941,230 0%<br />
Internal Premiums $82,621 $135,168 $135,168 $117,038 -13%<br />
Internal Service Charges $45,839 $14,081 $18,683 $16,300 16%<br />
Work Order Credits ($<strong>12</strong>4,622) ($<strong>12</strong>4,622) ($2<strong>12</strong>,467) 70%<br />
Total - Marketing and Comm. $3,570,460 $3,350,656 $3,304,758 $3,062,267 -9%<br />
STAFFING BY PROGRAM<br />
FY 2010<br />
Actual<br />
FY <strong>2011</strong><br />
Budget<br />
FY <strong>2011</strong><br />
Estimate<br />
FY 20<strong>12</strong><br />
Budget<br />
Percent Over<br />
FY <strong>2011</strong> Budget<br />
(1000) Audio/Visual 2 2 2 0%<br />
(1000) Cable Communications 7<br />
7 7 7 0%<br />
(1000) City-Wide Special Events 4<br />
4 3.75 3.75 -6%<br />
(1000) Marketing 14<br />
10 10 10 0%<br />
(1000) Tourism 3.5<br />
3.5 2.5 2.5 -29%<br />
Total -Marketing and Comm. 28.5 26.5 25.25 25.25 -5%<br />
161<br />
Return to TOC
City <strong>of</strong> Glendale<br />
Budget Summary by Department<br />
Conv./Media/Parking<br />
FUND NUMBER /<br />
BUDGET BY PROGRAM<br />
FY 2010<br />
Actual<br />
FY <strong>2011</strong><br />
Budget<br />
FY <strong>2011</strong><br />
Estimate<br />
FY 20<strong>12</strong><br />
Budget<br />
Percent Over<br />
FY <strong>2011</strong> Budget<br />
(1000) Convention/Media/Parking<br />
$221,114 $316,256 $316,256 $274,515 -13%<br />
(1000) Media Center Operations<br />
$143,026 $149,346 $149,346 $142,988 -4%<br />
Total - Conv./Media/Parking $364,140 $465,602 $465,602 $417,503 -10%<br />
BUDGET BY CATEGORIES<br />
OF EXPENDITURES<br />
FY 2010<br />
Actual<br />
FY <strong>2011</strong><br />
Budget<br />
FY <strong>2011</strong><br />
Estimate<br />
FY 20<strong>12</strong><br />
Budget<br />
Percent Over<br />
FY <strong>2011</strong> Budget<br />
Wages/Salaries/Benefits $98,391 $102,477 $102,477 $102,680 0%<br />
Supplies and Contracts $146,739 $186,774 $186,774 $178,496 -4%<br />
Internal Premiums $107,314 $165,373 $165,373 $130,729 -21%<br />
Internal Service Charges $11,696 $16,380 $16,380 $16,005 -2%<br />
Work Order Credits ($5,402) ($5,402) ($10,407) 93%<br />
Total - Conv./Media/Parking $364,140 $465,602 $465,602 $417,503 -10%<br />
STAFFING BY PROGRAM<br />
FY 2010<br />
Actual<br />
FY <strong>2011</strong><br />
Budget<br />
FY <strong>2011</strong><br />
Estimate<br />
FY 20<strong>12</strong><br />
Budget<br />
Percent Over<br />
FY <strong>2011</strong> Budget<br />
(1000) Media Center Operations 1<br />
1 1 1 0%<br />
Total -Conv./Media/Parking 1 1 1 1 0%<br />
162<br />
Return to TOC
Mission and Performance Measure<br />
Compliance and Asset Management<br />
City Auditor<br />
Compliance & Asset<br />
Management<br />
Materials<br />
Control<br />
COMPLIANCE AND ASSET MANAGEMENT<br />
Candace MacLeod<br />
Mission Statement:<br />
• To conduct independent, objective assurance and consulting activities that add value and<br />
improve operations.<br />
• To augment the effectiveness <strong>of</strong> the tax dollar in the purchase <strong>of</strong> materials and services<br />
within the requirements <strong>of</strong> <strong>city</strong> code and state law.<br />
• To assist <strong>city</strong> departments with efficient and cost-effective warehousing, inventory control<br />
and disposal <strong>of</strong> surplus assets.<br />
Department Description:<br />
Compliance and Asset Management improves the effectiveness <strong>of</strong> risk management, control and<br />
governance processes by:<br />
• Providing audit and consulting services to <strong>city</strong> departments to identi<strong>fy</strong> and minimize business<br />
risks, maximize efficiencies, improve internal controls and strengthen accountability to<br />
Glendale’s citizens.<br />
• Working with <strong>city</strong> departments to ensure the procurement <strong>of</strong> goods and services is completed<br />
in a manner that is compliant with <strong>city</strong> code and state statutes.<br />
• Providing logistical support to departments by procuring and maintaining a secure, just-intime<br />
inventory <strong>of</strong> supplies for all <strong>city</strong> departments.<br />
• Selling surplus <strong>city</strong> assets at the best available price.<br />
FISCAL YEAR 20<strong>12</strong><br />
Materials<br />
Management<br />
Goal<br />
Related Council Goal<br />
Activities<br />
Expected Outcomes<br />
(Perf. Measures)<br />
GOALS<br />
Allocate audit resources to the areas that pose the greatest risk to the<br />
<strong>city</strong>.<br />
One community that is fiscally sound.<br />
Develop a risk-based audit plan with focus on improved business<br />
processes.<br />
Quarterly risk-based audit plan with focus on improved business<br />
processes.<br />
163<br />
Return to TOC
Mission and Performance Measure<br />
Compliance and Asset Management<br />
Time Commitment<br />
Expected Challenges<br />
Ongoing review and adjustment <strong>of</strong> audit plan based on business risk.<br />
None.<br />
Goal<br />
Related Council Goal<br />
Activities<br />
Expected Outcomes<br />
(Perf. Measures)<br />
Time Commitment<br />
Expected Challenges<br />
Ensure <strong>city</strong> assets are adequately safeguarded.<br />
One community that is fiscally sound.<br />
Centralize the ordering and storage <strong>of</strong> <strong>city</strong> assets under Materials<br />
Control.<br />
Assets are properly tracked and controlled.<br />
Ongoing process to ensure that assets are transferred to Materials<br />
Control.<br />
None.<br />
Goal<br />
Related Council Goal<br />
Activities<br />
Expected Outcomes<br />
(Perf. Measures)<br />
Time Commitment<br />
Expected Challenges<br />
Ensure the procurement code is current.<br />
One community that is fiscally sound.<br />
Update the procurement code to reflect changes that have occurred.<br />
Procurement code is current.<br />
Ongoing.<br />
Resources.<br />
FISCAL YEAR <strong>2011</strong><br />
Area <strong>of</strong> Innovation:<br />
• Utilized audit s<strong>of</strong>tware tools to effectively facilitate audit testing procedures.<br />
• Streamlined procurement forms and processes to enhance communication and access to<br />
information.<br />
• Centralized storage <strong>of</strong> utilities and janitorial inventory under Materials Control.<br />
Accomplishments:<br />
• Completed ten performance and information technology audits and follow-ups and four<br />
contract audits.<br />
164<br />
Return to TOC
Mission and Performance Measure<br />
Compliance and Asset Management<br />
• Performed thirteen special projects at the request <strong>of</strong> management.<br />
• Maintained over 200 contracts with an estimated value in excess <strong>of</strong> $60 million.<br />
• Generated revenue from the sale <strong>of</strong> surplus assets.<br />
Goal<br />
Related Council Goal<br />
Was the goal met?<br />
What were the Performance<br />
Measures?<br />
Obstacles/Challenges<br />
Goal<br />
Related Council Goal<br />
Was the goal met?<br />
What were the Performance<br />
Measures?<br />
Obstacles/Challenges<br />
Goal<br />
Related Council Goal<br />
Was the goal met?<br />
What were the Performance<br />
Measures?<br />
Obstacles/Challenges<br />
GOAL UPDATES<br />
Consider the effectiveness <strong>of</strong> the <strong>city</strong>’s safety and security<br />
practices.<br />
One community that is fiscally sound.<br />
Yes.<br />
Every audit includes an assessment <strong>of</strong> compliance with<br />
laws and regulations.<br />
None.<br />
Allocate audit resources to the areas that pose the greatest<br />
risk to the <strong>city</strong>.<br />
One community that is fiscally sound.<br />
Yes.<br />
Quarterly risk-based audit plan with focus on improved<br />
business processes.<br />
None.<br />
Reduce the manual processes through increased use <strong>of</strong><br />
PeopleS<strong>of</strong>t functionalities. Improve employee skill sets in<br />
using PeopleS<strong>of</strong>t functions.<br />
One community that is fiscally sound.<br />
Yes.<br />
The revision <strong>of</strong> the procurement code has been deferred<br />
until completion <strong>of</strong> the FY <strong>2011</strong> <strong>budget</strong> development<br />
process and implementation <strong>of</strong> a PeopleS<strong>of</strong>t upgrade.<br />
Resources.<br />
FISCAL YEAR 2010<br />
Area <strong>of</strong> Innovation:<br />
• Audit continued to look for opportunities to increase efficiency and reduce costs by<br />
moving to a paperless environment. Work papers, reports and surveys are created,<br />
distributed and retained electronically. An increase in online training has allowed staff<br />
to obtain required pr<strong>of</strong>essional education hours at a reduced cost.<br />
165<br />
Return to TOC
Mission and Performance Measure<br />
Compliance and Asset Management<br />
Accomplishments:<br />
• During FY 2010, seven performance audits, five information technology audits, 15<br />
special projects and five contract audits were completed.<br />
• Audit staff serves on three committees and attended four <strong>city</strong> sponsored events.<br />
Goal<br />
Related Council Goal<br />
Was the goal met?<br />
What were the<br />
Performance Measures?<br />
Obstacles/Challenges<br />
Goal<br />
Related Council Goal<br />
Was the goal met?<br />
What were the<br />
Performance Measures?<br />
Obstacles/Challenges<br />
GOAL UPDATES<br />
Allocate resources to the areas that pose the greatest risk to the<br />
<strong>city</strong>.<br />
One community that is fiscally sound.<br />
Yes.<br />
Quarterly risk based audit plan with focus on improved business<br />
processes.<br />
None.<br />
Consider the effectiveness <strong>of</strong> the <strong>city</strong>’s safety and security<br />
practices.<br />
One community that is fiscally sound.<br />
Yes.<br />
Every audit includes an assessment <strong>of</strong> compliance with laws and<br />
regulations.<br />
None.<br />
166<br />
Return to TOC
City <strong>of</strong> Glendale<br />
Budget Summary by Department<br />
Compliance & Asset Mgt<br />
FUND NUMBER /<br />
BUDGET BY PROGRAM<br />
FY 2010<br />
Actual<br />
FY <strong>2011</strong><br />
Budget<br />
FY <strong>2011</strong><br />
Estimate<br />
FY 20<strong>12</strong><br />
Budget<br />
Percent Over<br />
FY <strong>2011</strong> Budget<br />
(1000) City Auditor<br />
$280,047 $254,348 $254,348 $265,196 4%<br />
(1000) Materials Control Warehouse<br />
$358,043 $295,037 $295,037 $279,552 -5%<br />
(1000) Materials Management<br />
$603,384 $388,224 $388,224 $163,<strong>12</strong>6 -58%<br />
Total - Compliance & Asset Mgt $1,241,474 $937,609 $937,609 $707,874 -25%<br />
BUDGET BY CATEGORIES<br />
OF EXPENDITURES<br />
FY 2010<br />
Actual<br />
FY <strong>2011</strong><br />
Budget<br />
FY <strong>2011</strong><br />
Estimate<br />
FY 20<strong>12</strong><br />
Budget<br />
Percent Over<br />
FY <strong>2011</strong> Budget<br />
Wages/Salaries/Benefits $1,194,682 $929,263 $929,263 $728,531 -22%<br />
Supplies and Contracts $16,540 $25,705 $25,705 $26,773 4%<br />
Internal Premiums $18,038 $20,888 $20,888 $17,064 -18%<br />
Internal Service Charges $<strong>12</strong>,214 $11,616 $11,616 $10,162 -13%<br />
Work Order Credits ($49,863) ($49,863) ($74,656) 50%<br />
Total - Compliance & Asset Mgt $1,241,474 $937,609 $937,609 $707,874 -25%<br />
STAFFING BY PROGRAM<br />
FY 2010<br />
Actual<br />
FY <strong>2011</strong><br />
Budget<br />
FY <strong>2011</strong><br />
Estimate<br />
FY 20<strong>12</strong><br />
Budget<br />
Percent Over<br />
FY <strong>2011</strong> Budget<br />
(1000) City Auditor 4.5<br />
2 2.5 2.5 25%<br />
(1000) Materials Control Warehouse 5.75<br />
4.75 4.75 4.75 0%<br />
(1000) Materials Management 5<br />
4 2 2 -50%<br />
Total -Compliance & Asset Mgt 15.25 10.75 9.25 9.25 -14%<br />
167<br />
Return to TOC
City <strong>of</strong> Glendale<br />
Budget Summary by Department<br />
Community Dev Admin<br />
FUND NUMBER /<br />
BUDGET BY PROGRAM<br />
FY 2010<br />
Actual<br />
FY <strong>2011</strong><br />
Budget<br />
FY <strong>2011</strong><br />
Estimate<br />
FY 20<strong>12</strong><br />
Budget<br />
Percent Over<br />
FY <strong>2011</strong> Budget<br />
(1000) CD Deputy City Manager<br />
$164,257 $195,964 $195,964 $186,405 -5%<br />
Total - Community Dev Admin $164,257 $195,964 $195,964 $186,405 -5%<br />
BUDGET BY CATEGORIES<br />
OF EXPENDITURES<br />
FY 2010<br />
Actual<br />
FY <strong>2011</strong><br />
Budget<br />
FY <strong>2011</strong><br />
Estimate<br />
FY 20<strong>12</strong><br />
Budget<br />
Percent Over<br />
FY <strong>2011</strong> Budget<br />
Wages/Salaries/Benefits $161,717 $199,313 $199,313 $199,681 0%<br />
Supplies and Contracts $1,013 $5,756 $5,756 $6,194 8%<br />
Internal Premiums $1,179 $1,602 $1,602 $1,075 -33%<br />
Internal Service Charges $348 $173 $173 $170 -2%<br />
Work Order Credits ($10,880) ($10,880) ($20,715) 90%<br />
Total - Community Dev Admin $164,257 $195,964 $195,964 $186,405 -5%<br />
STAFFING BY PROGRAM<br />
FY 2010<br />
Actual<br />
FY <strong>2011</strong><br />
Budget<br />
FY <strong>2011</strong><br />
Estimate<br />
FY 20<strong>12</strong><br />
Budget<br />
Percent Over<br />
FY <strong>2011</strong> Budget<br />
(1000) CD Deputy City Manager 1<br />
1 1 1 0%<br />
Total -Community Dev Admin 1 1 1 1 0%<br />
168<br />
Return to TOC
Mission and Performance Measure<br />
Building Safety<br />
Goal<br />
Related Council Goal<br />
Activities<br />
Expected Outcomes<br />
(Perf. Measures)<br />
Administer and enforce construction codes and development<br />
regulations that produce a safe, durable, efficient, accessible,<br />
and sustainable built environment.<br />
One community with high quality services for citizens.<br />
Analyze and develop code amendments towards the<br />
adoption <strong>of</strong> the 20<strong>12</strong> International Energy Code.<br />
Have staff fully trained on the new energy code and<br />
procedures.<br />
Time Commitment Staff trained and code ready to adopt by June 30 , <strong>2011</strong>.<br />
Expected Challenges<br />
Challenge to provide training for staff has been overcome by<br />
financial resources provided by an Energy Efficiency and<br />
Conservation Block Grant.<br />
FISCAL YEAR <strong>2011</strong><br />
Area <strong>of</strong> Innovation:<br />
• The department is currently involved with the Innovate team on several <strong>of</strong> our<br />
processes. The certificate <strong>of</strong> occupancy process at the completion <strong>of</strong> a development<br />
project is one <strong>of</strong> the most complex as it involves over six departments. The goal is to<br />
make this process easier and less complex for both internal staff and the development<br />
customer.<br />
• Building Safety and DSC have created classes that are being <strong>of</strong>fered to the public to<br />
assist in understanding the permit process and why permits are necessary. Three<br />
classes are currently being <strong>of</strong>fered: Permits 101, Solar Installations, and How to Build<br />
a Patio Cover. We have partnered with Home Depot to provide the patio cover class at<br />
their store. These classes have become popular with citizens who anticipate building a<br />
project, or simply have questions about why permits are necessary.<br />
• The group home process has been completed through the Innovate team and is<br />
currently being implemented. Coordination <strong>of</strong> <strong>city</strong> requirements with outside agencies<br />
has become simplified and will actually save at least one trip to <strong>city</strong> hall for each<br />
applicant.<br />
Accomplishments:<br />
• Plans were approved and inspections continue for a 40,000 square foot school for<br />
West-MEC which will bring new education opportunities and jobs near the Glendale<br />
Municipal Airport. West-MEC’s new facility will provide training for individuals who<br />
wish to enter the airframe-power maintenance program and fulfill FAA licensing<br />
requirements.<br />
• Building Safety worked with the Police Department and has been successful in<br />
bringing over 15 businesses and residences into compliance with <strong>city</strong> regulations or in<br />
abating properties that were not able to be secured from entry.<br />
170<br />
Return to TOC
Mission and Performance Measure<br />
Building Safety<br />
• Development Services has implemented a new phone system allowing staff to spend<br />
more time directly assisting customers at the counter and achieving a $400 per month<br />
cost savings.<br />
Goal<br />
Related Council Goal<br />
Was the goal met?<br />
What were the<br />
Performance Measures?<br />
Obstacles/Challenges<br />
Goal<br />
Related Council Goal<br />
Was the goal met?<br />
What were the<br />
Performance Measures?<br />
Obstacles/Challenges<br />
GOAL UPDATES<br />
Provide responsive, proactive, efficient, consistent and costeffective<br />
service.<br />
One community with high quality services for citizens.<br />
Monitoring and tracking progress on unsafe and damaged<br />
buildings continues to be an ongoing process. Quarterly status<br />
report <strong>of</strong> all cases was reported to the Assistant Director.<br />
Additionally, a database was maintained for Council and<br />
management to obtain status <strong>of</strong> cases as needed.<br />
Staff provides quarterly reports on status <strong>of</strong> all cases to Assistant<br />
Director and Assistant Deputy City Manager. Plus, maintain<br />
database for communicating regularly to Council and management<br />
<strong>of</strong> case workload and status <strong>of</strong> cases.<br />
On several occasions it was difficult to indenti<strong>fy</strong> and contact the<br />
resident’s legal owner, which prolonged the process. Also, due to<br />
the economy, several cases were not able to be abated in a timely<br />
manner due to the lack <strong>of</strong> resources <strong>of</strong> the property owner.<br />
Administer and enforce construction codes and development<br />
regulations that produce a safe, durable, efficient and accessible<br />
built environment.<br />
One community with high quality services for citizens.<br />
Implementation <strong>of</strong> improvements in customer service at the public<br />
counter by cross training in other departments has enabled staff to<br />
exceed the goal <strong>of</strong> reviewing over 20% <strong>of</strong> over-the-counter plans<br />
throughout the year.<br />
20% <strong>of</strong> all over-the-counter plans will be reviewed through the<br />
one-stop shop by January <strong>2011</strong>.<br />
Even with a reduction is staffing at the public counter, we were<br />
able to exceed this goal by continuing to cross train all staff in<br />
different areas <strong>of</strong> our department.<br />
FISCAL YEAR 2010<br />
Area <strong>of</strong> Innovation:<br />
• Implementation <strong>of</strong> first online permitting process to obtain permits for the replacement<br />
<strong>of</strong> water heaters. This aids the customer in complying with codes as adopted by the <strong>city</strong><br />
171<br />
Return to TOC
Mission and Performance Measure<br />
Building Safety<br />
<strong>of</strong> Glendale and eliminates the need for them to come to City Hall which in turn saves<br />
them time. This practice also frees up parking spaces in our garage, cuts down on fuel<br />
consumption, vehicle wear and tear, traffic and pollution.<br />
• Adjustments have been made to our printing procedures for the issuance <strong>of</strong> permits and<br />
certificates <strong>of</strong> occupancy. Discontinuing the printing <strong>of</strong> one copy <strong>of</strong> each <strong>of</strong> these<br />
forms has saved time, money and wear and tear on our equipment. Both <strong>of</strong> these<br />
innovative ideas have provided ”green” contributions to our everyday business.<br />
Accomplishments:<br />
• Completion <strong>of</strong> several large projects has taken place during this past year. Banner<br />
Thunderbird Hospital opened its new wing to patients and the renovation work to back<br />
fill the original hospital continues. Midwestern University completed several exciting<br />
large projects this past year including the optometry and dental clinics.<br />
• This year, several building inspectors have cross trained in the Fire Marshall’s Office<br />
and a plan technician cross trained in the Transportation Department. This cross<br />
training brings new skills and awareness to the Building Safety Department and<br />
strengthens relationships between departments.<br />
• Building Safety Department met the challenge <strong>of</strong> bringing many new economic<br />
development projects to fruition including Advanced Health Care, Phoenix Heart and<br />
Humana.<br />
• Streamlined record retrieval system which included scanning over 67,000 permits and<br />
other permit related documents.<br />
Goal<br />
Related Council Goal<br />
Was the goal met?<br />
What were the<br />
Performance Measures?<br />
Obstacles/Challenges<br />
Goal<br />
Related Council Goal<br />
Was the goal met?<br />
GOAL UPDATES<br />
Administer and enforce construction codes and development<br />
regulations that produce a safe, durable, efficient and accessible<br />
built environment.<br />
One community with high quality services for citizens.<br />
Publish departmental newsletter to increase public and customer<br />
awareness <strong>of</strong> development processes and requirements.<br />
Publish newsletter quarterly, with each manager and supervisor<br />
submitting one article per newsletter.<br />
None.<br />
Provide responsive, proactive, efficient, consistent and costeffective<br />
service.<br />
One community with high quality services for citizens.<br />
Encourage and facilitate staff’s continued education and training<br />
to effectively and efficiently perform their duties.<br />
172<br />
Return to TOC
Mission and Performance Measure<br />
Building Safety<br />
What were the<br />
Performance Measures?<br />
Obstacles/Challenges<br />
Develop internal training programs for interpretation <strong>of</strong> codes and<br />
development regulations.<br />
None.<br />
173<br />
Return to TOC
City <strong>of</strong> Glendale<br />
Budget Summary by Department<br />
Building Safety<br />
FUND NUMBER /<br />
BUDGET BY PROGRAM<br />
FY 2010<br />
Actual<br />
FY <strong>2011</strong><br />
Budget<br />
FY <strong>2011</strong><br />
Estimate<br />
FY 20<strong>12</strong><br />
Budget<br />
Percent Over<br />
FY <strong>2011</strong> Budget<br />
(1000) Building Safety<br />
$2,665,919 $1,980,628 $1,979,628 $1,895,038 -4%<br />
(1000) Development Services Center<br />
$568,993 $444,676 $444,676 $425,102 -4%<br />
(2400) Cross Connection Control<br />
$2<strong>12</strong>,090 $220,067 $261,067 $225,<strong>12</strong>5 2%<br />
Total - Building Safety $3,447,002 $2,645,371 $2,685,371 $2,545,265 -4%<br />
BUDGET BY CATEGORIES<br />
OF EXPENDITURES<br />
FY 2010<br />
Actual<br />
FY <strong>2011</strong><br />
Budget<br />
FY <strong>2011</strong><br />
Estimate<br />
FY 20<strong>12</strong><br />
Budget<br />
Percent Over<br />
FY <strong>2011</strong> Budget<br />
Wages/Salaries/Benefits $3,276,649 $2,532,664 $2,616,573 $2,566,247 1%<br />
Supplies and Contracts $46,918 $119,497 $83,157 $110,421 -8%<br />
Internal Premiums $66,052 $64,111 $64,111 $50,443 -21%<br />
Internal Service Charges $57,383 $60,757 $53,188 $54,545 -10%<br />
Work Order Credits ($131,658) ($131,658) ($236,391) 80%<br />
Total - Building Safety $3,447,002 $2,645,371 $2,685,371 $2,545,265 -4%<br />
STAFFING BY PROGRAM<br />
FY 2010<br />
Actual<br />
FY <strong>2011</strong><br />
Budget<br />
FY <strong>2011</strong><br />
Estimate<br />
FY 20<strong>12</strong><br />
Budget<br />
Percent Over<br />
FY <strong>2011</strong> Budget<br />
(1000) Building Safety 26<br />
21 21 21 0%<br />
(1000) Development Services Center 10<br />
6 6 6 0%<br />
(2400) Cross Connection Control 2.75<br />
2.75 2.75 2.75 0%<br />
Total -Building Safety 38.75 29.75 29.75 29.75 0%<br />
174<br />
Return to TOC
Mission and Performance Measure<br />
Code Compliance<br />
Development<br />
Services<br />
Building<br />
Safety<br />
Code<br />
Compliance<br />
CODE COMPLIANCE<br />
Sam McAllen<br />
Planning<br />
Mission Statement:<br />
To maintain established community standards that preserve and promote the health, safety and<br />
living environment <strong>of</strong> the community and neighborhoods.<br />
Department Description:<br />
Code Compliance is responsible for enforcing multiple <strong>city</strong> codes that promote safe, clean, and<br />
healthy living environments for our community and neighborhoods.<br />
FISCAL YEAR 20<strong>12</strong><br />
Goal<br />
Related Council Goal<br />
Activities<br />
Expected Outcomes<br />
(Perf. Measures)<br />
Time Commitment<br />
Expected Challenges<br />
GOALS<br />
Provide proactive code enforcement services in residential<br />
neighborhoods that promote a safe, clean, and healthy living<br />
environment for our community and neighborhoods.<br />
One community with strong neighborhoods.<br />
Conduct proactive code enforcement services in residential<br />
neighborhoods with the objective <strong>of</strong> eliminating code<br />
violations and preventing the negative impact <strong>of</strong> blight,<br />
deterioration, and unsafe conditions.<br />
Code Compliance staff will generate 10,000 proactive code<br />
compliance cases.<br />
This is an ongoing <strong>city</strong>wide effort that will continue<br />
throughout the year to proactively identi<strong>fy</strong> and address code<br />
violations while reducing the need for residents to report<br />
code violations.<br />
Staff may be challenged to conduct proactive inspections<br />
during times <strong>of</strong> significant increases in reports <strong>of</strong> code<br />
violations, such as during periods <strong>of</strong> significant vegetation<br />
growth following substantial precipitation.<br />
175<br />
Return to TOC
Mission and Performance Measure<br />
Code Compliance<br />
Goal<br />
Related Council Goal<br />
Activities<br />
Expected Outcomes<br />
(Perf. Measures)<br />
Time Commitment<br />
Expected Challenges<br />
Maintain community standards that promote a safe, clean,<br />
and healthy living environment through prompt and<br />
effective response to resident calls for service.<br />
One community with strong neighborhoods.<br />
Conduct responsive code enforcement services to ensure<br />
compliance with <strong>city</strong> codes and ordinances that eliminate<br />
unsafe conditions and prevent the deterioration <strong>of</strong> residential<br />
neighborhoods.<br />
Code Compliance adopted the goal <strong>of</strong> responding to 95% <strong>of</strong><br />
citizen’s calls for service within 2 business days.<br />
This is an ongoing <strong>city</strong>wide effort to provide prompt and<br />
efficient service to all residents <strong>of</strong> Glendale.<br />
Staff will be challenged to accomplish this goal due to<br />
current staffing levels and inavailability <strong>of</strong> staff due to<br />
mandatory furloughs and reduced weekday availability as<br />
Code Compliance Inspectors are required to take time <strong>of</strong>f<br />
due to providing weekend coverage.<br />
FISCAL YEAR <strong>2011</strong><br />
Area <strong>of</strong> Innovation:<br />
• The Code Compliance Department is responsible for enforcing illegal sign violations<br />
including managing the removal <strong>of</strong> illegal signs that create a visual blight along the<br />
<strong>city</strong>’s rights <strong>of</strong> way. For the past few years this has been accomplished by utilizing a<br />
combination <strong>of</strong> paid inspection staff and volunteers to remove illegal signs. With the<br />
reduction <strong>of</strong> inspection staff due to <strong>budget</strong> constraints, the task has become more<br />
difficult to accomplish. The use <strong>of</strong> volunteers to remove illegal signs was increased in<br />
an effort to maintain a safe, clean and appealing streetscape. This was accomplished<br />
by increasing the number <strong>of</strong> hours and days that volunteers work removing illegal<br />
signs. This increase in volunteer work time has allowed Code Compliance inspection<br />
staff the ability to concentrate on identi<strong>fy</strong>ing and eliminating unsafe conditions and<br />
code violations within residential neighborhoods.<br />
Accomplishments:<br />
• Code Compliance staff and volunteers continued to remove the visual blight created by<br />
illegal temporary signs on the <strong>city</strong>’s right <strong>of</strong> way. A total <strong>of</strong> <strong>12</strong>,936 signs have been<br />
removed from the <strong>city</strong>’s rights <strong>of</strong> way through February <strong>2011</strong>.<br />
• Code Compliance Supervisor Jim Trammel and Code Compliance volunteers were<br />
featured in a News Channel 3 broadcast (November 18, 2010) highlighting the<br />
Department’s illegal sign enforcement and removal efforts.<br />
• Code Compliance utilized Community Development Block Grants (CDBG) funds to<br />
identi<strong>fy</strong> and eliminate blighted conditions within Glendale neighborhoods. CDBG<br />
176<br />
Return to TOC
Mission and Performance Measure<br />
Code Compliance<br />
funds were used to abate violations on 67 vacant and foreclosed properties at a cost <strong>of</strong><br />
$9,234 through February <strong>2011</strong>.<br />
• The Code Compliance Department contacted all political campaigns participating in<br />
the 2010 Primary and General Elections and informed them <strong>of</strong> Glendale’s political sign<br />
code and legal political sign posting requirements.<br />
Goal<br />
Related Council Goal<br />
Was the goal met?<br />
What were the<br />
Performance Measures?<br />
Obstacles/Challenges<br />
Goal<br />
Related Council Goal<br />
Was the goal met?<br />
What were the<br />
Performance Measures?<br />
Obstacles/Challenges<br />
GOAL UPDATES<br />
Maintain community standards that promote a clean, safe, and<br />
healthy living environment through prompt and effective response<br />
to citizens’ calls for service.<br />
One community with high quality services for citizens.<br />
This goal has not been met. As <strong>of</strong> the end <strong>of</strong> February <strong>2011</strong>, Code<br />
Compliance staff has responded to 91% <strong>of</strong> resident calls for<br />
service within two (2) business days.<br />
To ensure prompt response to calls for service Code Compliance<br />
adopted the goal <strong>of</strong> responding to 95% <strong>of</strong> calls from citizens<br />
within two (2) business days.<br />
The primary obstacle contributing to this goal not being<br />
accomplished is the lack <strong>of</strong> inspection staff available to respond to<br />
resident calls on weekdays. This reduction is the result <strong>of</strong> less<br />
inspection staff, mandatory furloughs, and reduced weekday<br />
availably as Code Compliance Inspectors are required to take time<br />
<strong>of</strong>f on weekdays after they have provided weekend coverage.<br />
Provide proactive code enforcement services in residential<br />
neighborhoods that promote a clean, safe and healthy living<br />
environment for the community.<br />
One community with strong neighborhoods.<br />
This goal is on track to be successfully completed. Through<br />
February <strong>2011</strong>, Code Compliance staff has proactively generated<br />
7,822 cases.<br />
Code Compliance staff will proactively generate 10,000 Code<br />
Compliance cases.<br />
No challenges encountered.<br />
FISCAL YEAR 2010<br />
Area <strong>of</strong> Innovation:<br />
• The Code Compliance Department has been able to maintain a high level <strong>of</strong> service<br />
delivery to residential neighborhoods by applying for grant funds that can be used to<br />
177<br />
Return to TOC
Mission and Performance Measure<br />
Code Compliance<br />
eliminate blight and deterioration. The department applied for and received<br />
Community Development Block Grant (CDBG) funds that are being used to identi<strong>fy</strong><br />
and eliminate code violations in low to moderate income neighborhoods. The CDBG<br />
funds are being used in a partnership with the Community Partnerships Department to<br />
share the cost <strong>of</strong> an inspector who conducts proactive code inspections in designated<br />
residential neighborhoods. These proactive inspections serve to identi<strong>fy</strong> and eliminate<br />
code violations that contribute to blight and deterioration <strong>of</strong> the impacted residential<br />
neighborhoods. The CDBG funds are also being used to abate code violations on<br />
vacant foreclosed properties that are creating blighted or deteriorated conditions within<br />
residential neighborhoods. When foreclosed properties become vacant, the properties<br />
deteriorate resulting in <strong>city</strong> code violations such as overgrown vegetation, trash and<br />
debris, broken windows and doors, and graffiti. These blighted conditions are<br />
detrimental to the public’s health, safety, and property values and negatively impact the<br />
livability <strong>of</strong> the affected neighborhoods. Obtaining CDBG funds helps fund the<br />
abatement <strong>of</strong> many more <strong>city</strong> code violations that would otherwise be addressed using<br />
only the department’s <strong>budget</strong>ed general funds.<br />
Accomplishments:<br />
• The department has been extremely busy throughout the <strong>city</strong> managing over <strong>12</strong>,000<br />
cases through the end <strong>of</strong> March 2010. Code Compliance staff has been working very<br />
hard to provide prompt and effective customer service by proactively initiating 69% <strong>of</strong><br />
all cases handled this fiscal year.<br />
• The department applied for and was awarded a CDBG for over $76,000 to identi<strong>fy</strong> and<br />
eliminate code violations at vacant properties that are creating unsafe slum and<br />
blighting conditions in residential neighborhoods.<br />
Goal<br />
Related Council Goal<br />
Was the goal met?<br />
What were the<br />
Performance Measures?<br />
Obstacles/Challenges<br />
Goal<br />
Related Council Goal<br />
GOAL UPDATES<br />
Provide an increased level <strong>of</strong> proactive services in residential<br />
neighborhoods.<br />
One community with strong neighborhoods.<br />
Partially, the major part <strong>of</strong> this goal is on track to be met by<br />
generating over 8,900 proactive code cases through the third<br />
quarter. However, only 536 volunteer hours have been<br />
accumulated, so the goal has not been completely met.<br />
Generate 10,000 new proactive code cases <strong>city</strong>wide, and maintain<br />
sufficient volunteer staff to provide a minimum <strong>of</strong> 1,500 hours <strong>of</strong><br />
volunteer service.<br />
Recruiting and maintaining sufficient volunteer services has been<br />
the key challenge to meeting this goal.<br />
Increase community awareness <strong>of</strong> <strong>city</strong> codes and enforcement<br />
procedures.<br />
One community with high quality services for citizens.<br />
178<br />
Return to TOC
Mission and Performance Measure<br />
Code Compliance<br />
Was the goal met?<br />
What were the<br />
Performance Measures?<br />
Obstacles/Challenges<br />
Yes, this goal had been met by the continued participation in<br />
Glendale University and several neighborhood programs as well<br />
as having updated the department’s website with more current and<br />
bilingual information. Additionally, a property maintenance<br />
brochure has been updated to include bilingual information.<br />
• Continue to participate in Glendale University.<br />
• Participate in six neighborhood programs to provide<br />
neighborhood specific <strong>city</strong> code information.<br />
• Update the department’s website and printed materials to<br />
include bilingual information.<br />
None.<br />
179<br />
Return to TOC
City <strong>of</strong> Glendale<br />
Budget Summary by Department<br />
Code Compliance<br />
FUND NUMBER /<br />
BUDGET BY PROGRAM<br />
FY 2010<br />
Actual<br />
FY <strong>2011</strong><br />
Budget<br />
FY <strong>2011</strong><br />
Estimate<br />
FY 20<strong>12</strong><br />
Budget<br />
Percent Over<br />
FY <strong>2011</strong> Budget<br />
(1000) Code Compliance<br />
$1,468,073 $1,368,354 $1,368,354 $1,295,976 -5%<br />
Total - Code Compliance $1,468,073 $1,368,354 $1,368,354 $1,295,976 -5%<br />
BUDGET BY CATEGORIES<br />
OF EXPENDITURES<br />
FY 2010<br />
Actual<br />
FY <strong>2011</strong><br />
Budget<br />
FY <strong>2011</strong><br />
Estimate<br />
FY 20<strong>12</strong><br />
Budget<br />
Percent Over<br />
FY <strong>2011</strong> Budget<br />
Wages/Salaries/Benefits $1,335,273 $1,300,025 $1,300,025 $1,299,776 0%<br />
Supplies and Contracts $48,599 $56,866 $56,866 $51,108 -10%<br />
Internal Premiums $30,306 $32,064 $32,064 $25,808 -20%<br />
Internal Service Charges $53,895 $47,478 $47,478 $50,107 6%<br />
Work Order Credits ($68,079) ($68,079) ($130,823) 92%<br />
Total - Code Compliance $1,468,073 $1,368,354 $1,368,354 $1,295,976 -5%<br />
STAFFING BY PROGRAM<br />
FY 2010<br />
Actual<br />
FY <strong>2011</strong><br />
Budget<br />
FY <strong>2011</strong><br />
Estimate<br />
FY 20<strong>12</strong><br />
Budget<br />
Percent Over<br />
FY <strong>2011</strong> Budget<br />
(1000) Code Compliance 21.5<br />
19 19 19 0%<br />
Total -Code Compliance 21.5 19 19 19 0%<br />
180<br />
Return to TOC
Mission and Performance Measure<br />
Planning<br />
Development<br />
Services<br />
Building<br />
Safety<br />
Code<br />
Compliance<br />
PLANNING<br />
Jon Froke<br />
Planning<br />
Mission Statement:<br />
The Glendale Planning Department provides pr<strong>of</strong>essional quality customer service in a friendly<br />
and responsive manner. The mission includes:<br />
• Assist elected and appointed <strong>of</strong>ficials in planning for future land use, development and<br />
redevelopment in harmony with community values.<br />
• Facilitate community involvement in the decision making process.<br />
• Facilitate decision making through Glendale’s Boards & Commissions.<br />
• Administer adopted regulations and guidelines in a fair and impartial manner.<br />
• Manage the general plan, zoning, subdivision and design review process efficiently.<br />
• Resolve to the best <strong>of</strong> our ability the inevitable issues and conflicts associated with<br />
changing land use and development.<br />
Department Description:<br />
The Planning Department has three major functions: long range planning and research, current<br />
planning, and zoning administration. All three major functions provide service to internal and<br />
external customers to service the community.<br />
The long range planning and research function is responsible for the long-range physical General<br />
Plan, special studies, research, quarterly population estimates, annexation analysis and<br />
application processing. In addition, the division administers the Historic Preservation Ordinance<br />
and the related program, coordinates preparation <strong>of</strong> national and local register nominations and<br />
staffs the Historic Preservation Commission.<br />
The current planning and zoning administration function manages the review <strong>of</strong> land use<br />
applications including minor General Plan amendments, rezoning requests, conditional use<br />
permits, <strong>preliminary</strong> and final plats, residential and commercial reviews, variance requests,<br />
group home review, appeals, zoning administrative review and relief requests, commercial tenant<br />
improvements, special events, liquor licenses, business license reviews, group homes and custom<br />
home reviews and geographic information systems and mapping services.<br />
181<br />
Return to TOC
Mission and Performance Measure<br />
Planning<br />
The department has a secondary function which is administration. This function is just as<br />
valuable as the three major functions as it provides service to internal and external customers to<br />
service the community also.<br />
The administration function prepares staff reports for City Council, the Planning Commission,<br />
the Historic Preservation Commission and Board <strong>of</strong> Adjustment workshops and public hearings.<br />
This function also ensures proper advertising and notification processes are complete and in<br />
conformance with state open meeting laws. The administrative support function manages the<br />
departmental <strong>budget</strong> and compliance with the Citizen Participation Ordinance, request for<br />
service (RFS) inquiries and provides staff support for <strong>city</strong> council, the planning commission, the<br />
Historic Preservation Commission and Board <strong>of</strong> Adjustment public workshops and public<br />
hearings.<br />
FISCAL YEAR 20<strong>12</strong><br />
Goal<br />
Related Council Goal<br />
Activities<br />
Expected Outcomes<br />
(Perf. Measures)<br />
Time Commitment<br />
Expected Challenges<br />
Goal<br />
Related Council Goal<br />
Activities<br />
Expected Outcomes<br />
(Perf. Measures)<br />
Time Commitment<br />
GOALS<br />
Maintaining superior customer service to internal and external<br />
customers.<br />
One community with high quality service for citizens.<br />
Staff will need to be flexible and creative in making sound<br />
decisions. Management will need to continue keeping staff<br />
informed <strong>of</strong> managerial decisions that may impact future<br />
decision making.<br />
Maintain customer satisfaction at 90% good, excellent, or<br />
greater.<br />
The expected outcome is an ongoing effort as the department<br />
belief is we are a world class Planning Department.<br />
The goal will continue to be challenging because the<br />
department is operating with limited staff while the work<br />
demand varies day to day.<br />
Modi<strong>fy</strong> planning tools to meet current demands for <strong>city</strong><br />
development.<br />
One community with strong neighborhoods.<br />
• Adopt an updated Zoning Ordinance.<br />
• Implementation <strong>of</strong> the Glendale Centerline initiative.<br />
• Adopt updated commercial and industrial design<br />
expectations.<br />
Adoption <strong>of</strong> these three documents.<br />
Staff will have to commit to the goal on an ongoing basis.<br />
There will need to be research, draft documents reviewed and<br />
182<br />
Return to TOC
Mission and Performance Measure<br />
Planning<br />
Expected Challenges<br />
revised, and conduct neighborhood meetings and the required<br />
public hearings. Staff anticipates that all updates can be<br />
completed within this fiscal year.<br />
Anticipated challenges may include adjustments to the<br />
schedule.<br />
FISCAL YEAR <strong>2011</strong><br />
Area <strong>of</strong> Innovation:<br />
• Innovate process review <strong>of</strong> the Group Home application process.<br />
• The Group Home application process was shortened by reducing the number <strong>of</strong> steps<br />
from 40 to 30, a 25% reduction. Also, by training the Development Services Center<br />
staff to assist with the processing <strong>of</strong> applications, a reduction in the review time went<br />
from 2 to 3 days to only 24 hours.<br />
Accomplishments:<br />
• Adopted a text amendment to enact reasonable zoning regulations to regulate Medical<br />
Marijuana, as permitted by the voter approved Proposition 203.<br />
• Revamped the Historic Preservation Program in a manner that allows it to continue to<br />
be an asset to Glendale. Obtained funding the complete the rehabilitation <strong>of</strong> the Myrtle<br />
Avenue Cultural Gateway.<br />
Goal<br />
Related Council Goal<br />
Was the goal met?<br />
What were the<br />
Performance Measures?<br />
Obstacles/Challenges<br />
Goal<br />
Related Council Goal<br />
Was the goal met?<br />
What were the<br />
Performance Measures?<br />
GOAL UPDATES<br />
Redevelopment <strong>of</strong> the Glendale Centerline.<br />
One community with a vibrant <strong>city</strong> center.<br />
No.<br />
Adoption <strong>of</strong> the Glendale Centerline Overlay District.<br />
Time frame for Glendale Centerline process.<br />
Support the City Council Sustainability Committee.<br />
One community with high quality services for citizens.<br />
Yes.<br />
Increase public understanding <strong>of</strong> Glendale Centerline Overlay, add<br />
additional historic resources to the National Register, and<br />
complete all annexation requests by property owners.<br />
183<br />
Return to TOC
Mission and Performance Measure<br />
Planning<br />
Obstacles/Challenges<br />
None. The time frame for the process was a challenge.<br />
FISCAL YEAR 2010<br />
Area <strong>of</strong> Innovation:<br />
• Provide all development team comments to the applicant prior to the pre-application<br />
meeting.<br />
Accomplishments:<br />
• Prepared the Glendale Centerline Overlay District Ordinance.<br />
• Prepared the Zoning Ordinance Update.<br />
Goal<br />
Related Council Goal<br />
Was the goal met?<br />
What were the<br />
Performance Measures?<br />
Obstacles/Challenges<br />
Goal<br />
Related Council Goal<br />
Was the goal met?<br />
What were the<br />
Performance Measures?<br />
Obstacles/Challenges<br />
GOAL UPDATES<br />
Redevelopment <strong>of</strong> the Glendale Centerline.<br />
One community with a vibrant <strong>city</strong> center.<br />
No.<br />
Adoption <strong>of</strong> the Glendale Centerline Overlay Ordinance.<br />
Timeframe for Glendale Centerline process.<br />
Enhance the General Plan and Historic Preservation by planning<br />
for the future and preserving the past.<br />
One community with a vibrant <strong>city</strong> center.<br />
One community with strong neighborhoods.<br />
Yes.<br />
Increase public understanding <strong>of</strong> Glendale Centerline Overlay, add<br />
additional historic resources to the National Register, and<br />
complete all annexation requests by property owners.<br />
None, except the timeframe.<br />
184<br />
Return to TOC
City <strong>of</strong> Glendale<br />
Budget Summary by Department<br />
Planning<br />
FUND NUMBER /<br />
BUDGET BY PROGRAM<br />
FY 2010<br />
Actual<br />
FY <strong>2011</strong><br />
Budget<br />
FY <strong>2011</strong><br />
Estimate<br />
FY 20<strong>12</strong><br />
Budget<br />
Percent Over<br />
FY <strong>2011</strong> Budget<br />
(1000) Current Planning<br />
$543,780 $5<strong>12</strong>,837 $5<strong>12</strong>,837 $323,844 -37%<br />
(1000) Long-Range Planning & Research $383,846 $135,149 $135,149 $<strong>12</strong>6,988 -6%<br />
(1000) Planning Administration<br />
$350,565 $341,167 $340,167 $323,524 -5%<br />
Total - Planning $1,278,191 $989,153 $988,153 $774,356 -22%<br />
BUDGET BY CATEGORIES<br />
OF EXPENDITURES<br />
FY 2010<br />
Actual<br />
FY <strong>2011</strong><br />
Budget<br />
FY <strong>2011</strong><br />
Estimate<br />
FY 20<strong>12</strong><br />
Budget<br />
Percent Over<br />
FY <strong>2011</strong> Budget<br />
Wages/Salaries/Benefits $1,285,572 $956,780 $956,780 $782,372 -18%<br />
Supplies and Contracts $37,051 $58,336 $57,336 $57,200 -2%<br />
Internal Premiums $17,710 $16,757 $16,757 $<strong>12</strong>,361 -26%<br />
Internal Service Charges $4,544 $4,149 $4,149 $2,694 -35%<br />
Work Order Credits ($66,686) ($46,869) ($46,869) ($80,271) 71%<br />
Total - Planning $1,278,191 $989,153 $988,153 $774,356 -22%<br />
STAFFING BY PROGRAM<br />
FY 2010<br />
Actual<br />
FY <strong>2011</strong><br />
Budget<br />
FY <strong>2011</strong><br />
Estimate<br />
FY 20<strong>12</strong><br />
Budget<br />
Percent Over<br />
FY <strong>2011</strong> Budget<br />
(1000) Current Planning 10<br />
6 4 4 -33%<br />
(1000) Long-Range Planning & Research 4<br />
2 2 2 0%<br />
(1000) Planning Administration 5<br />
3 3 3 0%<br />
Total -Planning 19 11 9 9 -18%<br />
185<br />
Return to TOC
Mission and Performance Measure<br />
Economic Development<br />
ECONOMIC DEVELOPMENT<br />
Brian Friedman<br />
Mission Statement:<br />
The Economic Development Department’s mission is to create high quality jobs, develop<br />
financially sound projects that increase the <strong>city</strong>’s tax base and enhance underperforming<br />
properties to increase the quality <strong>of</strong> life for current businesses and the community.<br />
Department Description:<br />
• The mission <strong>of</strong> the Economic Development Department is to make a positive contribution<br />
to the economic base <strong>of</strong> the <strong>city</strong> by building relationships with the business community to<br />
collaboratively direct business attraction, redevelopment, business retention and<br />
expansion, to meet the goals <strong>of</strong> the City Council and City Management as we continually<br />
work to enhance the quality <strong>of</strong> life for Glendale residents and improve <strong>city</strong> vitality by<br />
facilitating the creation <strong>of</strong> quality jobs.<br />
• The Economic Development Department directs programs to attract and retain businesses<br />
that create quality jobs, increase the tax base, improve land values and enhance <strong>city</strong><br />
vitality.<br />
• The Department works to grow the <strong>city</strong>’s economy and capitalize on Glendale’s success<br />
at building a destination for entertainment, sports and tourism by assisting in the<br />
development <strong>of</strong> quality employment centers that will solidi<strong>fy</strong> Glendale’s economic<br />
position in the Valley.<br />
• The Department coordinates with both internal and external partners to preserve a<br />
business-friendly climate and enhance the quality <strong>of</strong> life for the residents <strong>of</strong> Glendale.<br />
FISCAL YEAR 20<strong>12</strong><br />
Goal<br />
Related Council Goal<br />
Activities<br />
GOALS<br />
Attract targeted industries and businesses to Glendale.<br />
One community with quality economic development.<br />
Business Attraction Program<br />
Working with our partners, the Arizona Commerce Authority<br />
(ACA) and the Greater Phoenix Economic Council (GPEC), as<br />
well as developers and corporate real estate pr<strong>of</strong>essionals, the<br />
Department provides information and hosts site visits detailing<br />
the advantages <strong>of</strong> locating in Glendale to those types <strong>of</strong><br />
industries and companies that are looking for a site for their<br />
operations.<br />
The Department targets the following broad categories <strong>of</strong><br />
industries:<br />
• Advanced business services<br />
186<br />
Return to TOC
Mission and Performance Measure<br />
Economic Development<br />
• Advanced technology<br />
• Financial and insurance<br />
• Engineering and architectural<br />
• Healthcare<br />
• Aviation<br />
• Airpark related industries, including light<br />
manufacturing and distribution<br />
• Sustainable industries<br />
• Entertainment and tourism<br />
The Department approaches the Attraction Program in four<br />
ways:<br />
• Recruitment<br />
The Department targets specific industry clusters that<br />
are a fit with Glendale. We reach out directly to those<br />
industries and send information packets detailing the<br />
advantages <strong>of</strong> locating in Glendale. Potential targets<br />
are determined through a variety <strong>of</strong> rationale including;<br />
but not limited to, analysis, relationships, and growth<br />
industries.<br />
• Relationship Building<br />
Strong relationships bring leads. The Department<br />
continues to increase contact with the development<br />
community, particularly those Arizona developers and<br />
real estate brokers that may not be familiar with the<br />
West Valley and specifically Glendale.<br />
Relationships are also maintained and strengthened<br />
with other departments in <strong>city</strong> government, the<br />
Glendale Chamber <strong>of</strong> Commerce, economic<br />
development organizations throughout the state and<br />
country, and partners such as Glendale Community<br />
College, Arizona State University and Maricopa<br />
Workforce Connections to increase our attractiveness<br />
as an employment center.<br />
• Research and Analysis<br />
The Department maintains the building and land<br />
inventory database listing available buildings <strong>of</strong> at least<br />
10,000 square feet and/or vacant land <strong>of</strong> at least three<br />
acres. This information is available on the Glendale<br />
Prospector posted on our website and also through the<br />
Arizona Prospector website, which is a state-wide list<br />
187<br />
Return to TOC
Mission and Performance Measure<br />
Economic Development<br />
<strong>of</strong> available buildings and sites. This database is<br />
updated regularly so as to have the most current<br />
information about available selected sites that can be<br />
shared with clients looking for sites within Glendale.<br />
The Department also conducts an analysis <strong>of</strong> major projects to<br />
ensure that each project is financially sound and enhances the<br />
<strong>city</strong>’s tax base.<br />
Expected Outcomes<br />
(Perf. Measures)<br />
Time Commitment<br />
Expected Challenges<br />
Goal<br />
Related Council Goal<br />
Activities<br />
• Marketing and Promotion to “C” Level Executives and<br />
Site Selectors<br />
The Department takes advantage <strong>of</strong> unique sporting<br />
and cultural opportunities as they may occur to market<br />
Glendale as a great place to locate a business.<br />
The Department researches and identifies specific<br />
companies to contact and take advantage <strong>of</strong> the<br />
publi<strong>city</strong> garnered by these events.<br />
The Department will locate 5 companies and create 500 jobs.<br />
This is an on-going effort. Attracting industry to Glendale<br />
creates new jobs, increases revenue to the <strong>city</strong> and improves<br />
the quality <strong>of</strong> life for <strong>city</strong> residents.<br />
The continued national economic downturn has limited the<br />
number <strong>of</strong> companies looking to expand or relocate.<br />
Assist existing Glendale businesses through a proactive<br />
Business Retention and Expansion program.<br />
One community with quality economic development.<br />
• Business Retention and Expansion<br />
The Department has partnered with the Glendale<br />
Chamber <strong>of</strong> Commerce, Glendale Community College<br />
and ASU West to initiate a customized program to<br />
contact specific employers in the <strong>city</strong> for the purpose <strong>of</strong><br />
developing relationships, identi<strong>fy</strong>ing issues related to<br />
doing business in Glendale, discussing potential plans<br />
for expansion within the <strong>city</strong>, and providing additional<br />
resources necessary for a pr<strong>of</strong>itable venture.<br />
Specifically, the Department will continue to:<br />
• Contact a wide variety <strong>of</strong> employers in Glendale<br />
• Develop a survey to gather consistent information to<br />
identi<strong>fy</strong> specific trends or patterns<br />
• Arrange to meet with local executives to determine if<br />
issues exist or programs can be <strong>of</strong>fered to assist in<br />
making the company even more successful.<br />
188<br />
Return to TOC
Mission and Performance Measure<br />
Economic Development<br />
Expected Outcomes<br />
(Perf. Measures)<br />
Time Commitment<br />
Expected Challenges<br />
Reach out to 30 existing Glendale businesses.<br />
This is an on-going program and one <strong>of</strong> the more important<br />
department programs.<br />
The continued economic downturn has caused many<br />
companies to put potential expansion programs on hold until<br />
the economy shows a sustained recovery.<br />
FISCAL YEAR <strong>2011</strong><br />
Area <strong>of</strong> Innovation:<br />
• Department staff has been actively involved in the Innovate program resulting in the<br />
creation <strong>of</strong> new and innovative revenue sources.<br />
• The department participated in the evaluation <strong>of</strong> the Low Income Housing Tax Credit<br />
program with Community Partnerships and the Planning department.<br />
Accomplishments:<br />
• Located five new companies and assisted in the retention or expansion <strong>of</strong> seven<br />
existing companies resulting in the creation <strong>of</strong> 1,450 jobs so far this fiscal year.<br />
• Working with the Broker community, the Department has assisted in the absorption <strong>of</strong><br />
954,976 square feet <strong>of</strong> <strong>of</strong>fice and industrial space so far this fiscal year.<br />
Goal<br />
Related Council Goal<br />
Was the goal met?<br />
What were the<br />
Performance Measures?<br />
Obstacles/Challenges<br />
Goal<br />
Related Council Goal<br />
Was the goal met?<br />
What were the<br />
Performance Measures?<br />
Obstacles/Challenges<br />
GOAL UPDATES<br />
Attract targeted industries and businesses to Glendale.<br />
One community with quality economic development.<br />
Yes.<br />
Creation <strong>of</strong> 500 jobs.<br />
A sluggish economy has curtailed some new site location<br />
decisions.<br />
Continue with our proactive business retention and expansion<br />
program, while utilizing relationships with educational<br />
institutions.<br />
One community with quality economic development.<br />
Yes. Six companies have expanded resulting in the creation <strong>of</strong> 852<br />
jobs for Glendale residents.<br />
Reach out to 30 existing Glendale companies.<br />
The continuing recovery has slowed some expansions.<br />
189<br />
Return to TOC
Mission and Performance Measure<br />
Economic Development<br />
FISCAL YEAR 2010<br />
Area <strong>of</strong> Innovation:<br />
• Participation <strong>of</strong> staff on the Innovate Committee has resulted in a plan to lease space to<br />
cellular phone providers for the placement <strong>of</strong> cell towers to generate additional revenue<br />
for the <strong>city</strong>.<br />
Accomplishments:<br />
• Attracting Humana Healthcare to the <strong>city</strong> resulted in a fully leased <strong>of</strong>fice building at 91<br />
Glendale containing more than 630 new <strong>of</strong>fices and workstations.<br />
• Locating DeVry University’s new West Valley campus with 500 students and 80<br />
faculty enhances Glendale dominance as the <strong>city</strong> <strong>of</strong> choice for quality educational<br />
facilities.<br />
• Conair’s purchase <strong>of</strong> the former KB Toys building was the largest industrial purchase<br />
in the Valley in the past 18 months and adds 350 new jobs to Glendale.<br />
More than 390 additional jobs were retained or created as part <strong>of</strong> business expansion in<br />
Glendale; a direct result <strong>of</strong> the department’s established relationships in the business<br />
community.<br />
Goal<br />
Related Council Goal<br />
Was the goal met?<br />
What were the<br />
Performance Measures?<br />
Obstacles/Challenges<br />
Goal<br />
Related Council Goal<br />
Was the goal met?<br />
GOAL UPDATES<br />
Attract new industrial and <strong>of</strong>fice businesses to Glendale.<br />
One community with quality economic development.<br />
Yes; <strong>12</strong> businesses opened <strong>of</strong>fices or facilities in Glendale during<br />
FY 2010.<br />
The department’s aggressive approach in attracting new business<br />
to Glendale has resulted in the creation <strong>of</strong> 1,298 jobs. Conair’s<br />
expansion was the largest in the Phoenix metropolitan statistical<br />
area in calendar year 2009.<br />
Economic recession has discouraged businesses from making<br />
major moves or expansions. Glendale has made significant<br />
progress towards its economic development goals despite the<br />
current economic conditions.<br />
Implement a comprehensive proactive business retention and<br />
expansion program.<br />
One community with quality economic development.<br />
Yes; the department met its goal by providing networking and<br />
training opportunities for businesses visited and has resolved<br />
numerous requests by our valued local businesses.<br />
190<br />
Return to TOC
Mission and Performance Measure<br />
Economic Development<br />
What were the<br />
Performance Measures?<br />
Obstacles/Challenges<br />
An additional 30 businesses have been visited as a part <strong>of</strong> the<br />
business retention and expansion program.<br />
Reduced staffing and cutbacks at various companies has impacted<br />
availability for representatives to meet with the department.<br />
Flexibility and persistent, courteous contact by the department has<br />
overcome scheduling conflicts.<br />
191<br />
Return to TOC
City <strong>of</strong> Glendale<br />
Budget Summary by Department<br />
Economic Development<br />
FUND NUMBER /<br />
BUDGET BY PROGRAM<br />
FY 2010<br />
Actual<br />
FY <strong>2011</strong><br />
Budget<br />
FY <strong>2011</strong><br />
Estimate<br />
FY 20<strong>12</strong><br />
Budget<br />
Percent Over<br />
FY <strong>2011</strong> Budget<br />
(1000) Business Development<br />
$0 $500,000 $3,000,000 $500,000 0%<br />
(1000) Downtown Beaut. & Promotion<br />
$239,693 $266,453 $266,453 $242,095 -9%<br />
(1000) Economic Development<br />
$741,568 $630,068 $711,613 $626,736 -1%<br />
(<strong>12</strong>80) YSC - Econ. Dev.<br />
$20,898 $0 $0 $0 NA<br />
Total - Economic Development $1,002,159 $1,396,521 $3,978,066 $1,368,831 -2%<br />
BUDGET BY CATEGORIES<br />
OF EXPENDITURES<br />
FY 2010<br />
Actual<br />
FY <strong>2011</strong><br />
Budget<br />
FY <strong>2011</strong><br />
Estimate<br />
FY 20<strong>12</strong><br />
Budget<br />
Percent Over<br />
FY <strong>2011</strong> Budget<br />
Wages/Salaries/Benefits $724,537 $729,700 $729,700 $753,310 3%<br />
Supplies and Contracts $256,589 $685,171 $3,266,716 $663,777 -3%<br />
Internal Premiums $13,419 $<strong>12</strong>,176 $<strong>12</strong>,176 $11,354 -7%<br />
Internal Service Charges $7,614 $7,488 $7,488 $7,194 -4%<br />
Work Order Credits ($38,014) ($38,014) ($66,804) 76%<br />
Total - Economic Development $1,002,159 $1,396,521 $3,978,066 $1,368,831 -2%<br />
STAFFING BY PROGRAM<br />
FY 2010<br />
Actual<br />
FY <strong>2011</strong><br />
Budget<br />
FY <strong>2011</strong><br />
Estimate<br />
FY 20<strong>12</strong><br />
Budget<br />
Percent Over<br />
FY <strong>2011</strong> Budget<br />
(1000) Downtown Beaut. & Promotion 4<br />
4 4 4 0%<br />
(1000) Economic Development 6<br />
5 5 5 0%<br />
Total -Economic Development 10 9 9 9 0%<br />
192<br />
Return to TOC
City <strong>of</strong> Glendale<br />
Budget Summary by Department<br />
Rebates & Incentives<br />
FUND NUMBER /<br />
BUDGET BY PROGRAM<br />
FY 2010<br />
Actual<br />
FY <strong>2011</strong><br />
Budget<br />
FY <strong>2011</strong><br />
Estimate<br />
FY 20<strong>12</strong><br />
Budget<br />
Percent Over<br />
FY <strong>2011</strong> Budget<br />
(1000) Rebates & Incentives<br />
$475,555 $320,000 $50,000 $100,000 -69%<br />
(1000) Redevelopment Land Acquisition<br />
$23,000 $85,416 $2,871 $0 -100%<br />
Total - Rebates & Incentives $498,555 $405,416 $52,871 $100,000 -75%<br />
BUDGET BY CATEGORIES<br />
OF EXPENDITURES<br />
FY 2010<br />
Actual<br />
FY <strong>2011</strong><br />
Budget<br />
FY <strong>2011</strong><br />
Estimate<br />
FY 20<strong>12</strong><br />
Budget<br />
Percent Over<br />
FY <strong>2011</strong> Budget<br />
Supplies and Contracts $498,555 $405,416 $52,871 $100,000 -75%<br />
Total - Rebates & Incentives $498,555 $405,416 $52,871 $100,000 -75%<br />
193<br />
Return to TOC
Mission and Performance Measure<br />
Human Resources & Risk Management<br />
HUMAN RESOURCES & RISK MANAGEMENT<br />
Alma Carmicle<br />
Mission Statement:<br />
Collaborate and partner with our internal and external customers to develop a diverse workforce<br />
committed to delivering the highest quality <strong>of</strong> service.<br />
Department Description:<br />
The Glendale Human Resources Department provides proactive, innovative and quality customer<br />
service and consultation in the areas <strong>of</strong> total compensation, organizational development,<br />
employee relations, staffing and risk management and safety.<br />
FISCAL YEAR 20<strong>12</strong><br />
Goal<br />
Related Council Goal<br />
Activities<br />
Expected Outcomes<br />
(Perf. Measures)<br />
Time Commitment<br />
Expected Challenges<br />
Goal<br />
Related Council Goal<br />
Activities<br />
Expected Outcomes<br />
(Perf. Measures)<br />
GOALS<br />
Implement online applicant system to improve the applicant<br />
experience when applying for a <strong>city</strong> position and to improve internal<br />
application processing.<br />
One community with high quality services for citizens.<br />
Research and evaluate potential online applicant systems that can be<br />
integrated with the HRMS.<br />
Implement an online applicant system by June 20<strong>12</strong>.<br />
It is estimated the process will require staffing resources from IT and<br />
HR. The research, evaluation and implementation will take 10<br />
months.<br />
Coordination and implementation <strong>of</strong> the web-based application<br />
process.<br />
Expand On-line Training to include mandatory Anti-Harassment<br />
training.<br />
One Community that is fiscally sound.<br />
Develop Anti-Harassment training materials for <strong>city</strong> employees to be<br />
accessed from the employee’s work station.<br />
All <strong>city</strong> employees will be able to take the mandatory antiharassment<br />
training for FY <strong>2011</strong>/<strong>12</strong> by March 20<strong>12</strong>. The on-line<br />
training will minimize workplace disruption by allowing staff to take<br />
the training from their workstations when it best fits their work<br />
schedule.<br />
194<br />
Return to TOC
Mission and Performance Measure<br />
Human Resources & Risk Management<br />
Time Commitment<br />
Expected Challenges<br />
Estimate it will take 3 months to develop the online anti-harassment<br />
training materials. Employees will be given two (2) months to<br />
complete the training.<br />
Resource availability to develop the online materials.<br />
Goal<br />
Related Council Goal<br />
Activities<br />
Expected Outcomes<br />
(Perf. Measures)<br />
Time Commitment<br />
Expected Challenges<br />
Improve the health <strong>of</strong> <strong>city</strong>’s health plan participants and reduce<br />
healthcare costs by <strong>of</strong>fering health education and wellness activities<br />
that support positive lifestyle changes.<br />
One Community that is fiscally sound.<br />
Provide convenient, on-site, health education programs conducted by<br />
health care pr<strong>of</strong>essionals with experience in treating and preventing<br />
the chronic health conditions prevalent in the City’s health plan<br />
participants.<br />
Improve the health <strong>of</strong> participants in the <strong>city</strong>’s health plan and reduce<br />
healthcare costs by increasing participation level to at least 50% <strong>of</strong><br />
employee population and extending wellness activities to retirees and<br />
dependents.<br />
Between July 1 and the April 20<strong>12</strong> Wellness Fairs (where we can<br />
measure the outcome <strong>of</strong> our activities by improved health risk<br />
assessment scores.)<br />
Support from managers and supervisors to enable staff to participate<br />
in these programs given the staffing challenges caused by a reduced<br />
workforce. Resistance from employees/retirees in participating in<br />
improving their own well-being unless they are provided with a<br />
significant financial incentive.<br />
FISCAL YEAR <strong>2011</strong><br />
Area <strong>of</strong> Innovation:<br />
• Successfully implemented online training for mandatory Ethics Training for all <strong>city</strong><br />
employees. All <strong>city</strong> staff completed the online training. The greatest benefit was the<br />
ability <strong>of</strong> staff to complete the training as time permitted rather than attending<br />
scheduled sessions.<br />
• Implemented a Wellness Brown Bag series for employees and retirees. This 6-part<br />
series focused on the importance <strong>of</strong> nutrition to improve overall health. Employees<br />
and retirees attended these sessions. Outside presenters <strong>of</strong>fered their insights on<br />
developing healthy living styles that incorporate good nutrition habits. Participants<br />
have requested more on-site wellness-focused sessions.<br />
• Implemented a Financial Planning Series in partnership with ICMA-RC. The<br />
195<br />
Return to TOC
Mission and Performance Measure<br />
Human Resources & Risk Management<br />
workshops focused on educating employees on their financial wellness and preparing<br />
for the future. Workshops were held each month and the expertise <strong>of</strong> certified<br />
financial planners and retirement plan specialists were shared with employees on the<br />
topics <strong>of</strong> smart saving, managing credit and debt, strategies to save for retirement,<br />
retirement accounts, women’s financial health, and estate planning. Feedback from<br />
participants has been very positive and participants have shared additional topics for<br />
future sessions. The program will continue next fiscal year with additional topics.<br />
• Implemented a Higher Education Series in partnership with several local colleges and<br />
universities. At these lunch hour sessions, University staff shared their expertise, tools<br />
and tips with employees who are deciding to return to school or are currently finishing<br />
a program. Topic areas included finding scholarships and grants, advancing career<br />
goals through higher education, overcoming emotional barriers <strong>of</strong> returning to school,<br />
and time management. Many participants shared they have renewed their commitment<br />
to higher education by beginning a new program or have since found scholarships to<br />
assist with current enrollment through the help <strong>of</strong> these sessions. The program will run<br />
again in the next fiscal year with additional topics and school partnerships.<br />
Accomplishments:<br />
• The <strong>city</strong> received Mature Worker Friendly Certification by the Governor's Advisory<br />
Council on Aging and the Arizona Department <strong>of</strong> Commerce. The Mature Worker<br />
Friendly Employer Certification provides special recognition to employers that commit<br />
to creating a workplace environment that values experience and skills that mature<br />
workers exhibit, and also assists employers in attracting and retaining those mature<br />
workers. The Mature Worker Friendly certification complements Glendale’s<br />
recognition by AARP as one <strong>of</strong> fifty Best Employers for Workers Over 50 nationally.<br />
Glendale was the only municipality in the nation and the only organization in Arizona<br />
to win the AARP award.<br />
• Conducted Basic Computer Skills training for <strong>city</strong> staff. Approximately 75 employees<br />
attended one <strong>of</strong> the four half-day sessions to become familiar with the <strong>city</strong>’s<br />
technology and technology-related policies. Participants found the sessions to be<br />
beneficial. Future sessions are being planned.<br />
• The cost <strong>of</strong> the <strong>city</strong>’s risk in FY10/11 was 1.06%, well below the public entity industry<br />
average <strong>of</strong> 2.0% . The Risk Management Division continues to provide safety training<br />
and education opportunities for management, supervisors and employees. These<br />
sessions help keep managers, supervisors and employees mindful <strong>of</strong> safety as they<br />
perform their work.<br />
• Conducted a Request for Proposal (RFP) for the dental and vision benefits provided to<br />
employees and retirees that resulted in significant rate reductions and enhanced<br />
benefits. The rate reductions included: a 5% reduction for the PPO dental plan; a 15%<br />
reduction for the employee rate for the HMO-type dental plan and a 11.4% reduction to<br />
the vision plan. The negotiations included maintaining the reduced rates for multiple<br />
years.<br />
196<br />
Return to TOC
Mission and Performance Measure<br />
Human Resources & Risk Management<br />
Goal<br />
Related Council Goal<br />
Was the goal met?<br />
What were the Performance<br />
Measures?<br />
Obstacles/Challenges<br />
Goal<br />
Related Council Goal<br />
Was the goal met?<br />
What were the Performance<br />
Measures?<br />
Obstacles/Challenges<br />
GOAL UPDATES<br />
Research the cost and implementation requirements <strong>of</strong><br />
outsourcing the administration <strong>of</strong> the <strong>city</strong>’s benefits<br />
program for active employees and retirees to determine<br />
feasibility.<br />
One community that is fiscally sound.<br />
Yes. The <strong>city</strong> has contracted with a 3rd party to begin<br />
administering the <strong>city</strong>’s benefits program for retirees<br />
effective July <strong>2011</strong>.<br />
The department will save about 20 hours/month by not<br />
processing payments, allowing more time on core business<br />
processes.<br />
Effectively communicating the changes to retirees.<br />
Review jobs and work closely with departments to ensure<br />
internal staffing meets the needs <strong>of</strong> the new <strong>city</strong> structure.<br />
One community with high quality services for citizens.<br />
Yes. A <strong>city</strong>wide reorganization was completed in March<br />
<strong>2011</strong>.<br />
The ability <strong>of</strong> departments to continue to meet service<br />
needs through appropriate job alignment and staff<br />
placement<br />
Communicating and managing the change organizationally.<br />
FISCAL YEAR 2010<br />
Area <strong>of</strong> Innovation:<br />
• Successful implementation <strong>of</strong> the <strong>city</strong>’s first benefits dependant eligibility audit. This<br />
innovation involved an audit <strong>of</strong> all dependants enrolled in the <strong>city</strong>’s health plans to<br />
determine eligibility for coverage. This will result in significant, ongoing cost savings<br />
to the <strong>city</strong> and enable the <strong>city</strong> to meet its fiduciary obligations as a health plan<br />
administrator.<br />
• Successful implementation <strong>of</strong> e-Pr<strong>of</strong>ile, a systems improvement that reduces<br />
administrative efforts in the review and updating <strong>of</strong> employee pr<strong>of</strong>ile data and<br />
improves the quality <strong>of</strong> data as employees can now easily view their pr<strong>of</strong>ile<br />
information and update accordingly.<br />
197<br />
Return to TOC
Mission and Performance Measure<br />
Human Resources & Risk Management<br />
Accomplishments:<br />
• Successful development and implementation <strong>of</strong> the <strong>city</strong>’s employee furlough process.<br />
• A “Brown Bag Series for Supervisors” was established by the Human Resources<br />
Department designed to provide supervisors with a refresher on human resources<br />
policies and practices, and how to apply them in the everyday management <strong>of</strong> their<br />
work groups.<br />
• The cost <strong>of</strong> the <strong>city</strong>’s risk in 2010 was 1.19% which was once again well below the<br />
public entity industry average <strong>of</strong> 2.0% .<br />
Goal<br />
Related Council Goal<br />
Was the goal met?<br />
What were the<br />
Performance Measures?<br />
Obstacles/Challenges<br />
Goal<br />
Related Council Goal<br />
Was the goal met?<br />
What were the<br />
Performance Measures?<br />
Obstacles/Challenges<br />
GOAL UPDATES<br />
Implement the PeopleS<strong>of</strong>t talent acquisition manager and<br />
candidate gateway program.<br />
One community with high quality services for citizens.<br />
No, due to the <strong>city</strong>’s <strong>budget</strong> reduction the technology allowing us<br />
to complete this goal was eliminated.<br />
Implementation <strong>of</strong> the program by June 2010.<br />
Budget reductions to both the IT and the HR departments.<br />
Offer employees mentoring opportunities to develop internal<br />
talent and to enhance the sharing <strong>of</strong> organizational knowledge.<br />
One community that is fiscally sound.<br />
This goal was met through the completion <strong>of</strong> the pilot program<br />
that ran September 2009 to March 2010. Employees from the<br />
Administrative Services Group participated and shared feedback<br />
throughout the program as to their progress and challenges. Each<br />
participant noted pr<strong>of</strong>essional growth and meaningful application<br />
<strong>of</strong> new knowledge and relationships to the workplace.<br />
Completed a six month pilot program with Administrative<br />
Services staff by March 2010 and compiled feedback to enhance<br />
the program for <strong>city</strong>wide rollout.<br />
Feedback from mentees and mentors identified time and current<br />
workload as the major challenges they encountered in<br />
participating and completing their development action plans.<br />
198<br />
Return to TOC
City <strong>of</strong> Glendale<br />
Budget Summary by Department<br />
Human Resources<br />
FUND NUMBER /<br />
BUDGET BY PROGRAM<br />
FY 2010<br />
Actual<br />
FY <strong>2011</strong><br />
Budget<br />
FY <strong>2011</strong><br />
Estimate<br />
FY 20<strong>12</strong><br />
Budget<br />
Percent Over<br />
FY <strong>2011</strong> Budget<br />
(1000) Benefits<br />
$157,462 $119,411 $119,411 $144,941 21%<br />
(1000) Compensation<br />
$458,703 $459,828 $459,828 $374,781 -18%<br />
(1000) Employee Relations<br />
$187,638 $176,717 $176,717 $166,386 -6%<br />
(1000) Employment Services<br />
$364,411 $254,417 $254,417 $315,455 24%<br />
(1000) Human Resources Administration<br />
$669,751 $631,007 $630,007 $563,541 -11%<br />
(1000) Organizational Development<br />
$317,580 $68,291 $68,291 $259,189 280%<br />
(1000) Risk Management/Safety<br />
$569,743 $202,525 $202,525 $<strong>12</strong>1,547 -40%<br />
(2540) Risk Mgmt Trust Fund<br />
$2,569,174 $2,844,278 $2,844,278 $3,068,438 8%<br />
(2560) Worker's Compensation<br />
$1,249,428 $1,407,000 $1,407,000 $1,407,000 0%<br />
(2580) Benefit Programs<br />
$22,954,668 $24,481,185 $23,111,564 $23,117,869 -6%<br />
Total - Human Resources $29,498,558 $30,644,659 $29,274,038 $29,539,147 -4%<br />
BUDGET BY CATEGORIES<br />
OF EXPENDITURES<br />
FY 2010<br />
Actual<br />
FY <strong>2011</strong><br />
Budget<br />
FY <strong>2011</strong><br />
Estimate<br />
FY 20<strong>12</strong><br />
Budget<br />
Percent Over<br />
FY <strong>2011</strong> Budget<br />
Wages/Salaries/Benefits $2,477,4<strong>12</strong> $2,033,844 $2,033,844 $2,303,058 13%<br />
Supplies and Contracts $26,970,400 $28,758,325 $27,387,704 $27,398,179 -5%<br />
Internal Premiums $39,715 $33,507 $33,507 $24,847 -26%<br />
Internal Service Charges $11,031 $13,173 $13,173 $11,180 -15%<br />
Work Order Credits ($194,190) ($194,190) ($198,117) 2%<br />
Total - Human Resources $29,498,558 $30,644,659 $29,274,038 $29,539,147 -4%<br />
STAFFING BY PROGRAM<br />
FY 2010<br />
Actual<br />
FY <strong>2011</strong><br />
Budget<br />
FY <strong>2011</strong><br />
Estimate<br />
FY 20<strong>12</strong><br />
Budget<br />
Percent Over<br />
FY <strong>2011</strong> Budget<br />
(1000) Benefits 2.75<br />
1.25 2 2 60%<br />
(1000) Compensation 5.5<br />
6 4.75 4.75 -21%<br />
(1000) Employee Relations 2.75<br />
2 2 2 0%<br />
(1000) Employment Services 4<br />
3 4 4 33%<br />
(1000) Human Resources Administration 6<br />
5 5 5 0%<br />
(1000) Organizational Development 3<br />
1 3 3 200%<br />
(1000) Risk Management/Safety 6<br />
2 1 1 -50%<br />
(2540) Risk Mgmt Trust Fund 1 3.75 3.75 275%<br />
Total -Human Resources 30 21.25 25.5 25.5 20%<br />
199<br />
Return to TOC
City <strong>of</strong> Glendale<br />
Budget Summary by Department<br />
Employee Groups<br />
FUND NUMBER /<br />
BUDGET BY PROGRAM<br />
FY 2010<br />
Actual<br />
FY <strong>2011</strong><br />
Budget<br />
FY <strong>2011</strong><br />
Estimate<br />
FY 20<strong>12</strong><br />
Budget<br />
Percent Over<br />
FY <strong>2011</strong> Budget<br />
(1190) Diversity Committee<br />
$48,957 $54,909 $40,559 $54,000 -2%<br />
(1190) GEMS<br />
$29,091 $0 $0 $0 NA<br />
(1190) Glendale Hispanic Network<br />
$167 $0 $14,350 $0 NA<br />
(1190) Holiday Event<br />
$0 $30,000 $0 $30,000 0%<br />
Total - Employee Groups $78,215 $84,909 $54,909 $84,000 -1%<br />
BUDGET BY CATEGORIES<br />
OF EXPENDITURES<br />
FY 2010<br />
Actual<br />
FY <strong>2011</strong><br />
Budget<br />
FY <strong>2011</strong><br />
Estimate<br />
FY 20<strong>12</strong><br />
Budget<br />
Percent Over<br />
FY <strong>2011</strong> Budget<br />
Supplies and Contracts $78,215 $84,909 $54,909 $84,000 -1%<br />
Total - Employee Groups $78,215 $84,909 $54,909 $84,000 -1%<br />
200<br />
Return to TOC
Mission and Performance Measure<br />
Intergovernmental Programs<br />
INTERGOVERNMENTAL PROGRAMS<br />
Brent Stoddard<br />
Mission Statement:<br />
The mission <strong>of</strong> the Intergovernmental Programs Department is to develop, represent and<br />
advocate the <strong>city</strong>’s legislative policy decisions by consistently and effectively interacting with<br />
other governmental and non-governmental entities.<br />
Department Description:<br />
The Intergovernmental Programs Department (IGP) coordinates the <strong>city</strong>’s dealings with federal,<br />
state and other local governments and fosters constructive links between the <strong>city</strong> and these<br />
entities. The IGP Department keeps the Mayor and Council informed about intergovernmental<br />
issues and <strong>of</strong>ten represents the <strong>city</strong>’s interests in these matters. In addition, IGP handles special<br />
projects as assigned by the Mayor, Council and City Management.<br />
FISCAL YEAR 20<strong>12</strong><br />
Goal<br />
Related Council Goal<br />
Activities<br />
Expected Outcomes<br />
(Perf. Measures)<br />
Time Commitment<br />
Expected Challenges<br />
Goal<br />
Related Council Goal<br />
Activities<br />
GOALS<br />
Successfully advocate the <strong>city</strong>'s position on issues at the<br />
Arizona Legislature, United States Congress and other<br />
governmental bodies.<br />
One Community with High Quality Services for Citizens.<br />
Work with Legislators, the Governor's <strong>of</strong>fice, Board <strong>of</strong><br />
Supervisors, Congressman, other elected <strong>of</strong>ficials and local<br />
and regional decision making bodies to advocate for and<br />
against issues which impact Glendale residents.<br />
Successful implementation <strong>of</strong> the City’s legislative agenda.<br />
The time commitment for this goal is ongoing.<br />
Large State and Federal <strong>budget</strong> deficits.<br />
Identi<strong>fy</strong> opportunities through the state and regional<br />
transportation agencies to keep on schedule or to accelerate<br />
the design and construction <strong>of</strong> transportation facilities and<br />
services critical to Glendale.<br />
One community with High Quality Services for Citizens.<br />
Actively work with Glendale, state and regional agency staff<br />
to ensure that the funding committed for Glendale projects<br />
continues. Look for creative strategies to secure funding to<br />
accelerate projects and services as appropriate.<br />
201<br />
Return to TOC
Mission and Performance Measure<br />
Intergovernmental Programs<br />
Expected Outcomes<br />
(Perf. Measures)<br />
Time Commitment<br />
Expected Challenges<br />
Reducing Glendale’s financial commitment to projects and<br />
moving forward additional projects currently delayed.<br />
The time commitment for this goal is ongoing.<br />
Large Prop 400 funding deficits.<br />
FISCAL YEAR <strong>2011</strong><br />
Area <strong>of</strong> Innovation:<br />
• Reduced the subscription level for the legislative tracking database saving over $1,000.<br />
• Instituted policy <strong>of</strong> double sided printing for large legislative bills, reducing paper<br />
usage significantly.<br />
Accomplishments:<br />
• Successful in getting annexation legislation passed by the state legislature to protect the<br />
City <strong>of</strong> Glendale.<br />
• Successful in getting MAG to approve funding for the Northern Traffic Interchange<br />
saving Glendale approximately $10 million and increasing the Loop 101 HOV lane<br />
<strong>budget</strong> by $9 million to accommodate future construction <strong>of</strong> HOV ramps at Maryland<br />
Avenue.<br />
• Secured a $150,000 public safety grant from the Governor’s Public Safety Stabilization<br />
Program (ARRA funding).<br />
• Successfully negotiated new RPTA TLCP Policies that were most beneficial to<br />
Glendale totaling $37 million in services.<br />
Goal<br />
Related Council Goal<br />
Was the goal met?<br />
What were the<br />
Performance Measures?<br />
Obstacles/Challenges<br />
GOAL UPDATES<br />
Successfully advocate the <strong>city</strong>'s position on issues at the Arizona<br />
Legislature, United States Congress and other governmental<br />
bodies.<br />
One community with high quality services for citizens<br />
Yes.<br />
We were successful in getting annexation legislation passed by the<br />
state legislature to protect the City <strong>of</strong> Glendale. We successfully<br />
stopped many bills that would have had devastating financial<br />
impacts on Glendale. We were successful in protecting the state<br />
shared revenue streams from the <strong>budget</strong> cuts at the legislature.<br />
The legislature introduced an overwhelming amount <strong>of</strong> anti-<strong>city</strong><br />
legislation.<br />
202<br />
Return to TOC
Mission and Performance Measure<br />
Intergovernmental Programs<br />
Goal<br />
Related Council Goal<br />
Was the goal met?<br />
What were the<br />
Performance Measures?<br />
Obstacles/Challenges<br />
Increase federal issues the IGP Department becomes involved<br />
with and is actively engaged in at the federal level.<br />
One community with high quality services for citizens.<br />
Yes.<br />
Contacted and met with all <strong>of</strong> the Congressional <strong>of</strong>fices in the<br />
greater metropolitan area. Advocated for Glendale’s priorities,<br />
resulting in the introduction <strong>of</strong> Federal legislation to assist<br />
Glendale.<br />
The Congress put a one-year moratorium on earmarks and nondiscretionary<br />
spending.<br />
FISCAL YEAR 2010<br />
Area <strong>of</strong> Innovation:<br />
• The department continued the process <strong>of</strong> assigning a key liaison for each department<br />
practice that has provided for more thorough and responsive engagement on issues <strong>of</strong><br />
potential impact to the <strong>city</strong>.<br />
• The department is cross training all liaisons in each <strong>of</strong> the department functions to<br />
provide seamless customer support to internal and external customers.<br />
• The department has transitioned to electronic review <strong>of</strong> legislation preventing the<br />
printing <strong>of</strong> over 1,300 bills that would have totaled several thousand pages.<br />
Accomplishments:<br />
• The department was successful in bringing in over $1 million in federal appropriations<br />
to the <strong>city</strong> which advanced several capital projects such as maintaining <strong>city</strong><br />
infrastructure.<br />
• The department was successful in assisting the Grants Division obtain over $18 million<br />
in federal American Recovery and Reinvestment Act stimulus funding.<br />
Goal<br />
Related Council Goal<br />
Was the goal met?<br />
What were the<br />
Performance Measures?<br />
GOAL UPDATES<br />
Successfully advocate the <strong>city</strong>'s position on issues at the<br />
legislature, congress and other governmental bodies.<br />
One community with high quality services for citizens.<br />
Yes.<br />
Protecting the core state shared revenue streams at the 15%<br />
distribution level even in the midst <strong>of</strong> a $3.7 billion statewide<br />
<strong>budget</strong> deficit.<br />
203<br />
Return to TOC
Mission and Performance Measure<br />
Intergovernmental Programs<br />
Obstacles/Challenges<br />
Goal<br />
Related Council Goal<br />
Was the goal met?<br />
What were the<br />
Performance Measures?<br />
Obstacles/Challenges<br />
The Arizona State Legislature swept the lottery money in LTAF to<br />
assist in their <strong>budget</strong> deficit. Staff is working to get the program<br />
and funding restored.<br />
Educate Glendale residents on the legislative process and<br />
encourage their active involvement on issues <strong>of</strong> importance to the<br />
<strong>city</strong>.<br />
One community with high quality services for citizens.<br />
Yes, a two session Neighborhood Legislative Link Program was<br />
implemented.<br />
Positive feedback from residents on the implementation <strong>of</strong> the<br />
program.<br />
Some sessions were eliminated due to ongoing <strong>budget</strong> reductions.<br />
204<br />
Return to TOC
City <strong>of</strong> Glendale<br />
Budget Summary by Department<br />
Intergovt. Programs<br />
FUND NUMBER /<br />
BUDGET BY PROGRAM<br />
FY 2010<br />
Actual<br />
FY <strong>2011</strong><br />
Budget<br />
FY <strong>2011</strong><br />
Estimate<br />
FY 20<strong>12</strong><br />
Budget<br />
Percent Over<br />
FY <strong>2011</strong> Budget<br />
(1000) Intergovernmental Programs<br />
$710,731 $721,549 $721,549 $686,721 -5%<br />
Total - Intergovt. Programs $710,731 $721,549 $721,549 $686,721 -5%<br />
BUDGET BY CATEGORIES<br />
OF EXPENDITURES<br />
FY 2010<br />
Actual<br />
FY <strong>2011</strong><br />
Budget<br />
FY <strong>2011</strong><br />
Estimate<br />
FY 20<strong>12</strong><br />
Budget<br />
Percent Over<br />
FY <strong>2011</strong> Budget<br />
Wages/Salaries/Benefits $385,594 $426,547 $426,547 $427,410 0%<br />
Supplies and Contracts $319,861 $3<strong>12</strong>,595 $3<strong>12</strong>,595 $296,926 -5%<br />
Internal Premiums $4,082 $3,723 $3,723 $4,533 22%<br />
Internal Service Charges $1,194 $1,266 $1,266 $1,171 -8%<br />
Work Order Credits ($22,582) ($22,582) ($43,319) 92%<br />
Total - Intergovt. Programs $710,731 $721,549 $721,549 $686,721 -5%<br />
STAFFING BY PROGRAM<br />
FY 2010<br />
Actual<br />
FY <strong>2011</strong><br />
Budget<br />
FY <strong>2011</strong><br />
Estimate<br />
FY 20<strong>12</strong><br />
Budget<br />
Percent Over<br />
FY <strong>2011</strong> Budget<br />
(1000) Intergovernmental Programs 4<br />
4 4 4 0%<br />
Total -Intergovt. Programs 4 4 4 4 0%<br />
205<br />
Return to TOC
Mission and Performance Measure<br />
Leisure & Cultural Services<br />
Library & Arts<br />
Leisure & Cultural<br />
Services<br />
Parks &<br />
Recreation<br />
LEISURE & CULTURAL SERVICES<br />
Erik Strunk Interim Director<br />
Mission Statement:<br />
The mission <strong>of</strong> the Parks, Recreation and Library Services Department is tw<strong>of</strong>old:<br />
• To provide safe, high quality parks, open space and recreational facilities that encourage<br />
residents, businesses and visitors to live, invest and play in the community.<br />
• To empower our community by providing equitable access to information, technology,<br />
cultural, educational and life-enhancing materials and services, including a commitment to<br />
the public arts.<br />
Department Description:<br />
The parks and recreation system <strong>of</strong>fers opportunities to enhance the social, physical, mental and<br />
economic health <strong>of</strong> the community through a variety <strong>of</strong> diverse programs. The system maintains,<br />
protects and manages public parks, open spaces, trails and aquatic and recreational facilities<br />
located throughout the community.<br />
The public library system serves the needs <strong>of</strong> Glendale citizens by providing <strong>book</strong>s,<br />
programming, audio-visual materials and electronic resources that inform, educate and entertain<br />
residents. The arts program administers the <strong>city</strong>’s Public Art and Performing Arts Partnership<br />
Program.<br />
FISCAL YEAR 20<strong>12</strong><br />
Goal<br />
Related Council Goal<br />
GOALS<br />
As a result <strong>of</strong> new federal regulation requirements, the department<br />
must conduct a comprehensive assessment <strong>of</strong> the existing conditions<br />
<strong>of</strong> all parks and facilities related to the Americans with Disabilities<br />
Act (ADA). The assessment will identi<strong>fy</strong> the physical obstacles,<br />
describe the methods to make the facilities accessible, provide a<br />
schedule for making the access modifications and indicate what<br />
department is responsible for the implementation <strong>of</strong> the plan.<br />
One community with high-quality services for citizens.<br />
206<br />
Return to TOC
Mission and Performance Measure<br />
Leisure & Cultural Services<br />
Activities<br />
Expected Outcomes<br />
(Perf. Measures)<br />
Time Commitment<br />
Expected Challenges<br />
Goal<br />
Related Council Goal<br />
Activities<br />
Expected Outcomes<br />
(Perf. Measures)<br />
Time Commitment<br />
Expected Challenges<br />
Work cooperatively with Facility Operations and Engineering to<br />
engage a consultant to assess all parks, recreation centers, and<br />
facility accessibility to ensure compliance with the new federal<br />
regulations.<br />
Complete assessment by March <strong>12</strong>, 20<strong>12</strong>.<br />
Eight months to engage the consultant; provide on-site support and<br />
accept final plan recommendations.<br />
Funding.<br />
Implement technology strategies that increase efficiency, service and<br />
responsiveness to the community so that library users will be able to<br />
access digital resources and information through a reliable, up-todate<br />
technical infrastructure.<br />
One community with high-quality services for citizens and one<br />
community with quality economic development.<br />
1) Maintain a robust and reliable system for delivering information<br />
resources and library system services.<br />
2) Improve our library’s online presence to better position the library<br />
as a local information provider.<br />
3) Continuously survey the evolving technology landscape for<br />
appropriate applications and prudently pilot new technologies.<br />
4) Replace the aging integrated library system as funding and/or<br />
other opportunities become available.<br />
1a) Streamline the library’s network by purchasing a more robust<br />
server to replace four aging servers in order to provide uninterrupted<br />
services to the community.<br />
1b) Increase bandwidth from 20 to 30 mbps in order to support staff<br />
and public needs in FY <strong>2011</strong>-<strong>12</strong>.<br />
2) Eighty percent <strong>of</strong> library users will indicate knowledge <strong>of</strong> library’s<br />
web presence when <strong>annual</strong>ly surveyed.<br />
3) Library users will be surveyed semi-<strong>annual</strong>ly to determine<br />
community technology interests, needs and trends.<br />
4) Investigate funding options for replacing aging integrated library<br />
system.<br />
This goal is ongoing. Technology continues to evolve and we must<br />
evolve with it. Some <strong>of</strong> the expected outcomes are currently being<br />
accomplished; however, others must be phased over the next several<br />
years.<br />
Budgetary constraints continue to be a challenge; however, we will<br />
continue to apply for appropriate granting opportunities, phase<br />
projects when appropriate, and continue to seek creative and<br />
innovative solutions.<br />
207<br />
Return to TOC
Mission and Performance Measure<br />
Leisure & Cultural Services<br />
FISCAL YEAR <strong>2011</strong><br />
Area <strong>of</strong> Innovation:<br />
• Parks maintenance staff designed new “no spin” toilet paper dispensers for use in parks<br />
with restroom facilities. This has created a savings in the use <strong>of</strong> toilet paper, reduced<br />
travel time needed to service restrooms, and provides parks maintenance staff with<br />
more time to maintain the City’s parks and recreational sties for our residents.<br />
• The Library staff examined the steps taken from the time a patron returns an item to the<br />
library to the moment it is placed on a cart to be reshelved. Results <strong>of</strong> the analysis<br />
included the elimination <strong>of</strong> eight steps, with an estimated savings <strong>of</strong> 7,287 staff hours<br />
<strong>annual</strong>ly. This savings has resulted in the provision <strong>of</strong> additional direct services that<br />
benefit all library system patrons.<br />
Accomplishments:<br />
• A $3.2 million renovation <strong>of</strong> the Sahuaro Ranch Sports Complex was completed in<br />
April <strong>2011</strong>. The renovation included replacing the entire sprinkler irrigation system,<br />
new athletic field lighting, new infield soil and outfield turf, new fencing and<br />
backstops, additional spectator shade, enhanced landscaping, additional pedestrian<br />
walkways, and an entirely new facility drainage plan.<br />
• The Library secured a $59,216 Library Services and Technology Act (LSTA) grant<br />
from the Arizona State Library, Archives and Public Records Agency. The “Read and<br />
Play With Me at Glendale Public Libraries” grant provides funding to help parents and<br />
caregivers become their children’s first and most important teachers, with the aim <strong>of</strong><br />
better preparing children for the formal learning environment.<br />
• Vehicles assigned to Crew Leaders in the parks system are now equipped with laptop<br />
computers. This has allowed them to be in the field more frequently and respond to<br />
citizen concerns in a more efficient manner. The computers are equipped with aerial<br />
photography which provides instant access to park topography and infrastructure data.<br />
Data can be exchanged between staff and/or citizens instantly, resulting in immediate<br />
and more detailed responses.<br />
• The Library implemented a new online payment system to allow patrons to pay their<br />
fines and fees by credit card.<br />
Goal<br />
Related Council Goal<br />
Was the goal met?<br />
GOAL UPDATES<br />
Complete the Parks and Recreation Master Plan update.<br />
One community with strong neighborhoods.<br />
Yes. On March 7, <strong>2011</strong>, the Park and Recreation Advisory<br />
Commission unanimously approved the updated Master<br />
Plan recommendations and motioned to forward the Plan to<br />
the City Council for its approval and adoption <strong>of</strong> the plan.<br />
208<br />
Return to TOC
Mission and Performance Measure<br />
Leisure & Cultural Services<br />
What were the Performance<br />
Measures?<br />
Obstacles/Challenges<br />
Goal<br />
Related Council Goal<br />
Was the goal met?<br />
What were the Performance<br />
Measures?<br />
Obstacles/Challenges<br />
Goal<br />
Related Council Goal<br />
Was the goal met?<br />
What were the Performance<br />
Measures?<br />
Obstacles/Challenges<br />
Complete a Parks Master Plan update by December 2010.<br />
Coordination and quality control with consultants.<br />
Department actively supports and contributes to the<br />
Community Services Group hybrid action teams.<br />
One community committed to public safety.<br />
Partially. Patrons have reported an 80% satisfactory rating<br />
for security on the Library’s <strong>annual</strong> survey; however,<br />
security personnel were present for only 66% <strong>of</strong><br />
documented incident reports to date.<br />
Patrons rate an 80% satisfactory rating for security on the<br />
Library’s <strong>annual</strong> survey; security guards are present when<br />
80% <strong>of</strong> the recorded incidents occur.<br />
Availability <strong>of</strong> security staff when incidents are taking<br />
place.<br />
Actively support and contribute to connecting people, with<br />
the power <strong>of</strong> community.<br />
One community with high quality services for citizens.<br />
Yes. Library and Parks staff participated in various<br />
outreach efforts throughout the year and partnered with a<br />
number <strong>of</strong> community organizations and agencies.<br />
Examples would include: the United Way for family story<br />
times at Velma Teague; HeadStart; West Valley Cancer<br />
Connection for community outreach; participating in an<br />
outreach event at Clavelito Park for public housing<br />
residents; partnering in the My Community Calendar,<br />
Culture Pass (and the participating organizations such as<br />
Phoenix Art Museum, Arizona Science Center, etc.);<br />
Glendale Convention and Visitors’ Bureau—along with<br />
downtown businesses—for the Mother’s Day Celebration<br />
and <strong>book</strong> drive; Various Parks and Recreation staff<br />
members participated in developing new neighborhood<br />
outreach strategies; researching alternative funding sources;<br />
and created and distributed a new quarterly “My<br />
Community” publication for Glendale residents.<br />
Department staff attended over 15 civic, school and<br />
community forums in Glendale and elsewhere in the Valley<br />
and collaborated with 10 community<br />
organizations/agencies to assist them to achieve their goals.<br />
Sufficient staffing continues to poses a challenge when<br />
implementing outreach programs for the community.<br />
209<br />
Return to TOC
Mission and Performance Measure<br />
Leisure & Cultural Services<br />
FISCAL YEAR 2010<br />
Area <strong>of</strong> Innovation:<br />
• The parks department partnered with the Glendale Office <strong>of</strong> Tourism and the<br />
downtown business community to host the first Eggventure in historic downtown<br />
Glendale. Over 4,000 participants enjoyed a nostalgic hometown atmosphere as they<br />
searched for over 20,000 candy-filled eggs along the tree-lined brick sidewalks in<br />
downtown. Eight different egg hunts were scheduled throughout the morning for<br />
various age groups. Participating businesses and partners assisted with the hunts and<br />
<strong>of</strong>fered unique activities and craft projects for all to enjoy. The event brought<br />
thousands <strong>of</strong> visitors to downtown Glendale.<br />
• $431,831 in stimulus funding was secured through the Energy Efficiency Conservation<br />
Block Grant (EECBG) to update the Main Library’s outdated and inefficient 23-year<br />
old fluorescent lighting system. It is estimated that the change to new fluorescent<br />
lamps and new electronic ballasts will save the <strong>city</strong> $14,352 <strong>annual</strong>ly in electri<strong>city</strong><br />
costs, equivalent to 29,410 watts. The conversion will also result in a 20% reduction <strong>of</strong><br />
CO2 emissions.<br />
Accomplishments:<br />
• The department completed an analysis <strong>of</strong> its organizational structure and core services.<br />
A reorganization <strong>of</strong> the department was completed to reflect financial realities and the<br />
current and future needs <strong>of</strong> the community and department. For example, the Library<br />
had <strong>12</strong>.5 retirements and a loss <strong>of</strong> 17 temporary employees. Library staff members<br />
were shifted between departments and, in some cases, transferred to other branches in<br />
order to ensure a continued balance <strong>of</strong> services at all facilities and in all departments.<br />
• Staff assisted Marketing’s Special Events Division in developing and conducting<br />
programs for children at Glendale Glitters and coordinated with the Fire and Police<br />
Departments to obtain gifts for the Glendale Community Center holiday event. Staff<br />
also served on the planning committee with the Water Conservation Department for<br />
Earth Day, worked with the student government at Copper Canyon High School to<br />
conduct a community fair with the goal <strong>of</strong> generating community involvement in the<br />
school.<br />
• The Library secured a $54,882 Library Services and Technology Act (LSTA) grant<br />
from the Arizona State Library, Archives and Public Records Agency. The “Glendale<br />
Public Library Recession Response” grant provided funding for Library staff to hold<br />
classes aimed at assisting job seekers, those facing bankruptcy and foreclosure, and<br />
residents dealing with the stress that accompanies these types <strong>of</strong> situations. Funds<br />
were used to purchase computers to be used in job searching, computer training,<br />
applying for unemployment benefits and résumé writing.<br />
210<br />
Return to TOC
Mission and Performance Measure<br />
Leisure & Cultural Services<br />
GOAL UPDATES<br />
Goal Complete the Parks and Recreation Master Plan update.<br />
Related Council Goal One community with strong neighborhoods.<br />
Was the goal met? Updating will continue in FY <strong>2011</strong>.<br />
What were the<br />
Performance Measures?<br />
Complete the update <strong>of</strong> the master plan by June 30, 2010<br />
Obstacles/Challenges Addressing <strong>budget</strong>-related issues.<br />
Goal<br />
Related Council Goal<br />
Was the goal met?<br />
What were the<br />
Performance Measures?<br />
Obstacles/Challenges<br />
Goal<br />
Related Council Goal<br />
Was the goal met?<br />
What were the<br />
Performance Measures?<br />
Obstacles/Challenges<br />
Goal<br />
Related Council Goal<br />
Was the goal met?<br />
What were the<br />
Performance Measures?<br />
Obtain national agency accreditation with the Commission for<br />
Accreditation <strong>of</strong> Park and Recreation Agencies (CAPRA).<br />
One community with high quality services for citizens.<br />
Yes, the department met 100% <strong>of</strong> the 155 standards reviewed for<br />
accreditation. A 100% rating has only been achieved by a few<br />
agencies.<br />
Obtain agency accreditation by October 2009.<br />
The process was time consuming, but highly rewarding. All fulltime<br />
employees participated in the process.<br />
GOAL UPDATES<br />
To provide Glendale residents with the information they need on a<br />
broad array <strong>of</strong> topics related to work, school and personal life<br />
using new customer service philosophies and technologies.<br />
One community with high quality services for citizens.<br />
Yes.<br />
The Library website provides cardholders 24/7 access to electronic<br />
<strong>book</strong>s and databases, catalog searching, holds and renewals,<br />
calendar and program information, and e-librarian services. In<br />
addition, the Library implemented a centralized calling system as<br />
a means to streamline customer telephone services.<br />
After much trial and error, it was determined that the centralized<br />
calling system was not beneficial to our patrons and was<br />
discontinued.<br />
Consider the <strong>city</strong>’s public art collection as a financial investment<br />
and asset that will appreciate in value.<br />
One community with quality economic development.<br />
Yes.<br />
Several new quality pieces were purchased this year by the Arts<br />
Commission. Additionally, the Public Safety Memorial was<br />
completed and dedicated on January 4, <strong>2011</strong>.<br />
211<br />
Return to TOC
Mission and Performance Measure<br />
Leisure & Cultural Services<br />
Obstacles/Challenges<br />
The Arts Coordinator retired at the end <strong>of</strong> FY 2009 and was not<br />
replaced. Additionally, two <strong>of</strong> the three part-time employees<br />
resigned to pursue other opportunities, leaving one part-time<br />
employee and a Library staff member who has been assigned to<br />
the Arts Maintenance Division on a part-time basis to carry out the<br />
Arts program.<br />
2<strong>12</strong><br />
Return to TOC
City <strong>of</strong> Glendale<br />
Budget Summary by Department<br />
Library & Arts<br />
FUND NUMBER /<br />
BUDGET BY PROGRAM<br />
FY 2010<br />
Actual<br />
FY <strong>2011</strong><br />
Budget<br />
FY <strong>2011</strong><br />
Estimate<br />
FY 20<strong>12</strong><br />
Budget<br />
Percent Over<br />
FY <strong>2011</strong> Budget<br />
(1000) Arts Maintenance - Admin.<br />
$<strong>12</strong>1,832 $31,763 $31,763 $30,302 -5%<br />
(1000) Library<br />
$7,135,861 $6,044,1<strong>12</strong> $6,044,1<strong>12</strong> $5,655,581 -6%<br />
(<strong>12</strong>20) Arts Maintenance<br />
$40,518 $<strong>12</strong>7,787 $<strong>12</strong>7,787 $<strong>12</strong>7,787 0%<br />
(<strong>12</strong>60) Library Book Fund<br />
$44,645 $142,223 $142,223 $142,223 0%<br />
(<strong>12</strong>60) Library Special Revenue<br />
$<strong>12</strong>8,726 $105,150 $105,150 $105,150 0%<br />
(1840) Grant Approp - Library<br />
$92,169 $550,000 $550,000 $550,000 0%<br />
Total - Library & Arts $7,563,751 $7,001,035 $7,001,035 $6,611,043 -6%<br />
BUDGET BY CATEGORIES<br />
OF EXPENDITURES<br />
FY 2010<br />
Actual<br />
FY <strong>2011</strong><br />
Budget<br />
FY <strong>2011</strong><br />
Estimate<br />
FY 20<strong>12</strong><br />
Budget<br />
Percent Over<br />
FY <strong>2011</strong> Budget<br />
Wages/Salaries/Benefits $6,038,163 $5,225,252 $5,225,252 $5,135,564 -2%<br />
Supplies and Contracts $1,329,851 $1,832,696 $1,832,696 $1,779,023 -3%<br />
Internal Premiums $<strong>12</strong>7,617 $147,633 $147,633 $<strong>12</strong>1,746 -18%<br />
Internal Service Charges $68,<strong>12</strong>0 $56,315 $56,315 $52,350 -7%<br />
Work Order Credits ($260,861) ($260,861) ($477,640) 83%<br />
Total - Library & Arts $7,563,751 $7,001,035 $7,001,035 $6,611,043 -6%<br />
STAFFING BY PROGRAM<br />
FY 2010<br />
Actual<br />
FY <strong>2011</strong><br />
Budget<br />
FY <strong>2011</strong><br />
Estimate<br />
FY 20<strong>12</strong><br />
Budget<br />
Percent Over<br />
FY <strong>2011</strong> Budget<br />
(1000) Arts Maintenance - Admin.<br />
1<br />
(1000) Library 86.76<br />
69.26 70.13 70.13 1%<br />
Total -Library & Arts 87.76 69.26 70.13 70.13 1%<br />
213<br />
Return to TOC
City <strong>of</strong> Glendale<br />
Budget Summary by Department<br />
Parks & Recreation<br />
FUND NUMBER /<br />
BUDGET BY PROGRAM<br />
FY 2010<br />
Actual<br />
FY <strong>2011</strong><br />
Budget<br />
FY <strong>2011</strong><br />
Estimate<br />
FY 20<strong>12</strong><br />
Budget<br />
Percent Over<br />
FY <strong>2011</strong> Budget<br />
(1000) Adult Center<br />
$373,567 $485,907 $485,907 $484,688 0%<br />
(1000) Aquatics<br />
$373,503 $221,959 $221,959 $218,251 -2%<br />
(1000) Audio/Visual<br />
$211,025 $0 $0 $0 NA<br />
(1000) Copper Canyon HS Youth Dev Prg<br />
$942 $0 $0 $0 NA<br />
(1000) Foothills Recreation Center<br />
$1,429,426 $1,562,987 $1,562,987 $1,426,274 -9%<br />
(1000) Glendale Community Center<br />
$174,166 $136,070 $136,070 $<strong>12</strong>9,873 -5%<br />
(1000) Historic Sahuaro Ranch<br />
$315,483 $242,300 $242,300 $231,<strong>12</strong>6 -5%<br />
(1000) Marketing - Parks & Rec<br />
$175,387 $146,670 $146,670 $139,706 -5%<br />
(1000) Park Irrigation<br />
$281,613 $252,116 $252,116 $242,779 -4%<br />
(1000) Park Rangers<br />
$260,145 $265,687 $265,687 $259,807 -2%<br />
(1000) Parks & Recreation Admin.<br />
$243,139 $240,308 $240,308 $139,186 -42%<br />
(1000) Parks CIP & Planning<br />
$298,995 $180,341 $180,341 $174,510 -3%<br />
(1000) Parks Maintenance<br />
$3,725,971 $3,254,902 $3,326,902 $3,208,114 -1%<br />
(1000) Pool Maintenance<br />
$257,481 $196,824 $196,824 $187,553 -5%<br />
(1000) Recreation Support Services<br />
$933,309 $840,636 $838,034 $793,<strong>12</strong>2 -6%<br />
(1000) Special Events and Programs<br />
$184,745 $94,157 $94,157 $86,276 -8%<br />
(1000) Sports and Health<br />
$316,697 $403,116 $403,116 $392,850 -3%<br />
(1000) Youth and Teen<br />
$418,610 $5<strong>12</strong>,548 $5<strong>12</strong>,548 $530,707 4%<br />
(<strong>12</strong>80) YSC - Parks & Rec<br />
$246,571 $262,000 $262,000 $262,000 0%<br />
(1840) Grant Approp - Parks & Rec<br />
$63,876 $550,000 $550,000 $550,000 0%<br />
(1880) Adult Center Self Sustaining<br />
$149,973 $135,000 $135,000 $117,000 -13%<br />
(1880) Aquatic Self Sustaining<br />
$81,695 $92,919 $92,919 $90,001 -3%<br />
(1880) Glendale Community Center<br />
$861 $5,000 $5,000 $5,000 0%<br />
(1880) Rec Self Sust-Administration<br />
$17,296 $15,000 $15,000 $15,360 2%<br />
(1880) Rec Self Sust-Audio/Visual<br />
$18,806 $0 $0 $0 NA<br />
(1880) Rec Self Sust-Foothills Rec<br />
$233,355 $272,748 $272,748 $254,893 -7%<br />
(1880) Recreation Self-Sustaining<br />
$0 $0 $0 $15,000 NA<br />
(1880) Spec Events & Prgm Self Sust<br />
$62,077 $73,363 $73,363 $34,999 -52%<br />
(1880) Sports Self Sustaining<br />
$179,865 $249,922 $249,922 $228,364 -9%<br />
(1880) Youth and Teen Self Sustaining<br />
$303,547 $326,735 $326,735 $3<strong>12</strong>,584 -4%<br />
(1885) Apollo Pool Repair<br />
$7,080 $19,000 $19,000 $19,000 0%<br />
(1885) Cactus Pool Repair<br />
$54,802 $20,000 $20,000 $20,000 0%<br />
(1885) Cardinal Pool Repair<br />
$5,161 $19,000 $19,000 $19,000 0%<br />
(1885) Dedicate A Tree<br />
$238 $5,000 $5,000 $5,000 0%<br />
(1885) Desert Gardens Park<br />
$2,938 $7,000 $7,000 $7,000 0%<br />
(1885) Desert Mirage Park<br />
$0 $7,000 $7,000 $7,000 0%<br />
(1885) Desert Valley Park<br />
$1,555 $2,000 $2,000 $2,000 0%<br />
(1885) Discovery Park<br />
$0 $7,000 $7,000 $7,000 0%<br />
(1885) Elsie McCarthy Pk. Maint<br />
$19,958 $44,038 $44,038 $44,038 0%<br />
(1885) GCC Pool Repair<br />
$116 $0 $0 $0 NA<br />
(1885) GESD ES Ballfields<br />
$0 $7,000 $7,000 $7,000 0%<br />
(1885) Ironwood HS Light<br />
$0 $5,000 $5,000 $5,000 0%<br />
(1885) Ironwood Pool Repair<br />
$4,082 $30,200 $30,200 $30,200 0%<br />
(1885) O'Neil Park Maintenance<br />
$0 $4,800 $4,800 $4,800 0%<br />
Total - Parks & Recreation $11,428,056 $11,196,253 $11,265,651 $10,707,061 -4%<br />
214<br />
Return to TOC
City <strong>of</strong> Glendale<br />
Budget Summary by Department<br />
Parks & Recreation<br />
BUDGET BY CATEGORIES<br />
OF EXPENDITURES<br />
FY 2010<br />
Actual<br />
FY <strong>2011</strong><br />
Budget<br />
FY <strong>2011</strong><br />
Estimate<br />
FY 20<strong>12</strong><br />
Budget<br />
Percent Over<br />
FY <strong>2011</strong> Budget<br />
Wages/Salaries/Benefits $7,157,510 $6,846,982 $6,850,917 $6,575,527 -4%<br />
Supplies and Contracts $3,724,091 $4,044,704 $4,1<strong>12</strong>,976 $4,014,809 -1%<br />
Internal Premiums $2<strong>12</strong>,407 $2<strong>12</strong>,253 $2<strong>12</strong>,253 $193,470 -9%<br />
Internal Service Charges $351,767 $368,355 $365,546 $369,181 0%<br />
Operating Capital $30,282<br />
Work Order Credits ($48,001) ($276,041) ($276,041) ($445,926) 62%<br />
Total - Parks & Recreation $11,428,056 $11,196,253 $11,265,651 $10,707,061 -4%<br />
STAFFING BY PROGRAM<br />
FY 2010<br />
Actual<br />
FY <strong>2011</strong><br />
Budget<br />
FY <strong>2011</strong><br />
Estimate<br />
FY 20<strong>12</strong><br />
Budget<br />
Percent Over<br />
FY <strong>2011</strong> Budget<br />
(1000) Adult Center 6<br />
8 8 8 0%<br />
(1000) Aquatics 1<br />
1 1 1 0%<br />
(1000) Audio/Visual<br />
2<br />
(1000) Foothills Recreation Center 10<br />
8 7.75 7.75 -3%<br />
(1000) Glendale Community Center 3<br />
2 2 2 0%<br />
(1000) Historic Sahuaro Ranch 3<br />
3 3 3 0%<br />
(1000) Marketing - Parks & Rec 1<br />
1.75 1.75 1.75 0%<br />
(1000) Park Irrigation 4<br />
3 3 3 0%<br />
(1000) Park Rangers 5<br />
3 3 3 0%<br />
(1000) Parks & Recreation Admin. 2<br />
2 1 1 -50%<br />
(1000) Parks CIP & Planning 3<br />
2 2 2 0%<br />
(1000) Parks Maintenance 27<br />
23 20 20 -13%<br />
(1000) Pool Maintenance 3<br />
2 2 2 0%<br />
(1000) Recreation Support Services 8<br />
6 6 6 0%<br />
(1000) Special Events and Programs 2<br />
1 1 1 0%<br />
(1000) Sports and Health 5<br />
5 5 5 0%<br />
(1000) Youth and Teen 8.25<br />
6.5 6.75 6.75 4%<br />
(1880) Rec Self Sust-Foothills Rec 1 1 1 0%<br />
(1880) Sports Self Sustaining 1 1 1 0%<br />
(1880) Youth and Teen Self Sustaining 5<br />
5 5 5 0%<br />
Total -Parks & Recreation 98.25 84.25 80.25 80.25 -5%<br />
215<br />
Return to TOC
Mission and Performance Measure<br />
Neighborhood & Human Services<br />
Neighborhood &<br />
Human Services<br />
Community<br />
Action Program<br />
Community<br />
Partnerships<br />
NEIGHBORHOOD & HUMAN SERVICES<br />
Cathy Gorham<br />
Mission Statement:<br />
Connecting people through the power <strong>of</strong> community.<br />
Housing<br />
Department Description:<br />
The Neighborhood & Human Services Department consists <strong>of</strong> four divisions, all <strong>of</strong> which<br />
partner with the community to ensure neighborhoods, low-to-moderate income families, and<br />
individuals, have the resources they need for a quality <strong>of</strong> life that includes self-sufficiency, safe<br />
and decent housing, and connections to services provided by other non-pr<strong>of</strong>it agencies as<br />
necessary. The Community Revitalization Division provides affordable housing, housing<br />
rehabilitation assistance, and emergency home repair for eligible Glendale residents. It also<br />
administers the federal Community Development Block Grant Program (CDBG) and other<br />
related federal programs. The Community Housing Division is responsible for addressing the<br />
housing needs <strong>of</strong> over 4,400 Glendale residents by operating three public housing complexes and<br />
a Section 8 voucher program. The Community Action Program administers the Community<br />
Services Block Grant (CSBG) and the Low Income Home Energy Assistance Program that<br />
provide utility payment assistance, rental assistance, and other homeless prevention services. The<br />
Neighborhood Partnership Office provides direct services to registered neighborhood<br />
associations throughout the <strong>city</strong> and is also responsible for the administration <strong>of</strong> Glendale<br />
University, the Homeowners’ Association Training Academy, the Community Mediation<br />
Program, and the Community Volunteer Program.<br />
FISCAL YEAR 20<strong>12</strong><br />
Goal<br />
Related Council Goal<br />
Activities<br />
GOALS<br />
Continue neighborhood revitalization efforts using NSP 3<br />
funding to improve affordable housing options for working<br />
families.<br />
One community with strong neighborhoods.<br />
Acquire vacant foreclosed residential property for<br />
rehabilitation and reselling. Leverage funds from the private<br />
216<br />
Return to TOC
Mission and Performance Measure<br />
Neighborhood & Human Services<br />
and non pr<strong>of</strong>it sectors.<br />
Expected Outcomes<br />
(Perf. Measures)<br />
Time Commitment<br />
Expected Challenges<br />
Goal<br />
Related Council Goal<br />
Activities<br />
Expected Outcomes<br />
(Perf. Measures)<br />
Time Commitment<br />
Expected Challenges<br />
At least 15 properties will be rehabilitated and resold,<br />
depending on the market. These rehabilitated properties will<br />
provide more affordable housing options for residents.<br />
This grant to be administered and managed by existing staff,<br />
with the actual property acquisition and rehabilitation to be<br />
carried out by non-pr<strong>of</strong>it partners over a two-year time<br />
frame.<br />
Market conditions and federal <strong>budget</strong> reductions.<br />
Maintain the financial stability <strong>of</strong> both housing programs,<br />
Section 8 Housing Choice Voucher and Conventional Public<br />
Housing, while assisting the maximum number <strong>of</strong> families<br />
allowed by federal <strong>budget</strong> constraints.<br />
One community that is fiscally sound.<br />
Continue to lease 155 public housing apartments to receive<br />
ongoing rental income.<br />
To the extent allowed by the federal <strong>budget</strong>, partner with<br />
local landlords to maintain the availability <strong>of</strong> housing that is<br />
decent, safe, and affordable for low-and very low-income<br />
Glendale residents through the Section 8 voucher program.<br />
Maintain public housing vacancy rates at HUD requirement<br />
<strong>of</strong> 3% or less.\<br />
Maintain Section 8 voucher usage based on available federal<br />
program funding levels.<br />
The goal is an ongoing effort as the need for rental<br />
assistance has no time limit. The programs provide monthly<br />
rental assistance for as long the family’s needs require and<br />
they are eligible.<br />
Federal <strong>budget</strong> reductions related to the administrative fee<br />
for Section 8 vouchers.<br />
FISCAL YEAR <strong>2011</strong><br />
Area <strong>of</strong> Innovation:<br />
• In the area <strong>of</strong> environmental review, Community Revitalization staff enacted a<br />
programmatic agreement with the State Historic Preservation Office, reducing approval<br />
turnaround from 60 days to two weeks. The clearance process was further streamlined<br />
and enhanced to identi<strong>fy</strong> any deficiencies in the process.<br />
• Through the <strong>city</strong>’s Innovate LEAN process, we reviewed procedural guidelines used<br />
217<br />
Return to TOC
Mission and Performance Measure<br />
Neighborhood & Human Services<br />
by Housing Assistance Representatives and streamlined the incoming paper-flow<br />
process. A second LEAN process streamlined client intake procedures for the<br />
Community Action Program resulting in improved customer service and a step-by-step<br />
model for a new s<strong>of</strong>tware application that meets state requirements.<br />
Accomplishments:<br />
• Community Housing Division was designated as a high-performer for the 18th<br />
consecutive fiscal year.<br />
• The Neighborhood Partnership Division’s Adopt-A-Neighborhood program matched<br />
faith based organizations with four challenged neighborhoods resulting in long-term<br />
relationships with focused volunteer and community service projects.<br />
• Administered and assisted with processing $914,<strong>12</strong>2 in Homeless Prevention Rapid<br />
Re-housing (HPRP) funds well ahead <strong>of</strong> the federal deadline. This performance was<br />
taken into account when the State <strong>of</strong> Arizona decided to provide the Community<br />
Action Program with an additional $316,000 in HPRP funding in March <strong>2011</strong>.<br />
• Through the first three quarters <strong>of</strong> FY10-11, 66 community volunteer projects were<br />
completed by 2,280 volunteers at a value <strong>of</strong> $188,700.<br />
Goal<br />
Related Council Goal<br />
Was the goal met?<br />
What were the<br />
Performance Measures?<br />
Obstacles/Challenges<br />
Goal<br />
Related Council Goal<br />
Was the goal met?<br />
GOAL UPDATES<br />
Utilize our allocation <strong>of</strong> federal funds to assist the community in<br />
mitigating the impact <strong>of</strong> foreclosures, to increase the number <strong>of</strong><br />
first-time homebuyers, to partner with non-pr<strong>of</strong>its in developing<br />
senior housing, and to administer homeless prevention funds for<br />
utility assistance and rapid rehousing.<br />
One community with strong neighborhoods.<br />
The mitigation <strong>of</strong> foreclosures continues with funds being used to<br />
purchase, rehabilitate, and resell properties. The first allocation <strong>of</strong><br />
homeless prevention funds was expended by the Community<br />
Action Program and two partner nonpr<strong>of</strong>its within one year. Two<br />
other non-pr<strong>of</strong>its have completed designs for two new senior<br />
housing complexes on vacant/blighted property.<br />
Out <strong>of</strong> 29 houses purchased and rehabilitated with federal funding,<br />
it is anticipated that we (all partners combined) will sell at least 18<br />
houses by June 30, <strong>2011</strong>. The full $914,<strong>12</strong>2 in homeless<br />
prevention funds assisted 1,391 people.<br />
Mortgage qualification <strong>of</strong> customers and competing with private<br />
investors on the purchase <strong>of</strong> homes.<br />
Maintain the financial stability <strong>of</strong> the Community Housing<br />
Division.<br />
One community with high quality services for residents.<br />
Yes, staff has continued to manage the programs efficiently.<br />
218<br />
Return to TOC
Mission and Performance Measure<br />
Neighborhood & Human Services<br />
What were the<br />
Performance Measures?<br />
Obstacles/Challenges<br />
The payment <strong>of</strong> more than $7 million to Glendale landlords for<br />
housing assistance payments.<br />
Capital Funds received were used to improve the quality <strong>of</strong><br />
housing available through the public housing program.<br />
Federal <strong>budget</strong> reductions coupled with an increase in rental<br />
payments due to the economic downturn may reduce the number<br />
<strong>of</strong> families that will receive assistance.<br />
FISCAL YEAR 2010<br />
Area <strong>of</strong> Innovation:<br />
• The Community Partnerships Department partnered with the Community Action<br />
Program and two nonpr<strong>of</strong>it organizations to develop a new program to distribute<br />
$914,<strong>12</strong>2 in federal stimulus funds to assist eligible Glendale residents with rental and<br />
utility payment assistance.<br />
Accomplishments:<br />
• The Neighborhood Partnership Office successfully coordinated the construction <strong>of</strong> 16<br />
neighborhood improvement projects and provided services to 202 registered<br />
neighborhoods.<br />
• The Community Revitalization Division leveraged $2.8 million in Neighborhood<br />
Stabilization Funds to bring in $13.2 million for the construction <strong>of</strong> 97 new, senior<br />
only housing that will be built over the next two years.<br />
• The Community Housing Division used $454,325 in federal stimulus funds to<br />
modernize 50 <strong>of</strong> its public housing rental units.<br />
Goal<br />
Related Council Goal<br />
Was the goal met?<br />
What were the<br />
Performance Measures?<br />
Obstacles/Challenges<br />
GOAL UPDATES<br />
Increase civic participation and maintain strong communication<br />
with residents to provide them with information about programs<br />
and services that will improve their quality <strong>of</strong> life.<br />
One community with strong neighborhoods.<br />
Yes.<br />
• Received 16 applications from neighborhoods for both our<br />
small and community connection grants<br />
• Registered 202 neighborhood groups<br />
• Maintained an active database <strong>of</strong> over 500 different groups<br />
to assist with our Community Volunteer Program<br />
• Implemented version 2.0 <strong>of</strong> the Neighborhood Information<br />
System.<br />
A reduction in <strong>budget</strong> for programming.<br />
219<br />
Return to TOC
Mission and Performance Measure<br />
Neighborhood & Human Services<br />
Goal<br />
Related Council Goal<br />
Was the goal met?<br />
What were the<br />
Performance Measures?<br />
Obstacles/Challenges<br />
Use federal stimulus funds to assist residents in mitigating the<br />
impact <strong>of</strong> foreclosures, assist first time homebuyers, develop<br />
senior housing, provide funds for utility assistance and rapid<br />
rehousing.<br />
One community with high quality services for residents.<br />
Yes, provided Habitat for Humanity Central Arizona $1 million<br />
and Chicanos Por La Causa with $1.2 million to purchase and<br />
rehabilitate foreclosed properties with Neighborhood Stabilization<br />
Program funds; provided $300,000 in HOME funds for a new, 28-<br />
unit development called “Glendale L<strong>of</strong>ts;” assisted with the<br />
construction <strong>of</strong> a new Habitat for Humanity 11-home subdivision<br />
in central Glendale.<br />
To allocate the federal appropriations in the mandated time frame<br />
and to complete all the reporting requirements.<br />
Economic downturn impacted number <strong>of</strong> qualified first time<br />
homebuyers.<br />
220<br />
Return to TOC
City <strong>of</strong> Glendale<br />
Budget Summary by Department<br />
Comm. Action Program<br />
FUND NUMBER /<br />
BUDGET BY PROGRAM<br />
FY 2010<br />
Actual<br />
FY <strong>2011</strong><br />
Budget<br />
FY <strong>2011</strong><br />
Estimate<br />
FY 20<strong>12</strong><br />
Budget<br />
Percent Over<br />
FY <strong>2011</strong> Budget<br />
(1000) CAP Local Match<br />
$<strong>12</strong>1,797 $<strong>12</strong>9,280 $<strong>12</strong>9,280 $<strong>12</strong>9,859 0%<br />
(1820) ACAA HEAF Program<br />
$0 $0 $10,136 $10,136 NA<br />
(1820) ACAA SRP Assistance<br />
$0 $0 $59,441 $59,441 NA<br />
(1820) ACAA SW Gas Assistance<br />
$0 $0 $5,000 $5,000 NA<br />
(1820) ACAA URRD Program<br />
$0 $0 $36,732 $36,732 NA<br />
(1820) Case Mgmt-LIHEAP Voucher<br />
$0 $0 $805,544 $790,705 NA<br />
(1820) Case Mgmt-NHN Voucher<br />
$0 $0 $3,135 $3,135 NA<br />
(1820) Case Mgmt-Qwest Admin<br />
$0 $0 $3,919 $3,919 NA<br />
(1820) Case Mgmt-TANF Admin<br />
$0 $0 ($<strong>12</strong>,475) $179,549 NA<br />
(1820) Case Mgmt-TANF Voucher<br />
$0 $0 $45,000 $45,000 NA<br />
(1820) Case Mgt-LIHEAP A16 Admin<br />
$0 $0 $56,647 $56,647 NA<br />
(1820) Case Mgt-LIHEAP Administration<br />
$0 $0 $51,568 $51,568 NA<br />
(1820) CM-LIHEAP Admin Contingency<br />
$0 $0 $5,341 $5,341 NA<br />
(1820) CM-LIHEAP Voucher Contigency<br />
$0 $0 $90,718 $90,718 NA<br />
(1820) Community Action Program (CAP) $389,388 $4<strong>12</strong>,557 $4<strong>12</strong>,557 $0 -100%<br />
(1820) Community Svcs Block Grant-Adm<br />
$0 $0 $189,494 $265,153 NA<br />
Total - Comm. Action Program $511,185 $541,837 $1,892,037 $1,732,903 220%<br />
BUDGET BY CATEGORIES<br />
OF EXPENDITURES<br />
FY 2010<br />
Actual<br />
FY <strong>2011</strong><br />
Budget<br />
FY <strong>2011</strong><br />
Estimate<br />
FY 20<strong>12</strong><br />
Budget<br />
Percent Over<br />
FY <strong>2011</strong> Budget<br />
Wages/Salaries/Benefits $359,981 $417,868 $817,654 $664,091 59%<br />
Supplies and Contracts $<strong>12</strong>1,948 $117,486 $1,185,375 $1,172,718 898%<br />
Internal Premiums $5,522 $3,548 $3,548 $3,480 -2%<br />
Internal Service Charges $16,374 $16,633 $16,633 $16,980 2%<br />
Operating Capital $7,360 $0<br />
Work Order Credits ($13,698) ($131,173) ($<strong>12</strong>4,366) 808%<br />
Total - Comm. Action Program $511,185 $541,837 $1,892,037 $1,732,903 220%<br />
STAFFING BY PROGRAM<br />
FY 2010<br />
Actual<br />
FY <strong>2011</strong><br />
Budget<br />
FY <strong>2011</strong><br />
Estimate<br />
FY 20<strong>12</strong><br />
Budget<br />
Percent Over<br />
FY <strong>2011</strong> Budget<br />
(1820) Case Mgmt-TANF Admin 3.5 3.5<br />
(1820) Community Action Program (CAP) 7<br />
7<br />
(1820) Community Svcs Block Grant-Adm 3.5 3.5<br />
Total -Comm. Action Program 7 7 7 7 0%<br />
221<br />
Return to TOC
City <strong>of</strong> Glendale<br />
Budget Summary by Department<br />
Comm. Partnerships<br />
FUND NUMBER /<br />
BUDGET BY PROGRAM<br />
FY 2010<br />
Actual<br />
FY <strong>2011</strong><br />
Budget<br />
FY <strong>2011</strong><br />
Estimate<br />
FY 20<strong>12</strong><br />
Budget<br />
Percent Over<br />
FY <strong>2011</strong> Budget<br />
(1000) Community Revitalization<br />
$403,342 $334,195 $334,195 $507,275 52%<br />
(1000) Neighborhood Partnership<br />
$494,445 $364,615 $364,615 $455,321 25%<br />
(1300) HOME Program<br />
$1,116,060 $1,660,797 $568,296 $1,787,501 8%<br />
(1310) NSP Programs<br />
$2,237,449 $4,184,1<strong>12</strong> $2,066,215 $2,117,897 -49%<br />
(1311) NSP III<br />
$0 $0 $0 $3,368,377 NA<br />
(1320) CDBG Programs<br />
$2,254,658 $3,540,617 $1,816,988 $3,718,764 5%<br />
(1830) Emergency Shelter Grant<br />
$65,203 $98,278 $98,278 $98,278 0%<br />
(1842) CDBG-R<br />
$390,772 $140,000 $147,049 $60,000 -57%<br />
(1842) Homeless Prevention HPRP<br />
$550,108 $646,272 $364,015 $0 -100%<br />
(2500) Community Housing<br />
$1,503,648 $8,487,034 $<strong>12</strong>,587,034 $<strong>12</strong>,609,<strong>12</strong>6 49%<br />
Total - Comm. Partnerships $9,015,685 $19,455,920 $18,346,685 $24,722,539 27%<br />
BUDGET BY CATEGORIES<br />
OF EXPENDITURES<br />
FY 2010<br />
Actual<br />
FY <strong>2011</strong><br />
Budget<br />
FY <strong>2011</strong><br />
Estimate<br />
FY 20<strong>12</strong><br />
Budget<br />
Percent Over<br />
FY <strong>2011</strong> Budget<br />
Wages/Salaries/Benefits $2,699,048 $2,877,746 $3,130,351 $3,665,689 27%<br />
Supplies and Contracts $6,305,306 $16,296,550 $14,936,710 $20,831,081 28%<br />
Internal Premiums $94,805 $102,177 $102,177 $101,058 -1%<br />
Internal Service Charges $35,596 $36,972 $34,972 $33,232 -10%<br />
Operating Capital $250,000 $250,000 $224,<strong>12</strong>6 -10%<br />
Work Order Credits ($119,070) ($107,525) ($107,525) ($132,647) 23%<br />
Total - Comm. Partnerships $9,015,685 $19,455,920 $18,346,685 $24,722,539 27%<br />
STAFFING BY PROGRAM<br />
FY 2010<br />
Actual<br />
FY <strong>2011</strong><br />
Budget<br />
FY <strong>2011</strong><br />
Estimate<br />
FY 20<strong>12</strong><br />
Budget<br />
Percent Over<br />
FY <strong>2011</strong> Budget<br />
(1000) Community Revitalization 2<br />
2 3 3 50%<br />
(1000) Neighborhood Partnership 5.5<br />
4 5.5 5.5 38%<br />
(1320) CDBG Programs 8.75<br />
8.75 8.75 8.75 0%<br />
(2500) Community Housing 25<br />
24 24 24 0%<br />
Total -Comm. Partnerships 41.25 38.75 41.25 41.25 6%<br />
222<br />
Return to TOC
City <strong>of</strong> Glendale<br />
Budget Summary by Department<br />
Neighborhood Imp Gr<br />
FUND NUMBER /<br />
BUDGET BY PROGRAM<br />
FY 2010<br />
Actual<br />
FY <strong>2011</strong><br />
Budget<br />
FY <strong>2011</strong><br />
Estimate<br />
FY 20<strong>12</strong><br />
Budget<br />
Percent Over<br />
FY <strong>2011</strong> Budget<br />
(1000) Neighborhood Improvement Grant<br />
Total - Neighborhood Imp Gr<br />
$267,700 $0 $0 $0 NA<br />
$267,700<br />
BUDGET BY CATEGORIES<br />
OF EXPENDITURES<br />
FY 2010<br />
Actual<br />
FY <strong>2011</strong><br />
Budget<br />
FY <strong>2011</strong><br />
Estimate<br />
FY 20<strong>12</strong><br />
Budget<br />
Percent Over<br />
FY <strong>2011</strong> Budget<br />
Supplies and Contracts $149,422<br />
Operating Capital $118,278<br />
Total - Neighborhood Imp Gr $267,700<br />
223<br />
Return to TOC
City <strong>of</strong> Glendale<br />
Budget Summary by Department<br />
Comm. Services Adm<br />
FUND NUMBER /<br />
BUDGET BY PROGRAM<br />
FY 2010<br />
Actual<br />
FY <strong>2011</strong><br />
Budget<br />
FY <strong>2011</strong><br />
Estimate<br />
FY 20<strong>12</strong><br />
Budget<br />
Percent Over<br />
FY <strong>2011</strong> Budget<br />
(1000) Comm. Services Admin.<br />
Total - Comm. Services Adm<br />
$308,017 $190,714 $190,714 $0 -100%<br />
$308,017 $190,714 $190,714<br />
BUDGET BY CATEGORIES<br />
OF EXPENDITURES<br />
FY 2010<br />
Actual<br />
FY <strong>2011</strong><br />
Budget<br />
FY <strong>2011</strong><br />
Estimate<br />
FY 20<strong>12</strong><br />
Budget<br />
Percent Over<br />
FY <strong>2011</strong> Budget<br />
Wages/Salaries/Benefits $301,002 $193,879 $193,879<br />
Supplies and Contracts $5,046 $6,647 $6,647<br />
Internal Premiums $1,622 $896 $896<br />
Internal Service Charges $347 $172 $172<br />
Work Order Credits ($10,880) ($10,880)<br />
Total - Comm. Services Adm $308,017 $190,714 $190,714<br />
STAFFING BY PROGRAM<br />
FY 2010<br />
Actual<br />
FY <strong>2011</strong><br />
Budget<br />
FY <strong>2011</strong><br />
Estimate<br />
FY 20<strong>12</strong><br />
Budget<br />
Percent Over<br />
FY <strong>2011</strong> Budget<br />
(1000) Comm. Services Admin. 2<br />
1<br />
Total -Comm. Services Adm 2 1<br />
224<br />
Return to TOC
Mission and Performance Measure<br />
Fire Services<br />
Mission Statement:<br />
Fast - Caring - Innovative - Pr<strong>of</strong>essional<br />
FIRE SERVICES<br />
Chief Mark Burdick<br />
Department Description:<br />
The Glendale Fire Department provides Fire, Rescue, and Emergency Medical Services to the<br />
citizens <strong>of</strong> Glendale. Within the scope <strong>of</strong> our work are five core interactive services including:<br />
• Fire Prevention and Education (Public Education, Inspections, Investigations, Code<br />
Adoption)<br />
• Fire Suppression (Firefighting)<br />
• Emergency Medical Services (Advanced Life Support and Basic Life Support)<br />
• Special Operations (H<strong>az</strong>ardous Materials and Technical Rescue)<br />
• Crisis Response (Social Services)<br />
The Glendale Fire Department utilizes the Automatic Aid System, intergovernmental<br />
agreements with surrounding agencies, public/private partnerships, and our highly skilled and<br />
dedicated staff to guarantee high quality services to those in our community.<br />
FISCAL YEAR 20<strong>12</strong><br />
Goal<br />
Related Council Goal<br />
Activities<br />
Expected Outcomes<br />
(Perf. Measures)<br />
Time Commitment<br />
GOALS<br />
Strive to increased public education and outreach.<br />
One community committed to public safety.<br />
• Implement more pro-active fire and life safety<br />
educational programs. These programs could include:<br />
Car Seat Safety, Preschool Headstart, Fire Pals, Youth<br />
Setter Intervention, Teen CERT, CERT/Citizen’s<br />
Academy, and the Safety Educator Program.<br />
• Expand the “Healthier Safer Lives” program to more<br />
retirement communities and schools<br />
• Strengthen and support the Fire Department’s volunteer<br />
programs.<br />
Indirectly reduce the number <strong>of</strong> medical emergencies,<br />
injuries and fires in Glendale by increasing citizen’s<br />
education on safety related issues.<br />
This goal involves an ongoing time commitment. Efforts to<br />
educate the public in order to prevent loss <strong>of</strong> life and<br />
property is a continuous goal <strong>of</strong> the Fire Department.<br />
225<br />
Return to TOC
Mission and Performance Measure<br />
Fire Services<br />
Expected Challenges<br />
An adequate volunteer pool is critical to the success <strong>of</strong> our<br />
educational programs. Maintaining and recruiting<br />
volunteers is an ongoing challenge. Safety Educators and<br />
Fire Cadets will need to be used to augment these programs.<br />
Goal<br />
Related Council Goal<br />
Activities<br />
Expected Outcomes<br />
(Perf. Measures)<br />
Time Commitment<br />
Expected Challenges<br />
Enhance response times.<br />
One community committed to public safety.<br />
• Ensure that emergency responding personnel are staffed<br />
in the field and deployable, without diminishing service<br />
delivery.<br />
• Properly train and certi<strong>fy</strong> Emergency Medical<br />
Technicians and Paramedics.<br />
• Maintain apparatus and equipment to reduce delays in<br />
emergency response.<br />
The department’s Service Level Objectives for response<br />
times are:<br />
• 90% <strong>of</strong> the time - Arrive on-scene in six minutes or less<br />
for the arrival <strong>of</strong> the first arriving engine company at a<br />
fire suppression incident and/or eight minutes or less<br />
arrival <strong>of</strong> a full first alarm assignment at a fire<br />
suppression incident.<br />
• 90% <strong>of</strong> the time - Arrive on-scene in six minutes or less<br />
for the arrival <strong>of</strong> a unit with first responder or higherlevel<br />
capability at an emergency medical incident.<br />
• 90% <strong>of</strong> the time - Arrive on-scene in eight minutes or<br />
less for the arrival <strong>of</strong> an advanced life support unit at an<br />
emergency medical incident, where this service is<br />
provided by the fire department.<br />
This is an ongoing effort as the Fire Department consistently<br />
works to improve response times.<br />
Due to reduced <strong>budget</strong> and vacancies, constant staffing will<br />
be a challenge. Reduced funding and positions in Fire<br />
Administration will add additional workload on<br />
administrative staff, decreasing efficiency <strong>of</strong> internal service.<br />
FISCAL YEAR <strong>2011</strong><br />
Area <strong>of</strong> Innovation:<br />
• Glendale Fire Department took over the responsibility <strong>of</strong> Infectious Control for its<br />
members. Prior to July 1, 2010 Phoenix Fire Department was providing the service.<br />
226<br />
Return to TOC
Mission and Performance Measure<br />
Fire Services<br />
Estimated savings to Glendale Fire Department is $5,000 - $10,000 <strong>annual</strong>ly.<br />
Accomplishments:<br />
• Adopted the 2009 International Fire Code. The adoption <strong>of</strong> current model codes helps<br />
ensure that Glendale is a safe community by utilizing the most current fire code.<br />
• Glendale Fire Department transitioned to the 700-800 megahertz radio system for Non<br />
H<strong>az</strong>ard Zone emergencies. This enhances communications with Automatic Aid fire<br />
department participants.<br />
Goal<br />
Related Council Goal<br />
Was the goal met?<br />
What were the<br />
Performance Measures?<br />
Obstacles/Challenges<br />
Goal<br />
Related Council Goal<br />
Was the goal met?<br />
What were the<br />
Performance Measures?<br />
GOAL UPDATES<br />
Improve our internal and external customer service through<br />
continuous assessment, progressive management and quality<br />
personnel practices.<br />
One community focused on public safety.<br />
Yes. The department has implemented a continuous quality<br />
improvement plan for EMS in accordance with Arizona<br />
Department <strong>of</strong> Health Services rule R9-25-206.<br />
At minimum, review the following categories <strong>of</strong> pre-hospital<br />
patient encounter forms to ensure fire department personnel follow<br />
established protocols and procedures:<br />
• 5% <strong>of</strong> all patient refusals, trauma, and medical incidents;<br />
• 100% <strong>of</strong> all code arrests, cerebral vascular accidents<br />
(CVA), and acute coronary syndrome (ACS)<br />
Develop a process to implement corrective action when review <strong>of</strong><br />
cases indicates a lapse in following pre-hospital protocols and/or<br />
procedures.<br />
Shortage in staff has created challenges in meeting minimum<br />
reviews.<br />
Provide fast, effective emergency response to our community<br />
through proper support and deployment <strong>of</strong> staffing, apparatus and<br />
equipment.<br />
One community focused on public safety.<br />
Yes. In 2010, a Glendale unit capable <strong>of</strong> providing AED arrived<br />
on scene in less than 6-minutes travel time, 93% <strong>of</strong> the time for all<br />
ALS and BLS incidents.<br />
The Glendale Fire Department’s service level objective for first<br />
arriving unit at an emergency medical incident:<br />
• 90 percent <strong>of</strong> all code three, 911 emergent incidents, the first<br />
unit will arrive on the scene in less than six minutes (travel<br />
time).<br />
• Advanced Life Support (ALS) units shall arrive on scene<br />
227<br />
Return to TOC
Mission and Performance Measure<br />
Fire Services<br />
Obstacles/Challenges<br />
within eight minutes (travel time), 90 percent <strong>of</strong> the time.<br />
However, we strive to meet the National Fire Protection<br />
Association Standard 1710 travel time <strong>of</strong> four minutes.<br />
Yes, reduced funding creates challenges in staffing units.<br />
FISCAL YEAR 2010<br />
Area <strong>of</strong> Innovation:<br />
• Through an effective labor/management process, a third ladder truck has been deployed<br />
by utilizing existing resources, providing the <strong>city</strong> with an alternative fire suppression<br />
vehicle. Emergency medical services were also enhanced as the department has<br />
converted its three ladder trucks into Advanced Life Support (ALS) units, and staffing<br />
them with paramedics. This simple service improvement will increase the<br />
department’s ALS response capability by 20%. The department also embarked on a<br />
year-long study to re-evaluate its deployment plan, and set about redistributing<br />
apparatus to improve response capability and coverage throughout the <strong>city</strong>. The<br />
redistribution is based on the analysis <strong>of</strong> incident data and emergency response travel<br />
times collected for each square mile in Glendale, not only has that resulted in the<br />
above-mentioned ladder truck conversion, the command <strong>of</strong>ficers have also been redeployed<br />
to provide better coverage to the <strong>city</strong>. The department will continue to<br />
evaluate the effect <strong>of</strong> these changes to ensure optimal coverage and efficiency<br />
throughout the <strong>city</strong>.<br />
Accomplishments:<br />
• In July, Fire Station 151 opened for business in its new location at 52nd Avenue and<br />
Lamar, providing emergency responders more immediate access to arterial streets in<br />
the busy downtown area.<br />
• Six emergency response vehicles were replaced, providing the community with<br />
continually reliable, mechanically sound equipment. New vehicles include two ladder<br />
trucks, two ladder tenders, two engine pumpers and one h<strong>az</strong>ardous materials truck.<br />
Goal<br />
Related Council Goal<br />
Was the goal met?<br />
What were the<br />
Performance Measures?<br />
Obstacles/Challenges<br />
GOAL UPDATES<br />
Reduce the impact <strong>of</strong> pain and suffering within our community<br />
through crisis intervention and response.<br />
One community with high quality services for citizens.<br />
Yes. In 2009, the department’s two crisis response units were<br />
dispatched a total <strong>of</strong> 2,677 incidents.<br />
Ensure an adequate pool <strong>of</strong> volunteers to provide capability to<br />
respond to a minimum <strong>of</strong> 1,000 calls per year.<br />
None.<br />
228<br />
Return to TOC
Mission and Performance Measure<br />
Fire Services<br />
Goal<br />
Related Council Goal<br />
Was the goal met?<br />
What were the<br />
Performance Measures?<br />
Obstacles/Challenges<br />
Improve our internal and external customer service through<br />
continuous assessment, progressive management and quality<br />
personnel practices.<br />
One community focused on public safety.<br />
Yes. The department’s 2009 Annual Compliance Report was<br />
unanimously accepted by the Commission on Fire Accreditation<br />
International.<br />
Report <strong>annual</strong>ly to the Center for Public Safety Excellence to<br />
ensure compliance and maintaining accredited status.<br />
None.<br />
229<br />
Return to TOC
City <strong>of</strong> Glendale<br />
Budget Summary by Department<br />
Fire Department<br />
FUND NUMBER /<br />
BUDGET BY PROGRAM<br />
FY 2010<br />
Actual<br />
FY <strong>2011</strong><br />
Budget<br />
FY <strong>2011</strong><br />
Estimate<br />
FY 20<strong>12</strong><br />
Budget<br />
Percent Over<br />
FY <strong>2011</strong> Budget<br />
(1000) Air-Med & Logistics Ops (HALO) $745,827 $751,491 $751,491 $736,989 -2%<br />
(1000) Ambulance Services<br />
$476,109 $492,393 $492,393 $484,004 -2%<br />
(1000) Fire Administration<br />
$1,796,215 $1,637,270 $1,637,270 $1,605,998 -2%<br />
(1000) Fire Community Services<br />
$10,910 $19,250 $19,250 $15,250 -21%<br />
(1000) Fire Marshal's Office<br />
$866,913 $824,255 $824,255 $8<strong>12</strong>,173 -1%<br />
(1000) Fire Medical Services & Health<br />
$44,166 $56,983 $56,983 $48,983 -14%<br />
(1000) Fire Operations<br />
$17,937,365 $17,3<strong>12</strong>,530 $17,3<strong>12</strong>,530 $17,785,340 3%<br />
(1000) Fire Resource Management<br />
$2,395,316 $1,937,224 $1,865,224 $2,070,956 7%<br />
(1000) Fire Special Operations<br />
$25,313 $16,293 $16,293 $16,293 0%<br />
(1000) Fire Training<br />
$22,679 $13,656 $13,656 $13,656 0%<br />
(1000) PS Training Ctr - Fire<br />
$619,583 $577,227 $577,227 $567,227 -2%<br />
(<strong>12</strong>81) Fire - Fiesta Bowl Event<br />
$52,991 $159,942 $138,872 $159,942 0%<br />
(<strong>12</strong>81) Stadium - Fire Event Staffing<br />
$246,992 $229,886 $229,886 $229,886 0%<br />
(<strong>12</strong>82) Arena - Fire Event Staffing<br />
$152,602 $300,008 $300,008 $301,041 0%<br />
(<strong>12</strong>82) Westgate - Fire Event Staffing<br />
$11,659 $0 $0 $0 NA<br />
(<strong>12</strong>83) CBRanch - Fire Event Staffing<br />
$34,604 $0 $21,070 $28,852 NA<br />
(1720) Fire - Special Revenue Fund<br />
$4,850,264 $6,135,642 $7,335,642 $6,395,637 4%<br />
(1840) Grant Approp - Fire Dept<br />
$562,753 $4,500,000 $4,500,000 $4,500,000 0%<br />
(1842) PSSP Fire OT Grant<br />
$0 $0 $0 $75,000 NA<br />
(2530) PS Training Ops - Fire<br />
$739,341 $760,451 $730,451 $763,314 0%<br />
(2538) Glendale Health Center<br />
$32,859 $54,000 $54,000 $54,000 0%<br />
Total - Fire Department $31,624,461 $35,778,501 $36,876,501 $36,664,541 2%<br />
230<br />
Return to TOC
City <strong>of</strong> Glendale<br />
Budget Summary by Department<br />
Fire Department<br />
BUDGET BY CATEGORIES<br />
OF EXPENDITURES<br />
FY 2010<br />
Actual<br />
FY <strong>2011</strong><br />
Budget<br />
FY <strong>2011</strong><br />
Estimate<br />
FY 20<strong>12</strong><br />
Budget<br />
Percent Over<br />
FY <strong>2011</strong> Budget<br />
Wages/Salaries/Benefits $26,500,866 $27,837,822 $29,037,822 $28,679,286 3%<br />
Supplies and Contracts $3,605,221 $7,068,344 $7,020,327 $7,161,620 1%<br />
Internal Premiums $555,379 $798,613 $744,630 $6<strong>12</strong>,827 -23%<br />
Internal Service Charges $957,995 $938,024 $938,024 $922,702 -2%<br />
Operating Capital $5,000 $<strong>12</strong>2,562<br />
Work Order Credits ($864,302) ($864,302) ($834,456) -3%<br />
Total - Fire Department $31,624,461 $35,778,501 $36,876,501 $36,664,541 2%<br />
STAFFING BY PROGRAM<br />
FY 2010<br />
Actual<br />
FY <strong>2011</strong><br />
Budget<br />
FY <strong>2011</strong><br />
Estimate<br />
FY 20<strong>12</strong><br />
Budget<br />
Percent Over<br />
FY <strong>2011</strong> Budget<br />
(1000) Air-Med & Logistics Ops (HALO) 4<br />
4 4 4 0%<br />
(1000) Ambulance Services 2<br />
2 2 2 0%<br />
(1000) Fire Administration 17.5<br />
13 14 14 8%<br />
(1000) Fire Marshal's Office <strong>12</strong><br />
10 10 10 0%<br />
(1000) Fire Operations 195<br />
188 188 188 0%<br />
(1000) Fire Resource Management 6<br />
4 5 5 25%<br />
(<strong>12</strong>82) Arena - Fire Event Staffing 1<br />
1 1 1 0%<br />
(1720) Fire - Special Revenue Fund 50<br />
51 51 51 0%<br />
(2530) PS Training Ops - Fire 6<br />
6 6 6 0%<br />
Total -Fire Department 293.5 279 281 281 1%<br />
231<br />
Return to TOC
Mission and Performance Measure<br />
Police Services<br />
POLICE SERVICES<br />
Chief Steve Conrad<br />
Mission Statement:<br />
The mission <strong>of</strong> the Glendale Police Department is to protect the lives and property <strong>of</strong> the people<br />
we serve.<br />
Department Description:<br />
The Glendale Police Department is committed to preventing crime, maintaining order, and<br />
providing support to numerous events held within the <strong>city</strong>. The organization continues to<br />
emphasize the development <strong>of</strong> pr<strong>of</strong>essional knowledge and leadership skills within our ranks and<br />
retain exemplary men and women who reflect our community. Emphasis is placed on<br />
progressive, innovative techniques and emerging technologies in order to accomplish our<br />
mission. A partnership with our citizens and consistent engagement <strong>of</strong> our community allow us<br />
to formulate policing strategies that are critical to our mission. The Glendale Police Department<br />
provides the most effective possible response to law enforcement emergencies, neighborhood<br />
problems and the enforcement <strong>of</strong> traffic laws, ensuring that Glendale continues to be a desirable<br />
place to live, raise a family, educate, recreate and do business. Everything done, collectively or<br />
individually, is done in accordance with department values and objectives.<br />
FISCAL YEAR 20<strong>12</strong><br />
Goal<br />
Related Council Goal<br />
Activities<br />
Expected Outcomes<br />
(Perf. Measures)<br />
Time Commitment<br />
Expected Challenges<br />
Goal<br />
GOALS<br />
Enhance response to crime.<br />
One community focused on public safety.<br />
Identi<strong>fy</strong> and arrest more repeat <strong>of</strong>fenders.<br />
Enhance victim services and communications.<br />
Target and attack crime in “hotspots” through analysis<br />
<strong>of</strong> patterns and trends.<br />
Reduce Part I crimes by 5%. Part I crimes are those crimes<br />
that involve murder, rape, robbery, aggravated assault,<br />
burglary, theft auto theft and arson.<br />
This goal involves an ongoing time commitment. Efforts to<br />
reduce crime are a constant goal in order to improve the lives<br />
<strong>of</strong> the public.<br />
Economic conditions require the evaluation and<br />
implementation <strong>of</strong> more efficient and effective crime<br />
prevention and control strategies.<br />
Enhance community outreach.<br />
232<br />
Return to TOC
Mission and Performance Measure<br />
Police Services<br />
Related Council Goal<br />
Activities<br />
Expected Outcomes<br />
(Perf. Measures)<br />
Time Commitment<br />
Expected Challenges<br />
One community focused on public safety<br />
Increase promotion <strong>of</strong> Neighborhood Watch Groups<br />
Increase direct contact with citizens and organized<br />
citizen groups.<br />
Conduct Citizen Customer Service Survey<br />
Improve Volunteer Program participation.<br />
Increase citizen contacts through increased programming and<br />
increased participation.<br />
This goal involves an ongoing time commitment. The<br />
Glendale Police promote the Community Policing philosophy<br />
that seeks to actively involve the community in the<br />
development and application <strong>of</strong> strategies to address public<br />
safety issues.<br />
Strained resources may adversely impact the ability to<br />
dedicate desired time to outreach efforts in order to respond to<br />
priority calls for service.<br />
FISCAL YEAR <strong>2011</strong><br />
Area <strong>of</strong> Innovation:<br />
• Smart Policing Initiative – Partnering with the ASU’s Center for Violence Prevention<br />
and Community Safety with a grant from the Bureau <strong>of</strong> Justice Assistance (BJA) the<br />
department used community policing problem solving methods to target and reduce<br />
crime and disorder. Multifaceted approaches addressed neighborhood crime problems<br />
resulting in significant crime reductions.<br />
• Restructured Approach to Investigations – A Night Detective Squad was created to<br />
enhance response to high pr<strong>of</strong>ile crimes after hours. Property Crime detectives were<br />
assigned to the Patrol Divisions to improve coordination with patrol <strong>of</strong>ficers.<br />
• External Partnerships - The Criminal Investigations Division is in the process <strong>of</strong><br />
developing a formal on-going partnership with the Federal Bureau <strong>of</strong> Investigations,<br />
the U.S. Secret Service, and the U.S. Marshals Service to aide in the enhanced service<br />
to victims <strong>of</strong> crime within Glendale.<br />
• In-Car Video Cameras – A COPS Office grant enabled the installation <strong>of</strong> in-car video<br />
cameras in department patrol vehicles enhancing <strong>of</strong>ficer safety, accountability, and<br />
prosecutions.<br />
Accomplishments:<br />
• Glendale was recognized as one <strong>of</strong> the Top 10 Safest Cities in America by Forbes<br />
Mag<strong>az</strong>ine based on violent crime rates and fatal traffic accidents. Violent crime<br />
(Murder, Rape, Robbery and Aggravated Assault) declined 14% in 2010. Three <strong>of</strong><br />
four categories <strong>of</strong> Property Crime (Burglary, Auto Theft and Arson) declined 15.6%.<br />
• The Department secured three grants to assist funding replacement <strong>of</strong> the current<br />
233<br />
Return to TOC
Mission and Performance Measure<br />
Police Services<br />
CAD/RMS hardware and s<strong>of</strong>tware which are over 20 years old. Officers now have<br />
more access to information through the newly activated access to the Justice Web<br />
Interface, COPLINK and WISE-Net.<br />
• Patrol Commanders continue to meet regularly with citizen groups who act in an<br />
advisory capa<strong>city</strong> providing information and input on community concerns. Patrol<br />
Divisions host quarterly meetings with citizens to discuss crime trends and provide<br />
crime prevention options.<br />
Goal<br />
Related Council Goal<br />
Was the goal met?<br />
What were the<br />
Performance Measures?<br />
Obstacles/Challenges<br />
Goal<br />
Related Council Goal<br />
Was the goal met?<br />
What were the<br />
Performance Measures?<br />
Obstacles/Challenges<br />
GOAL UPDATES<br />
Enhance response to crime.<br />
One community focused on public safety.<br />
Yes.<br />
Violent crimes (Murder, Rape, Robbery and Aggravated Assaults)<br />
declined 14% in 2010. Property crime <strong>of</strong> Burglary, Stolen<br />
Vehicles and Arson are down by at total <strong>of</strong> 15.6%.<br />
Economic conditions required organizational and procedural<br />
changes in order to maintain services.<br />
Enhance community outreach.<br />
One community focused on public safety.<br />
Yes.<br />
Thirty seven new Neighborhood Watch groups were formed and<br />
department personnel significantly increased public contacts<br />
through meetings and presentations. Citizens contributed more<br />
then <strong>12</strong>,000 hours <strong>of</strong> service to the department.<br />
Finding new and innovative ways to engage and involve the<br />
public.<br />
FISCAL YEAR 2010<br />
Area <strong>of</strong> Innovation:<br />
• The department works diligently to provide up-to-date technology and equipment.<br />
During 2009, federal grant funding was obtained for an in-car video camera recording<br />
system that will be installed in the coming months. A number <strong>of</strong> projects were<br />
implemented to provide new access to databases <strong>of</strong> information; the Justice Web<br />
Interface provides improved access to ACIC, NLETS, NCIC and other criminal justice<br />
databases at unusual locations such as field surveillance locations, the DUI van and the<br />
stadium. Glendale joined Phoenix COPLINK – an analytical program providing<br />
central data warehouse enabling agencies to easily combine crime and intelligence data<br />
quickly. New police radios provide access to other jurisdictions such as Phoenix,<br />
234<br />
Return to TOC
Mission and Performance Measure<br />
Police Services<br />
Tolleson, Tempe, Goodyear, and many other channels throughout the Valley and the<br />
region as well as national talk channels. These combined enhancements bring vast<br />
amounts <strong>of</strong> information to the police <strong>of</strong>ficer and enables them to address crime more<br />
effectively.<br />
Accomplishments:<br />
• Overall UCR Part 1 Crime fell 7.6% in 2009 in Glendale. Violent Crime (Homicide,<br />
Rape, Robbery and Aggravated Assault) is down 13.7%; it has not been this low since<br />
1996. Property Crime (Burglary, Theft, and Auto Theft) is down 7% which returns us<br />
to 2007 levels. Priority 1, 3, 4 and 5 Calls for Service were at their lowest in 14 years.<br />
We had a second year <strong>of</strong> significant reductions in traffic collisions-the lowest in 10<br />
years. 2009 saw 1,<strong>12</strong>6 fewer victims <strong>of</strong> crime in our community compared to 2008.<br />
• Volunteers provide great value to the department and contributed over 15,000 hours <strong>of</strong><br />
time in support <strong>of</strong> our programs. This is the equivalent <strong>of</strong> about eight full time<br />
employees. Our dedicated group <strong>of</strong> 144 active volunteers (a 64% increase over 2008)<br />
provided assistance in a variety <strong>of</strong> areas including the license plate reader program,<br />
parking enforcement, sky watch, advanced <strong>of</strong>ficer training, and others. We made<br />
expansion <strong>of</strong> the reserve <strong>of</strong>ficer program a goal in 2009, intending to double the size <strong>of</strong><br />
the program which stood at eight <strong>of</strong>ficers. Seven new reserve <strong>of</strong>ficers started with the<br />
department in February 2010. Once trained, this cadre <strong>of</strong> sworn volunteers will serve<br />
in patrol, to help ensure our staffing levels remain high. Explorer Post 2469, the<br />
longest standing post in Arizona, is comprised <strong>of</strong> 33 young people who strive to<br />
someday become police <strong>of</strong>ficers. During 2009 explorers contributed 4,333 hours <strong>of</strong><br />
service to department and community events.<br />
Goal<br />
Related Council Goal<br />
Was the goal met?<br />
What were the<br />
Performance Measures?<br />
Obstacles/Challenges<br />
Goal<br />
Related Council Goal<br />
Was the goal met?<br />
What were the<br />
Performance Measures?<br />
Obstacles/Challenges<br />
GOAL UPDATES<br />
Enhance response to crime.<br />
One community focused on public safety.<br />
Yes.<br />
Larceny-theft showed a 7.1% decline<br />
The vacancy rate increased from 5.3% in 2008 to 7.8% in 2009<br />
making it a challenge to maintain adequate response to citizen<br />
requests for service.<br />
Enhance community outreach.<br />
One community focused on public safety.<br />
Yes.<br />
At least 16 new Neighborhood Watch programs were initiated in<br />
2009.<br />
None.<br />
235<br />
Return to TOC
Mission and Performance Measure<br />
Police Services<br />
requests for service.<br />
Goal<br />
Related Council Goal<br />
Was the goal met?<br />
What were the<br />
Performance Measures?<br />
Obstacles/Challenges<br />
Enhance community outreach.<br />
One community focused on public safety.<br />
Yes.<br />
At least 16 new Neighborhood Watch programs were initiated in<br />
2009.<br />
None.<br />
236<br />
Return to TOC
City <strong>of</strong> Glendale<br />
Budget Summary by Department<br />
Police Department<br />
FUND NUMBER /<br />
BUDGET BY PROGRAM<br />
FY 2010<br />
Actual<br />
FY <strong>2011</strong><br />
Budget<br />
FY <strong>2011</strong><br />
Estimate<br />
FY 20<strong>12</strong><br />
Budget<br />
Percent Over<br />
FY <strong>2011</strong> Budget<br />
(1000) Central Patrol Bureau<br />
$10,566,204 $10,515,737 $10,515,737 $10,7<strong>12</strong>,033 2%<br />
(1000) Crime Investigations<br />
$8,205,705 $8,267,040 $8,267,040 $8,487,109 3%<br />
(1000) Foothills Patrol Bureau<br />
$10,022,820 $9,724,831 $9,724,831 $10,480,476 8%<br />
(1000) PD - Communications<br />
$2,483,382 $2,364,899 $2,364,899 $2,255,017 -5%<br />
(1000) PD - Detention<br />
$2,064,559 $1,339,259 $1,339,259 $1,097,144 -18%<br />
(1000) PD - Emergency Management<br />
$0 $798,161 $798,161 $737,610 -8%<br />
(1000) PD - Fiscal Management<br />
$1,386,464 $2,568,104 $2,568,104 $2,839,755 11%<br />
(1000) PD - Special Operations<br />
$4,770,310 $4,241,005 $4,241,005 $4,460,707 5%<br />
(1000) PD - Tow Administration<br />
$103,795 $61,063 $61,063 $44,<strong>12</strong>8 -28%<br />
(1000) Police Administration<br />
$2,800,306 $2,838,805 $2,838,805 $2,377,837 -16%<br />
(1000) Police Legal Services<br />
$206,738 $145,530 $26,872 $4,467 -97%<br />
(1000) Police Personnel Management<br />
$2,619,168 $2,359,090 $2,359,090 $2,232,275 -5%<br />
(1000) Police Support Services<br />
$1,869,290 $1,335,<strong>12</strong>1 $1,335,<strong>12</strong>1 $1,330,181 0%<br />
(1000) PS Training Ctr - Police<br />
$619,583 $577,227 $577,227 $577,227 0%<br />
(<strong>12</strong>81) PD - Fiesta Bowl Event<br />
$268,<strong>12</strong>5 $401,268 $401,268 $401,268 0%<br />
(<strong>12</strong>81) Stadium - PD Event Staffing<br />
$1,501,860 $1,341,354 $1,341,354 $1,343,947 0%<br />
(<strong>12</strong>82) Arena-PD Event Staffing<br />
$495,334 $836,831 $836,831 $838,135 0%<br />
(1700) Patrol - Special Revenue Fund<br />
$9,433,739 $<strong>12</strong>,586,5<strong>12</strong> $<strong>12</strong>,586,5<strong>12</strong> $14,173,737 13%<br />
(1840) Grant Approp - Police Dept<br />
$2,032,316 $4,500,000 $4,500,000 $4,500,000 0%<br />
(1840) Victim Rights - PD<br />
$76,201 $102,667 $102,667 $104,752 2%<br />
(1840) VOCA<br />
$114,309 $117,206 $117,206 $95,482 -19%<br />
(1842) JAG Recovery Act<br />
$0 $740,863 $0 $740,863 0%<br />
(1842) PSSP Police OT Grant<br />
$0 $0 $0 $75,000 NA<br />
(1842) Stop Violence - Women<br />
$52,219 $115,978 $0 $84,742 -27%<br />
(1860) Federal RICO<br />
$26 $225,000 $225,000 $225,000 0%<br />
(1860) State RICO<br />
$1,208,209 $1,099,389 $1,099,389 $3,670,053 234%<br />
(2530) PS Training Ops - Police<br />
$309,425 $331,162 $331,162 $326,041 -2%<br />
Total - Police Department $63,210,087 $69,534,102 $68,558,603 $74,214,986 7%<br />
237<br />
Return to TOC
City <strong>of</strong> Glendale<br />
Budget Summary by Department<br />
Police Department<br />
BUDGET BY CATEGORIES<br />
OF EXPENDITURES<br />
FY 2010<br />
Actual<br />
FY <strong>2011</strong><br />
Budget<br />
FY <strong>2011</strong><br />
Estimate<br />
FY 20<strong>12</strong><br />
Budget<br />
Percent Over<br />
FY <strong>2011</strong> Budget<br />
Wages/Salaries/Benefits $52,013,657 $53,224,454 $53,105,796 $58,201,898 9%<br />
Supplies and Contracts $7,556,217 $<strong>12</strong>,348,928 $11,227,087 $14,341,705 16%<br />
Internal Premiums $2,011,231 $2,403,323 $2,403,323 $2,201,890 -8%<br />
Internal Service Charges $1,886,957 $2,382,238 $2,382,238 $2,147,695 -10%<br />
Operating Capital $115,146 $102,074 $367,074 $429,786 321%<br />
Work Order Credits ($373,<strong>12</strong>1) ($926,915) ($926,915) ($3,107,988) 235%<br />
Total - Police Department $63,210,087 $69,534,102 $68,558,603 $74,214,986 7%<br />
STAFFING BY PROGRAM<br />
FY 2010<br />
Actual<br />
FY <strong>2011</strong><br />
Budget<br />
FY <strong>2011</strong><br />
Estimate<br />
FY 20<strong>12</strong><br />
Budget<br />
Percent Over<br />
FY <strong>2011</strong> Budget<br />
(1000) Central Patrol Bureau <strong>12</strong>0<br />
<strong>12</strong>0 118 118 -2%<br />
(1000) Crime Investigations 85<br />
83 85 85 2%<br />
(1000) Foothills Patrol Bureau 116<br />
110 115 115 5%<br />
(1000) PD - Communications 35.5<br />
32.5 30.5 30.5 -6%<br />
(1000) PD - Detention 13<br />
10 9 9 -10%<br />
(1000) PD - Emergency Management 6 6 6 0%<br />
(1000) PD - Special Operations 44<br />
38 39 39 3%<br />
(1000) PD - Tow Administration 1<br />
1 1 1 0%<br />
(1000) Police Administration 26<br />
19 21 21 11%<br />
(1000) Police Legal Services 2<br />
1<br />
(1000) Police Personnel Management 29<br />
25 24 24 -4%<br />
(1000) Police Support Services 31.5<br />
19.5 24.5 24.5 26%<br />
(<strong>12</strong>81) Stadium - PD Event Staffing 2<br />
2 2 2 0%<br />
(<strong>12</strong>82) Arena-PD Event Staffing 1<br />
1 1 1 0%<br />
(1700) Patrol - Special Revenue Fund 118<br />
118 118 118 0%<br />
(1840) Victim Rights - PD 1<br />
1 1 1 0%<br />
(1840) VOCA 1<br />
1 1 1 0%<br />
(1860) State RICO 0.5<br />
0.5 0.5 0.5 0%<br />
(2530) PS Training Ops - Police 2<br />
2 2 2 0%<br />
Total -Police Department 628.5 590.5 598.5 598.5 1%<br />
238<br />
Return to TOC
City <strong>of</strong> Glendale<br />
Budget Summary by Department<br />
Homeland Security<br />
FUND NUMBER /<br />
BUDGET BY PROGRAM<br />
FY 2010<br />
Actual<br />
FY <strong>2011</strong><br />
Budget<br />
FY <strong>2011</strong><br />
Estimate<br />
FY 20<strong>12</strong><br />
Budget<br />
Percent Over<br />
FY <strong>2011</strong> Budget<br />
(1000) Emergency Operations Ctr (EOC)<br />
(1000) Homeland Security Admin.<br />
Total - Homeland Security<br />
$661,429 $0 $0 $0 NA<br />
$<strong>12</strong>0,573 $0 $0 $0 NA<br />
$782,002<br />
BUDGET BY CATEGORIES<br />
OF EXPENDITURES<br />
FY 2010<br />
Actual<br />
FY <strong>2011</strong><br />
Budget<br />
FY <strong>2011</strong><br />
Estimate<br />
FY 20<strong>12</strong><br />
Budget<br />
Percent Over<br />
FY <strong>2011</strong> Budget<br />
Wages/Salaries/Benefits $524,203<br />
Supplies and Contracts $221,337<br />
Internal Premiums $6,413<br />
Internal Service Charges $30,049<br />
Total - Homeland Security $782,002<br />
STAFFING BY PROGRAM<br />
FY 2010<br />
Actual<br />
FY <strong>2011</strong><br />
Budget<br />
FY <strong>2011</strong><br />
Estimate<br />
FY 20<strong>12</strong><br />
Budget<br />
Percent Over<br />
FY <strong>2011</strong> Budget<br />
(1000) Emergency Operations Ctr (EOC)<br />
6<br />
(1000) Homeland Security Admin.<br />
1<br />
Total -Homeland Security 7<br />
239<br />
Return to TOC
Mission and Performance Measure<br />
Engineering<br />
Public Works<br />
Engineering<br />
ENGINEERING<br />
Larry Broyles<br />
Field<br />
Operations<br />
Mission Statement:<br />
To be recognized as an important resource in developing and designing capital projects,<br />
reviewing and inspecting private development and maintaining accurate mapping and property<br />
records to successfully meet the needs <strong>of</strong> our community.<br />
Department Description:<br />
The Engineering Department ensures citizen safety and high quality <strong>of</strong> life by providing properly<br />
designed, constructed and inspected public facilities and right-<strong>of</strong>-way infrastructure. In addition,<br />
Engineering supports other <strong>city</strong> departments when undertaking capital improvement projects.<br />
The Engineering Department also oversees the <strong>city</strong>-adopted National Flood Insurance Program<br />
(NFIP), which provides flood insurance to property owners which protects them against flood<br />
losses through the Community Rating System (CRS) program. The Engineering Department<br />
enforces the floodplain management ordinances and <strong>annual</strong>ly certifies our compliance with the<br />
credited activities required to maintain a healthy CRS rating. The Engineering Department is also<br />
responsible for maintaining records <strong>of</strong> all <strong>of</strong> the <strong>city</strong>’s property, mapping <strong>of</strong> all <strong>of</strong> our<br />
infrastructure, and drawings <strong>of</strong> all <strong>of</strong> the <strong>city</strong> facilities.<br />
FISCAL YEAR 20<strong>12</strong><br />
Goal<br />
Related Council Goal<br />
Activities<br />
GOALS<br />
Deliver a Capital Improvement Program that provides<br />
accurate information, optimizes available resources, and<br />
provides needed projects for our community.<br />
One community with High Quality <strong>of</strong> Services for Citizens.<br />
• Procure and manage Engineering and Construction<br />
Consultant Services for all <strong>city</strong> departments for the<br />
<strong>city</strong>’s Capital and Operating projects.<br />
• Provide Engineering Design services for various Capital<br />
Projects.<br />
• Provide Engineering Inspections Services for various<br />
240<br />
Return to TOC
Mission and Performance Measure<br />
Engineering<br />
Expected Outcomes<br />
(Perf. Measures)<br />
Time Commitment<br />
Expected Challenges<br />
Goal<br />
Related Council Goal<br />
Activities<br />
Expected Outcomes<br />
(Perf. Measures)<br />
Time Commitment<br />
Expected Challenges<br />
Capital projects.<br />
• Provide Monthly Project Updates to department clients.<br />
• Provide Monthly Project Updates to citizens through<br />
website.<br />
• Complete 90% <strong>of</strong> the projects with an 85% and above<br />
satisfaction rating from the clients.<br />
• Complete 91% <strong>of</strong> the project updates for the website<br />
within the first five (5) days <strong>of</strong> every month.<br />
The goal is an ongoing effort; the completion <strong>of</strong> a project<br />
depends on the scope <strong>of</strong> work and it varies from three<br />
months per project to three years per project.<br />
The current reduction <strong>of</strong> personnel and capital resources<br />
could impact the timely delivery <strong>of</strong> the goal.<br />
Ensure all private development projects constructed within<br />
Glendale are reviewed in a timely manner (plan review<br />
within 20 working days and material inspection within 48<br />
hours).<br />
One community with High Quality <strong>of</strong> Services for Citizens.<br />
• Provide plan review for drainage, grading, and right <strong>of</strong><br />
way construction plans that come to the <strong>city</strong> for review.<br />
• Provide Material Testing services <strong>of</strong> soils, concrete,<br />
aggregate and asphalt.<br />
• Complete 90% <strong>of</strong> plan reviews within established<br />
timelines (20 working days)<br />
• Complete 90% <strong>of</strong> scheduled inspections within 48<br />
hours.<br />
This goal is an ongoing effort, the Engineering Department<br />
receives applications for plan reviews and material testing<br />
services year around.<br />
The Engineering Department does not expect any<br />
challenges while working towards this goal.<br />
FISCAL YEAR <strong>2011</strong><br />
Area <strong>of</strong> Innovation:<br />
• The Engineering department took the initiative to assess the possibility <strong>of</strong> providing inhouse<br />
construction inspection services to the City’s capital projects and also to other<br />
government agencies’ capital projects. This new approach, financially, has reduced the<br />
total cost <strong>of</strong> the project construction administration by using in-house staff for select<br />
capital projects. Right now, the department is providing construction inspections<br />
241<br />
Return to TOC
Mission and Performance Measure<br />
Engineering<br />
services to approximately ten <strong>of</strong> the <strong>city</strong>’s capital projects and three other governments’<br />
agencies capital projects.<br />
• The Engineering Department in conjunction with the Utilities Department is now<br />
utilizing “trenchless” technology in the rehabilitation <strong>of</strong> the <strong>city</strong>’s wastewater<br />
infrastructure. Previously when sewer lines began to deteriorate they would need to be<br />
dug up and replaced. Pipe lining technologies have now been developed to essentially<br />
create a new pipe within the existing pipe eliminating the need to dig up and replace<br />
the old pipe. Utilizing this type <strong>of</strong> rehabilitation is faster, minimizes disruptions to<br />
traffic, and limits service outages to residents.<br />
• The Engineering Department is participating in two Innovate projects: Certificate <strong>of</strong><br />
Occupancy Process and Procurement Realignment. These projects are still ongoing.<br />
Accomplishments:<br />
• This fiscal year, the Engineering Department completed several capital projects<br />
including: Northern Ave. Storm Drain and Raw Waterline (47th Ave. – 63rd); Bell Rd.<br />
Rubberized Asphalt Overlay (59th-70th) ; Glendale Municipal Landfill Traffic Signal,<br />
Glendale Avenue Overlay (51st-66th); Glendale Avenue Drainage Improvements,<br />
Centerline Project; Lamar and Cholla Vista Housing; O’Neil Park Improvements; Fire<br />
Station Ventilation System; Some Facilities Renovation Projects; Multiuse Skunk<br />
Creek/Union Hill project; Main Library Lighting Study and Improvements project.;<br />
2010 Pool Upgrades and Repairs; 65th Ave. Maryland, Tuckey and McClellan Rd.<br />
Project; Bethany Home Outfall/Storm Drain (Camelback Ave. 75th-59th Ave.).<br />
Goal<br />
Related Council Goal<br />
Was the goal met?<br />
What were the<br />
Performance Measures?<br />
Obstacles/Challenges<br />
Goal<br />
Related Council Goal<br />
Was the goal met?<br />
What were the<br />
Performance Measures?<br />
Obstacles/Challenges<br />
GOAL UPDATES<br />
Provide a capital improvement program that assures accurate<br />
information, optimizes available resources and provides needed<br />
projects for our community.<br />
One community with high quality services for citizens.<br />
Yes. We completed approximately 25 projects.<br />
Completed 91% <strong>of</strong> the projects with 85% and above satisfaction<br />
rating from our department’s clients.<br />
None.<br />
Ensure all private development projects constructed within<br />
Glendale are reviewed in a timely manner.<br />
One community with high quality services for citizens.<br />
Yes.<br />
Complete 90% <strong>of</strong> plan reviews within established timelines (20<br />
working days) and complete 90% <strong>of</strong> scheduled testing services<br />
inspections within 48 hrs.<br />
None.<br />
242<br />
Return to TOC
Mission and Performance Measure<br />
Engineering<br />
FISCAL YEAR 2010<br />
Area <strong>of</strong> Innovation:<br />
• Project control group in coordination with the administrative support staff developed a<br />
new engineering payment review process. This new process has reduced the time <strong>of</strong><br />
payment review from 10-<strong>12</strong> days to 5-7 days. It also encouraged the Finance<br />
Department to review their process and reduce the time it takes to process payments.<br />
• The CIP Division developed a new process to monitor and ensure that on a monthly<br />
basis, our clients and project managers are updated on warranty schedules for each <strong>of</strong><br />
their completed projects. This new process has increased the communication between<br />
the client and the project manager before the warranty expires and gives the<br />
opportunity for the client to participate in the final inspection.<br />
• Project control group developed a new process to monitor and ensure that on a monthly<br />
basis, we will review the status <strong>of</strong> the purchase orders. On completed projects and<br />
coordinate the closure <strong>of</strong> those purchase orders. This new process has significantly<br />
reduced the time and amount <strong>of</strong> funds encumbered on complete projects.<br />
• The Engineering Department took the initiative to assess the possibility <strong>of</strong> providing<br />
in-house consultant services. This new approach, financially, has reduced the total cost<br />
<strong>of</strong> the project design and construction administration by using in-house staff for select<br />
engineering tasks.<br />
• The CIP Division developed a new process to monitor and ensure that, on a monthly<br />
basis, our clients and project managers are updated on warranty schedules for each <strong>of</strong><br />
their completed projects. This new process has increased the communication between<br />
the client and the project manager before the warranty expires and gives the<br />
opportunity for the client to participate in the final inspection.<br />
• The project control group developed a new process to monitor and ensure that on a<br />
monthly basis, we will review the status <strong>of</strong> purchase orders on completed projects and<br />
coordinate the closure <strong>of</strong> those purchase orders. This new process has significantly<br />
reduced the time and amount <strong>of</strong> funds encumbered on complete projects.<br />
Accomplishments:<br />
• During fiscal year 09-10 the Engineering Department completed several projects<br />
including: the construction <strong>of</strong> the Catlin Court Alley; the street improvements on the<br />
59th Avenue Melinda to Pinnacle Peak Road; the intersection improvements on 67th<br />
Olive to Bell Rd. ; the relocation <strong>of</strong> Fire Station No. 151; the downtown pedestrian<br />
enhancements project; the 67th Avenue Thunderbird Paseo Park restoration; the<br />
landfill gas system expansion; construction <strong>of</strong> Cholla Telemetry/Radio Telemetry;<br />
Arterial Street Overlay/Pavement Management project; and the widening <strong>of</strong> 95th Ave.<br />
Glendale to Cabela; The Western Area Regional Park; the Glenn Drive Improvements<br />
57th Ave. to 57th Drive and the Sahuaro Ranch Historic Area Restrooms<br />
improvements.<br />
243<br />
Return to TOC
Mission and Performance Measure<br />
Engineering<br />
Goal<br />
Related Council Goal<br />
Was the goal met?<br />
What were the<br />
Performance Measures?<br />
Obstacles/Challenges<br />
Goal<br />
Related Council Goal<br />
Was the goal met?<br />
What were the<br />
Performance Measures?<br />
Obstacles/Challenges<br />
GOAL UPDATES<br />
Provide a capital improvement program (CIP) that assures<br />
accurate information, optimizes available resources and provides<br />
needed projects for our community.<br />
One community with high quality services for citizens.<br />
Yes.<br />
Completed 91% <strong>of</strong> the projects with 85% and above satisfaction<br />
rating from our department’s clients.<br />
None.<br />
Ensure all private development projects constructed within<br />
Glendale are reviewed in a timely manner.<br />
One community with high quality services for citizens.<br />
Yes.<br />
Complete 90% <strong>of</strong> plan reviews within established timelines (20<br />
working days) and complete 90% <strong>of</strong> scheduled testing services<br />
inspections within 48 hrs.<br />
None.<br />
244<br />
Return to TOC
City <strong>of</strong> Glendale<br />
Budget Summary by Department<br />
Engineering<br />
FUND NUMBER /<br />
BUDGET BY PROGRAM<br />
FY 2010<br />
Actual<br />
FY <strong>2011</strong><br />
Budget<br />
FY <strong>2011</strong><br />
Estimate<br />
FY 20<strong>12</strong><br />
Budget<br />
Percent Over<br />
FY <strong>2011</strong> Budget<br />
(1000) B<strong>of</strong>A Bank Building<br />
$305,358 $256,579 $256,579 $256,579 0%<br />
(1000) CIP Administration<br />
$607,589 $274,490 $274,490 $229,987 -16%<br />
(1000) Construction Inspection<br />
$552,304 $382,291 $382,291 $4<strong>12</strong>,707 8%<br />
(1000) Engineering Administration<br />
$601,494 $553,251 $552,251 $584,296 6%<br />
(1000) Land Development Division<br />
$468,433 $483,917 $483,917 $306,881 -37%<br />
(1000) Mapping and Records<br />
$181,003 $101,869 $101,869 $96,327 -5%<br />
(1000) Materials Testing<br />
$190,789 $181,996 $181,996 $225,901 24%<br />
(1000) Promenade at Palmaire<br />
$57,781 $56,400 $56,400 $56,400 0%<br />
(1000) Utility Inspection<br />
$222,986 $142,281 $142,281 $13,622 -90%<br />
Total - Engineering $3,187,737 $2,433,074 $2,432,074 $2,182,700 -10%<br />
BUDGET BY CATEGORIES<br />
OF EXPENDITURES<br />
FY 2010<br />
Actual<br />
FY <strong>2011</strong><br />
Budget<br />
FY <strong>2011</strong><br />
Estimate<br />
FY 20<strong>12</strong><br />
Budget<br />
Percent Over<br />
FY <strong>2011</strong> Budget<br />
Wages/Salaries/Benefits $3,231,750 $2,6<strong>12</strong>,283 $2,6<strong>12</strong>,283 $2,502,804 -4%<br />
Supplies and Contracts $489,177 $468,049 $467,049 $454,980 -3%<br />
Internal Premiums $75,391 $80,713 $80,713 $64,200 -20%<br />
Internal Service Charges $55,253 $72,020 $72,020 $52,357 -27%<br />
Work Order Credits ($663,834) ($799,991) ($799,991) ($891,641) 11%<br />
Total - Engineering $3,187,737 $2,433,074 $2,432,074 $2,182,700 -10%<br />
STAFFING BY PROGRAM<br />
FY 2010<br />
Actual<br />
FY <strong>2011</strong><br />
Budget<br />
FY <strong>2011</strong><br />
Estimate<br />
FY 20<strong>12</strong><br />
Budget<br />
Percent Over<br />
FY <strong>2011</strong> Budget<br />
(1000) CIP Administration 15<br />
9 9 9 0%<br />
(1000) Construction Inspection 7<br />
4 5 5 25%<br />
(1000) Engineering Administration 7<br />
5 6 6 20%<br />
(1000) Land Development Division 5<br />
5 3 3 -40%<br />
(1000) Mapping and Records 2<br />
1 1 1 0%<br />
(1000) Materials Testing 3<br />
2 3 3 50%<br />
(1000) Utility Inspection 3<br />
2<br />
(1660) Transportation Engineering Pgm<br />
1<br />
Total -Engineering 43 28 27 27 -4%<br />
245<br />
Return to TOC
Mission and Performance Measure<br />
Field Operations<br />
Public Works<br />
Engineering<br />
Field<br />
Operations<br />
FIELD OPERATIONS<br />
Stuart Kent<br />
Mission Statement:<br />
A partnership <strong>of</strong> employees and community working together to create a better quality <strong>of</strong> life for<br />
Glendale.<br />
Department Description:<br />
The Field Operations Department provides essential services that directly impact the community<br />
and provides support to other departments within the organization. The department’s core<br />
functions include: Solid Waste Collection for residential and commercial customers, curbside<br />
recycling for single-family homes, household h<strong>az</strong>ardous waste pick-up, and residential loose<br />
trash collection and street sweeping. Solid Waste Disposal services are provided at the Glendale<br />
Municipal Landfill and Materials Recovery Facility. Street Maintenance functions include street<br />
and concrete repair, right-<strong>of</strong>-way beautification, and graffiti removal, as well as burial services at<br />
the Glendale Memorial Cemetery. Equipment Management maintains a fleet <strong>of</strong> over 1,200 <strong>city</strong><br />
vehicles allowing police, fire, streets, sanitation, utilities and other <strong>city</strong> services to be provided to<br />
the community. Facilities Management maintains over 102 buildings totaling approximately 1.8<br />
million gross square feet so that customers and <strong>city</strong> employees can conduct business in a clean<br />
and pr<strong>of</strong>essional setting. Administrative Services provides leadership and pr<strong>of</strong>essional support<br />
to the department’s internal operations, and interacts with City Council, <strong>city</strong> departments, the<br />
community, and other governmental agencies and public entities.<br />
FISCAL YEAR 20<strong>12</strong><br />
Goal<br />
Related Council Goal<br />
Activities<br />
GOALS<br />
Increase fleet fuel efficiency.<br />
One community that is fiscally sound.<br />
1)Perform preventative maintenance on schedule.<br />
2)Maintain proper tire pressures.<br />
3)Improve on fuel reporting accuracy.<br />
4)Reduce vehicle idling time.<br />
246<br />
Return to TOC
Mission and Performance Measure<br />
Field Operations<br />
Expected Outcomes<br />
(Perf. Measures)<br />
Time Commitment<br />
Expected Challenges<br />
Goal<br />
Related Council Goal<br />
Activities<br />
Expected Outcomes<br />
(Perf. Measures)<br />
Time Commitment<br />
Expected Challenges<br />
Goal<br />
Related Council Goal<br />
Activities<br />
Expected Outcomes<br />
(Perf. Measures)<br />
Time Commitment<br />
5)Increase use <strong>of</strong> Motor Pool operations.<br />
6)Purchase new fuel efficient vehicles.<br />
5% reduction in total fuel used, approximately 37,000 gallons<br />
<strong>annual</strong>ly.<br />
Ongoing - goal requires work throughout the year and will be<br />
evaluated monthly.<br />
1) Maintaining fuel reporting accuracy with older fuel dispensing<br />
and tracking equipment that requires regular monitoring and<br />
adjustment.<br />
2) Educating fleet vehicle users to encourage support <strong>of</strong> ongoing<br />
fleet fuel reduction initiatives.<br />
Reduce costs <strong>of</strong> solid waste collection operations without<br />
compromising the high level <strong>of</strong> service provided.<br />
One community with high-quality services for citizens.<br />
Analyze routes using tools such as GPS technology and the Landfill<br />
scale system to determine efficiency <strong>of</strong> routing and customer<br />
distribution throughout the <strong>city</strong>.<br />
Supervisors and Superintendent will review internal operational<br />
reports, expenditures, and customer comments to evaluate progress<br />
toward the goal. By maximizing route efficiencies and eliminating<br />
redundancies, the division can realize potential savings in fuel, labor<br />
and equipment O&M.<br />
This will be an ongoing effort and should continue even after the<br />
initial changes are made to ensure that the division is reaching<br />
maximum savings potential.<br />
Equipment Operators will need to learn new routes and new business<br />
practices.<br />
Manage the <strong>city</strong>’s pavement infrastructure through ongoing<br />
maintenance and repair <strong>of</strong> up to twenty-one miles <strong>of</strong><br />
collector/residential streets.<br />
One community with high-quality services for citizens.<br />
Complete all localized asphalt repairs, the sealing <strong>of</strong> surface cracks<br />
and the application <strong>of</strong> a full width surface treatment.<br />
Complete preparation and surface treatment <strong>of</strong> up to twenty-one<br />
miles <strong>of</strong> collector/residential streets. Surface treatments exted the<br />
useful life <strong>of</strong> roadways and provide a smooth surface for motorists.<br />
The surface treatment and all <strong>of</strong> the preparatory activities are<br />
expected to be completed by the end <strong>of</strong> the fiscal year. As an<br />
ongoing effort, some activities are performed in a given year in<br />
preparation for projects taking place the following year.<br />
247<br />
Return to TOC
Mission and Performance Measure<br />
Field Operations<br />
Expected Challenges<br />
Coordination <strong>of</strong> staff and contractor activities to provide a timely and<br />
minimally intrusive service for the residents.<br />
FISCAL YEAR <strong>2011</strong><br />
Area <strong>of</strong> Innovation:<br />
• As a result <strong>of</strong> the Innovate Process, the Equipment Management division consolidated<br />
the vehicle replacement fund database with the fleet management system to eliminate a<br />
need to enter duplicate information in multiple systems. The change reduces the time<br />
needed to process new vehicles and the possibility <strong>of</strong> input errors.<br />
• Solid Waste Collection is utilizing GPS technology on the sanitation fleet to achieve<br />
operational efficiencies and cost savings.<br />
• Effective April 4, <strong>2011</strong>, the Materials Recovery Facility (MRF) expanded the list <strong>of</strong><br />
accepted recyclable items to include any plastic that is marked as a 1-7. The MRF is<br />
able to add plastics # 3-7 to the processing line without making any modifications to<br />
the existing equipment. This change in business practice will allow residents to place<br />
more recyclable items into their cans and save valuable landfill space.<br />
Accomplishments:<br />
• Equipment Management effectively maintained the City Fleet with a 20% reduction in<br />
shop staffing. Fleet vehicle availably remained high and <strong>annual</strong> fleet maintenance<br />
costs were reduced by over $300,000. Additionally, the division fully implemented the<br />
operation <strong>of</strong> 22 Motor Pool vehicles at two locations. The establishment <strong>of</strong> the Motor<br />
Pool was instrumental in allowing departments to turn in over 100 vehicles as part <strong>of</strong><br />
on-going <strong>budget</strong> reductions.<br />
• New technology has allowed for improved Sanitation fleet management resulting in<br />
fewer miles driven, increased customer service and overall fuel savings. This new<br />
technology has contributed to a 4% decrease in miles driven and 7% less fuel being<br />
used. Essentially, sanitation has been able to service the same community driving<br />
approximately 50,000 fewer miles and using 30,000 fewer gallons <strong>of</strong> gas through<br />
identified route efficiencies and revised collection practices. The technology has also<br />
allowed for fewer missed containers and streets during collections, resulting in fewer<br />
customer complaints. Operational improvements have contributed to a fuel cost<br />
savings <strong>of</strong> approximately $96,000.<br />
• In November 2010, the Landfill/MRF division completed the landfill entrance<br />
signalization project. The improvement allows traffic to safely enter the landfill with a<br />
deceleration lane and a safe exit from the landfill with a traffic signal.<br />
• Streets completed the asphalt overlay <strong>of</strong> a small group <strong>of</strong> residential streets using<br />
Community Development Block Grant funding(CDBG).<br />
248<br />
Return to TOC
Mission and Performance Measure<br />
Field Operations<br />
Goal<br />
Related Council Goal<br />
Was the goal met?<br />
What were the Performance<br />
Measures?<br />
Obstacles/Challenges<br />
Goal<br />
Related Council Goal<br />
Was the goal met?<br />
What were the Performance<br />
Measures?<br />
Obstacles/Challenges<br />
GOAL UPDATES<br />
Reduce contamination received by recycling facility.<br />
One community for high quality services for citizens.<br />
No.<br />
Recycling contamination rate is reviewed each month in<br />
conjunction with MRF processing operations.<br />
Recycling contamination has seemed to increase in<br />
conjunction with the current economic conditions as<br />
homeowners/tenants use recycling containers for refuse as<br />
they vacate residences.<br />
Complete an audit <strong>of</strong> the vehicle replacement fund to<br />
evaluate sustainability and financial health.<br />
One community that is fiscally sound.<br />
Goal is on hold pending funding availability.<br />
Review recommendations <strong>of</strong> audit report.<br />
Funding is not available for the foreseeable future.<br />
FISCAL YEAR 2010<br />
Area <strong>of</strong> Innovation:<br />
• By consolidating our vehicle maintenance staff from two shifts to one shift we will<br />
save $40,000 <strong>annual</strong>ly in electri<strong>city</strong> costs and we have enhanced service for customers<br />
during the week and on weekends.<br />
Accomplishments:<br />
• Completion <strong>of</strong> the landfill gas to energy project allows for renewable methane gas to<br />
be used to generate electri<strong>city</strong> and the <strong>city</strong> will receive $50,000 <strong>annual</strong>ly through the<br />
agreement.<br />
• Development <strong>of</strong> a motor pool program that allowed overall fleet reduction <strong>of</strong> 80<br />
vehicles while providing access to vehicles to departments that had intermittent need to<br />
operate vehicles. Results in reduced capital replacement cost <strong>of</strong> $1.2 million over next<br />
seven years.<br />
249<br />
Return to TOC
Mission and Performance Measure<br />
Field Operations<br />
Goal<br />
Related Council Goal<br />
Was the goal met?<br />
What were the<br />
Performance Measures?<br />
Obstacles/Challenges<br />
Goal<br />
Related Council Goal<br />
Was the goal met?<br />
What were the<br />
Performance Measures?<br />
Obstacles/Challenges<br />
GOAL UPDATES<br />
Complete a comprehensive needs analysis and cost evaluation<br />
associated with proposed improvements including reconfiguration<br />
<strong>of</strong> landfill entrance roadway (Phase II) and relocation <strong>of</strong> the scale<br />
house and administrative facilities.<br />
One community with high quality services for citizens.<br />
Design <strong>of</strong> the new entrance feature completed in April 2010,<br />
construction expected to be completed December 2010.<br />
Could the design improve safety for entrance and exiting site,<br />
incorporate needs <strong>of</strong> GRPSTC to access signal.<br />
Staging <strong>of</strong> work was critical to keep operation running through<br />
construction period. Design took longer than anticipated thereby<br />
delaying completion.<br />
Integrate motor pool vehicles into equipment management<br />
operations in order to reduce fleet operational cost by elimination<br />
<strong>of</strong> cost inefficient, low usage vehicles within the <strong>city</strong>.<br />
One community that is fiscally sound.<br />
Over 80 vehicles eliminated resulting in operational and<br />
maintenance savings and over $1.2 million in capital replacement<br />
cost over next seven years.<br />
Vehicles were turned in, motor pool developed for City Hall and<br />
Field Operations areas. Other departments completed similar<br />
reductions on take home vehicles and staff cars<br />
Identi<strong>fy</strong>ing unique vehicles that may be specialized and working<br />
on how such vehicles can be shared.<br />
250<br />
Return to TOC
City <strong>of</strong> Glendale<br />
Budget Summary by Department<br />
Field Operations<br />
FUND NUMBER /<br />
BUDGET BY PROGRAM<br />
FY 2010<br />
Actual<br />
FY <strong>2011</strong><br />
Budget<br />
FY <strong>2011</strong><br />
Estimate<br />
FY 20<strong>12</strong><br />
Budget<br />
Percent Over<br />
FY <strong>2011</strong> Budget<br />
(1000) Cemetery<br />
$207,580 $233,250 $233,250 $221,401 -5%<br />
(1000) Custodial Services<br />
$1,130,293 $1,043,615 $1,043,615 $890,900 -15%<br />
(1000) Downtown Parking Garage<br />
$80,639 $102,859 $102,859 $82,859 -19%<br />
(1000) Facilities Management<br />
$4,538,627 $3,361,963 $3,361,963 $3,774,973 <strong>12</strong>%<br />
(1000) Field Operations Admin.<br />
$1,030,030 $627,170 $627,170 $610,971 -3%<br />
(1000) Graffiti Removal<br />
$236,002 $292,797 $292,797 $234,496 -20%<br />
(1000) Manistee Ranch Maintenance<br />
$4,908 $5,113 $5,113 $5,113 0%<br />
(1040) Equipment Management<br />
$3,8<strong>12</strong>,363 $3,959,223 $3,993,158 $3,810,623 -4%<br />
(1040) Fuel Services<br />
$2,740,215 $3,303,176 $3,269,241 $3,303,029 0%<br />
(1040) Parts Store Operations<br />
$1,375,625 $1,818,371 $1,818,371 $1,820,397 0%<br />
(1<strong>12</strong>0) Equipment Replacement<br />
$1,762,518 $3,029,741 $2,959,741 $3,029,742 0%<br />
(<strong>12</strong>80) YSC - Facilities Mgt.<br />
$52,485 $65,000 $65,000 $60,000 -8%<br />
(<strong>12</strong>82) Arena - ROW Maintenance<br />
$35,574 $49,966 $49,966 $49,966 0%<br />
(1340) Right-<strong>of</strong>-Way Maintenance<br />
$2,294,458 $2,026,279 $2,116,279 $2,084,<strong>12</strong>3 3%<br />
(1340) Street Cleaning<br />
$141,603 $0 $0 $0 NA<br />
(1340) Street Maintenance<br />
$2,850,276 $2,687,943 $2,597,943 $2,350,017 -13%<br />
(2440) Gas Management System<br />
$139,306 $169,400 $169,400 $169,400 0%<br />
(2440) Landfill<br />
$4,079,685 $2,926,869 $3,<strong>12</strong>1,513 $3,162,699 8%<br />
(2440) MRF Operations<br />
$1,800,754 $2,223,685 $1,764,571 $2,021,336 -9%<br />
(2440) Recycling<br />
$772,004 $940,620 $904,328 $937,523 0%<br />
(2440) Solid Waste Admin<br />
$578,055 $782,455 $787,207 $808,184 3%<br />
(2480) Curb Service<br />
$6,624,900 $6,960,004 $6,960,004 $7,548,223 8%<br />
(2480) Residential-Loose Trash Collec<br />
$2,402,881 $2,500,010 $2,551,090 $2,802,234 <strong>12</strong>%<br />
(2480) Sanitation Frontload<br />
$3,132,858 $3,493,979 $3,493,979 $3,435,176 -2%<br />
(2480) Sanitation Roll-<strong>of</strong>f<br />
$713,495 $939,201 $863,893 $795,098 -15%<br />
(2530) PS Training Ops - Fac. Mgmt.<br />
$513,955 $353,664 $353,664 $455,462 29%<br />
Total - Field Operations $43,051,089 $43,896,353 $43,506,115 $44,463,945 1%<br />
251<br />
Return to TOC
City <strong>of</strong> Glendale<br />
Budget Summary by Department<br />
Field Operations<br />
BUDGET BY CATEGORIES<br />
OF EXPENDITURES<br />
FY 2010<br />
Actual<br />
FY <strong>2011</strong><br />
Budget<br />
FY <strong>2011</strong><br />
Estimate<br />
FY 20<strong>12</strong><br />
Budget<br />
Percent Over<br />
FY <strong>2011</strong> Budget<br />
Wages/Salaries/Benefits $15,888,979 $15,400,117 $15,376,778 $14,960,539 -3%<br />
Supplies and Contracts $15,637,452 $15,733,834 $15,443,074 $15,630,328 -1%<br />
Internal Premiums $754,618 $806,039 $806,039 $789,517 -2%<br />
Internal Service Charges $9,043,192 $9,736,704 $9,660,565 $10,787,974 11%<br />
Operating Capital $1,734,211 $2,884,741 $2,884,741 $2,954,742 2%<br />
Work Order Credits ($7,363) ($665,082) ($665,082) ($659,155) -1%<br />
Total - Field Operations $43,051,089 $43,896,353 $43,506,115 $44,463,945 1%<br />
STAFFING BY PROGRAM<br />
FY 2010<br />
Actual<br />
FY <strong>2011</strong><br />
Budget<br />
FY <strong>2011</strong><br />
Estimate<br />
FY 20<strong>12</strong><br />
Budget<br />
Percent Over<br />
FY <strong>2011</strong> Budget<br />
(1000) Cemetery 2<br />
2 2 2 0%<br />
(1000) Custodial Services 20<br />
18 15 15 -17%<br />
(1000) Facilities Management 21<br />
17 16 16 -6%<br />
(1000) Field Operations Admin. 8<br />
2 2 2 0%<br />
(1000) Graffiti Removal 4<br />
3 3 3 0%<br />
(1040) Equipment Management 40<br />
36 33 33 -8%<br />
(1040) Parts Store Operations 1<br />
1 1 1 0%<br />
(1340) Right-<strong>of</strong>-Way Maintenance 16<br />
13 13 13 0%<br />
(1340) Street Cleaning<br />
3<br />
(1340) Street Maintenance 35<br />
28 27 27 -4%<br />
(2440) Landfill 19<br />
19 19 19 0%<br />
(2440) MRF Operations 11<br />
11 11 11 0%<br />
(2440) Recycling 6<br />
6 6 6 0%<br />
(2440) Solid Waste Admin 5<br />
8 8 8 0%<br />
(2480) Curb Service 40<br />
40 40 40 0%<br />
(2480) Residential-Loose Trash Collec 20<br />
21 21 21 0%<br />
(2480) Sanitation Frontload 15<br />
15 15 15 0%<br />
(2480) Sanitation Roll-<strong>of</strong>f 5<br />
4 3 3 -25%<br />
(2530) PS Training Ops - Fac. Mgmt. 4<br />
2 4 4 100%<br />
Total -Field Operations 275 246 239 239 -3%<br />
252<br />
Return to TOC
City <strong>of</strong> Glendale<br />
Budget Summary by Department<br />
Public Works Admin.<br />
FUND NUMBER /<br />
BUDGET BY PROGRAM<br />
FY 2010<br />
Actual<br />
FY <strong>2011</strong><br />
Budget<br />
FY <strong>2011</strong><br />
Estimate<br />
FY 20<strong>12</strong><br />
Budget<br />
Percent Over<br />
FY <strong>2011</strong> Budget<br />
(1000) Public Works Administration<br />
Total - Public Works Admin.<br />
$198,962 $198,<strong>12</strong>5 $198,<strong>12</strong>5 $0 -100%<br />
$198,962 $198,<strong>12</strong>5 $198,<strong>12</strong>5<br />
BUDGET BY CATEGORIES<br />
OF EXPENDITURES<br />
FY 2010<br />
Actual<br />
FY <strong>2011</strong><br />
Budget<br />
FY <strong>2011</strong><br />
Estimate<br />
FY 20<strong>12</strong><br />
Budget<br />
Percent Over<br />
FY <strong>2011</strong> Budget<br />
Wages/Salaries/Benefits $195,815 $201,564 $201,564<br />
Supplies and Contracts $665 $5,026 $5,026<br />
Internal Premiums $1,232 $1,266 $1,266<br />
Internal Service Charges $1,250 $1,267 $1,267<br />
Work Order Credits ($10,998) ($10,998)<br />
Total - Public Works Admin. $198,962 $198,<strong>12</strong>5 $198,<strong>12</strong>5<br />
STAFFING BY PROGRAM<br />
FY 2010<br />
Actual<br />
FY <strong>2011</strong><br />
Budget<br />
FY <strong>2011</strong><br />
Estimate<br />
FY 20<strong>12</strong><br />
Budget<br />
Percent Over<br />
FY <strong>2011</strong> Budget<br />
(1000) Public Works Administration 1<br />
1<br />
Total -Public Works Admin. 1 1<br />
253<br />
Return to TOC
Mission and Performance Measure<br />
Technology & Innovation<br />
TECHNOLOGY & INNOVATION<br />
Chuck Murphy<br />
Mission Statement:<br />
Provide maximum value to the <strong>city</strong> through the implementation <strong>of</strong> agile and cost effective<br />
solutions that improve service, reduce costs and leverage information across <strong>city</strong> departments.<br />
Department Description:<br />
The Information Technology Department (ITD) supports the City’s technology infrastructure<br />
such as application support, network, data services, email, and telephony. ITD also supports the<br />
enhancement <strong>of</strong> business processes through the use <strong>of</strong> the LEAN methodology blended with the<br />
appropriate application <strong>of</strong> technology.<br />
FISCAL YEAR 20<strong>12</strong><br />
Goal<br />
Related Council Goal<br />
Activities<br />
Expected Outcomes<br />
(Perf. Measures)<br />
Time Commitment<br />
Expected Challenges<br />
Goal<br />
Related Council Goal<br />
Activities<br />
GOALS<br />
Support the Police Department with the implementation <strong>of</strong> a<br />
new records management and computer aided dispatch<br />
system.<br />
One community committed to public safety.<br />
• Provide IT technical resources according to project<br />
plans.<br />
• Provide support with contract negotiations and review.<br />
• Complete contract review by 10/31/<strong>2011</strong>.<br />
• Complete other tasks in accordance with projects<br />
timelines and due dates.<br />
This is a very large project that will require extensive<br />
resources. Since it is in the initial stages, the project time line<br />
has not been established.<br />
The project integrates with several existing applications that<br />
will require significant technical resources that have yet to be<br />
identified.<br />
Develop 2013-2017 Information Technology Strategic Plan<br />
One community that is fiscally sound<br />
• Work with departments to understand new business<br />
processes resulting from reorganization and LEAN.<br />
• Blend emerging technology trends with City<br />
operations to effectively enhance service provision.<br />
• Incorporate the Innovate program into the plan.<br />
254<br />
Return to TOC
Mission and Performance Measure<br />
Technology & Innovation<br />
Expected Outcomes<br />
(Perf. Measures)<br />
Time Commitment<br />
Expected Challenges<br />
Complete research for plan by June 30, 20<strong>12</strong><br />
The time commitment is substantial as departments are<br />
expected to revamp business processes concurrent with the<br />
ITD plan development.<br />
Since technology changes so quickly, it is always a challenge<br />
to develop a multi-year plan that is not quickly obsolete.<br />
FISCAL YEAR <strong>2011</strong><br />
Area <strong>of</strong> Innovation:<br />
• Service Desk staff have been replacing faulty capacitors as opposed to replacing<br />
expensive mother boards. This has saved the City approximately $29,000.<br />
Accomplishments:<br />
• Supported the Finance Department with the sales tax system implementation.<br />
• Partnered with the Police Department with the development <strong>of</strong> an RFP for their new<br />
computer aided dispatch and records management systems.<br />
Goal<br />
Related Council Goal<br />
Was the goal met?<br />
What were the<br />
Performance Measures?<br />
Obstacles/Challenges<br />
Goal<br />
Related Council Goal<br />
Was the goal met?<br />
What were the<br />
Performance Measures?<br />
Obstacles/Challenges<br />
GOAL UPDATES<br />
Explore and evaluate productivity solutions i.e. Micros<strong>of</strong>t Office,<br />
Open Office, etc.<br />
One community that is fiscally sound.<br />
IT met with Google and Micros<strong>of</strong>t in regards to their product<br />
<strong>of</strong>ferings. Due to product release dates being delayed, the<br />
selection process will continue into early summer.<br />
Select new solution by June 30, <strong>2011</strong>.<br />
Micros<strong>of</strong>t has new product <strong>of</strong>ferings, which will not be available<br />
until summer <strong>2011</strong>. This has made it difficult to make a final<br />
decision.<br />
Evaluate data back-up and email archiving solutions.<br />
One community that is fiscally sound.<br />
Yes. New solutions were selected.<br />
The <strong>annual</strong> savings by making this change is approximately<br />
$69,000.<br />
There were not any obstacles or changes.<br />
255<br />
Return to TOC
Mission and Performance Measure<br />
Technology & Innovation<br />
FISCAL YEAR 2010<br />
Area <strong>of</strong> Innovation:<br />
• An employee resources portal was developed to give employees easy access to<br />
information when they are away from the <strong>of</strong>fice. Access to myHR, webmail, the<br />
employee phone <strong>book</strong>, phone list <strong>of</strong> essential numbers, and instructions such as Virtual<br />
Private Network (VPN), voicemail, and the telephone user guide are included in the<br />
portal.<br />
Accomplishments:<br />
• IT has several accomplishments in FY 2010. Some <strong>of</strong> these include implementation <strong>of</strong><br />
new antivirus s<strong>of</strong>tware, completion <strong>of</strong> a telephone system upgrade, PeopleS<strong>of</strong>t<br />
Financials Upgrade, development <strong>of</strong> an online application for tax amnesty and email<br />
system upgrade.<br />
Goal<br />
Related Council Goal<br />
Was the goal met?<br />
What were the<br />
Performance Measures?<br />
Obstacles/Challenges<br />
Goal<br />
Related Council Goal<br />
Was the goal met?<br />
What were the<br />
Performance Measures?<br />
Obstacles/Challenges<br />
GOAL UPDATES<br />
Support the Finance Department and <strong>city</strong> with the selection and<br />
implementation <strong>of</strong> a new sales tax system.<br />
One community that is fiscally sound.<br />
Partially, IT has supported and continues to support the<br />
implementation <strong>of</strong> a new sales tax system, which is slated to go<br />
live in Fall 2010.<br />
• Attend all meetings; provide information and leadership<br />
for IT’s involvement in the project.<br />
• Installation and configuration <strong>of</strong> hardware, operating<br />
system and database s<strong>of</strong>tware that meets the service levels<br />
defined by Finance.<br />
Balancing resources with other projects and day-to-day operations.<br />
Deliver additional functionality to PeopleS<strong>of</strong>t’s ePay module.<br />
One community that is fiscally sound.<br />
Yes, employees have been able to see their paychecks online since<br />
December 2009.<br />
Completed implementation by <strong>12</strong>/31/09.<br />
Supporting time and labor post go-live demands and other<br />
PeopleS<strong>of</strong>t requests.<br />
256<br />
Return to TOC
City <strong>of</strong> Glendale<br />
Budget Summary by Department<br />
Info. Technology<br />
FUND NUMBER /<br />
BUDGET BY PROGRAM<br />
FY 2010<br />
Actual<br />
FY <strong>2011</strong><br />
Budget<br />
FY <strong>2011</strong><br />
Estimate<br />
FY 20<strong>12</strong><br />
Budget<br />
Percent Over<br />
FY <strong>2011</strong> Budget<br />
(1000) Information Technology<br />
$3,520,751 $3,048,826 $3,048,826 $2,757,188 -10%<br />
(1100) Telephones<br />
$1,278,946 $977,252 $977,252 $979,324 0%<br />
(1140) Technology Replacement<br />
$1,365,233 $3,510,103 $2,208,764 $3,511,584 0%<br />
Total - Info. Technology $6,164,930 $7,536,181 $6,234,842 $7,248,096 -4%<br />
BUDGET BY CATEGORIES<br />
OF EXPENDITURES<br />
FY 2010<br />
Actual<br />
FY <strong>2011</strong><br />
Budget<br />
FY <strong>2011</strong><br />
Estimate<br />
FY 20<strong>12</strong><br />
Budget<br />
Percent Over<br />
FY <strong>2011</strong> Budget<br />
Wages/Salaries/Benefits $2,930,928 $2,602,378 $2,602,378 $2,553,253 -2%<br />
Supplies and Contracts $2,490,630 $3,620,078 $2,900,630 $3,609,721 0%<br />
Internal Premiums $629,835 $638,879 $638,879 $499,863 -22%<br />
Internal Service Charges $14,077 $15,519 $15,519 $14,108 -9%<br />
Operating Capital $99,460 $797,583 $215,692 $803,687 1%<br />
Work Order Credits ($138,256) ($138,256) ($232,536) 68%<br />
Total - Info. Technology $6,164,930 $7,536,181 $6,234,842 $7,248,096 -4%<br />
STAFFING BY PROGRAM<br />
FY 2010<br />
Actual<br />
FY <strong>2011</strong><br />
Budget<br />
FY <strong>2011</strong><br />
Estimate<br />
FY 20<strong>12</strong><br />
Budget<br />
Percent Over<br />
FY <strong>2011</strong> Budget<br />
(1000) Information Technology 29<br />
25 25 25 0%<br />
(1100) Telephones 1<br />
1 1 1 0%<br />
(1140) Technology Replacement 1<br />
1 1 1 0%<br />
Total -Info. Technology 31 27 27 27 0%<br />
257<br />
Return to TOC
Mission and Performance Measure<br />
Transportation<br />
Transportation<br />
Services<br />
Airport<br />
Transportation<br />
TRANSPORTATION<br />
Jamsheed Mehta<br />
Mission Statement:<br />
To ensure the safe, efficient transportation <strong>of</strong> people and goods in the City <strong>of</strong> Glendale.<br />
Department Description:<br />
Transportation Services plans, programs, funds, designs, constructs, maintains and manages<br />
programs and projects for all modes <strong>of</strong> transportation including, aviation, streets and highways,<br />
pedestrians, bicycles, and transit services.<br />
FISCAL YEAR 20<strong>12</strong><br />
Goal<br />
Related Council Goal<br />
Activities<br />
Expected Outcomes<br />
(Perf. Measures)<br />
Time Commitment<br />
Expected Challenges<br />
GOALS<br />
Successfully coordinate final design and construction <strong>of</strong><br />
major roadway projects in Glendale to include Northern<br />
Parkway and the Loop 303.<br />
One community with quality economic development.<br />
Design plans for Northern Parkway and Loop 303 are near<br />
completion with construction to start in FY 20<strong>12</strong>. Staff will<br />
partner and work with Arizona Department <strong>of</strong><br />
Transportation and Maricopa County Department <strong>of</strong><br />
Transportation to ensure design and construction<br />
coordination is consistent with Glendale standards for those<br />
portions <strong>of</strong> the projects that are in Glendale.<br />
Agreements for ongoing operating and maintenance are<br />
reviewed and complete. Design and construction standards<br />
are to Glendale specifications.<br />
These high priority projects will be constructed over several<br />
years.<br />
These are large multi-year projects requiring coordination<br />
between state, regional, and local agencies with competing<br />
priorities.<br />
258<br />
Return to TOC
Mission and Performance Measure<br />
Transportation<br />
Goal<br />
Related Council Goal<br />
Activities<br />
Expected Outcomes<br />
(Perf. Measures)<br />
Time Commitment<br />
Expected Challenges<br />
Successfully lead ten federally funded traffic<br />
signal/intelligent transportation system and safety projects<br />
through the federal-aid process. Projects include new<br />
communication lines to traffic signals, real-time traffic<br />
monitoring cameras, electronic message signs in downtown,<br />
and pedestrian- countdown signal heads..<br />
One community with high-quality services for citizens.<br />
Coordination with the Arizona Department <strong>of</strong> Transportation<br />
to complete utility, right-<strong>of</strong>-way, and environmental<br />
clearances, prepare project specifications, design approvals,<br />
and project agreements.<br />
Improved signal coordination, quicker incident response to<br />
traffic congestion, and advanced driver information.<br />
These projects will take approximately two years to<br />
complete.<br />
The projects are in various stages <strong>of</strong> completion and the<br />
Arizona Department <strong>of</strong> Transportation is implementing new<br />
guidelines and requirements for procurement projects that<br />
are federally funded.<br />
FISCAL YEAR <strong>2011</strong><br />
Area <strong>of</strong> Innovation:<br />
• To provide enhanced driver information to the public traveling to and from the Sports<br />
and Entertainment District, electronic message signs are used around the arena and<br />
stadium during most <strong>of</strong> the events. In FY <strong>2011</strong>, the electronic message signs have been<br />
used to display 250 messages for a total <strong>of</strong> 1,286 hours.<br />
Accomplishments:<br />
• Over $48.7 million from federal, state, and regional sources was programmed or<br />
expended to improve the <strong>city</strong>’s intersections, roadways, bike paths, pedestrian<br />
walkways, and transit services.<br />
• Transportation’s efforts in receiving the environmental assessment approval by the<br />
Federal Highway Administration for the Northern Parkway project cleared the way for<br />
committed federal funding <strong>of</strong> over $221 million to the project.<br />
259<br />
Return to TOC
Mission and Performance Measure<br />
Transportation<br />
Goal<br />
Related Council Goal<br />
Was the goal met?<br />
What were the<br />
Performance Measures?<br />
Obstacles/Challenges<br />
Goal<br />
Related Council Goal<br />
Was the goal met?<br />
What were the<br />
Performance Measures?<br />
Obstacles/Challenges<br />
GOAL UPDATES<br />
Enhance regional highway connectivity in Glendale’s future<br />
growth areas.<br />
One community with quality economic development.<br />
Yes-Planned improvements for the Loop 303, Northern Parkway,<br />
Grand Avenue, and ongoing improvements <strong>of</strong> the Loop 101 have<br />
been designed and are near or are under construction. Extending<br />
these transportation corridors into undeveloped areas will not only<br />
provide access to new business and commercial areas but will also<br />
attract private-sector investment along these growth corridors.<br />
Integrating the design <strong>of</strong> multiple projects that would ensure<br />
connectivity between all highways and Glendale’s growth areas.<br />
Challenges included coordinating with multiple agencies at the<br />
federal, state, and regional levels to ensure design coordination,<br />
and securing funding in light <strong>of</strong> <strong>budget</strong> reductions at all levels <strong>of</strong><br />
government.<br />
Explore revenue generating options and purse new funding<br />
sources through grants and other potential revenue generating<br />
options to <strong>of</strong>fset shortfalls in Transit funding from local and state<br />
revenue sources.<br />
One community that is fiscally sound.<br />
Yes-Two grants known as New Freedom and Job Access Reverse<br />
Commute totaling $1.5 million were received. With the loss <strong>of</strong><br />
state funds in December 2009 and regional funds in 2010 transit<br />
schedules and routes would have been significantly impacted.<br />
Staff aggressively pursued federal discretionary grants, and award<br />
<strong>of</strong> these two grants prevented immediate service cuts.<br />
To research and secure grant funding, and explore other revenue<br />
generating options.<br />
The grant selection process is highly competitive and only a few<br />
cities in Maricopa County were awarded these funds.<br />
FISCAL YEAR 2010<br />
Area <strong>of</strong> Innovation:<br />
• Traffic Systems Management took on the responsibility for designing the traffic signal<br />
and intelligent transportation stimulus package projects in-house using existing staff<br />
expertise. This activity included the preparation <strong>of</strong> construction plans, specifications,<br />
and estimates, along with obtaining the utility and right-<strong>of</strong>-way clearances from federal<br />
and state agencies. By utilizing <strong>city</strong> staff rather than a consultant, the Transportation<br />
260<br />
Return to TOC
Mission and Performance Measure<br />
Transportation<br />
Department was able to maximize the amount <strong>of</strong> ARRA funding available for<br />
construction improvements.<br />
Accomplishments:<br />
• Glendale Urban Shuttle also known as GUS Bus will have over 116,000 riders this<br />
year. This is a 110% increase from the 55,000 riders we had in 2003 when GUS<br />
service was fully implemented.<br />
• With the installation <strong>of</strong> 58 additional traffic monitoring cameras this year, real time<br />
traffic monitoring will significantly improve the <strong>city</strong>’s ability to better manage event<br />
and day to day traffic. Currently there are 30 traffic cameras bringing the total to 88<br />
through-out the <strong>city</strong>.<br />
Goal<br />
Related Council Goal<br />
Was the goal met?<br />
What were the<br />
Performance Measures?<br />
Obstacles/Challenges<br />
Goal<br />
Related Council Goal<br />
Was the goal met?<br />
What were the<br />
Performance Measures?<br />
Obstacles/Challenges<br />
GOAL UPDATES<br />
To leverage and utilize American Recovery and Reinvestment Act<br />
(ARRA) stimulus funding for Transportation Projects for the best<br />
interest <strong>of</strong> the <strong>city</strong> and that meet ARRA requirements.<br />
One community with high quality services for citizens.<br />
Yes, funding was secured to make up for the loss <strong>of</strong> local funds<br />
for pavement management, street markings, modernizing traffic<br />
signals, and enhancing traffic management communications.<br />
These funds not only reduced local costs but also extended the<br />
department’s plan for the expansion <strong>of</strong> services that would not<br />
have been feasible without this funding.<br />
Timely delivery <strong>of</strong> design and environmental clearances.<br />
Very tight time constraints imposed by the Maricopa Association<br />
<strong>of</strong> Governments (MAG), ADOT, and the FHWA made it<br />
extremely challenging to complete designs and environmental<br />
clearances for 77 signalized intersections, and 25 miles <strong>of</strong><br />
roadway.<br />
Improve access control and beautification along Grand Avenue.<br />
One community with high quality services for citizens.<br />
Considerable progress has been made and several properties have<br />
been secured providing the necessary right-<strong>of</strong>-way.<br />
Timely acquisition <strong>of</strong> several properties and coordination between<br />
property owners and ADOT <strong>of</strong>ficials to sustain viable economic<br />
activities along Grand Avenue while also managing effective<br />
access control.<br />
This is a very large project impacting multiple property owners.<br />
Coordinating between parties with competing priorities is a<br />
lengthy process.<br />
261<br />
Return to TOC
City <strong>of</strong> Glendale<br />
Budget Summary by Department<br />
Airport<br />
FUND NUMBER /<br />
BUDGET BY PROGRAM<br />
FY 2010<br />
Actual<br />
FY <strong>2011</strong><br />
Budget<br />
FY <strong>2011</strong><br />
Estimate<br />
FY 20<strong>12</strong><br />
Budget<br />
Percent Over<br />
FY <strong>2011</strong> Budget<br />
(1760) Airport Operations<br />
$621,749 $538,916 $538,916 $527,326 -2%<br />
Total - Airport $621,749 $538,916 $538,916 $527,326 -2%<br />
BUDGET BY CATEGORIES<br />
OF EXPENDITURES<br />
FY 2010<br />
Actual<br />
FY <strong>2011</strong><br />
Budget<br />
FY <strong>2011</strong><br />
Estimate<br />
FY 20<strong>12</strong><br />
Budget<br />
Percent Over<br />
FY <strong>2011</strong> Budget<br />
Wages/Salaries/Benefits $395,229 $345,673 $345,673 $317,908 -8%<br />
Supplies and Contracts $166,635 $147,941 $147,941 $147,941 0%<br />
Internal Premiums $20,914 $30,015 $30,015 $38,218 27%<br />
Internal Service Charges $38,971 $30,784 $30,784 $30,365 -1%<br />
Work Order Credits ($15,497) ($15,497) ($7,106) -54%<br />
Total - Airport $621,749 $538,916 $538,916 $527,326 -2%<br />
STAFFING BY PROGRAM<br />
FY 2010<br />
Actual<br />
FY <strong>2011</strong><br />
Budget<br />
FY <strong>2011</strong><br />
Estimate<br />
FY 20<strong>12</strong><br />
Budget<br />
Percent Over<br />
FY <strong>2011</strong> Budget<br />
(1760) Airport Operations 5<br />
5 5 5 0%<br />
Total -Airport 5 5 5 5 0%<br />
262<br />
Return to TOC
City <strong>of</strong> Glendale<br />
Budget Summary by Department<br />
Transportation<br />
FUND NUMBER /<br />
BUDGET BY PROGRAM<br />
FY 2010<br />
Actual<br />
FY <strong>2011</strong><br />
Budget<br />
FY <strong>2011</strong><br />
Estimate<br />
FY 20<strong>12</strong><br />
Budget<br />
Percent Over<br />
FY <strong>2011</strong> Budget<br />
(1010) Transp - Stadium Mgmt Plan<br />
$21,320 $0 $0 $0 NA<br />
(<strong>12</strong>81) Stadium - Transportation Ops.<br />
$643,436 $645,734 $645,734 $645,734 0%<br />
(<strong>12</strong>81) Transp - Fiesta Bowl Event<br />
$78,983 $79,942 $79,942 $79,942 0%<br />
(<strong>12</strong>82) Arena - Transportation Ops.<br />
$11,370 $15,000 $15,000 $15,000 0%<br />
(1340) Signs & Markings<br />
$698,602 $707,617 $707,617 $646,465 -9%<br />
(1340) Street Light Management<br />
$1,640,955 $1,093,283 $1,093,283 $1,403,390 28%<br />
(1340) Traffic Design and Development<br />
$292,293 $301,709 $301,709 $290,717 -4%<br />
(1340) Traffic Signals<br />
$1,052,189 $903,017 $903,017 $800,256 -11%<br />
(1340) Traffic Studies<br />
$410,766 $369,166 $369,166 $345,690 -6%<br />
(1340) Transportation Administration<br />
$373,594 $373,165 $373,165 $296,918 -20%<br />
(1340) Transportation Planning<br />
$2,178 $0 $0 $0 NA<br />
(1650) Grant Approp - Transportation<br />
$0 $0 $768,765 $768,765 NA<br />
(1650) HSIP Ped Countdown Signals<br />
$0 $0 $55,200 $0 NA<br />
(1660) Demand Management<br />
$32,091 $8,105 $42,000 $42,000 418%<br />
(1660) Dial-A-Ride<br />
$2,390,040 $2,391,<strong>12</strong>9 $2,391,<strong>12</strong>9 $2,449,479 2%<br />
(1660) Fixed Route<br />
$4,502,347 $5,675,488 $4,875,488 $5,175,488 -9%<br />
(1660) Intelligent Transportation Sys<br />
$433,478 $590,944 $590,944 $600,342 2%<br />
(1660) Red Light Enforcement<br />
$23,781 $0 $0 $0 NA<br />
(1660) Traffic Mitigation<br />
$90,293 $578,348 $328,348 $580,336 0%<br />
(1660) Transit Management<br />
$322,534 $322,741 $322,741 $339,875 5%<br />
(1660) Transportation CIP O&M<br />
$91,734 $113,893 $113,893 $113,893 0%<br />
(1660) Transportation Education<br />
$180,310 $223,934 $223,934 $226,075 1%<br />
(1660) Transportation Program Mgmt<br />
$2,026,866 $2,298,887 $2,297,587 $2,313,072 1%<br />
(1842) FTA AZ-96-X002<br />
$74,874 $0 $0 $0 NA<br />
(1842) Old Roma Alley ARRA Grant<br />
$159,776 $0 $457,656 $0 NA<br />
Total - Transportation $15,553,810 $16,692,102 $16,956,318 $17,133,437 3%<br />
263<br />
Return to TOC
City <strong>of</strong> Glendale<br />
Budget Summary by Department<br />
Transportation<br />
BUDGET BY CATEGORIES<br />
OF EXPENDITURES<br />
FY 2010<br />
Actual<br />
FY <strong>2011</strong><br />
Budget<br />
FY <strong>2011</strong><br />
Estimate<br />
FY 20<strong>12</strong><br />
Budget<br />
Percent Over<br />
FY <strong>2011</strong> Budget<br />
Wages/Salaries/Benefits $5,800,825 $5,631,821 $5,950,272 $5,871,007 4%<br />
Supplies and Contracts $7,616,640 $9,317,080 $8,804,293 $9,495,660 2%<br />
Internal Premiums $375,417 $418,673 $418,673 $404,534 -3%<br />
Internal Service Charges $1,686,654 $1,692,723 $1,721,726 $1,741,584 3%<br />
Operating Capital $152,966 $429,549<br />
Work Order Credits ($78,692) ($368,195) ($368,195) ($379,348) 3%<br />
Total - Transportation $15,553,810 $16,692,102 $16,956,318 $17,133,437 3%<br />
STAFFING BY PROGRAM<br />
FY 2010<br />
Actual<br />
FY <strong>2011</strong><br />
Budget<br />
FY <strong>2011</strong><br />
Estimate<br />
FY 20<strong>12</strong><br />
Budget<br />
Percent Over<br />
FY <strong>2011</strong> Budget<br />
(1340) Signs & Markings 10<br />
8 8 8 0%<br />
(1340) Street Light Management<br />
2<br />
(1340) Traffic Design and Development 3<br />
3 3 3 0%<br />
(1340) Traffic Signals 10<br />
7 7 7 0%<br />
(1340) Traffic Studies 5<br />
4 4 4 0%<br />
(1340) Transportation Administration 5<br />
4 3 3 -25%<br />
(1340) Transportation Planning<br />
1<br />
(1660) Dial-A-Ride 35.25<br />
34.25 34.25 34.25 0%<br />
(1660) Intelligent Transportation Sys 5<br />
4 4 4 0%<br />
(1660) Traffic Mitigation 1<br />
1 1 1 0%<br />
(1660) Transit Management 4<br />
4 4 4 0%<br />
(1660) Transportation Education 1<br />
1 1 1 0%<br />
(1660) Transportation Program Mgmt 3<br />
5 5 5 0%<br />
Total -Transportation 85.25 75.25 74.25 74.25 -1%<br />
264<br />
Return to TOC
Mission and Performance Measure<br />
Environmental Resources<br />
Water Services<br />
Environmental<br />
Resources<br />
Utilities<br />
ENVIRONMENTAL RESOURCES<br />
Doug Kukino<br />
Mission Statement:<br />
The department’s mission is to ensure the <strong>city</strong> has sufficient water resources for sustainable<br />
development and is a leader in environmental stewardship.<br />
The Environmental Division establishes and implements an environmental management system<br />
that assists the <strong>city</strong> to operate in an environmentally responsible manner.<br />
The Office <strong>of</strong> Conservation and Sustainable Living provides programs to inform and educate our<br />
residents, businesses, and neighborhood communities about good environmental practices.<br />
The Water Quality Laboratory protects public health and the environment by testing and<br />
documenting the quality <strong>of</strong> drinking and reclaimed water, and reporting the results to regulatory<br />
agencies and the public.<br />
Department Description:<br />
The Environmental Resources Department provides policy analysis and planning services to <strong>city</strong><br />
leadership and departments on issues pertaining to water resources, water quality, conservation,<br />
air quality, and environmental management. The department assists the <strong>city</strong> in conducting its<br />
operations in an environmental responsible manner and creating and organizational culture that<br />
strives for excellence in environmental stewardship and performance.<br />
FISCAL YEAR 20<strong>12</strong><br />
Goal<br />
Related Council Goal<br />
Activities<br />
GOALS<br />
To create an organizational culture that strives for high-level<br />
and continual improvement in environmental stewardship and<br />
performance.<br />
One community with high quality services for citizens.<br />
Prepare a written Storm Water Management Plan by August<br />
27, <strong>2011</strong>. Involve several <strong>city</strong> departments in the planning<br />
265<br />
Return to TOC
Mission and Performance Measure<br />
Environmental Resources<br />
Expected Outcomes<br />
(Perf. Measures)<br />
Time Commitment<br />
Expected Challenges<br />
Goal<br />
Related Council Goal<br />
Activities<br />
Expected Outcomes<br />
(Perf. Measures)<br />
Time Commitment<br />
Expected Challenges<br />
process. Proper implementation <strong>of</strong> the plan will also involve<br />
several <strong>city</strong> departments.<br />
The Stormwater Management Plan needs to be implemented<br />
and comply with the <strong>city</strong>’s new storm water permit. The plan<br />
will include procedures, processes, measures and programs to<br />
maintain storm water basins and pipes; inspect commercial,<br />
industrial and construction activities; provide public<br />
education, assure spill planning and response; perform<br />
stormwater quality monitoring; provide employee training;<br />
assure illicit discharge detection and enforcement; and provide<br />
program management and evaluation.<br />
The plan is being completed by existing staff and will take<br />
several months to prepare. The plan will also need to be<br />
periodically updated as needed. Implementation <strong>of</strong> the plan is<br />
on-going commitment. Annual reports describing<br />
accomplishments are also required by the state <strong>of</strong> Arizona.<br />
The plan is complex and implementation will involve<br />
commitments by and resources from several <strong>city</strong> departments,<br />
including Utilities, Field Operations, Fire, Engineering, Parks<br />
and Recreation, Code Compliance, and Environmental<br />
Resources.<br />
To ensure that the <strong>city</strong> has sustainable water resources to meet<br />
current and future demand.<br />
One community with high quality services for citizens.<br />
A Water Production Plan for 20<strong>12</strong> will be prepared by<br />
October <strong>2011</strong>, jointly by Environmental Resources and<br />
Utilities departments.<br />
The 20<strong>12</strong> Water Production Plan will build on the<br />
optimization concepts implemented in FY <strong>2011</strong>. The<br />
possibility <strong>of</strong> exchanging reclaimed water for Central Arizona<br />
Project water in the amount <strong>of</strong> approximately 5,000 acre-feet<br />
is being explored for FY 20<strong>12</strong>. If successful, the exchange is<br />
expected to result in savings <strong>of</strong> up to $750,000 in FY 20<strong>12</strong>.<br />
In order for the water exchange to occur, the <strong>city</strong> will need to<br />
obtain approvals from the Central Arizona Project and the<br />
Arizona Department <strong>of</strong> Water Resources. This process is<br />
expected to take several months. If successful, the <strong>city</strong> intends<br />
to seek water exchanges in future years, as appropriate.<br />
Obtaining necessary approvals will require approvals from two<br />
external agencies/organizations. The <strong>city</strong> will need to provide<br />
documentation supporting its request for the water exchange.<br />
266<br />
Return to TOC
Mission and Performance Measure<br />
Environmental Resources<br />
FISCAL YEAR <strong>2011</strong><br />
Area <strong>of</strong> Innovation:<br />
• The Environmental Resources Department negotiated an alternative way to meet the<br />
City’s regional air quality commitments while saving the <strong>city</strong> money. To control dust,<br />
the <strong>city</strong> will use asphalt millings to improve 10 curb miles <strong>of</strong> unpaved (road) shoulders<br />
instead <strong>of</strong> paving. The use <strong>of</strong> asphalt millings has an equivalent air quality benefit as<br />
paving, and the <strong>city</strong> saves $413,000.<br />
• The Department is utilizing the <strong>city</strong>’s Innovate program to assess the <strong>city</strong>’s current<br />
multi-departmental approach to implementing and complying with the new municipal<br />
separate storm sewer system permit that was issued to Glendale by the state <strong>of</strong> Arizona.<br />
The goal is to identi<strong>fy</strong> new practices to most effectively use existing staff to implement<br />
and comply with the stormwater permit requirements. The Innovate assessment is<br />
being conducted in FY<strong>2011</strong> and recommendations are expected in FY20<strong>12</strong>.<br />
Accomplishments:<br />
• The Environmental Resources Department partnered with the Utilities Department to<br />
prepare the <strong>2011</strong> Glendale water supply/production plan. The plan integrates water<br />
resources/supplies with water infrastructure (water treatment plants, and wells) to<br />
optimize water production and to reduce operating costs by as much as $1.2 million in<br />
FY<strong>2011</strong>.<br />
Goal<br />
Related Council Goal<br />
Was the goal met?<br />
What were the<br />
Performance Measures?<br />
Obstacles/Challenges<br />
Goal<br />
Related Council Goal<br />
GOAL UPDATES<br />
To ensure that the <strong>city</strong> has sustainable water resources to meet<br />
current and future demand.<br />
One community with high quality services for citizens.<br />
Yes. The City received a new Designation <strong>of</strong> Assured Water<br />
Supply demonstrating sufficient water resources to meet both<br />
current water demand and the water demand <strong>of</strong> plats reasonably<br />
projected to be approved through the year 2025.<br />
Obtain a new Designation <strong>of</strong> Assured Water Supply for the City’s<br />
water service area from the Arizona Department <strong>of</strong> Water<br />
Resources.<br />
The process to obtain a new Designation <strong>of</strong> Assured Water Supply<br />
took longer than the <strong>city</strong> expected due to the extensive State <strong>of</strong><br />
Arizona review and approval process.<br />
To create an organizational culture that strives from high-level and<br />
continual improvement in environmental stewardship and<br />
performance.<br />
One community with high quality services for citizens.<br />
267<br />
Return to TOC
Mission and Performance Measure<br />
Environmental Resources<br />
Was the goal met?<br />
What were the<br />
Performance Measures?<br />
Obstacles/Challenges<br />
Yes. The <strong>city</strong> received a new municipal separate storm sewer<br />
system permit from the Arizona Department <strong>of</strong> Environmental<br />
Quality in 2010.<br />
The <strong>city</strong> has also developed a draft storm water ordinance and<br />
administrative procedures for program implementation. Council<br />
will be asked to adopt the ordinance in FY <strong>2011</strong>.<br />
Obtain a new municipal separate storm sewer system permit from<br />
the Arizona Department <strong>of</strong> Environmental Quality and<br />
administer/implement the program requirements.<br />
The process to obtain a new storm water permit took longer than<br />
the <strong>city</strong> expected due to the extensive State <strong>of</strong> Arizona permit<br />
development and approval process. Securing the permit required<br />
coordination, communication, and involvement from several <strong>city</strong><br />
departments.<br />
FISCAL YEAR 2010<br />
Area <strong>of</strong> Innovation:<br />
• Revenue generation. The Environmental Resources Department initiated the sale <strong>of</strong><br />
9,950 acre-feet <strong>of</strong> long-term stored water credits to the Central Arizona Project which<br />
generated nearly $1.3 million dollars in proceeds. The sale did not negatively impact<br />
the <strong>city</strong>’s ability to maintain its 100-year Assured Water Supply Designation.<br />
Accomplishments:<br />
• The Environmental Resources Department administered the <strong>city</strong>’s approval <strong>of</strong> a new<br />
long-term effluent sales agreement between the Sub-Regional Operating Group<br />
partners, <strong>of</strong> which Glendale is a member, and the Palo Verde Nuclear Generation<br />
Station partners. Glendale expects its effluent sales revenue (from the 91st Avenue<br />
Wastewater Treatment Plant) to increase from $350,000 today up to $1 million in each<br />
<strong>of</strong> the first four years <strong>of</strong> the agreement.<br />
• Prepared a white paper on Green Buildings and Solar Power for the Council<br />
Sustainability Subcommittee. Expanding public information and outreach on energy<br />
and sustainability to the public and business community through the <strong>city</strong>’s Green<br />
website. Obtained federal energy block grant funds through the American Recovery<br />
and Reinvestment Act to establish an energy efficiency outreach and education<br />
program.<br />
Goal<br />
Related Council Goal<br />
GOAL UPDATES<br />
To ensure that the <strong>city</strong> has sustainable water resources to meet<br />
current and future demand.<br />
One community with high quality services for citizens.<br />
268<br />
Return to TOC
Mission and Performance Measure<br />
Environmental Resources<br />
Was the goal met?<br />
What were the<br />
Performance Measures?<br />
Obstacles/Challenges<br />
Goal<br />
Related Council Goal<br />
Was the goal met?<br />
What were the<br />
Performance Measures?<br />
Obstacles/Challenges<br />
Yes, partially. Prepared the 2010 Glendale water supply/demand<br />
plan taking into consideration: 1) water supplies/rights; 2) water<br />
production (treatment plants and wells) infrastructure; 3) operating<br />
costs; 4) expected water demand; 5) water quality; and 6) legal<br />
and regulatory requirements.<br />
To provide high quality water, satis<strong>fy</strong>ing customer water demand,<br />
in a cost effective manner. By temporarily increasing reliance on<br />
water from wells, the <strong>city</strong> is expected to save up to $750,000 in<br />
operational cost in calendar year 2010.<br />
Due to heavy seasonal rainfall, the water supply/demand plan<br />
could not be fully implemented. The <strong>city</strong> scaled back the amount<br />
<strong>of</strong> water it recovered from groundwater wells, which resulted in<br />
reduced anticipated savings in operational costs.<br />
To protect public health and the environment by testing,<br />
documenting and reporting the quality <strong>of</strong> drinking water and<br />
reclaimed water.<br />
One community with high quality services for citizens.<br />
Yes. The Water Quality Laboratory maintained all necessary state<br />
laboratory certifications necessary for operations and collected<br />
and analyzed over 14,000 water samples to ensure the quality and<br />
safety <strong>of</strong> Glendale drinking water. The Water Quality Laboratory<br />
completed and submitted all required compliance-related water<br />
quality reports to the Arizona Department <strong>of</strong> Environmental<br />
Quality on time with no significant errors. The Glendale Water<br />
Quality Annual Report was prepared and distributed to residents<br />
and businesses in May 2010.<br />
Provide timely and accurate analysis <strong>of</strong> Glendale’s drinking water.<br />
Maintain all necessary state laboratory certifications to continue<br />
operations. Perform over 95% <strong>of</strong> water quality tests using inhouse<br />
chemists. Ensure that the Utilities Department receives<br />
timely and accurate water quality information.<br />
Due to <strong>budget</strong>ary constraints, the Water Quality Laboratory<br />
worked with the Utilities Department to identi<strong>fy</strong> water quality<br />
tests that are not required by law/regulation and could be<br />
temporarily discontinued. The Laboratory continued to perform<br />
all water quality tests that are required by federal and state<br />
laws/regulations.<br />
269<br />
Return to TOC
City <strong>of</strong> Glendale<br />
Budget Summary by Department<br />
Env. Resources<br />
FUND NUMBER /<br />
BUDGET BY PROGRAM<br />
FY 2010<br />
Actual<br />
FY <strong>2011</strong><br />
Budget<br />
FY <strong>2011</strong><br />
Estimate<br />
FY 20<strong>12</strong><br />
Budget<br />
Percent Over<br />
FY <strong>2011</strong> Budget<br />
(1000) H<strong>az</strong>Mat Incidence Response<br />
$<strong>12</strong>,581 $26,845 $26,845 $26,845 0%<br />
(2360) Environmental Resources<br />
$508,393 $524,231 $517,342 $537,929 3%<br />
(2360) Water Quality<br />
$968,381 $1,162,187 $1,108,775 $1,155,382 -1%<br />
(2400) Water Conservation<br />
$245,596 $320,901 $294,429 $315,811 -2%<br />
Total - Env. Resources $1,734,951 $2,034,164 $1,947,391 $2,035,967 0%<br />
BUDGET BY CATEGORIES<br />
OF EXPENDITURES<br />
FY 2010<br />
Actual<br />
FY <strong>2011</strong><br />
Budget<br />
FY <strong>2011</strong><br />
Estimate<br />
FY 20<strong>12</strong><br />
Budget<br />
Percent Over<br />
FY <strong>2011</strong> Budget<br />
Wages/Salaries/Benefits $1,302,622 $1,397,426 $1,397,426 $1,387,136 -1%<br />
Supplies and Contracts $398,811 $654,331 $567,558 $634,070 -3%<br />
Internal Premiums $18,747 $22,335 $22,335 $21,844 -2%<br />
Internal Service Charges $14,771 $22,013 $22,013 $21,660 -2%<br />
Work Order Credits ($61,941) ($61,941) ($28,743) -54%<br />
Total - Env. Resources $1,734,951 $2,034,164 $1,947,391 $2,035,967 0%<br />
STAFFING BY PROGRAM<br />
FY 2010<br />
Actual<br />
FY <strong>2011</strong><br />
Budget<br />
FY <strong>2011</strong><br />
Estimate<br />
FY 20<strong>12</strong><br />
Budget<br />
Percent Over<br />
FY <strong>2011</strong> Budget<br />
(2360) Environmental Resources 5<br />
5 5 5 0%<br />
(2360) Water Quality 10<br />
10 10 10 0%<br />
(2400) Water Conservation 2<br />
2 2 2 0%<br />
Total -Env. Resources 17 17 17 17 0%<br />
270<br />
Return to TOC
Mission and Performance Measure<br />
Utilities<br />
Water Services<br />
Environmental<br />
Resources<br />
UTILITIES<br />
Craig Johnson<br />
Utilities<br />
Mission Statement:<br />
To provide safe and reliable water and wastewater services to its citizens; comply with all<br />
environmental and health standards; anticipate and respond to emergencies in a timely,<br />
appropriate manner and accommodate growth and new demand within the <strong>city</strong>.<br />
Department Description:<br />
The Utilities Department serves more than 225,000 people within the City <strong>of</strong> Glendale. The<br />
Department is responsible for treating and distributing potable water that meets all federal and<br />
state drinking water standards, collection and treating the <strong>city</strong>’s wastewater in compliance with<br />
all regulatory requirements, implementing odor and roach infestation control measures, and<br />
reading all water meters on a monthly basis. The Department receives no revenues from sales or<br />
property taxes, but operates solely on funds from rates and service charges. In accordance with<br />
City policy, these funds are administered in an enterprise account.<br />
Goal<br />
Related Council Goal<br />
Activities<br />
Expected Outcomes<br />
(Perf. Measures)<br />
FISCAL YEAR 20<strong>12</strong><br />
GOALS<br />
Complete the sewer rehabilitation and replacement project<br />
to meet the federal and state regulatory requirements. The<br />
aged sewer system will be rehabilitated using state-<strong>of</strong>- theart<br />
trenchless technologies to reduce construction costs.<br />
One community with high quality services for citizens.<br />
The project includes both design and construction phases.<br />
Currently, the project is under construction phase.<br />
Completion <strong>of</strong> sewer rehabilitation and replacement by<br />
October <strong>2011</strong>.q<br />
Time Commitment It is an on-going project and the time commitment is 100%.<br />
Expected Challenges<br />
None.<br />
271<br />
Return to TOC
Mission and Performance Measure<br />
Utilities<br />
Goal<br />
Related Council Goal<br />
Activities<br />
Expected Outcomes<br />
(Perf. Measures)<br />
Complete the improvements to the Arrowhead Ranch Water<br />
Reclamation Facility ultraviolet (UV) disinfectant system.<br />
This project will replace the existing Trojan medium<br />
pressure UV systems with energy efficient low pressure UV<br />
disinfection systems to reduce operating costs and enhance<br />
UV system disinfection performance.<br />
One community with high quality services for citizens.<br />
The project includes design and construction phases.<br />
Currently, the project is under design phase.<br />
Completion <strong>of</strong> UV replacement construction by November<br />
20<strong>12</strong>.<br />
Time Commitment It is an on-going project and the time commitment is 100%.<br />
Expected Challenges<br />
None.<br />
FISCAL YEAR <strong>2011</strong><br />
Area <strong>of</strong> Innovation:<br />
• A water production optimization program was implemented which resulted in<br />
approximately $600,000 <strong>annual</strong> cost savings in <strong>2011</strong>. The Utilities and Environmental<br />
Resources Departments was instrumental in generating additional revenues, including<br />
amendment <strong>of</strong> the SROG effluent agreement with the Palo Verde Nuclear Generating<br />
Station which resulted in $0.5 million additional <strong>annual</strong> revenue in FY <strong>2011</strong>.<br />
• Cost savings <strong>of</strong> $200,000 in meter replacement in FY <strong>2011</strong> was achieved through the<br />
implementation <strong>of</strong> new procedures for changing out meters.<br />
Accomplishments:<br />
• The Department received the most prestigious Association <strong>of</strong> Metropolitan Water<br />
Agencies Platinum Award for utilities performance excellence in FY <strong>2011</strong>. Since<br />
2004, the only cities in Arizona to receive this award have been Tucson Water and the<br />
City <strong>of</strong> Glendale.<br />
• The Department also implemented an <strong>annual</strong> fire hydrant maintenance program to<br />
meet the Insurance Services Office (ISO) requirements and to ensure the existing<br />
public fire protection is available to individual property owners. This program has<br />
helped lower home owner insurance costs within the <strong>city</strong>.<br />
272<br />
Return to TOC
Mission and Performance Measure<br />
Utilities<br />
Goal<br />
Related Council Goal<br />
Was the goal met?<br />
What were the<br />
Performance Measures?<br />
Obstacles/Challenges<br />
Goal<br />
Related Council Goal<br />
Was the goal met?<br />
What were the<br />
Performance Measures?<br />
Obstacles/Challenges<br />
GOAL UPDATES<br />
Complete the construction phase <strong>of</strong> the 10 MGD groundwater<br />
treatment plant located at the Oasis Water Campus. This facility<br />
will augment existing water supplies and help meet demands<br />
during peak demand events and periods <strong>of</strong> canal outages due to<br />
scheduled maintenance. This includes hiring a construction<br />
manager, a principal contractor, and construction manager at risk<br />
for pre-construction and the onset <strong>of</strong> construction.<br />
One community with high quality services for citizens.<br />
Yes.<br />
The project will be completed by May <strong>2011</strong>.<br />
None.<br />
Complete the improvements to the Arrowhead Ranch Water<br />
Reclamation Facility ultraviolet (UV) disinfectant system. This<br />
project will replace the existing Trojan medium pressure UV<br />
systems with energy efficient low pressure UV disinfection<br />
systems to reduce operating costs and enhance UV system<br />
disinfection performance.<br />
One community with high quality services for citizens.<br />
It is anticipated to meet the goal after project completion.<br />
Completion <strong>of</strong> UV replacement project by November 20<strong>12</strong>..<br />
None.<br />
FISCAL YEAR 2010<br />
Area <strong>of</strong> Innovation:<br />
• Utilities completed a critical business practice change entailing the use <strong>of</strong> a paperless<br />
work order system. This important business practice change improves response time to<br />
a customer generated work order, reduces reliance on paper records, and improves the<br />
overall record keeping <strong>of</strong> the department.<br />
Accomplishments:<br />
• The department implemented numerous cost-reducing measures in order to minimize<br />
the need for, and magnitude <strong>of</strong>, a rate increase.<br />
• The department updated and completed its <strong>annual</strong> rate study.<br />
273<br />
Return to TOC
Mission and Performance Measure<br />
Utilities<br />
Goal<br />
Related Council Goal<br />
Was the goal met?<br />
What were the<br />
Performance Measures?<br />
Obstacles/Challenges<br />
Goal<br />
Related Council Goal<br />
Was the goal met?<br />
What were the<br />
Performance Measures?<br />
Obstacles/Challenges<br />
GOAL UPDATES<br />
Begin the construction phase <strong>of</strong> the 10 million gallon per day<br />
(MGD) groundwater treatment plant located at the Oasis Water<br />
Campus. This facility will augment existing water supplies and<br />
help meet peak demands.<br />
One community with high quality services for citizens.<br />
Yes. Construction <strong>of</strong> some <strong>of</strong> the key components <strong>of</strong> the overall<br />
project were commenced and completed. The project is ongoing<br />
and will be completed in FY <strong>2011</strong>.<br />
Completion <strong>of</strong> the groundwater treatment plant construction by<br />
November <strong>2011</strong>.<br />
None.<br />
Develop a master plan for the West Area Water Reclamation<br />
Facility. The study will examine the wastewater demands,<br />
evaluate conveyance or treatment alternatives, Environmental<br />
Protection Agency regulations, water resources/conservation<br />
issues, effluent recharge locations, and the interplay <strong>of</strong> wastewater<br />
treatment with Sub-Regional Operating Group partnership <strong>of</strong> the<br />
Westgate area, 91st to 115th avenues.<br />
One community with high quality services for citizens.<br />
Yes. A final report has been submitted by the consulting engineer.<br />
Completion <strong>of</strong> the report during FY 2010.<br />
Constantly changing landuse plans complicated the study effort<br />
but were resolved in a timely manner.<br />
274<br />
Return to TOC
City <strong>of</strong> Glendale<br />
Budget Summary by Department<br />
Utilities<br />
FUND NUMBER /<br />
BUDGET BY PROGRAM<br />
FY 2010<br />
Actual<br />
FY <strong>2011</strong><br />
Budget<br />
FY <strong>2011</strong><br />
Estimate<br />
FY 20<strong>12</strong><br />
Budget<br />
Percent Over<br />
FY <strong>2011</strong> Budget<br />
(2360) Arrowhead Reclamation Plant<br />
$1,985,990 $2,176,656 $2,046,656 $2,106,685 -3%<br />
(2360) Information Management<br />
$920,288 $1,097,575 $1,097,575 $1,071,445 -2%<br />
(2360) Property Management<br />
$94,306 $87,000 $87,000 $87,000 0%<br />
(2360) Public Service Representatives<br />
$232,975 $286,629 $266,629 $221,824 -23%<br />
(2360) Safety Administration<br />
$26,575 $<strong>12</strong>2,107 $107,107 $0 -100%<br />
(2360) System Security<br />
$486,631 $667,683 $617,683 $771,316 16%<br />
(2360) Utilities Administration<br />
$8,243,375 $6,343,982 $6,301,682 $6,433,504 1%<br />
(2360) West Area Plant<br />
$3,474,060 $3,699,346 $3,438,346 $3,560,668 -4%<br />
(2400) Central System Control<br />
$1,004,554 $1,415,952 $1,165,952 $1,3<strong>12</strong>,765 -7%<br />
(2400) Central System Maintenance<br />
$369,176 $758,316 $708,316 $706,057 -7%<br />
(2400) Cholla Treatment Plant<br />
$3,221,671 $3,681,059 $3,181,059 $3,459,182 -6%<br />
(2400) Customer Service - Field<br />
$954,716 $1,082,739 $1,082,739 $1,186,886 10%<br />
(2400) Irrigation<br />
$187,923 $193,583 $188,583 $195,269 1%<br />
(2400) Meter Maintenance<br />
$669,091 $1,348,944 $1,113,944 $1,208,990 -10%<br />
(2400) Oasis Water Campus<br />
$3,113,823 $4,277,656 $3,827,656 $4,104,326 -4%<br />
(2400) Pyramid Peak Plant<br />
$1,780,221 $1,627,555 $1,607,555 $1,7<strong>12</strong>,457 5%<br />
(2400) Raw Water Usage<br />
$3,144,952 $3,482,182 $3,482,182 $3,382,182 -3%<br />
(2400) Water Distribution<br />
$3,105,131 $3,536,368 $3,366,368 $3,424,134 -3%<br />
(2420) 99th Avenue Interceptor<br />
$309,613 $0 $200,000 $200,000 NA<br />
(2420) Pretreatment Program<br />
$475,754 $533,992 $532,992 $526,731 -1%<br />
(2420) SROG (91st Ave) Plant<br />
$2,547,780 $4,500,000 $3,400,000 $3,700,000 -18%<br />
(2420) Wastewater Collection<br />
$2,354,389 $3,278,968 $3,044,468 $3,182,901 -3%<br />
Total - Utilities $38,702,994 $44,198,292 $40,864,492 $42,554,322 -4%<br />
275<br />
Return to TOC
City <strong>of</strong> Glendale<br />
Budget Summary by Department<br />
Utilities<br />
BUDGET BY CATEGORIES<br />
OF EXPENDITURES<br />
FY 2010<br />
Actual<br />
FY <strong>2011</strong><br />
Budget<br />
FY <strong>2011</strong><br />
Estimate<br />
FY 20<strong>12</strong><br />
Budget<br />
Percent Over<br />
FY <strong>2011</strong> Budget<br />
Wages/Salaries/Benefits $11,829,113 $13,458,255 $13,437,877 $13,415,240 0%<br />
Supplies and Contracts $20,559,946 $24,415,625 $21,102,302 $22,715,085 -7%<br />
Internal Premiums $1,093,829 $1,196,456 $1,196,456 $1,214,903 2%<br />
Internal Service Charges $5,213,976 $5,591,004 $5,591,004 $5,440,756 -3%<br />
Operating Capital $6,130 $39,000 $38,901 $23,687 -39%<br />
Work Order Credits ($502,048) ($502,048) ($255,349) -49%<br />
Total - Utilities $38,702,994 $44,198,292 $40,864,492 $42,554,322 -4%<br />
STAFFING BY PROGRAM<br />
FY 2010<br />
Actual<br />
FY <strong>2011</strong><br />
Budget<br />
FY <strong>2011</strong><br />
Estimate<br />
FY 20<strong>12</strong><br />
Budget<br />
Percent Over<br />
FY <strong>2011</strong> Budget<br />
(2360) Arrowhead Reclamation Plant 13<br />
13 13 13 0%<br />
(2360) Information Management 6<br />
6 6 6 0%<br />
(2360) Public Service Representatives 4<br />
4 3 3 -25%<br />
(2360) Safety Administration 1<br />
1<br />
(2360) System Security 8<br />
8 10 10 25%<br />
(2360) Utilities Administration 10<br />
10 10 10 0%<br />
(2360) West Area Plant 14<br />
14 14 14 0%<br />
(2400) Central System Control 9<br />
9 9 9 0%<br />
(2400) Central System Maintenance 6<br />
6 6 6 0%<br />
(2400) Cholla Treatment Plant 9<br />
9 8 8 -11%<br />
(2400) Customer Service - Field 15<br />
15 16 16 7%<br />
(2400) Irrigation 1<br />
1 1 1 0%<br />
(2400) Meter Maintenance 11<br />
11 11 11 0%<br />
(2400) Oasis Water Campus 15<br />
15 15 15 0%<br />
(2400) Pyramid Peak Plant 10<br />
10 11 11 10%<br />
(2400) Water Distribution 30<br />
30 29 29 -3%<br />
(2420) Pretreatment Program 6<br />
6 6 6 0%<br />
(2420) Wastewater Collection 19<br />
19 19 19 0%<br />
Total -Utilities 187 187 187 187 0%<br />
276<br />
Return to TOC
City <strong>of</strong> Glendale<br />
Budget Summary by Department<br />
Non-Departmental<br />
FUND NUMBER /<br />
BUDGET BY PROGRAM<br />
FY 2010<br />
Actual<br />
FY <strong>2011</strong><br />
Budget<br />
FY <strong>2011</strong><br />
Estimate<br />
FY 20<strong>12</strong><br />
Budget<br />
Percent Over<br />
FY <strong>2011</strong> Budget<br />
(1000) Fund 1000 Non-Dept<br />
$558,487 $1,963,824 ($339,641) $765,358 -61%<br />
(2360) Fund 2360 Non-Dept<br />
$0 $0 $3,463,778 $0 NA<br />
Total - Non-Departmental $558,487 $1,963,824 $3,<strong>12</strong>4,137 $765,358 -61%<br />
BUDGET BY CATEGORIES<br />
OF EXPENDITURES<br />
FY 2010<br />
Actual<br />
FY <strong>2011</strong><br />
Budget<br />
FY <strong>2011</strong><br />
Estimate<br />
FY 20<strong>12</strong><br />
Budget<br />
Percent Over<br />
FY <strong>2011</strong> Budget<br />
Wages/Salaries/Benefits $348,293 $313,937 $313,937 $315,000 0%<br />
Supplies and Contracts $210,194 $1,649,887 $2,810,200 $450,358 -73%<br />
Total - Non-Departmental $558,487 $1,963,824 $3,<strong>12</strong>4,137 $765,358 -61%<br />
277<br />
Return to TOC
CAPITAL<br />
IMPROVEMENT<br />
BUDGET<br />
FY <strong>2011</strong>-<strong>12</strong><br />
CITY OF GLENDALE, AZ<br />
PRELIMINARY<br />
ANNUAL BUDGET<br />
BOOK
20<strong>12</strong>-2021 CAPITAL IMPROVEMENT PLAN<br />
CIP Table <strong>of</strong> Contents<br />
CIP TABLE OF CONTENTS<br />
Page<br />
Table <strong>of</strong> Contents 278<br />
Introduction 280<br />
Financing the CIP 285<br />
Impact <strong>of</strong> the CIP on the Operating Budget 303<br />
Summary by Type <strong>of</strong> Project 305<br />
Summary <strong>of</strong> All Capital Projects by Funding Type 306<br />
FUND SUMMARIES<br />
BOND CONSTRUCTION FUNDS 307<br />
Street/Parking 308<br />
1980 – Street/Parking Bonds 309<br />
Open Space & Trails 313<br />
2140 – Open Space/Trails Construction 314<br />
Parks 320<br />
2060 – Parks Construction 321<br />
Library 341<br />
2160 – Library Construction 342<br />
Public Safety 345<br />
2040 – Public Safety Construction 346<br />
Government Facilities 356<br />
2080 – Government Facilities Construction 357<br />
Cultural Facilities/Historical Preservation 363<br />
2130 – Cultural Facility Construction 364<br />
Economic Development 367<br />
2100 – Economic Development Construction 368<br />
Flood Control 371<br />
2180 – Flood Control Construction 372<br />
DEVELOPMENT IMPACT FEE FUNDS 378<br />
Roadway Improvements 379<br />
1600 – DIF – Roadway Improvements 380<br />
Open Space 383<br />
1520 – DIF – Citywide Open Space 384<br />
278
20<strong>12</strong>-2021 CAPITAL IMPROVEMENT PLAN<br />
Table <strong>of</strong> Contents<br />
Page<br />
Parks & Recreation 387<br />
1460 – DIF – Citywide Parks 388<br />
1480 – DIF – Citywide Rec Facility 390<br />
1540 – DIF – Park Dev Zone 1 392<br />
1560 – DIF – Park Dev Zone 2 394<br />
1580 – DIF – Park Dev Zone 3 396<br />
Library 398<br />
1380 – DIF – Library Buildings 399<br />
1500 – DIF – Libraries 401<br />
Public Safety 403<br />
1440 – DIF-Police Dept Facilities 404<br />
1420 – DIF-Fire Protection Facilities 406<br />
General Government 408<br />
1620 – DIF – General Government 409<br />
ENTERPRISE AND OTHER FUNDS 411<br />
Water & Sewer 4<strong>12</strong><br />
2360 – Water & Sewer 413<br />
2400 – Water 419<br />
2420 – Sewer 433<br />
Transportation 441<br />
2210 – Transportation Construction 442<br />
2000 – HURF/Street Bonds 453<br />
1340 – HURF/Streets Fund 456<br />
1650 – Transportation Grants 459<br />
Sanitation 463<br />
2480 – Sanitation 464<br />
Landfill 468<br />
2440 – Landfill 469<br />
Airport Capital Grants 476<br />
2<strong>12</strong>0 – Airport Capital Grants 477<br />
Other Capital Project Funds 482<br />
1840 – Other Federal and State Grants 483<br />
1000 – General Fund 485<br />
1740 – Civic Center 489<br />
2150 – Technology Infrastructure 492<br />
<strong>12</strong>20 – Arts Commission 497<br />
279
20<strong>12</strong>-2021 CAPITAL IMPROVEMENT PLAN<br />
Introduction<br />
What are Capital Improvements?<br />
INTRODUCTION<br />
The Capital Improvement Plan (CIP) is a ten-year roadmap for creating, maintaining and paying<br />
for Glendale’s present and future infrastructure needs. The CIP outlines project costs, funding<br />
sources and estimated future operating costs associated with each capital improvement. The plan<br />
is designed to ensure that capital improvements will be made when and where they are needed,<br />
and that the City will have the funds to pay for and maintain them.<br />
Capital improvement projects are non-routine capital expenditures that generally cost more than<br />
$50,000 and result in the purchase <strong>of</strong> equipment, acquisition <strong>of</strong> land, design and construction <strong>of</strong><br />
new assets, or the renovation, rehabilitation or expansion <strong>of</strong> existing capital assets. Capital<br />
projects usually have an expected useful life <strong>of</strong> at least five years.<br />
Capital improvements make up the bricks and mortar, or infrastructure that all cities must have in<br />
place to provide essential services to current residents and support new growth and development.<br />
They also are designed to prevent the deterioration <strong>of</strong> the <strong>city</strong>’s existing infrastructure, and<br />
respond to and anticipate the future growth <strong>of</strong> the <strong>city</strong>. A wide range <strong>of</strong> projects comprise capital<br />
improvements as illustrated by the examples below:<br />
• fire and police stations;<br />
• libraries, court facilities and <strong>of</strong>fice buildings;<br />
• parks, trails, open space, pools, recreation centers and other related facilities;<br />
• water and wastewater treatment plants, transmission pipes, storage facilities and pump<br />
stations;<br />
• roads, bridges, traffic signals and other traffic control devices including fiber optic<br />
infrastructure needed for the operation <strong>of</strong> intelligent transportation systems;<br />
• landscape beautification projects;<br />
• computer s<strong>of</strong>tware and hardware systems other than personal computers and printers;<br />
• flood control drainage channels, storm drains and retention basins;<br />
• and major equipment purchases such as landfill compactors, street sweepers and<br />
sanitation trucks.<br />
Growing municipalities such as Glendale face a special set <strong>of</strong> complex problems. These cities<br />
need to build new roads, add public amenities such as parks and expand public safety services to<br />
accommodate new residential and non-residential development. They also must simultaneously<br />
maintain, replace, rehabilitate and/or upgrade existing capital assets such as roads, parks,<br />
buildings and underground pipes for the water and sewer system.<br />
Glendale has kept pace with its rapid growth through many new public assets. Glendale also has<br />
completed many capital projects that involved renovating, rehabilitating or expanding existing<br />
infrastructure or buildings. Notable projects completed since 2001 include the following:<br />
280<br />
Return to CIP TOC
20<strong>12</strong>-2021 CAPITAL IMPROVEMENT PLAN<br />
Introduction<br />
<strong>2011</strong> Sahuaro Ranch Park Improvements<br />
<strong>2011</strong> Landfill Entrance Signal<br />
<strong>2011</strong> O’Neil Park Renovations<br />
<strong>2011</strong> Marshall Ranch Trail Improvements<br />
<strong>2011</strong> Thunderbird Park Parking Lot Improvements<br />
2010 Bicentennial Park Renovations<br />
2010 Butler Park Renovations<br />
2009 Relocation <strong>of</strong> Fire Station 151<br />
2009 Catlin Court Alleyway Project<br />
2009 Replacement <strong>of</strong> Billing System for City Services<br />
2009 Storm Drain Improvements – 59 th Avenue and 67 th Avenue<br />
2009 Sahuaro Ranch Park Picnic Pavilion Renovations<br />
2009 Trail Renovations at Thunderbird Conservation Park<br />
2008 Oasis Water Treatment Plant<br />
2008 Cholla Water Treatment Plant Process Improvements<br />
2008 Park and Ride Facility at 99 th and Glendale Avenues<br />
2008 Downtown Parking Garage<br />
2007 Grand Avenue Improvements<br />
2007 Downtown Campus<br />
2007 Foothills Recreation & Aquatic Center<br />
2007 Emergency Operations Center<br />
2007 Convention Center/Media Center/Parking Garage<br />
2006 Field Operations Complex<br />
2006 Fire Station 159<br />
2006 Rose Lane Pool Restoration<br />
2005 99 th Avenue Metering Station Improvements<br />
2004 New Adult Center Facility<br />
2004 Pyramid Peak Water Treatment Plant – Solids Handling Expansion<br />
2003 Jobing.com Arena<br />
2002 Manistee Land Redevelopment<br />
2001 Tourism Visitor Center<br />
Paying for Capital Improvements<br />
In many respects, the <strong>city</strong> planning process for selecting, scheduling and financing capital<br />
improvements parallels the way an individual might plan for buying a new house or car. This<br />
process entails an assessment <strong>of</strong> many valid competing needs, a determination <strong>of</strong> priorities, an<br />
evaluation <strong>of</strong> costs and financing options and an establishment <strong>of</strong> realistic completion<br />
timeframes. The analysis process involves many familiar questions.<br />
• Do I need a new home or car or just “want” one?<br />
• Can I wait another year or two?<br />
• Are there other alternatives such as remodeling, using public transit or carpooling?<br />
281<br />
Return to CIP TOC
20<strong>12</strong>-2021 CAPITAL IMPROVEMENT PLAN<br />
Introduction<br />
• What other purchases will I need to forego?<br />
• What can I afford and how can I pay for it?<br />
• Do I need outside financing and what will it cost?<br />
If the purchase plan moves forward, a decision must be made about the down payment. A good<br />
planner might have started a replacement fund a few years ago in anticipation <strong>of</strong> the need. Other<br />
cash sources might include a savings account or a rainy day emergency fund. The <strong>city</strong>, just like<br />
most families, needs to find longer-term financing to cover certain costs for capital<br />
improvements. Repayment <strong>of</strong> the loan might require cutting other expenses like eating at<br />
restaurants or increasing income by taking a second part-time job. An unanticipated inheritance<br />
may speed up the timetable; a negative event, such as a flood or unanticipated medical expense,<br />
might delay the plan.<br />
Similarly, most large capital improvements cannot be financed solely from a single year’s<br />
revenue stream or by simply increasing income or decreasing expenses. For a more detailed<br />
discussion about this issue see the “Impacts <strong>of</strong> the CIP on the Operating Budget.”<br />
Guidelines and Policies Used in Developing the CIP<br />
City Council’s strategic goals and key objectives and the <strong>city</strong>’s financial policies provide the<br />
broad parameters for development <strong>of</strong> the <strong>annual</strong> capital plan. Additional considerations include<br />
the following:<br />
• Does a project support City Council’s strategic goals?<br />
• Does a project quali<strong>fy</strong> as a capital project, i.e., cost more than $50,000 and have an<br />
expected useful life <strong>of</strong> at least five years?<br />
• Does a project satisfactorily address all federal, state and <strong>city</strong> legal and financial<br />
requirements?<br />
• Does a project support the <strong>city</strong>'s favorable investment ratings and financial integrity?<br />
• Does a project support the <strong>city</strong>’s goal <strong>of</strong> ensuring all geographic areas <strong>of</strong> the <strong>city</strong> have<br />
comparable quality in the types <strong>of</strong> services that are defined in the Public Facilities<br />
section <strong>of</strong> the General Plan?<br />
• Does a project prevent the deterioration <strong>of</strong> the <strong>city</strong>’s existing infrastructure?<br />
• Does a project respond to and, if possible, anticipate future growth in the <strong>city</strong>?<br />
• Does a project encourage and sustain quality economic development?<br />
• Can a project be financed through growth in the tax base or development fees, when<br />
possible, if constructed in response to residential or commercial development?<br />
• Is a project responsive to the needs <strong>of</strong> residents and businesses within the constraints <strong>of</strong><br />
reasonable taxes and fees?<br />
• Does a project leverage funds provided by other units <strong>of</strong> government (e.g., Maricopa<br />
County Flood Control District, Arizona Department <strong>of</strong> Transportation, etc) where<br />
appropriate?<br />
282<br />
Return to CIP TOC
20<strong>12</strong>-2021 CAPITAL IMPROVEMENT PLAN<br />
Introduction<br />
Master plans also help determine which projects should be included in the CIP and the<br />
timeframes in which the projects should be completed. For example, the Parks and Recreation<br />
Master Plan’s guidelines for neighborhood parks include one acre <strong>of</strong> park land per 1,000<br />
residents. When population growth causes an area to exceed this threshold, that neighborhood<br />
will rise on the capital plan’s priority list for park development. The Water & Sewer Master<br />
Plan, Parks Master Plan, Storm Water Master Plan, GO Transportation Plan and five-year plans<br />
for landfill and solid waste collection services also provide valuable guidance in the preparation<br />
<strong>of</strong> the CIP.<br />
Economic forecasts also are a critical source <strong>of</strong> information and guidance throughout the capital<br />
planning process. The forecasts assess external factors such as whether the local economy is<br />
growing or contracting, population growth, inflation for construction materials, the value <strong>of</strong> land,<br />
and other variables that may affect the <strong>city</strong>’s ability to finance needed services and capital<br />
projects.<br />
Glendale’s Annual CIP Development Process<br />
In conjunction with the <strong>annual</strong> <strong>budget</strong>ing process, the Management and Budget Department<br />
coordinates the <strong>city</strong>wide process <strong>of</strong> revising and updating the <strong>city</strong>’s capital plan. City staff<br />
members from all departments participate in an extensive review <strong>of</strong> projects in the existing plan<br />
and the identification <strong>of</strong> new projects for inclusion in the CIP. The City Council’s commitment<br />
to the needs and desires <strong>of</strong> Glendale’s citizens is a critical factor considered during the capital<br />
planning process, as well as compliance with legal limits and financial resources.<br />
The first year <strong>of</strong> the plan is the only year appropriated by Council. The remaining nine years are<br />
for planning purposes and funding is not guaranteed to occur in the year planned. City Council<br />
makes the final decision about whether and when to fund a project.<br />
Once projects are selected for inclusion in the capital plan, decisions must be made about which<br />
projects should be recommended for inclusion in the first five years <strong>of</strong> the plan. Determining<br />
how and when to schedule projects is a complicated process. It must take into account City<br />
Council’s strategic goals as well as all <strong>of</strong> the variables that affect the <strong>city</strong>’s ability to generate the<br />
funds to pay for these projects without jeopardizing its ability to provide routine, ongoing<br />
services and one-time or emergency services when needed.<br />
Prior to Council’s consideration <strong>of</strong> the proposed CIP, the Finance and Management & Budget<br />
Departments evaluate various debt-related issues to ensure the proposed expenditures meet all<br />
debt coverage requirements as discussed in the <strong>city</strong>’s Debt Management Plan. The Finance<br />
Department periodically updates the Debt Management Plan to include the most recent debt<br />
issuances.<br />
The City Council reviews the recommended CIP during the spring <strong>budget</strong> workshops. Council<br />
also considers citizen requests and considers the recommendations <strong>of</strong> staff before making the<br />
final decision about which projects should be included in which years <strong>of</strong> the CIP.<br />
283<br />
Return to CIP TOC
20<strong>12</strong>-2021 CAPITAL IMPROVEMENT PLAN<br />
Introduction<br />
Citizen Involvement in the CIP Process<br />
The CIP is an important financial, planning and public communication tool. It gives residents<br />
and businesses a clear and concrete view <strong>of</strong> the <strong>city</strong>'s long-term direction for capital<br />
improvements and a better understanding <strong>of</strong> the <strong>city</strong>’s ongoing needs for stable revenue sources<br />
to fund large or multi-year capital projects.<br />
Input into the <strong>annual</strong> CIP updating process is obtained from citizens who serve on many different<br />
<strong>city</strong> boards and commissions, as well from individual citizens through the public hearing and<br />
comment process. Through these public input venues, residents and businesses have alerted staff<br />
about infrastructure development and renovation needs, important quality-<strong>of</strong>-life enhancements,<br />
and environmental and historic preservation issues that should be addressed in the capital plan.<br />
Citizens have additional opportunities for input when participating in committees that consider<br />
voter authorization proposals. There have been two bond elections since 1999. One occurred in<br />
November 1999 when Glendale voters approved 100% <strong>of</strong> the $411.5 million in bond requests.<br />
In 2006, City Council established an Ad-Hoc Citizens Bond Election Committee to consider<br />
whether additional bond authorization was needed to complete the Council approved CIP. On<br />
May 15, 2007, voters approved $218 million <strong>of</strong> the $270 million in bond requests.<br />
We encourage and welcome your comments and suggestions for improving Glendale’s <strong>annual</strong><br />
CIP. Please share your thoughts, concerns and suggestions with the <strong>city</strong> staff in the Management<br />
and Budget Department.<br />
284<br />
Return to CIP TOC
20<strong>12</strong>-2021 CAPITAL IMPROVEMENT PLAN<br />
Financing the CIP<br />
Introduction<br />
FINANCING THE CIP<br />
The financial projections used to develop the CIP are based on staff’s best prediction <strong>of</strong> future<br />
real estate values, construction costs, interest rates, and other relevant variables. These financial<br />
projections are jointly developed by the Budget and Finance Department and Engineering<br />
Department, in conjunction with the Assistant City Manager. They are updated <strong>annual</strong>ly to<br />
reflect changes in the economic environment.<br />
Although only the first year <strong>of</strong> the plan is appropriated, the first three years <strong>of</strong> the plan are<br />
financially balanced. This means the plan<br />
• complies with the state’s constitutional debt limits;<br />
• complies with the available voter authorization required for municipal bonds;<br />
• balances the use <strong>of</strong> incoming revenue streams with the use <strong>of</strong> fund balance, while<br />
maintaining a fund balance that exceeds the required minimum <strong>of</strong> 10% <strong>of</strong> the prior year’s<br />
debt service; and<br />
• identifies the source <strong>of</strong> revenue to finance various projects.<br />
Financial and legal constraints make it impossible for the <strong>city</strong> to fund every project on its priority<br />
list. For example, it is not possible for the <strong>city</strong> to fund concurrently several large-scale projects<br />
that have significant operating <strong>budget</strong> impacts. Also, revenues used to pay the debt service are<br />
not limitless. Therefore, implementation timetables are established to stagger projects over time<br />
based on Council’s strategic goals and the estimated financial resources expected for the future.<br />
Limited staff resources to undertake new capital projects also must be considered. Capital<br />
projects can consume significant time to manage effectively, and project managers in the<br />
departments typically manage several capital projects concurrently.<br />
The <strong>city</strong> also must coordinate the timing <strong>of</strong> many <strong>of</strong> its capital projects with federal, state, county<br />
and municipal governments and outside entities. For example, street improvements are<br />
coordinated with utility companies, when possible, to minimize the amount <strong>of</strong> new street surface<br />
that must be cut to lay new or replacement utility and fiber optic lines. Also, flood control<br />
capital improvements are coordinated with the Maricopa County Flood Control District to<br />
maximize matching funds that the district makes available for eligible projects.<br />
The availability <strong>of</strong> unanticipated financing, such as federal or state transportation grants or<br />
Arizona Heritage Fund grants, may cause the <strong>city</strong> to accelerate or delay a particular project.<br />
In addition, a scheduled project may be delayed in order to take advantage <strong>of</strong> an unusual onetime<br />
opportunity such as the receipt <strong>of</strong> non-governmental grant monies.<br />
All <strong>of</strong> these issues are discussed in more detail in the following material.<br />
285<br />
Return to CIP TOC
20<strong>12</strong>-2021 CAPITAL IMPROVEMENT PLAN<br />
Financing the CIP<br />
Debt Management Plan<br />
A critical element <strong>of</strong> financing capital projects is the ability to manage within available resources<br />
the overall debt incurred for past projects while including new debt for future projects. Glendale<br />
has a formal Debt Management Plan (DMP) that is produced as a separate document from the<br />
<strong>annual</strong> <strong>budget</strong> <strong>book</strong>. For the purposes <strong>of</strong> this discussion, portions <strong>of</strong> the DMP issued in May<br />
2006 are reflected below. (An update to the 2006 DMP was under development at the time this<br />
<strong>budget</strong> document was created in April <strong>2011</strong>.)<br />
The purpose <strong>of</strong> the <strong>city</strong>’s DMP is to manage the issuance <strong>of</strong> the <strong>city</strong>’s debt obligations within the<br />
<strong>city</strong>’s financial policies, the legal framework governing municipal debt and the bond covenants<br />
established for prior issuances. This plan also includes an assessment <strong>of</strong> the <strong>city</strong>’s ability to<br />
incur additional debt and other long-term obligations within these same limits at favorable<br />
interest rates.<br />
Analysis <strong>of</strong> the <strong>city</strong>’s debt position is essential as planned future capital projects could result in<br />
the need for additional capital financing. Decisions regarding the use <strong>of</strong> debt will be based in<br />
part on the long-term needs <strong>of</strong> the <strong>city</strong>, the limitations mentioned above and discussed in more<br />
detail in the material following this section, and the amount <strong>of</strong> cash that can be dedicated in a<br />
given fiscal year to capital outlay. Glendale believes that a disciplined, systematic approach to<br />
debt management will allow the <strong>city</strong> to maintain its excellent credit rating.<br />
The <strong>city</strong> has instituted a conservative plan <strong>of</strong> finance for capital projects. The main objectives <strong>of</strong><br />
that plan are:<br />
• evaluate all possible funding mechanisms to insure the <strong>city</strong> receives the best possible<br />
terms and conditions;<br />
• use debt structures that match the useful lives <strong>of</strong> the projects being financed or fall within<br />
accepted maturity guidelines;<br />
• use revenue-based bond issuances where feasible, e.g. water and sewer revenue bonds,<br />
transportation sales tax revenue bonds and highway user fee revenue fee (HURF) bonds;<br />
• use excise tax-secured bond financing when appropriate; and<br />
• finance the majority <strong>of</strong> the remaining projects with general obligation bonds that are<br />
supported by the <strong>city</strong>’s secondary property tax revenue.<br />
Furthermore, the DMP states that the <strong>city</strong>’s direct net tax-supported debt should be maintained at<br />
a level considered manageable by the rating agencies given current economic conditions.<br />
Measures <strong>of</strong> economic conditions include per capita income for Glendale residents and the<br />
assessed valuation <strong>of</strong> property within the <strong>city</strong>’s corporate limits.<br />
Within the context <strong>of</strong> the DMP, the ten-year CIP is developed with identified funding sources for<br />
each CIP project. For example, a street project might be funded through one or more <strong>of</strong> the<br />
following financing sources: HURF bonds, general obligation (G.O.) bonds, federal or state<br />
grants, local improvement district funding (LIDs), development impact fees (DIFs) Glendale’s<br />
dedicated transportation sales tax, or Glendale’s general fund excise taxes. In many cases, a<br />
large or multi-year project will be financed using a mix <strong>of</strong> these funding sources.<br />
286<br />
Return to CIP TOC
20<strong>12</strong>-2021 CAPITAL IMPROVEMENT PLAN<br />
Financing the CIP<br />
General Obligation (G.O.) Bonds<br />
G.O. bonds are direct and general obligations <strong>of</strong> the <strong>city</strong>. Glendale uses G.O. bonds to fund most<br />
large-scale capital improvements other than water, sewer, sanitation, landfill and many<br />
transportation-related projects. These bonds are backed by "the full faith and credit" <strong>of</strong> the <strong>city</strong>.<br />
Arizona State law mandates the separation <strong>of</strong> <strong>city</strong> property taxes into two components, the<br />
primary tax levy and the secondary tax levy. A municipality’s secondary property tax revenue<br />
can be used only to pay the principal, interest and redemption charges on bonded indebtedness or<br />
other lawful long-term obligations that are issued or incurred for a specific capital purpose. In<br />
contrast, primary property tax revenue may be used for any lawful purpose.<br />
It is preferable for water and sewer (utilities) revenues to pay for water/sewer G.O. bond debt if<br />
this type <strong>of</strong> financing is used instead <strong>of</strong> revenue bonds. However, if adequate utility revenue is<br />
not available, the <strong>city</strong> can fall back on secondary property tax revenue for water/sewer G.O. bond<br />
debt.<br />
General Obligation Debt Limitations<br />
Arizona’s State Constitution limits G.O. bonded indebtedness to 6% or 20% <strong>of</strong> the <strong>city</strong>'s total<br />
secondary assessed valuation. With this approach, a municipality’s capa<strong>city</strong> to issue additional<br />
G.O. debt will grow as assessed valuation increases and as outstanding G.O. bonds are retired. If<br />
secondary assessed valuation declines, which the <strong>city</strong> has experienced beginning with FY 2010,<br />
then the <strong>city</strong>’s G.O. debt limitations will decrease. The debt limitation – commonly called “bond<br />
capa<strong>city</strong>” and “debt capa<strong>city</strong>” – figures do not represent the amount <strong>of</strong> G.O. debt that could be<br />
supported by the <strong>city</strong>’s current and projected secondary property tax revenue.<br />
G.O. projects in the 20% category are<br />
• Water, sewer, storm sewers (flood control facilities) and artificial light when controlled<br />
by the municipality;<br />
• Open space preserves, parks, playgrounds and recreational facilities;<br />
• Public safety, law enforcement, fire and emergency services facilities; and<br />
• Streets and transportation facilities.<br />
G.O. projects in the 6% category are<br />
• Economic development,<br />
• Historic preservation and cultural facilities,<br />
• General government facilities, and<br />
• Libraries.<br />
Previously, the 6% constitutional limitation applied to public safety, streets and transportation<br />
facilities, but Arizona voters changed this in the November 2006 election with the passage <strong>of</strong><br />
Proposition 104.<br />
287<br />
Return to CIP TOC
20<strong>12</strong>-2021 CAPITAL IMPROVEMENT PLAN<br />
Financing the CIP<br />
Table 2-1 reflects the <strong>city</strong>’s G.O. bond debt limitation as <strong>of</strong> December 31, 2010. Debt<br />
outstanding prior to the passage <strong>of</strong> Proposition 104 for public safety, streets/parking and<br />
transportation facilities is reflected in the 6% category and in the 20% category thereafter. The<br />
amount <strong>of</strong> debt outstanding excludes debt service fund balances.<br />
Table 2-1<br />
Constitutional Debt Limitation<br />
(All Dollars in Thousands)<br />
General Municipal<br />
Purpose Bonds<br />
Water, Sewer, Flood Control,<br />
Light, Parks and Open Space<br />
6% Limitation 1 $105,214 20% Limitation 1,2 $350,714<br />
Less Direct Bonded Debt to<br />
be Outstanding $25,639<br />
Less Direct Bonded Debt to be<br />
Outstanding $193,221<br />
Unused 6% Borrowing<br />
Capa<strong>city</strong> $79,575<br />
Unused 20% Borrowing<br />
Capa<strong>city</strong> $157,493<br />
1 Based on <strong>2011</strong> secondary assessed value <strong>of</strong> $1,753,569,410<br />
2 Public safety, streets/parking & transportation facilities debt prior to Prop. 104 is included in 6% category<br />
Table 2-2 shows the <strong>city</strong>’s bond capa<strong>city</strong> under the state’s constitutional debt limits after<br />
accounting for existing bond issuances that are outstanding. Changes between fiscal years in the<br />
“Outstanding Debt” columns are the result <strong>of</strong> outstanding bonds being paid down. The columns<br />
labeled “Projected Capa<strong>city</strong> Before New Debt” show the amount <strong>of</strong> additional G.O. bonds that<br />
could be sold without violating the state constitutional limits. Note that the “Projected Capa<strong>city</strong><br />
Before New Debt” figures do not reflect the amount <strong>of</strong> G.O. debt that could be supported by the<br />
<strong>city</strong>’s current and projected secondary property tax revenue.<br />
The FY 20<strong>12</strong> secondary assessed valuation figure in Table 2-2 shows a 25% decline in secondary<br />
assessed valuation from the prior FY and reflects the 2009 real estate market. The FY 20<strong>12</strong><br />
valuation figure is the final figure from the Maricopa County Assessor’s Office. The FY 2013 figure<br />
reflects an additional 14% decline from FY 20<strong>12</strong> and is a projection based on the <strong>preliminary</strong><br />
valuation notices that the county assessor’s <strong>of</strong>fice mailed to property owners in February <strong>2011</strong>.<br />
These significant valuation declines are the result <strong>of</strong> the unprecedented real estate market that<br />
dominates urban areas <strong>of</strong> the southwestern United States. In Maricopa County, where Glendale is<br />
located, the median value <strong>of</strong> single family residential properties dropped an astonishing 49% over<br />
four consecutive years. Preliminary data from the Maricopa County Assessor’s Office also indicate<br />
that the median value <strong>of</strong> commercial property continues to decline. The median full cash value <strong>of</strong><br />
commercial property is down 40% since 2009.<br />
288<br />
Return to CIP TOC
20<strong>12</strong>-2021 CAPITAL IMPROVEMENT PLAN<br />
Financing the CIP<br />
These declines in secondary assessed valuation result in lower debt limitation figures (column A) in<br />
FY 20<strong>12</strong> through FY 2016 than those shown in Table 2-1 (above). The decline in property valuation<br />
significantly limits the <strong>city</strong>’s ability to take on new debt. For this reason, no new general obligation<br />
bond sales are planned in the first five years <strong>of</strong> the capital plan. Therefore the table simply reflects<br />
the impact <strong>of</strong> outstanding debt on the <strong>city</strong>’s borrowing capa<strong>city</strong>. The remaining borrowing capa<strong>city</strong><br />
is shown in the last column <strong>of</strong> Table 2-2 below.<br />
Table 2-2<br />
Projected G.O. Debt Capa<strong>city</strong> Before New Debt<br />
(All Dollars in Thousands)<br />
Fiscal<br />
Year<br />
Projected 1<br />
Secondary<br />
Assessed<br />
Value<br />
Limitation<br />
(A)<br />
Outstanding Debt 2<br />
(B)<br />
Projected<br />
Remaining<br />
Capa<strong>city</strong> (A-B)<br />
6% 20% 6% 20% 6% 20%<br />
FY 20<strong>12</strong> $1,313,558 $78,813 $262,7<strong>12</strong> $16,960 $184,720 $61,853 $77,992<br />
FY 2013 $1,<strong>12</strong>4,799 $67,488 $224,960 $<strong>12</strong>,645 $172,850 $54,843 $52,110<br />
FY 2014 $1,043,983 $62,639 $208,797 $8,205 $160,440 $54,434 $48,357<br />
FY 2015 $1,043,983 $62,639 $208,797 $2,880 $149,425 $59,759 $59,372<br />
FY 2016 $1,096,182 $65,771 $219,236 $0 $132,235 $65,771 $87,001<br />
1 FY 20<strong>12</strong> figure reflects actual secondary assessed valuation.<br />
2 Outstanding debt refers to the debt on the principal balance only.<br />
Assessed Valuation<br />
In FY 2009, secondary assessed valuation peaked at just under $2.2 billion, a 20% increase from<br />
FY 2008 and on top <strong>of</strong> a 33% increase from FY 2007 to FY 2008. The FY 2009 valuation<br />
reflected the 2006 real estate market. The FY 2009 secondary assessed valuation reflected<br />
commercial valuation comprising 29% <strong>of</strong> the total, residential comprising 67% and the<br />
remaining 4% included, but was not limited to vacant land, agriculture, railroad and historical<br />
property.<br />
In FY 2010, Glendale’s secondary assessed valuation was approximately $2.1 billion, a 3%<br />
decline from the prior FY. The FY 2010 valuation reflected the 2007 real estate market when<br />
property valuations began to slip. Commercial properties comprised 34% <strong>of</strong> the FY 2010 total,<br />
residential property comprised 62% and the remaining 4% included, but was not limited to<br />
vacant land, agriculture, railroad and historical property.<br />
Glendale’s FY <strong>2011</strong> secondary assessed valuation was approximately $1.8 billion, an 18%<br />
decline from the prior FY. The FY <strong>2011</strong> valuation reflected the 2008 real estate market when<br />
property valuations tumbled downward at an accelerated pace.<br />
289<br />
Return to CIP TOC
20<strong>12</strong>-2021 CAPITAL IMPROVEMENT PLAN<br />
Financing the CIP<br />
For FY 20<strong>12</strong>, Glendale’s secondary assessed valuation is $1.31 billion, a 25% decline from the<br />
prior FY. The FY 20<strong>12</strong> valuation reflects the 2009 real estate market when property values<br />
experienced the most significant plunge. Approximately 56% <strong>of</strong> the FY 20<strong>12</strong> valuation is<br />
attributable to residential property, 40% is attributable to commercial property and the remaining<br />
4% includes, but is not limited to vacant land, agriculture, railroad and historical property.<br />
A fourth consecutive year <strong>of</strong> valuation decline – an additional 14% – is expected with the FY 2013<br />
valuation. The FY 2013 estimate is based on the <strong>preliminary</strong> valuation notices that the county<br />
assessor’s <strong>of</strong>fice mailed to property owners in February <strong>2011</strong> and reflects the 2010 real estate<br />
market.<br />
These astonishing declines are in contrast to the fact that Glendale’s secondary assessed valuation<br />
more than doubled between FY 2004 and FY 2009. This growth was the result <strong>of</strong> the quality<br />
economic development investments the <strong>city</strong> made over the last several years. However, the latest<br />
assessed valuation information means the decline in Glendale property values equates to a loss <strong>of</strong><br />
almost one-half <strong>of</strong> the <strong>city</strong>’s secondary assessed valuation – from a peak at just under $2.2 billion in<br />
FY 2009 to a projected $1.1 billion for FY 2013.<br />
For the future, we are assuming a fifth year <strong>of</strong> decline (7%) in FY 2014, a bottoming out with no<br />
change in FY 2015 and conservative growth between 4% and 5% starting in FY 2016. We<br />
believe these are very conservative valuation assumptions. The average <strong>annual</strong> growth rate in<br />
Glendale’s secondary assessed valuation was 8.7% for the 10 year period <strong>of</strong> 1997–2007 –<br />
representing the real estate markets <strong>of</strong> calendar years 1994 through 2004 – prior to the run up in<br />
property values. The following chart provides a graphical view <strong>of</strong> Glendale’s secondary assessed<br />
valuation changes between FY 2002 and FY 20<strong>12</strong> as well as the projected valuations for FY 2013<br />
through FY 2021.<br />
290<br />
Return to CIP TOC
20<strong>12</strong>-2021 CAPITAL IMPROVEMENT PLAN<br />
Financing the CIP<br />
The impact <strong>of</strong> the steep valuation decline on the <strong>city</strong>’s secondary property tax revenue stream<br />
directly affects the <strong>city</strong>’s capa<strong>city</strong> to support debt service on existing GO bonds, as well as the<br />
<strong>city</strong>’s ability to support additional debt service for new capital projects. The impact and the <strong>city</strong>’s<br />
plan to address the impact are discussed in the next section.<br />
Capital Plan Implications for Secondary Property Tax Rate<br />
Table 2-3 (below) summarizes <strong>annual</strong> debt service requirements for existing bonds outstanding.<br />
No new G.O. bond issuances are shown per the previous discussion for Table 2-2. You will see<br />
that the secondary assessed valuation figures reflect the declines discussed previously in this<br />
capital section.<br />
The estimated secondary property tax rate assumes no change from the $1.3699 that will be<br />
adopted for FY 20<strong>12</strong>. This is in contrast to prior capital plans that assumed a portion <strong>of</strong> the<br />
primary property tax rate would move to the secondary rate each fiscal year, with the total rate<br />
remaining unchanged. This change in assumption was required because the economic downturn<br />
is having an adverse impact on primary property tax revenue that is used in the operating <strong>budget</strong>.<br />
Given the <strong>city</strong>’s financial policy regarding property tax rate stabilization, no changes are<br />
assumed to either the secondary or primary property tax rates.<br />
Table 2-3 also reflects the Build America Bond (BAB) subsidy related to the G. O. bonds sold in<br />
2010 and the DIF Citywide Recreation Facilities Fund (Fund 1480) debt service contributions<br />
related to the Foothills Recreation and Aquatic Center which was funded with proceeds from<br />
2004 G. O. bond sale. The BAB subsidy and DIF debt service contributions directly reduce the<br />
debt service to be covered by secondary property tax revenue and will help address the shortfall<br />
between the <strong>annual</strong> debt service requirements and secondary property tax revenue. The current<br />
G.O. debt is documented in Schedule 7 <strong>of</strong> this <strong>budget</strong> <strong>book</strong>.<br />
Fiscal<br />
Year<br />
Secondary<br />
Assessed<br />
Valuation<br />
Table 2-3<br />
General Obligation Property Tax Bonds<br />
(All Dollars in Thousands with Exception <strong>of</strong> Tax Rate)<br />
Estimated<br />
Secondary<br />
Property<br />
Tax Rev. 1<br />
Existing<br />
Debt<br />
Service 2<br />
Less Build<br />
America<br />
Bond (BAB)<br />
Subsidy<br />
Less<br />
Fund 1480<br />
DIF<br />
Contribution<br />
Proposed<br />
Debt<br />
Service<br />
Total<br />
Debt<br />
Service<br />
FY 20<strong>12</strong> $1,313,558 $17,994_ $25,337_ ($669)_ ($209)_ $0_ $24,459<br />
FY 2013 $1,<strong>12</strong>4,799 $15,409_ $23,971_ ($659)_ ($209)_ $0_ $23,104<br />
FY 2014 $1,043,983 $14,302_ $22,735_ ($647)_ ($209)_ $0_ $21,878<br />
FY 2015 $1,043,983 $14,302_ $25,773_ ($633)_ ($210)_ $0_ $24,930<br />
FY 2016 $1,096,182 $15,017_ $23,644_ ($618)_ ($211)_ $0_ $22,815<br />
1 Assumes the secondary property tax rate <strong>of</strong> $1.3699 remains unchanged through FY 2016<br />
2 Existing debt service includes a transfer <strong>of</strong> $1.4M in FY 20<strong>12</strong> for HURF debt service<br />
291<br />
Return to CIP TOC
20<strong>12</strong>-2021 CAPITAL IMPROVEMENT PLAN<br />
Financing the CIP<br />
Existing G.O. debt service addresses bonds issued over the last several years to pay for numerous<br />
capital projects such as the Emergency Operations Center, Public Safety Training Facility, the<br />
downtown parking garage, fire stations 159 and 151, the Glendale Adult Center, the Foothills<br />
Recreation and Aquatic Center, the Rose Lane Pool Aquatic Center, various flood control<br />
projects such as the Bethany Home Outfall Channel, and the downtown pl<strong>az</strong>a and civic center<br />
annex.<br />
Table 2-3 clearly illustrates the gap between estimated secondary property tax revenue and G.O.<br />
debt service on existing bonds once the BAB subsidy and impact fee contribution are taken into<br />
account. Significantly less revenue is projected to come in to pay debt service on existing GO<br />
bonds, let alone to fund any new projects, as a result <strong>of</strong> the:<br />
• Unprecedented decline in assessed valuation across the real estate market<br />
• Reduction in the assessment ratio for commercial properties per state statutes<br />
• Reduction <strong>of</strong> the <strong>city</strong>’s secondary property tax rate in FY 2008 and FY 2009<br />
Given Council’s prior direction to keep the secondary property tax rate unchanged, the first five<br />
years <strong>of</strong> the G.O. component <strong>of</strong> the CIP had to be restructured to push back into the last five<br />
years <strong>of</strong> the plan all but two projects (plus any carryover from projects currently underway). The<br />
two projects retained in the first five years <strong>of</strong> the G.O. component <strong>of</strong> the CIP are listed below.<br />
• One is in the Public Safety category and is related to ongoing improvements to the public<br />
safety digital communication system.<br />
• The second project is in the Flood Control category and addresses the cost <strong>of</strong> a regulatory<br />
permit the <strong>city</strong> is required to maintain.<br />
Notable G.O. projects on hold are the completion <strong>of</strong> the new Municipal Court and the West Area<br />
Library. Both <strong>of</strong> these projects were in FY 2015 in the adopted FY <strong>2011</strong> – 2020 CIP (FY <strong>2011</strong><br />
<strong>budget</strong> <strong>book</strong>); they are now in the last five years <strong>of</strong> the capital plan.<br />
The significantly changed landscape will necessitate an evaluation <strong>of</strong> the <strong>city</strong>’s secondary<br />
property tax rate over the next year. This is especially true if the <strong>city</strong> is not able to restructure<br />
existing G.O. bond debt service along more favorable terms so <strong>annual</strong> debt service payments can<br />
more closely match the diminished revenue stream.<br />
If this declining trend in property values continues beyond next year, as projected, the <strong>city</strong> will<br />
have to consider a change to the way it assesses secondary property tax to maintain a fiscally<br />
sound plan to protect our bond rating for the future. One concept staff will evaluate over the<br />
summer and fall is the one used by many valley communities today. That approach is based on<br />
establishing a rate based on the funds needed to service outstanding debt issuances, the capital<br />
needs <strong>of</strong> the <strong>city</strong> and the minimum fund balance needed to maintain a fiscally sound plan.<br />
The plan <strong>of</strong> action is to evaluate debt restructuring options through this upcoming fall and return<br />
to Council with a revised DMP and recommended options for Council’s <strong>annual</strong> retreat. This<br />
timeframe allows staff to evaluate fully the range <strong>of</strong> options as well as assess the <strong>2011</strong> real estate<br />
market, which will affect the secondary property tax revenue to be received in FY 2014.<br />
292<br />
Return to CIP TOC
20<strong>12</strong>-2021 CAPITAL IMPROVEMENT PLAN<br />
Financing the CIP<br />
Voter Authorization<br />
Under Arizona State law, cities can obtain long-term financing through the use <strong>of</strong> G.O. bonds<br />
only with the approval <strong>of</strong> voters. On November 2, 1999, the City Council placed on the ballot a<br />
variety <strong>of</strong> proposed capital improvements recommended by the Citizen Bond Election<br />
Committee and the Management Team, resulting in voters approving all $411.5 million <strong>of</strong> bonds<br />
requested.<br />
In 2006, City Council established an Ad-Hoc Citizens Bond Election Committee to consider<br />
whether additional authorization was needed to support the Council approved FY 2007-16 CIP.<br />
On May 15, 2007, voters approved $218 million <strong>of</strong> the $270 million bond request recommended<br />
by the 2006 Ad-Hoc Citizen Bond Election Committee.<br />
The time between a bond election varies depending on how much the voters approve in a given<br />
election and how many capital projects are initiated. Bond sale proceeds must be used for the<br />
purposes specified in the bond authorization election. Remaining bond funds in one bond<br />
category may not be used to fund projects in another bond category. Table 2-4 shows the<br />
projected remaining voter authorization for G.O. bonds by authorization category. The<br />
remaining authorization numbers reflect unused authorization from the October 1981, March<br />
1987, November 1999 and May 2007 bond elections.<br />
Table 2-4<br />
Projected Remaining G.O. Bond Voter Authorization<br />
(All Dollars in Thousands)<br />
Category FY <strong>2011</strong> 1 FY 20<strong>12</strong> FY 2013 FY 2014 FY 2015 FY 2016<br />
Public Safety $104,473 $104,473 $104,473 $104,473 $104,473 $104,473<br />
Landfill $15,540 $15,540 $15,540 $15,540 $15,540 $15,540<br />
Library $17,096 $17,096 $17,096 $17,096 $17,096 $17,096<br />
Streets/Parking 2,3 $67,238 $67,238 $67,238 $67,238 $67,238 $67,238<br />
Cultural/Historical 2 $13,721 $13,721 $13,721 $13,721 $13,721 $13,721<br />
Transit 2 $6,750 $6,750 $6,750 $6,750 $6,750 $6,750<br />
Econ. Development $32,627 $32,627 $32,627 $32,627 $32,627 $32,627<br />
Govt. Facilities 2 $30,200 $30,200 $30,200 $30,200 $30,200 $30,200<br />
Open Space/Trails $50,525 $50,525 $50,525 $50,525 $50,525 $50,525<br />
Parks $14,637 $14,637 $14,637 $14,637 $14,637 $14,637<br />
Flood Control $10,522 $10,522 $10,522 $10,522 $10,522 $10,522<br />
1<br />
Remaining authorization as <strong>of</strong> June 30, <strong>2011</strong><br />
2<br />
Bonds can be issued as G. O. Bonds, Revenue Bonds or both.<br />
3<br />
Streets/Parking voter authorization can be used for Street Revenue Bonds that are repaid with HURF revenue<br />
293<br />
Return to CIP TOC
20<strong>12</strong>-2021 CAPITAL IMPROVEMENT PLAN<br />
Financing the CIP<br />
Revenue Bonds<br />
The City <strong>of</strong> Glendale can currently make use <strong>of</strong> four types <strong>of</strong> revenue bonds: HURF,<br />
transportation, water/sewer (utilities) and landfill. The principal and interest on these bonds will<br />
be paid from future revenue derived from state highway user revenue fees, the <strong>city</strong>’s<br />
transportation sales tax, and user fees for water, sewer and landfill services. Although revenue<br />
bonds may incur slightly higher interest costs than G.O. bonds, revenue bonds do not affect the<br />
<strong>city</strong>'s debt limitation. However revenue bonds do require voter authorization unless an<br />
alternative form <strong>of</strong> financing is chosen.<br />
Street Revenue Bonds: The State <strong>of</strong> Arizona shares with cities a portion <strong>of</strong> the revenues it<br />
collects from highway user fees. This revenue is tracked in the Streets Fund (Fund 1340) and is<br />
known as HURF revenue. The Arizona State Constitution restricts the use <strong>of</strong> HURF revenue to<br />
street and highway purposes such as right-<strong>of</strong>-way acquisition, construction, reconstruction,<br />
maintenance, repair and the payment <strong>of</strong> the interest and principal on HURF bonds.<br />
HURF <strong>of</strong>ten is called the gas tax even though there are several other transportation-related fees,<br />
including a portion <strong>of</strong> the vehicle license tax, that comprise this revenue source. Much <strong>of</strong> this<br />
revenue source is based on the volume <strong>of</strong> fuel sold rather than the price <strong>of</strong> fuel.<br />
In the past, the Arizona Legislature has altered, and may in the future alter, (1) the type and/or<br />
rate <strong>of</strong> taxes, fees and charges to be deposited into the Arizona Highway Revenue Fund and (2)<br />
the allocation <strong>of</strong> such monies among the Arizona Department <strong>of</strong> Transportation, Arizona cities<br />
and counties and other purposes. In fact, the Arizona Legislature reduced the amount <strong>of</strong> funds<br />
allocated to cities in FY 2009 through FY 20<strong>12</strong>.<br />
HURF bond-funded projects require voter authorization (either HURF voter authorization or<br />
streets/parking G.O. voter authorization) but do not affect the <strong>city</strong>'s debt limitation. By state law,<br />
when a <strong>city</strong> sells this type <strong>of</strong> bond, the maximum projected <strong>annual</strong> total debt service payment<br />
cannot exceed one-half <strong>of</strong> the previous year’s revenue allocation. Because <strong>of</strong> the volatility <strong>of</strong><br />
highway user revenues, the City Council directed staff to cap the street bond debt service to total<br />
highway user revenue ratio slightly below the state limit <strong>of</strong> .50. The <strong>city</strong>’s target for CIP<br />
purposes is to remain at or near a .45 debt service to revenue ratio. Table 2-5 summarizes the<br />
debt service to revenue ratio for HURF bonds. The current HURF debt service is documented in<br />
Schedule 7.<br />
There are no HURF bond sales planned for FY 20<strong>12</strong> through FY 2016. The HURF revenue<br />
figures assume the state will continue with the reduced distribution approach in place in FY 2009<br />
through FY 20<strong>12</strong>. Consequently, HURF revenue will cover only $1.4M <strong>of</strong> the HURF debt<br />
service, while the remaining revenue will be used to pay street operating costs in FY 20<strong>12</strong>. The<br />
remaining $3.3M in <strong>annual</strong> HURF debt service will be paid by contributions from the roadway<br />
development impact fee fund, the transportation sales tax fund and the general obligation debt<br />
service fund balance.<br />
294<br />
Return to CIP TOC
20<strong>12</strong>-2021 CAPITAL IMPROVEMENT PLAN<br />
Financing the CIP<br />
Fiscal<br />
Year<br />
Highway<br />
User Tax<br />
Revenues*<br />
Table 2-5<br />
Street Revenue Bonds<br />
(All Dollars in Thousands)<br />
Existing<br />
Debt<br />
Service<br />
Proposed<br />
Debt<br />
Service<br />
Total<br />
Debt<br />
Service<br />
Annual<br />
Coverage<br />
Debt Service<br />
to Prev. Year<br />
Revenue %<br />
FY <strong>2011</strong> $13,600 $4,700 $0 $4,700 N/A N/A<br />
FY 20<strong>12</strong> $11,416 $4,706 $0 $4,706 2.43 35%<br />
FY 2013 $11,507 $4,709 $0 $4,709 2.44 41%<br />
FY 2014 $11,599 $4,696 $0 $4,696 2.47 41%<br />
FY 2015 $11,692 $1,958 $0 $1,958 5.97 17%<br />
FY 2016 $11,785 $1,977 $0 $1,977 5.96 17%<br />
* FY <strong>2011</strong> estimated revenue; FY 20<strong>12</strong>-2016 projected revenues<br />
Transportation Sales Tax Revenue Bonds: On November 6, 2001, Glendale held a special<br />
election where voters passed a new half-cent sales tax to fund a new transportation plan. The<br />
transportation plan was created to improve service for all modes <strong>of</strong> transportation, including<br />
public transit, motorized vehicle, bicycle, pedestrian and aviation. Of the 13,019 ballots cast for<br />
this proposition, 64% were in favor and 36% were in opposition. By their votes, Glendale<br />
residents indicated that having transportation choices and being connected to regional activities<br />
and employment centers were important to maintaining Glendale’s high quality <strong>of</strong> life.<br />
Everyone who shops in Glendale pays the half-cent sales tax, which became effective January 1,<br />
2002. The revenues are dedicated to funding the implementation <strong>of</strong> the Glendale Onboard!<br />
(GO) Transportation Plan. The sales tax has no termination date because it will be used for<br />
future transit operating costs that are ongoing. The transportation capital and operating <strong>budget</strong>s<br />
are balanced yearly.<br />
Table 2-6 displays proposed revenue bond sales to support capital projects in the transportation<br />
sales tax program. The table summarizes <strong>annual</strong> revenue expected from the designated sales tax,<br />
future bond sale amounts, the corresponding debt service, and the resulting coverage ratio. The<br />
minimum debt coverage ratio that was established for the FY 2008 transportation sales tax<br />
revenue bond issuance is 2.0. Please see the Glendale Onboard Annual Report for more<br />
information.<br />
295<br />
Return to CIP TOC
20<strong>12</strong>-2021 CAPITAL IMPROVEMENT PLAN<br />
Financing the CIP<br />
Fiscal<br />
Year<br />
Transportation<br />
Sales Tax<br />
Revenue<br />
Table 2-6<br />
Transportation Revenue Bonds<br />
(All Dollars in Thousands)<br />
Bond<br />
Sales<br />
Existing<br />
Debt<br />
Service<br />
Proposed<br />
Debt<br />
Service<br />
Total<br />
Debt<br />
Service<br />
Annual<br />
Coverage<br />
FY 20<strong>12</strong> $19,200 $13,000 $7,327 $969 $8,296 2.31<br />
FY 2013 $19,717 $0 $7,326 $969 $8,295 2.38<br />
FY 2014 $20,407 $0 $7,326 $969 $8,295 2.46<br />
FY 2015 $21,332 $11,000 $7,326 $1,789 $9,115 2.34<br />
FY 2016 $22,414 $0 $7,326 $1,789 $9,115 2.46<br />
Water/Sewer Revenue Bonds: The <strong>city</strong> can sell bonds that pledge water/sewer utility revenues<br />
as payment for bond debt service. Water/sewer revenue bond sales are limited by Ordinance<br />
1323 New Series (adopted in 1984) and Ordinance 1784 New Series (adopted in 1993).<br />
Glendale’s bond covenant states that net utility revenue (i.e. revenues less operating costs) will<br />
be at least 1.2 times the maximum debt service due in any succeeding fiscal year; this is the bond<br />
debt service coverage ratio. Adjustments in net revenue may be made in some circumstances;<br />
restatement <strong>of</strong> debt service on variable rate and certain other types <strong>of</strong> debt is permitted; and<br />
refunding and compound interest bonds may be issued under different tests.<br />
In December 2003, the <strong>city</strong> entered into a trust agreement and issued subordinate lien<br />
obligations. Subordinate lien obligations are not bonds; they are junior and subordinate to the<br />
lien on water/sewer system revenues from existing <strong>city</strong> revenue bonds. Obligations <strong>of</strong>fer the <strong>city</strong><br />
the ability to take advantage <strong>of</strong> historically low interest rates at a time when adequate bond<br />
authorization is unavailable.<br />
Table 2-7 displays projected water/sewer bond sales and coverage ratios. FY 20<strong>12</strong>-16 CIP<br />
projects for the water and sewer system will be funded with one <strong>of</strong> the financing sources<br />
described above. The current water/sewer debt is documented in Schedule 7 <strong>of</strong> this <strong>budget</strong> <strong>book</strong>.<br />
Table 2-7<br />
Water/Sewer Planned Bonds & Coverage Ratios<br />
(All Dollars in Thousands)<br />
Fiscal Year Bond Sales<br />
Annual<br />
Coverage Ratio<br />
FY 20<strong>12</strong> $0 1.24<br />
FY 2013 $9,000 1.31<br />
FY 2014 $0 1.43<br />
FY 2015 $10,000 1.52<br />
FY 2016 $36,500 1.49<br />
296<br />
Return to CIP TOC
20<strong>12</strong>-2021 CAPITAL IMPROVEMENT PLAN<br />
Financing the CIP<br />
The FY 20<strong>12</strong> rate recommendation for the water/sewer enterprise fund is for no change to the<br />
rates currently in effect. This recommendation is based on the <strong>annual</strong> update <strong>of</strong> the individual<br />
rate models for each <strong>of</strong> the enterprise funds that are used to develop a balanced capital plan for<br />
each operation. This rate recommendation is the result <strong>of</strong>:<br />
• The deferral <strong>of</strong> non-essential growth-related capital projects<br />
• Continuation <strong>of</strong> critical repair, maintenance and replacement <strong>of</strong> existing capital assets<br />
such as underground pipes<br />
• Continuation <strong>of</strong> capital projects that ensure compliance with applicable federal, state and<br />
county regulations<br />
• Ongoing improvements in operational efficiencies to minimize cost increases related to<br />
fuel, equipment and electri<strong>city</strong>.<br />
Landfill Revenue Bonds: Landfill revenue bonds fund environmental improvements required<br />
by federal and state law as well as improvements relating to constructing, extending, improving<br />
and repairing the Glendale Municipal Landfill. Users <strong>of</strong> the Glendale Municipal Landfill include<br />
both outside haulers and the <strong>city</strong>’s residential and commercial solid waste operations. Landfill<br />
CIP projects will be funded from operating revenues over the next few years. The voter<br />
authorization for landfill revenue bonds as <strong>of</strong> June 30, <strong>2011</strong>, was $15.5 million.<br />
Other Capital Financing Options<br />
Local Improvement District Bonds: Local improvement districts (LIDs) are legally designated<br />
geographic areas in which a majority <strong>of</strong> the affected property owners agree to pay for one or<br />
more capital improvements through a supplemental assessment. This financing approach ties the<br />
repayment <strong>of</strong> debt to those property owners who most directly benefit from the improvements<br />
financed. The <strong>city</strong>’s most recent LID was formed in 1993 to finance the construction <strong>of</strong><br />
improvements on Bell Road, from 67th Avenue to 83rd Avenue, and the Arrowhead Mall area.<br />
There are several financial and practical constraints that can limit the formation <strong>of</strong> such districts.<br />
While LID bonds are not subject to specific debt limits, LID debt appears in the <strong>city</strong>'s financial<br />
statements as an obligation <strong>of</strong> the <strong>city</strong>, and therefore can affect the <strong>city</strong>’s bond ratings. In<br />
addition, it may be difficult to obtain the consent <strong>of</strong> the number <strong>of</strong> property owners needed to<br />
create a LID. Residential property owners and business property owners in the same area may<br />
have different concerns, priorities and financial assets. Finally, a LID usually is not a viable<br />
option in lower-income areas.<br />
For capital plan purposes, it is assumed that any new LIDs either will be fully funded by private<br />
property owners or the <strong>city</strong>’s financial participation will be limited to a small “general <strong>city</strong><br />
contribution” for the share <strong>of</strong> improvements that benefits property owners outside the district.<br />
The formation <strong>of</strong> a LID can affect the CIP positively by accelerating the completion <strong>of</strong> a capital<br />
improvement already in the CIP or negatively by delaying other scheduled projects in order to<br />
finance the <strong>city</strong>’s LID contribution.<br />
297<br />
Return to CIP TOC
20<strong>12</strong>-2021 CAPITAL IMPROVEMENT PLAN<br />
Financing the CIP<br />
Municipal Property Corporation Bonds: A <strong>city</strong> may form a Municipal Property Corporation<br />
(MPC) to finance a large capital project. An MPC is a non-pr<strong>of</strong>it organization over which the<br />
<strong>city</strong> exercises oversight authority, including the appointment <strong>of</strong> its governing board. This<br />
mechanism allows the <strong>city</strong> to finance a needed capital improvement and then purchase the<br />
improvement from the corporation over a period <strong>of</strong> years.<br />
In order for the MPC to market the bonds, a <strong>city</strong> will typically pledge unrestricted excise taxes.<br />
Unrestricted excise taxes are generally all excise, transaction privilege, franchise and income<br />
taxes. In fact, MPC debt service is paid with General Fund operating dollars and this is a serious<br />
limitation <strong>of</strong> this financing option. (The General Fund operating <strong>budget</strong> contribution is reflected<br />
as a transfer from the General Fund to the MPC debt service fund in Schedule 4 <strong>of</strong> this<br />
document). While the <strong>city</strong> has potential MPC bond capa<strong>city</strong>, a large issuance <strong>of</strong> MPC bonds<br />
could place a significant strain on the overall General Fund operating <strong>budget</strong>.<br />
Before entering into a purchase agreement with the MPC, the <strong>city</strong> also will pledge that actual<br />
<strong>annual</strong> excise tax collections will be at least three times the maximum <strong>annual</strong> debt service<br />
payment for all senior MPC bonds. The <strong>city</strong> has formed and entered into agreements to sell<br />
MPC bonds to fund several construction projects, including the following:<br />
• Glendale Municipal Office Complex,<br />
• Jobing.com Arena,<br />
• Glendale Media Center and Expo Hall, Convention Center and Parking Garage adjacent<br />
to the Westgate development in west Glendale,<br />
• a portion <strong>of</strong> the Glendale Regional Public Safety Training Facility, and<br />
• infrastructure for the Zanjero development.<br />
Table 2-8 shows the current amount <strong>of</strong> MPC principal debt outstanding as <strong>of</strong> July 1, <strong>2011</strong>. It is<br />
anticipated that the debt service on these obligations will be paid by the undesignated portion <strong>of</strong><br />
<strong>city</strong> sales tax receipts from the projects that benefit from the capital improvements, with any<br />
shortfalls addressed by the General Fund transfer. The current MPC debt is documented in<br />
Schedule 7 <strong>of</strong> this <strong>budget</strong> <strong>book</strong>.<br />
298<br />
Return to CIP TOC
20<strong>12</strong>-2021 CAPITAL IMPROVEMENT PLAN<br />
Financing the CIP<br />
Table 2-8<br />
Outstanding Municipal Property Bonds<br />
(as <strong>of</strong> July 1, 2010)<br />
Issue<br />
Year<br />
Issued<br />
Principal<br />
Balance<br />
Outstanding<br />
MPC Bonds - Arena Tax Exempt 2003A $44,400,000<br />
MPC Bonds - Arena Taxable 2003B $96,065,000<br />
MPC Bonds - Refund Imp Dist 2004A $5,295,000<br />
MPC Bonds – Glendale Regional Public<br />
Safety Training Facility/Zanjero<br />
MPC Bonds – Media Center/Convention<br />
Center/Parking Garage<br />
MPC Bonds - Media Center/Convention<br />
Center/Parking Garage<br />
MPC Bonds - Media Center/Convention<br />
Center/Parking Garage<br />
2006A $28,370,000<br />
2008A $32,220,000<br />
2008B $51,075,000<br />
2008C $5,650,000<br />
AMFP Series 14 - Arena 2002 $5,055,000<br />
AMFP Refunding Series 16 - Arena 2003 $7,250,000<br />
TOTAL $275,380,000<br />
Lease Financing: Lease financing provides long-term financing for the purchase <strong>of</strong> equipment<br />
or other capital improvements and does not affect the <strong>city</strong>’s G.O. bond capa<strong>city</strong> and does not<br />
require voter approval. In a lease transaction, the asset being financed can include new capital<br />
needs, assets under existing lease agreements or, in some cases, equipment purchased in the past<br />
for which the government or municipal unit would prefer to be reimbursed and paid over time.<br />
Title to the asset is transferred to the <strong>city</strong> at the end <strong>of</strong> the lease term.<br />
Table 2-9 reflects the expected FY 20<strong>12</strong> payments for capital leases and notes under contract by<br />
the <strong>city</strong>. It should be noted that the Hickman/Motorola lease and Northern Crossing note are<br />
being restructured at the time this document was prepared. The new financing schedules for<br />
those obligations will be reflected in the FY 2013 <strong>budget</strong> <strong>book</strong>. The complete lease/note debt is<br />
documented in Schedule 8 <strong>of</strong> this <strong>budget</strong> <strong>book</strong>.<br />
299<br />
Return to CIP TOC
20<strong>12</strong>-2021 CAPITAL IMPROVEMENT PLAN<br />
Financing the CIP<br />
Lease Financing<br />
Table 2-9<br />
Outstanding Leases<br />
(as <strong>of</strong> July 1, <strong>2011</strong>)<br />
Year<br />
Issued<br />
Original<br />
Amount<br />
FY 20<strong>12</strong> Scheduled<br />
Lease Payment 1<br />
Hickman/Motorola Lease 2003 $10,800,000 $360,000<br />
Equipment Lease 2007 $1,368,800 $165,994<br />
Equipment Lease 2009 $1,189,365 $249,877<br />
Total Lease Financing $775,871<br />
Notes<br />
Northern Crossing Note 2002 $14,500,000 $32,196<br />
Total Note Financing $32,196<br />
Grant Total $808,067<br />
1 Includes principal, interest and expected savings from lease/note restructuring.<br />
Grants: The majority <strong>of</strong> Glendale’s grants for capital projects come from the federal or state<br />
government. There are two major types <strong>of</strong> grants. Open, competitive grant programs usually<br />
<strong>of</strong>fer a great deal <strong>of</strong> latitude in developing a proposal and grants are awarded through a<br />
competitive review process. The existing Arizona Heritage Fund grants for parks and historic<br />
preservation capital projects are an example <strong>of</strong> competitive grants.<br />
Entitlement or categorical grants are allocated to qualified governmental entities based on a<br />
formula basis (e.g., by population, income levels, etc.). Entitlement funds must be used for a<br />
specific grantor-defined purpose. Community Development Block Grants (CDBG) are<br />
considered entitlement grants and typically must benefit low-moderate income residents.<br />
A new entitlement grant was awarded to the <strong>city</strong> during FY 2010 that will move forward several<br />
energy efficiency capital projects are moving forward. Specifically, Glendale is the recipient <strong>of</strong> a<br />
$2.3 million allocation through the American Recovery and Reinvestment Act’s (ARRA) Energy<br />
Efficiency and Conservation Block Grant. This grant funding will allow for capital projects to be<br />
completed that otherwise may not be completed for several years. Some <strong>of</strong> the capital projects<br />
already completed or under construction at the time this document was prepared include:<br />
• replacement <strong>of</strong> outdated lighting systems at the public safety/court facility, the main<br />
library and sport courts in the <strong>city</strong>’s parks with energy efficient lighting systems;<br />
• an upgrade to the ultraviolet disinfection system at the Arrowhead Wastewater<br />
Reclamation Facility; and<br />
• completion <strong>of</strong> the LED conversion program for the remaining 30 (<strong>of</strong> 190) signalized<br />
intersections.<br />
300<br />
Return to CIP TOC
20<strong>12</strong>-2021 CAPITAL IMPROVEMENT PLAN<br />
Financing the CIP<br />
It is important to note that most federal and state grant programs, with the exception <strong>of</strong> some<br />
public housing programs, require the applicant to contribute to the cost <strong>of</strong> the project. The<br />
required contribution, referred to as local match, can vary from 5% to 75%. Federal<br />
Transportation Administration grants for public transit improvements and Federal Aviation<br />
Administration grants for airport projects are examples <strong>of</strong> capital improvement grants for which<br />
local matching requirements will come from the <strong>city</strong>’s operating <strong>budget</strong> and/or the <strong>city</strong>’s<br />
transportation sales tax.<br />
Many federal and state grant programs specifically prohibit the applicant from using other<br />
government grants as match, and require that the match be cash rather than donated services.<br />
Therefore, matching funds usually come from General Fund department operating <strong>budget</strong>s, G.O.<br />
bonds or development impact fees.<br />
There is always a possibility that some <strong>of</strong> the grant-funded projects will be delayed or not<br />
completed if government grants fail to materialize. CIP projects adversely affected by changes<br />
in the availability <strong>of</strong> grants may be postponed until the needed grant funds are acquired, the<br />
project is modified to reduce costs, or the project is funded using alternative means.<br />
Operating Budget - Pay-As-You-Go: Many capital improvements and purchases <strong>of</strong> large<br />
pieces <strong>of</strong> equipment are included in the operating <strong>budget</strong> on a pay-as-you-go basis. The <strong>city</strong>’s<br />
FY 20<strong>12</strong> operating <strong>budget</strong> also provides for the maintenance <strong>of</strong> capital assets and expenses<br />
associated with the growth and depreciation <strong>of</strong> <strong>city</strong> facilities and equipment.<br />
A vehicle replacement fund for most <strong>city</strong> vehicles, including police patrol cars, and a technology<br />
replacement fund for desktop computers, servers, optical scanning equipment, and other related<br />
technology are included in the operating <strong>budget</strong>. Typically, each department pays <strong>annual</strong>ly into<br />
each fund based on the equipment in its inventory and the expected life span and value <strong>of</strong> the<br />
equipment.<br />
Specialized vehicles such as street sweepers, and recurring maintenance costs such as asphalt<br />
repairs and sealcoating, are also funded from the operating <strong>budget</strong>. Some capital improvements<br />
are paid for on a cash basis in order to avoid the interest costs incurred with other financing<br />
mechanisms.<br />
Other Financing Alternatives<br />
The City <strong>of</strong> Glendale’s ongoing challenge to balance the service and infrastructure needs <strong>of</strong> its<br />
current residents with those <strong>of</strong> its future residents is not unique. Every <strong>city</strong> that experiences<br />
prolonged periods <strong>of</strong> growth is looking for ways to more equitably distribute the cost <strong>of</strong> capital<br />
improvements based on usage levels and derived benefit.<br />
Forming New Utilities: Some cities form a utility to finance and maintain infrastructure for a<br />
specific purpose. Examples include streetlights and storm sewers. Rates for these services might<br />
be set according to the expected level <strong>of</strong> facility usage. For example, monthly storm sewer<br />
301<br />
Return to CIP TOC
20<strong>12</strong>-2021 CAPITAL IMPROVEMENT PLAN<br />
Financing the CIP<br />
billing rates could be set according to the amount <strong>of</strong> run<strong>of</strong>f typically generated by different types<br />
and sizes <strong>of</strong> property.<br />
One advantage <strong>of</strong> usage-based rates is that some <strong>of</strong> the cost burden is redistributed from the lowend<br />
user (i.e. the residential sector) to the high-end user (i.e. the commercial sector). For<br />
example, a shopping center generates more run<strong>of</strong>f per acre than a residential dwelling, and would<br />
pay a proportionately higher storm water utility bill. Currently, the <strong>city</strong> does not use this<br />
method.<br />
Community Facilities Districts: Community facilities districts (CFDs), enabled by the Arizona<br />
Legislature, can provide another mechanism for targeting the funding <strong>of</strong> capital improvements to<br />
the specific area or population that benefits from the improvement. The CFD is conceptually<br />
similar to LID’s, but a CFD is given much broader authority in the type <strong>of</strong> tax or fee<br />
implemented and the use <strong>of</strong> the revenue. As an example, a CFD can levy a tax or fee for the<br />
ongoing maintenance <strong>of</strong> a capital improvement. Currently, the <strong>city</strong> does not have any CFDs<br />
established.<br />
302<br />
Return to CIP TOC
20<strong>12</strong>-2021 CAPITAL IMPROVEMENT PLAN<br />
CIP Operating Impact<br />
IMPACT OF THE CIP ON THE OPERATING BUDGET<br />
Glendale’s operating <strong>budget</strong> is directly affected by the CIP. Almost every new capital<br />
improvement entails additional ongoing expenses for routine operation, repair and maintenance<br />
upon completion or acquisition that must be incorporated into the operating <strong>budget</strong>. Also, many<br />
new capital facilities require the addition <strong>of</strong> new positions. Existing <strong>city</strong> facilities and equipment<br />
that were once considered state-<strong>of</strong>-the-art will require rehabilitation, renovation or upgrades to<br />
accommodate new uses and/or address safety and structural improvements. Older facilities<br />
usually involve higher maintenance and repair costs as well. PAYGO capital projects, grantmatching<br />
funds and lease/purchase capital expenses also come directly from the operating <strong>budget</strong>.<br />
The costs <strong>of</strong> future operations and maintenance for new CIP projects are estimated by each<br />
department based on a detailed set <strong>of</strong> cost guidelines that is provided to all departments each year.<br />
These guidelines are updated <strong>annual</strong>ly in conjunction with the various departments that are experts<br />
on different types <strong>of</strong> operating costs. For instance, the FY 20<strong>12</strong> – 2021 CIP reflects the following<br />
estimated operating cost for capital projects:<br />
• between $2.01 and $3.39 per sq ft <strong>annual</strong>ly for electrical and gas costs in a building;<br />
• between $2.00 and $3.00 per sq ft <strong>annual</strong>ly for building maintenance, including HVAC,<br />
plumbing, electrical and structural repairs;<br />
• $1.62 per sq ft <strong>annual</strong>ly for custodial services;<br />
• $0.195 per sq ft <strong>annual</strong>ly for building water usage;<br />
• $341.26 per month for refuse (two 6 yard containers picked up three times a week);<br />
• Vehicle <strong>annual</strong> replacement contributions, maintenance and fuel costs:<br />
o ½-Ton Pickup: $2,050 <strong>annual</strong> replacement cost, $0.17/$0.22 per mile maintenance/gas;<br />
o Mid-Size Sedan: $2,785 <strong>annual</strong> replacement cost, $0.17/$0.14 per mile maintenance/gas;<br />
• Technology <strong>annual</strong> replacement contributions:<br />
o Desktop Computer: $540.00;<br />
o Laptop Computer: $640.00;<br />
o Color Printer: $1,053.00.<br />
CIP projects involving land acquisitions in anticipation <strong>of</strong> future needs also increase operating<br />
<strong>budget</strong> costs. Vacant parcels typically have an operating <strong>budget</strong> impact because <strong>of</strong> new<br />
maintenance costs related to fencing, security, weed control, etc., until the land is needed for new<br />
parks, libraries, water treatment facilities, etc. However, even with these additional costs, it <strong>of</strong>ten<br />
is more cost effective to purchase land before an area has been fully developed.<br />
Operating costs are carefully considered in deciding which projects move forward in the CIP<br />
because it is not possible for the <strong>city</strong> to fund concurrently several large-scale projects that have<br />
significant operating <strong>budget</strong> impacts. Therefore, implementation timetables are established that<br />
stagger projects over time.<br />
Council reviews operating and maintenance costs associated with capital projects scheduled to<br />
come on-line in the upcoming fiscal year during the <strong>annual</strong> spring <strong>budget</strong> workshops. If operating<br />
303<br />
Return to CIP TOC
20<strong>12</strong>-2021 CAPITAL IMPROVEMENT PLAN<br />
CIP Operating Impact<br />
and maintenance costs have been identified in a project the departments are required to either<br />
absorb the additional costs or submit a supplemental request to receive funding. Supplemental<br />
requests for CIP operating and maintenance costs are balanced against other requests for<br />
additional funding.<br />
Many improvements make a positive contribution to the fiscal well being <strong>of</strong> the <strong>city</strong>. Capital<br />
projects such as redevelopment <strong>of</strong> under-performing or under-used areas <strong>of</strong> the <strong>city</strong>, and the<br />
infrastructure expansion needed to support new development, help promote the economic<br />
development and growth that generates additional operating revenues. These new revenue sources<br />
provide the funding needed to maintain, improve and expand the <strong>city</strong>’s infrastructure.<br />
The table below summarizes the projected cumulative impact <strong>of</strong> the CIP on the <strong>city</strong>’s operating<br />
<strong>budget</strong> over the next 10 years, by category. Detailed operating cost estimates are included in the<br />
project detail section <strong>of</strong> the CIP. If applicable, each project contains an operating and<br />
maintenance description, as well as a projection for the operating costs for the first five years and a<br />
five-year aggregate estimate for the second five years for personnel, supplies, utilities, insurance,<br />
etc. In many instances an inflation rate <strong>of</strong> 3% is figured into the ongoing operating and<br />
maintenance costs each year. Until such time that supplemental requests are again being<br />
considered, departments have been directed to either defer projects to a later year or absorb<br />
additional costs into their current operating <strong>budget</strong>.<br />
Operating Impact by CIP Project Type<br />
Project Type S/A FY 20<strong>12</strong> FY 2013 FY 2014 FY 2015 FY 2016 FY's 2017-21<br />
Water & Sewer Projects<br />
Transportation Sales Tax Projects<br />
All Other Transportation Projects<br />
(DIF, HURF & Streets)<br />
Park Projects<br />
Library Projects<br />
Public Safety Projects<br />
Landfill Sanitation Projects<br />
Economic Development Projects<br />
Other Projects<br />
TOTAL Operating Impact<br />
S - - - 20,000 57,732 7,658,035<br />
A - 17,000 17,510 18,035 18,576 101,583<br />
S - <strong>12</strong>9,316 151,702 167,847 184,824 1,210,434<br />
A - 270 278 286 295 1,613<br />
S - 7,540 7,766 26,232 27,019 9,679,423<br />
A 7,320 - - - - -<br />
S - - - - - 18,359,569<br />
A - - - - - 58,334<br />
S - - - - - 9,023,866<br />
A - - - - - -<br />
S - - - - - 19,116,323<br />
A - - - - - -<br />
S - - - - - -<br />
A - - 22,000 22,660 23,340 348,184<br />
S - 3,278 3,377 3,478 3,582 19,586<br />
A 5,563 2,452 2,525 2,601 2,679 14,649<br />
S - 169,149 174,223 179,450 184,833 7,716,031<br />
A 2,000 2,060 2,<strong>12</strong>2 2,186 2,252 484,565<br />
S $0 $309,283 $337,068 $397,007 $457,990 $72,783,267<br />
A $14,883 $21,782 $44,435 $45,768 $47,142 $1,008,928<br />
TOTAL $14,883 $331,065 $381,503 $442,775 $505,132 $73,792,195<br />
S = Department plans on submitting a supplemental request; A = Department plans to absorb operating costs<br />
304<br />
Return to CIP TOC
20<strong>12</strong>-2021 CAPITAL IMPROVEMENT PLAN<br />
Summary<br />
SUMMARY BY TYPE OF PROJECT<br />
Glendale’s CIP contains a wide range <strong>of</strong> projects that make up a well-rounded, long-range<br />
program for municipal improvements.<br />
One <strong>of</strong> the most useful ways to view the CIP and understand its components is to group projects<br />
into similar types or categories. Since <strong>city</strong> revenue sources are <strong>of</strong>ten limited to specific<br />
categories (e.g., streets, water/sewer utility) and bonds are authorized by major categories (e.g.,<br />
public safety, parks), this approach is also helpful when evaluating bond issues. The graph<br />
below shows new FY 20<strong>12</strong> CIP project funding by major category type, excluding grant<br />
appropriation and carryover.<br />
FY 20<strong>12</strong> NEW CIP PROJECT FUNDING BY TYPE<br />
(excludes carryover and grant appropriation)<br />
The following section includes a summary <strong>of</strong> all capital projects by fund. A narrative description<br />
<strong>of</strong> the major CIP categories precedes the project detail sheets for each project. Each detail sheet<br />
contains a project identification number and name, a short project description, the anticipated<br />
funding source, projected costs for each <strong>of</strong> the first five years (including carryover funding from<br />
the previous years CIP, if applicable), a five-year aggregate estimate for the second five years<br />
and the operating impact, if any. The operating impact section remains expanded to show how<br />
much will be spent on personnel, supplies, utilities, insurance, etc. along with a description <strong>of</strong> the<br />
operating impact.<br />
New projects are identified with an asterisk --*-- in the project’s title for the detailed description<br />
<strong>of</strong> each project. Projects that do not have funding in the first year are assigned a “T” (temporary)<br />
number until design or construction begins.<br />
305<br />
Return to CIP TOC
FY 20<strong>12</strong> - 2021 Capital Improvement Plan<br />
Summary <strong>of</strong> ALL Capital Projects by Funding Type<br />
Fund # - Name<br />
Carryover<br />
FY 20<strong>12</strong> FY 2013 FY 2014 FY 2015 FY 2016 FYs 17-21<br />
BOND CONSTRUCTION FUNDS<br />
1980 - Street/Parking Bonds 3,089,699 0 0 0 0 0 19,968,255<br />
2140 - Open Space/Trails 0 0 0 0 0 0 41,783,157<br />
2060 - Parks 166,246 0 0 0 0 0 157,278,448<br />
2160 - Library 0 0 0 0 0 0 35,609,148<br />
2040 - Public Safety 2,251,879 163,241 237,397 82,835 2<strong>12</strong>,766 84,394 111,245,173<br />
2080 - Government Facilities 1,131,437 0 0 0 0 0 16,133,689<br />
2130 - Cultural Facility 104,876 0 0 0 0 0 19,071,972<br />
2100 - Economic Development 1,746,094 0 0 0 0 0 91,554,271<br />
2180 - Flood Control 10,188,515 160,925 160,925 160,925 160,925 160,925 40,233,735<br />
Sub-Total<br />
$18,678,746<br />
$324,166 $398,322 $243,760 $373,691 $245,319 $532,877,848<br />
DIF FUNDS<br />
1600 - Roadway Improvements 131,958 0 22,064 0 194,908 171,500 1,766,178<br />
1520 - Citywide Open Space 171,473 44,000 46,216 44,000 46,350 0 85,140<br />
1460 - Citywide Parks 0 0 2,216 0 2,350 0 5,140<br />
1480 - Citywide Rec Facility 0 0 2,216 0 2,350 0 5,140<br />
1540 - Park Dev Zone 1 39,632 0 2,216 0 2,350 0 5,140<br />
1560 - Park Dev Zone 2 <strong>12</strong>3,506 15,000 7,816 5,600 2,350 0 5,140<br />
1580 - Park Dev Zone 3 11,905 19,999 7,516 6,000 2,350 0 5,140<br />
1380 - Library Buildings 0 0 0 0 0 0 1,609,288<br />
1500 - Libraries 72,665 200,000 213,265 200,000 214,073 200,000 2,484,259<br />
1440 - Police Dept Facilities 0 0 10,919 0 11,584 0 25,329<br />
1420 - Fire Protection Facilities 0 0 11,480 0 <strong>12</strong>,179 0 26,627<br />
1620 - General Government 0 0 <strong>12</strong>,799 0 13,578 0 29,687<br />
Sub-Total<br />
$551,139<br />
$278,999 $338,723 $255,600 $504,422 $371,500 $6,052,208<br />
ENTERPRISE/OTHER FUNDS<br />
2360 - Water & Sewer 4,427,688 7,250,000 750,000 2,580,720 4,389,700 9,792,030 53,921,823<br />
2400 - Water 27,914,867 4,177,000 3,661,000 4,469,000 7,418,090 14,088,384 90,769,536<br />
2420 - Sewer 4,494,114 4,918,480 5,984,973 6,378,552 16,394,116 26,773,149 39,911,243<br />
2210 - Transportation Construction 31,183,100 8,321,290 8,608,921 8,581,328 8,438,738 4,580,989 22,985,155<br />
2000 - HURF/Street Bonds 197,379 0 0 0 0 0 <strong>12</strong>,076,659<br />
1340 - HURF/Streets Fund 0 0 0 0 0 0 1,677,285<br />
1650 - Transportation Grants 3,518,115 2,000,000 2,000,000 2,000,000 2,000,000 2,000,000 10,000,000<br />
2480 - Sanitation 0 1,863,645 1,299,787 3,140,259 2,738,000 3,778,990 <strong>12</strong>,723,434<br />
2440 - Landfill 492,901 1,237,740 2,018,202 15,350,131 5,953,730 9,379,879 7,983,017<br />
2<strong>12</strong>0 - Airport Capital Grants 1,755,000 15,693,481 150,000 525,000 3,146,000 8,550,000 0<br />
1840 - Other Federal & State Grants 811,252 2,000,000 2,000,000 2,000,000 2,000,000 2,000,000 10,000,000<br />
1000 - General Fund 529,498 752,859 752,859 50,000 50,000 50,000 4,281,360<br />
1740 - Civic Center 0 350,000 50,000 50,000 50,000 50,000 4,145,734<br />
2150 - Technology Infrastructure 0 0 1,097,200 0 0 0 28,491,879<br />
<strong>12</strong>20 - Arts Commission 0 500,000 500,000 500,000 500,000 500,000 1,750,000<br />
Sub-Total<br />
$75,323,914<br />
$49,064,495 $28,872,942 $45,624,990 $53,078,374 $81,543,421 $300,717,<strong>12</strong>5<br />
Grand Total $94,553,799<br />
Total FY 20<strong>12</strong> Funding<br />
$49,667,660 $29,609,987 $46,<strong>12</strong>4,350 $53,956,487 $82,160,240 $839,647,181<br />
$144,221,459<br />
306<br />
Return to CIP TOC
20<strong>12</strong>-2021 CAPITAL IMPROVEMENT PLAN<br />
Bond Construction Funds<br />
BOND CONSTRUCTION FUNDS<br />
Bond construction funds are used to account for financial resources to be used for the acquisition<br />
or construction <strong>of</strong> capital projects in the <strong>city</strong>’s council-approved CIP using general obligation<br />
bonds and HURF revenue bonds. Beginning balances are based on prior bond issuance proceeds<br />
that have been received but not yet expended. Additional bond sales during the specified years,<br />
estimated investment and interest income, and expected grant/IGA revenues increase the<br />
beginning balances. Project expenses including carryover and operating expenses (e.g. advisor<br />
fees) reduce the beginning balances.<br />
Renovations at Bicentennial Park at 71 st and Missouri Avenues<br />
Fund # - Name Carryover FY 20<strong>12</strong> FY 2013 FY 2014 FY 2015 FY 2016 FYs 17-21<br />
1980-Street/Parking Bonds 3,089,699 0 0 0 0 0 19,968,255<br />
2140-Open Space/Trails 0 0 0 0 0 0 41,783,157<br />
2060-Park 166,246 0 0 0 0 0 157,278,448<br />
2160-Library 0 0 0 0 0 0 35,609,148<br />
2040-Public Safety 2,251,879 163,241 237,397 82,835 2<strong>12</strong>,766 84,394 111,245,173<br />
2080-Government Facilities 1,131,437 0 0 0 0 0 16,133,689<br />
2130-Cultural Facility 104,876 0 0 0 0 0 19,071,972<br />
2100-Economic Development 1,746,094 0 0 0 0 0 91,554,271<br />
2180-Flood Control 10,188,515 160,925 160,925 160,925 160,925 160,925 40,233,735<br />
Total Bond Funds $18,678,746 $324,166 $398,322 $243,760 $373,691 $245,319 $532,877,848<br />
307<br />
Return to CIP TOC
20<strong>12</strong>-2021 CAPITAL IMPROVEMENT PLAN<br />
Street/Parking - Construction Funds<br />
STREET/PARKING<br />
CONSTRUCTION FUNDS<br />
This category includes projects that are funded with General Obligation street/parking<br />
construction bonds.<br />
In FY 20<strong>12</strong>, carryover funding is available for street scallop, street beautification and petition<br />
lighting projects where needed. Funds are also available for additional tenant improvements to<br />
the Promenade on Palmaire Avenue within the Glendale downtown parking garage structure.<br />
There is no new funding included in the first five years <strong>of</strong> the capital improvement plan for the<br />
Street and Parking Construction Fund due to the continued drop in secondary assessed valuation.<br />
Project Name: 67 th Ave/Cactus to ACDC<br />
Funding Source: G.O. Bond<br />
Fund #: 1980<br />
Project #: 68118<br />
308<br />
Return to CIP TOC
FY 20<strong>12</strong> - 2021 Capital Improvement Plan<br />
Fund and Project Summary<br />
1980 - Street/Parking Bonds Category: 20%<br />
FY 20<strong>12</strong>: FY 2013: FY 2014: FY 2015: FY 2016: FYs 17-21:<br />
Estimated Beginning Balance: $4,287,748 $1,194,418 $1,195,320 $1,196,222 $1,197,<strong>12</strong>3 $1,198,025<br />
Revenue<br />
Bond Proceeds 0 0 0 0 0 18,775,000<br />
Investment Income 2,435 1,061 1,061 1,061 1,061 2,653<br />
Total Revenue:<br />
Operating Expenses<br />
2,435 1,061 1,061 1,061 1,061 18,777,653<br />
Advisor Fees 6,066 159 159 159 159 398<br />
Total Operating Expenses:<br />
6,066 159 159 159 159 398<br />
Project Expenses Carryover New Funding<br />
Existing Assets<br />
Improvement <strong>of</strong> Existing Assets<br />
68103 Street Scallop<br />
1,200,597 0 0 0 0 0 9,711,345<br />
68104 Street Beautification<br />
718,310 0 0 0 0 0 6,444,410<br />
68117 67th Ave. Camelback to Grand 83,419 0 0 0 0 0 0<br />
68<strong>12</strong>0 Promenade Parking/Tenant Imps 800,059 0 0 0 0 0 0<br />
Sub-Total - Existing Assets 2,802,385<br />
0 0 0 0 0 16,155,755<br />
New Assets<br />
68102 Petition Lighting Program<br />
287,314 0 0 0 0 0 800,000<br />
T<strong>12</strong>32 95th Ave Camelback to Missouri<br />
0 0 0 0 0 0 3,0<strong>12</strong>,500<br />
Sub-Total - New Assets 287,314<br />
0 0 0 0 0 3,8<strong>12</strong>,500<br />
Total Project Expenses:<br />
3,089,699 0 0 0 0 0 19,968,255<br />
Total FY 20<strong>12</strong> Funding:<br />
3,089,699<br />
Estimated Ending Balance: $1,194,418 $1,195,320 $1,196,222 $1,197,<strong>12</strong>3 $1,198,025 $7,024<br />
*New Project<br />
309<br />
Return to CIP TOC
FY 20<strong>12</strong>-2021 Capital Improvement Plan<br />
Capital Project Expenses Detail<br />
1980 - Street/Parking Bonds Category: 20%<br />
Project: 68103 - Street Scallop (I) Funding Source:<br />
General Obligation Bonds<br />
Project Description:<br />
The Scallop Street Program is used to complete street improvements to reduce traffic accidents, enhance traffic<br />
flow, provide safety to adjacent pedestrian traffic and to mitigate property flooding. Projects are selected based<br />
on need and available funding from a scallop street inventory maintained by the Engineering Department.<br />
Capital Costs: FY 20<strong>12</strong> FY 2013 FY 2014 FY 2015 FY 2016 FYs 17-21<br />
Construction $0 $0 $0 $0 $0 $8,567,000<br />
Finance Charges $0 $0 $0 $0 $0 $219,316<br />
Engineering Charges $0 $0 $0 $0 $0 $<strong>12</strong>0,000<br />
Arts $0 $0 $0 $0 $0 $85,670<br />
Contingency $0 $0 $0 $0 $0 $719,359<br />
Sub-Total New Funding $0<br />
$0 $0 $0 $0 $9,711,345<br />
FY 20<strong>12</strong> Carryover<br />
$1,200,597 $0 $0 $0 $0 $0<br />
TOTAL $1,200,597 $0 $0 $0 $0 $9,711,345<br />
Operating Description:<br />
O and M costs are not expected for this project.<br />
Project: 68104 - Street Beautification (I) Funding Source:<br />
General Obligation Bonds<br />
Project Description:<br />
The Street Beautification Program is used to complete landscaping improvements that were not required <strong>of</strong> the<br />
developer at the time <strong>of</strong> development. The objective <strong>of</strong> the program is to create an aesthetically pleasing<br />
landscape continuity, <strong>city</strong>wide, along the arterial street system. Improvements include construction <strong>of</strong> sidewalks,<br />
multiuse paths, improvements to handicap accessibility, benches, planting <strong>of</strong> trees, shrubs and ground cover.<br />
Capital Costs: FY 20<strong>12</strong> FY 2013 FY 2014 FY 2015 FY 2016 FYs 17-21<br />
Construction $0 $0 $0 $0 $0 $6,107,000<br />
Finance Charges $0 $0 $0 $0 $0 $156,340<br />
Engineering Charges $0 $0 $0 $0 $0 $<strong>12</strong>0,000<br />
Arts $0 $0 $0 $0 $0 $61,070<br />
Sub-Total New Funding $0<br />
$0 $0 $0 $0 $6,444,410<br />
FY 20<strong>12</strong> Carryover<br />
$718,310 $0 $0 $0 $0 $0<br />
TOTAL $718,310 $0 $0 $0 $0 $6,444,410<br />
Operating Description:<br />
Additional O and M will be needed starting in FY 2019. O and M based on the standard formula for water and<br />
maintenance for 307,500 sq ft <strong>of</strong> landscaped area. A supplemental <strong>budget</strong> request will be submitted once the<br />
project is near completion.<br />
Operating Costs: FY 20<strong>12</strong> FY 2013 FY 2014 FY 2015 FY 2016 FYs 17-21<br />
Landscape $0 $0 $0 $0 $0 $257,166<br />
TOTAL $0 $0 $0 $0 $0 $257,166<br />
* New Project<br />
N=New Asset, R=Replacement <strong>of</strong> Existing Asset, I=Improvement <strong>of</strong> Existing Asset<br />
310<br />
Return to CIP TOC
FY 20<strong>12</strong>-2021 Capital Improvement Plan<br />
Capital Project Expenses Detail<br />
1980 - Street/Parking Bonds Category: 20%<br />
Project: 68117 - 67th Ave. Camelback to Grand (I) Funding Source:<br />
General Obligation Bonds<br />
Project Description:<br />
Construct street improvements on 67th Avenue from Camelback to Grand Avenue. Project includes underground<br />
conversion <strong>of</strong> utilities, curb, gutter, sidewalk and landscaping.<br />
Capital Costs: FY 20<strong>12</strong> FY 2013 FY 2014 FY 2015 FY 2016 FYs 17-21<br />
FY 20<strong>12</strong> Carryover<br />
$83,419 $0 $0 $0 $0 $0<br />
TOTAL $83,419 $0 $0 $0 $0 $0<br />
Operating Description:<br />
No additional O and M is needed.<br />
Project: 68<strong>12</strong>0 - Promenade Parking/Tenant Imps (I) Funding Source:<br />
General Obligation Bonds<br />
Project Description:<br />
The project will provide basic and specialized tenant improvements <strong>of</strong> approximately 10,000 sq ft at the<br />
Promenade on Palmaire Avenue within the Glendale downtown parking garage structure.<br />
Capital Costs: FY 20<strong>12</strong> FY 2013 FY 2014 FY 2015 FY 2016 FYs 17-21<br />
FY 20<strong>12</strong> Carryover<br />
$800,059 $0 $0 $0 $0 $0<br />
TOTAL $800,059 $0 $0 $0 $0 $0<br />
Operating Description:<br />
No additional O and M is needed.<br />
Project: 68102 - Petition Lighting Program (N) Funding Source:<br />
General Obligation Bonds<br />
Project Description:<br />
This project installs additional street lighting in areas that have been determined to be inadequate. Infill street<br />
lighting requests are initiated by residents and requires approval <strong>of</strong> affected residents. This is an <strong>annual</strong> ongoing<br />
project.<br />
Capital Costs: FY 20<strong>12</strong> FY 2013 FY 2014 FY 2015 FY 2016 FYs 17-21<br />
Construction $0 $0 $0 $0 $0 $700,000<br />
Engineering Charges $0 $0 $0 $0 $0 $39,600<br />
Arts $0 $0 $0 $0 $0 $7,000<br />
Contingency $0 $0 $0 $0 $0 $53,400<br />
Sub-Total New Funding $0<br />
$0 $0 $0 $0 $800,000<br />
FY 20<strong>12</strong> Carryover<br />
$287,314 $0 $0 $0 $0 $0<br />
TOTAL $287,314 $0 $0 $0 $0 $800,000<br />
Operating Description:<br />
O and M identified provides for 40 requested street lights per year. Supplies cover photo control cost, electri<strong>city</strong><br />
for a 150-watt light is $90 per year, estimated maintenance for a light is $21 per year, including Remote<br />
Operations Asset Management monitoring. A supplemental <strong>budget</strong> request will be made as new streetlights are<br />
added to the system.<br />
Operating Costs: FY 20<strong>12</strong> FY 2013 FY 2014 FY 2015 FY 2016 FYs 17-21<br />
Supplies/Contr $3,200 $3,296 $3,395 $3,497 $3,602 $19,695<br />
Utilities $3,600 $3,708 $3,819 $3,934 $4,052 $22,157<br />
Equip. Maint. $520 $536 $552 $568 $585 $3,200<br />
TOTAL $7,320 $7,540 $7,766 $7,999 $8,239 $45,052<br />
* New Project<br />
N=New Asset, R=Replacement <strong>of</strong> Existing Asset, I=Improvement <strong>of</strong> Existing Asset<br />
311<br />
Return to CIP TOC
FY 20<strong>12</strong>-2021 Capital Improvement Plan<br />
Capital Project Expenses Detail<br />
1980 - Street/Parking Bonds Category: 20%<br />
Project: T<strong>12</strong>32 - 95th Ave Camelback to Missouri (N) Funding Source:<br />
General Obligation Bonds<br />
Project Description:<br />
This project is to acquire right-<strong>of</strong>-way, move utilities, design and construct roadway, with curb, gutter, sidewalk,<br />
landscaping, street lighting and underground overhead utilities between Camelback Road North to Missouri<br />
Avenue Project previously referred to as 95th Avenue Camelback to Bethany Home Rd.<br />
Capital Costs: FY 20<strong>12</strong> FY 2013 FY 2014 FY 2015 FY 2016 FYs 17-21<br />
Land $0 $0 $0 $0 $0 $700,000<br />
Design $0 $0 $0 $0 $0 $600,000<br />
Construction $0 $0 $0 $0 $0 $1,500,000<br />
Finance Charges $0 $0 $0 $0 $0 $22,500<br />
Engineering Charges $0 $0 $0 $0 $0 $55,000<br />
Arts $0 $0 $0 $0 $0 $15,000<br />
Contingency $0 $0 $0 $0 $0 $<strong>12</strong>0,000<br />
TOTAL $0 $0 $0 $0 $0 $3,0<strong>12</strong>,500<br />
Operating Description:<br />
Landscape O and M based on 13,200 square feet <strong>of</strong> landscaping for a 1/4 mile <strong>of</strong> street improvements for five<br />
years. A supplemental <strong>budget</strong> request will be submitted once the project is near completion.<br />
Operating Costs: FY 20<strong>12</strong> FY 2013 FY 2014 FY 2015 FY 2016 FYs 17-21<br />
Landscape $0 $0 $0 $0 $0 $14,520<br />
TOTAL $0 $0 $0 $0 $0 $14,520<br />
* New Project<br />
N=New Asset, R=Replacement <strong>of</strong> Existing Asset, I=Improvement <strong>of</strong> Existing Asset<br />
3<strong>12</strong><br />
Return to CIP TOC
20<strong>12</strong>-2021 CAPITAL IMPROVEMENT PLAN<br />
Open Space & Trails - Construction Fund<br />
OPEN SPACE & TRAILS<br />
CONSTRUCTION FUND<br />
This category enables the <strong>city</strong> to acquire land for the preservation <strong>of</strong> open space and to construct<br />
multiuse trails and linear parks. There is no new funding included in the first five years <strong>of</strong> the<br />
capital improvement plan for the Open Space & Trails Construction Fund due to the continued<br />
drop in secondary assessed valuation.<br />
Project Name: Thunderbird Paseo Park Development<br />
Funding Source: G.O. Bond<br />
Fund #: 2140<br />
Project #: 70000<br />
313<br />
Return to CIP TOC
FY 20<strong>12</strong> - 2021 Capital Improvement Plan<br />
Fund and Project Summary<br />
2140 - Open Space/Trails Construction Category: 20%<br />
FY 20<strong>12</strong>: FY 2013: FY 2014: FY 2015: FY 2016: FYs 17-21:<br />
Estimated Beginning Balance: $555,688 $555,688 $555,688 $555,688 $555,688 $555,688<br />
Revenue<br />
Bond Proceeds 0 0 0 0 0 41,230,000<br />
Total Revenue:<br />
0 0 0 0 0 41,230,000<br />
Project Expenses Carryover New Funding<br />
Existing Assets<br />
Improvement <strong>of</strong> Existing Assets<br />
70000 Thunderbird Paseo Park Develop<br />
0 0 0 0 0 0 1,998,656<br />
T1630 Thunderbird Park Improvements<br />
0 0 0 0 0 0 5,113,101<br />
Sub-Total - Existing Assets 0<br />
0 0 0 0 0 7,111,757<br />
New Assets<br />
70003 City-Wide Trails System<br />
0 0 0 0 0 0 24,590,946<br />
70005 West Valley Multi-Modal Corrid<br />
0 0 0 0 0 0 2,390,698<br />
T1600 Multi-Use Bridge at 51st Ave.<br />
0 0 0 0 0 0 429,085<br />
T1610 WARP - Trail System<br />
0 0 0 0 0 0 6,893,271<br />
T1761 New River Bike Trail<br />
0 0 0 0 0 0 367,400<br />
Sub-Total - New Assets 0<br />
0 0 0 0 0 34,671,400<br />
Total Project Expenses:<br />
0 0 0 0 0 0 41,783,157<br />
Total FY 20<strong>12</strong> Funding:<br />
0<br />
Estimated Ending Balance: $555,688 $555,688 $555,688 $555,688 $555,688 $2,531<br />
*New Project<br />
314<br />
Return to CIP TOC
FY 20<strong>12</strong>-2021 Capital Improvement Plan<br />
Capital Project Expenses Detail<br />
2140 - Open Space/Trails Construction Category: 20%<br />
Project: 70000 - Thunderbird Paseo Park Develop (I) Funding Source:<br />
General Obligation Bonds<br />
Project Description:<br />
Park improvements and renovations to maintain this 55 acre linear park. This includes tree replacement and<br />
additions, improvements to landscaping, signage replacements, trail asphalt overlay, pedestrian/equestrian<br />
bridges and replacement <strong>of</strong> equipment located in the linear park.<br />
Capital Costs: FY 20<strong>12</strong> FY 2013 FY 2014 FY 2015 FY 2016 FYs 17-21<br />
Design $0 $0 $0 $0 $0 $423,475<br />
Construction $0 $0 $0 $0 $0 $1,209,928<br />
Finance Charges $0 $0 $0 $0 $0 $39,954<br />
Engineering Charges $0 $0 $0 $0 $0 $44,919<br />
Arts $0 $0 $0 $0 $0 $<strong>12</strong>,099<br />
Equipment $0 $0 $0 $0 $0 $90,217<br />
Contingency $0 $0 $0 $0 $0 $178,064<br />
TOTAL $0 $0 $0 $0 $0 $1,998,656<br />
Operating Description:<br />
O and M expenses would vary based upon the specific type <strong>of</strong> future landscape improvements that are<br />
implemented. Supplies and contracts calculated at $601 per acre X 50 acres plus inflation. A landscape water<br />
rate is calculated at $0.0495 per sq ft for 10 acres. All calculations are for 31 months <strong>of</strong> operation. A<br />
supplemental <strong>budget</strong> request will be submitted once the project is near completion.<br />
Operating Costs: FY 20<strong>12</strong> FY 2013 FY 2014 FY 2015 FY 2016 FYs 17-21<br />
Supplies/Contr $0 $0 $0 $0 $0 $95,558<br />
Insurance $0 $0 $0 $0 $0 $1,616<br />
Landscape $0 $0 $0 $0 $0 $68,566<br />
TOTAL $0 $0 $0 $0 $0 $165,740<br />
* New Project<br />
N=New Asset, R=Replacement <strong>of</strong> Existing Asset, I=Improvement <strong>of</strong> Existing Asset<br />
315<br />
Return to CIP TOC
FY 20<strong>12</strong>-2021 Capital Improvement Plan<br />
Capital Project Expenses Detail<br />
2140 - Open Space/Trails Construction Category: 20%<br />
Project: T1630 - Thunderbird Park Improvements (I) Funding Source:<br />
General Obligation Bonds<br />
Project Description:<br />
Based on the Thunderbird Conservation Park Master Plan recommendations, items to be addressed include the<br />
continued repair and maintenance <strong>of</strong> trails, removal <strong>of</strong> invasive plant species and re-vegetation <strong>of</strong> the park with<br />
native plants, repair and upgrading <strong>of</strong> existing park elements (ramadas, restrooms) and the removal <strong>of</strong> various<br />
park elements (ramadas and restrooms) from the wash located at 59th Avenue. The removal <strong>of</strong> ramadas in the<br />
59th Avenue wash area will allow for restoration <strong>of</strong> the wildlife corridor and vegetation. The installation <strong>of</strong> new<br />
park elements such as ramadas, restrooms and a Ranger/Visitor building are also within the scope <strong>of</strong> this project.<br />
Capital Costs: FY 20<strong>12</strong> FY 2013 FY 2014 FY 2015 FY 2016 FYs 17-21<br />
Design $0 $0 $0 $0 $0 $1,141,304<br />
Construction $0 $0 $0 $0 $0 $3,260,869<br />
Finance Charges $0 $0 $0 $0 $0 $100,062<br />
Engineering Charges $0 $0 $0 $0 $0 $81,440<br />
Arts $0 $0 $0 $0 $0 $32,609<br />
Equipment $0 $0 $0 $0 $0 $29,501<br />
Contingency $0 $0 $0 $0 $0 $467,316<br />
TOTAL $0 $0 $0 $0 $0 $5,113,101<br />
Operating Description:<br />
Staffing is a Service Worker II at $51,732 with benefits and inflation, a Park Ranger at $49,601 with benefits and<br />
inflation; Supplies/Contracts is ramada cleaning contract at $3,000 per ramada (23) per year. Utilities at $2.06 sq<br />
ft X 3,000 sq ft plus inflation. Building Maintenance at $1.62 X 3,000 sq ft and 10 light poles at $150 each plus<br />
$21 bulb replacement <strong>annual</strong>ly; insurance for new staff at $824 per yr; vehicle maintenance/replacement for<br />
compact pickup, computer and printer; landscape maintenance at $601 per acre X 5 acres; building water<br />
$0.195 per sq ft (3,000); refuse at $341.26 per month plus inflation. Operations are calculated for 36 months. A<br />
supplemental <strong>budget</strong> request will be submitted once the project is near completion.<br />
Operating Costs: FY 20<strong>12</strong> FY 2013 FY 2014 FY 2015 FY 2016 FYs 17-21<br />
Staffing $0 $0 $0 $0 $0 $374,207<br />
Supplies/Contr $0 $0 $0 $0 $0 $339,742<br />
Utilities $0 $0 $0 $0 $0 $22,822<br />
Bldg. Maint. $0 $0 $0 $0 $0 $24,225<br />
Insurance $0 $0 $0 $0 $0 $6,086<br />
PC/Vehicle Replacement $0 $0 $0 $0 $0 $19,059<br />
Landscape $0 $0 $0 $0 $0 $11,097<br />
Water $0 $0 $0 $0 $0 $2,161<br />
Refuse $0 $0 $0 $0 $0 $15,<strong>12</strong>2<br />
TOTAL $0 $0 $0 $0 $0 $814,521<br />
* New Project<br />
N=New Asset, R=Replacement <strong>of</strong> Existing Asset, I=Improvement <strong>of</strong> Existing Asset<br />
316<br />
Return to CIP TOC
FY 20<strong>12</strong>-2021 Capital Improvement Plan<br />
Capital Project Expenses Detail<br />
2140 - Open Space/Trails Construction Category: 20%<br />
Project: 70003 - City-Wide Trails System (N) Funding Source:<br />
General Obligation Bonds<br />
Project Description:<br />
This fund will implement recommendations for open space acquisition, trailhead land purchases, construction <strong>of</strong><br />
pedestrian, bicycle and equestrian paths and trails and connectivity between areas <strong>of</strong> interest <strong>city</strong>wide that<br />
accommodates future growth and user demands.<br />
Capital Costs: FY 20<strong>12</strong> FY 2013 FY 2014 FY 2015 FY 2016 FYs 17-21<br />
Design $0 $0 $0 $0 $0 $5,696,250<br />
Construction $0 $0 $0 $0 $0 $16,275,000<br />
Finance Charges $0 $0 $0 $0 $0 $482,175<br />
Engineering Charges $0 $0 $0 $0 $0 $<strong>12</strong>2,000<br />
Arts $0 $0 $0 $0 $0 $162,750<br />
Equipment $0 $0 $0 $0 $0 $19,505<br />
Contingency $0 $0 $0 $0 $0 $1,833,266<br />
TOTAL $0 $0 $0 $0 $0 $24,590,946<br />
Operating Description:<br />
Specific scope will determine the additional O and M costs which could include utilities for additional lighting (260<br />
poles X $150 per pole) and signage maintenance, contracts for cleaning trails and rest nodes, landscape<br />
maintenance, water costs, and building maintenance for repairs and maintenance <strong>of</strong> drinking fountains and<br />
walkway light bulb replacement at $21 each per year. Staffing is a Service Worker II position at $14.08 per hour<br />
plus benefits. Other operating calculations have been based on 50 acres. Supplies/contracts at $601 per acre<br />
plus inflation, landscape maintenance at $0.22 per sq ft, landscape water at $0.0495 sq ft. plus inflation, vehicle<br />
replacement is for a compact pickup with maintenance. All calculations are for 26 months <strong>of</strong> operation. A<br />
supplemental <strong>budget</strong> request will be submitted once the project is near completion.<br />
Operating Costs: FY 20<strong>12</strong> FY 2013 FY 2014 FY 2015 FY 2016 FYs 17-21<br />
Staffing $0 $0 $0 $0 $0 $1<strong>12</strong>,619<br />
Supplies/Contr $0 $0 $0 $0 $0 $80,145<br />
Utilities $0 $0 $0 $0 $0 $104,015<br />
Bldg. Maint. $0 $0 $0 $0 $0 $14,562<br />
Equip. Maint. $0 $0 $0 $0 $0 $9,641<br />
PC/Vehicle Replacement $0 $0 $0 $0 $0 $5,294<br />
Landscape $0 $0 $0 $0 $0 $553,777<br />
Water $0 $0 $0 $0 $0 $287,538<br />
TOTAL $0 $0 $0 $0 $0 $1,167,591<br />
* New Project<br />
N=New Asset, R=Replacement <strong>of</strong> Existing Asset, I=Improvement <strong>of</strong> Existing Asset<br />
317<br />
Return to CIP TOC
FY 20<strong>12</strong>-2021 Capital Improvement Plan<br />
Capital Project Expenses Detail<br />
2140 - Open Space/Trails Construction Category: 20%<br />
Project: 70005 - West Valley Multi-Modal Corrid (N) Funding Source:<br />
General Obligation Bonds<br />
Project Description:<br />
Multimodal trail system along New River and Agua Fria River Corridor as per the Maricopa Association <strong>of</strong><br />
Governments West Valley Rivers Trails Plan. The trail system will link with other trails in and around the City <strong>of</strong><br />
Glendale connecting parks and other recreation facilities, and serve new and existing residents.<br />
Capital Costs: FY 20<strong>12</strong> FY 2013 FY 2014 FY 2015 FY 2016 FYs 17-21<br />
Design $0 $0 $0 $0 $0 $540,555<br />
Construction $0 $0 $0 $0 $0 $1,544,414<br />
Finance Charges $0 $0 $0 $0 $0 $58,196<br />
Engineering Charges $0 $0 $0 $0 $0 $55,000<br />
Arts $0 $0 $0 $0 $0 $15,444<br />
Contingency $0 $0 $0 $0 $0 $177,089<br />
TOTAL $0 $0 $0 $0 $0 $2,390,698<br />
Operating Description:<br />
Supplies and contracts include $601x 10 acres. Building maintenance costs include 34 low-level security lights<br />
for rest nodes and trail at $75 per light and $13 per lamp for bulb replacement. Landscape includes maintenance<br />
<strong>of</strong> approximately 435,600 sq ft x $.0927per sq ft, water at $.0495 per sq ft x 435,600 sq ft, and ramada<br />
cleaning/maintenance at $4,000 per ramada x three ramadas.<br />
Operating Costs: FY 20<strong>12</strong> FY 2013 FY 2014 FY 2015 FY 2016 FYs 17-21<br />
Supplies/Contr $0 $0 $0 $0 $0 $110,847<br />
Bldg. Maint. $0 $0 $0 $0 $0 $18,415<br />
Landscape $0 $0 $0 $0 $0 $461,667<br />
TOTAL $0 $0 $0 $0 $0 $590,929<br />
Project: T1600 - Multi-Use Bridge at 51st Ave. (N) Funding Source:<br />
General Obligation Bonds<br />
Project Description:<br />
Pedestrian, bicycle and equestrian bridge to cross Arizona Canal on the south-west side <strong>of</strong> Thunderbird Paseo<br />
Linear Park and 51st Avenue to the south side <strong>of</strong> Cactus Road that will link neighborhoods to the Thunderbird<br />
Paseo Linear Park and Regional Sun Circle Trail. This bridge would be 1/4 mile west <strong>of</strong> the Sunnyside Bridge<br />
and separated by 51st Avenue.<br />
Capital Costs: FY 20<strong>12</strong> FY 2013 FY 2014 FY 2015 FY 2016 FYs 17-21<br />
Design $0 $0 $0 $0 $0 $73,551<br />
Construction $0 $0 $0 $0 $0 $294,206<br />
Finance Charges $0 $0 $0 $0 $0 $8,413<br />
Engineering Charges $0 $0 $0 $0 $0 $18,020<br />
Arts $0 $0 $0 $0 $0 $2,942<br />
Contingency $0 $0 $0 $0 $0 $31,953<br />
TOTAL $0 $0 $0 $0 $0 $429,085<br />
Operating Description:<br />
Supplies/Contract to clean, inspect and make any repairs to the bridge that are needed on an <strong>annual</strong> basis<br />
computed at $55.50 a linear foot times 70 feet. Building Maintenance for safety inspections is $2.00 sq ft X<br />
bridge surface (840 sq ft). Calculations are based on 36 months <strong>of</strong> operation. A supplemental <strong>budget</strong> request will<br />
be submitted once the project is near completion.<br />
Operating Costs: FY 20<strong>12</strong> FY 2013 FY 2014 FY 2015 FY 2016 FYs 17-21<br />
Supplies/Contr $0 $0 $0 $0 $0 $14,347<br />
Bldg. Maint. $0 $0 $0 $0 $0 $6,204<br />
TOTAL $0 $0 $0 $0 $0 $20,551<br />
* New Project<br />
N=New Asset, R=Replacement <strong>of</strong> Existing Asset, I=Improvement <strong>of</strong> Existing Asset<br />
318<br />
Return to CIP TOC
FY 20<strong>12</strong>-2021 Capital Improvement Plan<br />
Capital Project Expenses Detail<br />
2140 - Open Space/Trails Construction Category: 20%<br />
Project: T1610 - WARP - Trail System (N) Funding Source:<br />
General Obligation Bonds<br />
Project Description:<br />
Develop and enhance approximately 2.5 miles <strong>of</strong> meandering trail system within the Western Area Regional<br />
Park. This project will connect the existing link under Bethany Home Road to the existing Grand Canal Linear<br />
Park Trail. Develop an Americans with Disabilities Act (ADA) accessible concrete trail, ramadas, landscape,<br />
irrigation, drinking fountain, picnic tables, park benches, and small rest nodes that service future and existing<br />
park users as well as Grand Canal Linear Park and trail users.<br />
Capital Costs: FY 20<strong>12</strong> FY 2013 FY 2014 FY 2015 FY 2016 FYs 17-21<br />
Design $0 $0 $0 $0 $0 $1,467,688<br />
Construction $0 $0 $0 $0 $0 $4,193,396<br />
Finance Charges $0 $0 $0 $0 $0 $167,801<br />
Engineering Charges $0 $0 $0 $0 $0 $92,500<br />
Arts $0 $0 $0 $0 $0 $41,934<br />
Contingency $0 $0 $0 $0 $0 $510,613<br />
Miscellaneous/Other $0 $0 $0 $0 $0 $419,339<br />
TOTAL $0 $0 $0 $0 $0 $6,893,271<br />
Operating Description:<br />
Refer to Parks Project No. 2060-70532 for O and M impact.<br />
Project: T1761 - New River Bike Trail (N) Funding Source:<br />
General Obligation Bonds<br />
Project Description:<br />
Construct a 1,500-foot long multiuse path from an existing pathway just north <strong>of</strong> the Paraiso Drive alignment to<br />
Hillcrest Boulevard, including a bridge over the drainage channel just north <strong>of</strong> the Paraiso Drive alignment. The<br />
project will complete a safe and convenient, <strong>of</strong>f-street connection from Pinnacle Peak Road to existing Hillcrest<br />
Road and 75th Avenue bike routes.<br />
Capital Costs: FY 20<strong>12</strong> FY 2013 FY 2014 FY 2015 FY 2016 FYs 17-21<br />
Land $0 $0 $0 $0 $0 $40,000<br />
Design $0 $0 $0 $0 $0 $25,000<br />
Construction $0 $0 $0 $0 $0 $250,024<br />
Finance Charges $0 $0 $0 $0 $0 $9,185<br />
Engineering Charges $0 $0 $0 $0 $0 $13,476<br />
Arts $0 $0 $0 $0 $0 $2,500<br />
Contingency $0 $0 $0 $0 $0 $27,215<br />
TOTAL $0 $0 $0 $0 $0 $367,400<br />
Operating Description:<br />
O and M associated with 7-foot wide landscaped area along a 1,500-foot long multi-use pathway. A<br />
supplemental <strong>budget</strong> request will be submitted once the project is near completion.<br />
Operating Costs: FY 20<strong>12</strong> FY 2013 FY 2014 FY 2015 FY 2016 FYs 17-21<br />
Utilities $0 $0 $0 $0 $0 $6,330<br />
Landscape $0 $0 $0 $0 $0 $7,140<br />
TOTAL $0 $0 $0 $0 $0 $13,470<br />
* New Project<br />
N=New Asset, R=Replacement <strong>of</strong> Existing Asset, I=Improvement <strong>of</strong> Existing Asset<br />
319<br />
Return to CIP TOC
20<strong>12</strong>-2021 CAPITAL IMPROVEMENT PLAN<br />
Parks - Construction Fund<br />
PARKS<br />
CONSTRUCTION FUND<br />
Park projects are traditionally funded by a combination <strong>of</strong> park G.O. bonds and development<br />
impact fees. Due to the continued drop in secondary assessed valuation, the Parks Construction<br />
Fund is not expected to receive new funding until after the first five years <strong>of</strong> the capital<br />
improvement plan. However, there is carryover funding available for the redevelopment,<br />
renovation and improvement <strong>of</strong> existing parks and related facilities. Examples <strong>of</strong> this work<br />
include renovation, replacement or expansion <strong>of</strong> ramada areas, shade structures, playground<br />
facilities, sports courts, ball fields, turf and landscaping, irrigation systems, security lighting and<br />
landscaping.<br />
Project Name: Parks Capital Equipment<br />
Funding Source: G.O. Bond<br />
Fund #: 2060<br />
Project #: 70541<br />
Project Name: Parks Redevelopment<br />
Funding Source: G.O. Bond<br />
Fund #: 2060<br />
Project #: 70500<br />
Picture Note: Butler Park<br />
320<br />
Return to CIP TOC
FY 20<strong>12</strong> - 2021 Capital Improvement Plan<br />
Fund and Project Summary<br />
2060 - Parks Construction Category: 20%<br />
FY 20<strong>12</strong>: FY 2013: FY 2014: FY 2015: FY 2016: FYs 17-21:<br />
Estimated Beginning Balance: $347,826 $176,498 $177,683 $178,961 $180,243 $181,620<br />
Revenue<br />
Bond Proceeds^ 0 0 0 0 0 157,095,000<br />
Interest Income 1,760 1,185 1,278 1,282 1,377 3,442<br />
Investment Income 15 0 0 0 0 0<br />
Total Revenue:<br />
Operating Expenses<br />
1,775 1,185 1,278 1,282 1,377 157,098,442<br />
Advisor Fees 6,857 0 0 0 0 0<br />
Total Operating Expenses:<br />
6,857 0 0 0 0 0<br />
Project Expenses Carryover New Funding<br />
Existing Assets<br />
Improvement <strong>of</strong> Existing Assets<br />
70502 Orangewood Community Park<br />
0 0 0 0 0 0 4,600,558<br />
70503 Rose Lane Rec. Center Developm<br />
0 0 0 0 0 0 16,351,531<br />
70506 63rd & Northern Park Dev.<br />
0 0 0 0 0 0 2,200,423<br />
70509 Manistee Ranch Development<br />
0 0 0 0 0 0 173,801<br />
70510 Park Enhancements<br />
<strong>12</strong>,134 0 0 0 0 0 8,483,766<br />
70514 O'Neil Center Expansion<br />
0 0 0 0 0 0 4,819,952<br />
70515 T-Bird Park Improvements<br />
0 0 0 0 0 0 2,888,882<br />
70523 79th/Orangewood<br />
0 0 0 0 0 0 991,746<br />
70532 Western Area Regional Park<br />
0 0 0 0 0 0 14,738,305<br />
70535 Paseo Racquet Center Park<br />
0 0 0 0 0 0 4,453,631<br />
70540 Grounds & Facilities Imprvmnts 9,665 0 0 0 0 0 200,000<br />
T1710 Adult Center Expansion<br />
0 0 0 0 0 0 9,361,181<br />
T1714 *O'Neil Park Splash Pad<br />
0 0 0 0 0 0 748,965<br />
Replacement <strong>of</strong> Existing Assets<br />
70500 Parks Redevelopment<br />
106,518 0 0 0 0 0 27,549,469<br />
705<strong>12</strong> Facilities Renovation<br />
4,942 0 0 0 0 0 9,530,345<br />
70526 Multiuse Sports Field Lighting<br />
0 0 0 0 0 0 3,282,998<br />
70541 Parks Capital Equipment<br />
22,810 0 0 0 0 0 500,000<br />
70542 Parks Master Plan Update<br />
10,177 0 0 0 0 0 0<br />
T17<strong>12</strong> Aquatic Facility Restoration<br />
0 0 0 0 0 0 7,269,958<br />
T1713 Foothills Center Restoration<br />
0 0 0 0 0 0 1,889,025<br />
Sub-Total - Existing Assets 166,246<br />
0 0 0 0 0 <strong>12</strong>0,034,536<br />
New Assets<br />
70527 West Area Pool<br />
0 0 0 0 0 0 10,487,209<br />
70528 Family Recreation Center-West<br />
0 0 0 0 0 0 25,284,065<br />
70531 Sahuaro Ranch Visitor Ctr.<br />
0 0 0 0 0 0 1,472,638<br />
Sub-Total - New Assets 0<br />
0 0 0 0 0 37,243,9<strong>12</strong><br />
Total Project Expenses:<br />
166,246 0 0 0 0 0 157,278,448<br />
Total FY 20<strong>12</strong> Funding:<br />
166,246<br />
Estimated Ending Balance: $176,498 $177,683 $178,961 $180,243 $181,620 $1,614<br />
*New Project<br />
^Will require additional voter authorization in last 5 years <strong>of</strong> the plan.<br />
321<br />
Return to CIP TOC
FY 20<strong>12</strong>-2021 Capital Improvement Plan<br />
Capital Project Expenses Detail<br />
2060 - Parks Construction Category: 20%<br />
Project: 70502 - Orangewood Community Park (I) Funding Source:<br />
General Obligation Bonds<br />
Project Description:<br />
Continued development <strong>of</strong> the 40+ acre Orangewood Community Park at 71st and Orangewood Avenues. This<br />
phase includes the construction <strong>of</strong> additional lighted multiuse fields, bleachers, a restroom, control building, final<br />
half-street improvements, and other park amenities that are typically associated with community parks. Once<br />
completed, the multiuse complex will also feature soccer/football fields, sports lights, playground, picnic facility,<br />
parking, and sport courts with lights.<br />
Capital Costs: FY 20<strong>12</strong> FY 2013 FY 2014 FY 2015 FY 2016 FYs 17-21<br />
Design $0 $0 $0 $0 $0 $510,390<br />
Construction $0 $0 $0 $0 $0 $3,400,608<br />
Finance Charges $0 $0 $0 $0 $0 $108,940<br />
IT/Phone/Security $0 $0 $0 $0 $0 $100,000<br />
Engineering Charges $0 $0 $0 $0 $0 $72,353<br />
Arts $0 $0 $0 $0 $0 $34,006<br />
Equipment $0 $0 $0 $0 $0 $34,001<br />
Contingency $0 $0 $0 $0 $0 $340,260<br />
TOTAL $0 $0 $0 $0 $0 $4,600,558<br />
Operating Description:<br />
Additional O and M would be needed starting in FY 2018. Staffing includes a Service Worker II at $51,732<br />
(includes benefits) and a Building Maintenance Worker at $58,782 (includes benefits). Supplies/Contracts<br />
include $601 per acre x 20 acres. Utilities includes $2.70 per sq ft x 2,000 sq ft for the control building electrical<br />
cost. Building maintenance costs include lights ($16,000 per field) and lamp replacement ($3,166 per field) for<br />
three soccer fields, 40 additional low level security lights will be maintained at $75 per fixture and $13 for lamp<br />
replacement per fixture, $4.60 per sq ft to maintain the plumbing in 800 sq ft restroom, HVAC and maintenance<br />
is $2.50 per sq ft x 1,200 sq ft control building, $2.07 per sq ft x 1,200 sq ft control building for custodial service,<br />
and $4.60 per sq ft for plumbing maintenance <strong>of</strong> the control building. Equipment maintenance includes<br />
maintenance costs ($0.22 per mile) and fuel ($0.17 per mile) for 1/2 ton pickup truck driven 8,000 miles per year.<br />
Insurance is $813 per new employee. Electrical includes security monitoring system at $600 per year. Vehicle<br />
replacement includes $2,050 per year for the 1/2 ton pickup and technology replacement includes $640 per year<br />
for a laptop and $1,053 per year for a printer. Landscape is calculated at 871,200 sq ft x .0927 and landscape<br />
water at 871,200 sq ft x .0495. Water is calculated at 2,000 sq ft x $.195. Refuse includes a 6-yard container x 3<br />
pick-ups per week.<br />
Operating Costs: FY 20<strong>12</strong> FY 2013 FY 2014 FY 2015 FY 2016 FYs 17-21<br />
Staffing $0 $0 $0 $0 $0 $552,069<br />
Supplies/Contr $0 $0 $0 $0 $0 $60,046<br />
Utilities $0 $0 $0 $0 $0 $26,976<br />
Bldg. Maint. $0 $0 $0 $0 $0 $459,693<br />
Equip. Maint. $0 $0 $0 $0 $0 $15,586<br />
Insurance $0 $0 $0 $0 $0 $8,<strong>12</strong>3<br />
Electrical $0 $0 $0 $0 $0 $2,997<br />
PC/Vehicle Replacement $0 $0 $0 $0 $0 $18,698<br />
Landscape $0 $0 $0 $0 $0 $618,862<br />
Water $0 $0 $0 $0 $0 $1,948<br />
Refuse $0 $0 $0 $0 $0 $20,451<br />
TOTAL $0 $0 $0 $0 $0 $1,785,449<br />
* New Project<br />
N=New Asset, R=Replacement <strong>of</strong> Existing Asset, I=Improvement <strong>of</strong> Existing Asset<br />
322<br />
Return to CIP TOC
FY 20<strong>12</strong>-2021 Capital Improvement Plan<br />
Capital Project Expenses Detail<br />
2060 - Parks Construction Category: 20%<br />
Project: 70503 - Rose Lane Rec. Center Developm (I) Funding Source:<br />
General Obligation Bonds<br />
Project Description:<br />
Renovation and expansion <strong>of</strong> the existing community center from 5,000 sq ft to 35,000 sq ft. Conversion <strong>of</strong><br />
existing recreation building into a multipurpose recreation center as recommended in the 2002 Parks and<br />
Recreation Master Plan. Renovations include parking, gymnasium, infrastructure, flooring, equipment, kitchen,<br />
activity rooms, meeting rooms, and furnishings.<br />
Capital Costs: FY 20<strong>12</strong> FY 2013 FY 2014 FY 2015 FY 2016 FYs 17-21<br />
Design $0 $0 $0 $0 $0 $3,221,750<br />
Construction $0 $0 $0 $0 $0 $9,208,000<br />
Finance Charges $0 $0 $0 $0 $0 $397,364<br />
IT/Phone/Security $0 $0 $0 $0 $0 $200,000<br />
Engineering Charges $0 $0 $0 $0 $0 $115,000<br />
Arts $0 $0 $0 $0 $0 $92,080<br />
Equipment $0 $0 $0 $0 $0 $930,800<br />
Contingency $0 $0 $0 $0 $0 $2,132,808<br />
Miscellaneous/Other $0 $0 $0 $0 $0 $53,729<br />
TOTAL $0 $0 $0 $0 $0 $16,351,531<br />
Operating Description:<br />
O and M includes staffing 2 Senior Recreation Coordinator - $76,246, 1 Clerical staff - $47,487, 3 Recreation<br />
Programmers - $53,868, a Service Worker II - $51,654, and a Service Worker III - $58,672 (all FTE positions<br />
include benefits), and 5 PT Rec. Leader II's at $45,905 each. Supplies and Contracts at 30,000 sq ft x $2.70.<br />
Utilities includes electri<strong>city</strong> at $2.70 per sq ft x 30,000 sq ft. Building maintenance includes HVAC at $2.50 per sq<br />
ft x 30,000 sq ft, custodial services at $1.62 per sq ft x 30,000 sq ft, and plumbing maintenance at $4.60 per sq ft<br />
x 30,000 sq ft. Insurance is $824 x the number <strong>of</strong> staff. Fire alarm is $600 per year. PC/Vehicle replacement<br />
includes $20,500 per vehicle (truck) for fuel costs, 8,000 miles x $0.17 for maintenance, 8,000 miles x $0.22 for<br />
fuel costs, PC replacement cost <strong>of</strong> eight computers x $664, and 8 printers x $1,053 per year. Building water is<br />
30,000 sq ft x $0.195 Refuse is based on a two 6-yard container x 3 pick-ups per week at $2,047 each.<br />
Operating Costs: FY 20<strong>12</strong> FY 2013 FY 2014 FY 2015 FY 2016 FYs 17-21<br />
Staffing $0 $0 $0 $0 $0 $883,587<br />
Supplies/Contr $0 $0 $0 $0 $0 $149,560<br />
Utilities $0 $0 $0 $0 $0 $149,560<br />
Bldg. Maint. $0 $0 $0 $0 $0 $483,024<br />
Insurance $0 $0 $0 $0 $0 $7,607<br />
Electrical $0 $0 $0 $0 $0 $1,108<br />
PC/Vehicle Replacement $0 $0 $0 $0 $0 $34,908<br />
Water $0 $0 $0 $0 $0 $10,801<br />
Refuse $0 $0 $0 $0 $0 $7,559<br />
TOTAL $0 $0 $0 $0 $0 $1,727,714<br />
* New Project<br />
N=New Asset, R=Replacement <strong>of</strong> Existing Asset, I=Improvement <strong>of</strong> Existing Asset<br />
323<br />
Return to CIP TOC
FY 20<strong>12</strong>-2021 Capital Improvement Plan<br />
Capital Project Expenses Detail<br />
2060 - Parks Construction Category: 20%<br />
Project: 70506 - 63rd & Northern Park Dev. (I) Funding Source:<br />
General Obligation Bonds<br />
Project Description:<br />
Proposed improvements include completing park construction to include a looped concrete pathway/trail, a<br />
restroom, native grass, landscaping and low flow crossing. Phase I <strong>of</strong> the community park included a<br />
playground, a ramada, open turf area, parking, a dog park, landscaping and meandering multiuse paths.<br />
Capital Costs: FY 20<strong>12</strong> FY 2013 FY 2014 FY 2015 FY 2016 FYs 17-21<br />
Design $0 $0 $0 $0 $0 $89,944<br />
Construction $0 $0 $0 $0 $0 $1,823,082<br />
Finance Charges $0 $0 $0 $0 $0 $53,564<br />
Engineering Charges $0 $0 $0 $0 $0 $52,608<br />
Arts $0 $0 $0 $0 $0 $18,231<br />
Contingency $0 $0 $0 $0 $0 $162,994<br />
TOTAL $0 $0 $0 $0 $0 $2,200,423<br />
Operating Description:<br />
Supplies and Contracts: $601 x 30 acres for supplies and contracts and $6,600 for restroom cleaning. Utilities:<br />
$2.25 x 800 sq ft for restroom electri<strong>city</strong>. Building Maintenance includes electrical for 40 additional low-level<br />
security lights at $75 per light and $13 for lamp replacement x 40 lamps and plumbing at $4.60 x 800 sq ft. Since<br />
most <strong>of</strong> the area will be designed with native grasses, the cost <strong>of</strong> maintaining the facility will be less than a<br />
typical community park. As a result, Landscape Maintenance and Landscape Water are calculated at half the<br />
normal rate. Landscape Maintenance is 1,306,800 sq ft x $0.04635 per sq ft, landscape water is 1,306,800 sq ft<br />
x $0.02475 per sq ft . Water would include 800 sq ft restroom x $0.195 per sq ft, and a drinking fountain at<br />
$60.39. Refuse includes one container for the entire site at $2,047 per year.<br />
Operating Costs: FY 20<strong>12</strong> FY 2013 FY 2014 FY 2015 FY 2016 FYs 17-21<br />
Supplies/Contr $0 $0 $0 $0 $0 $6,582<br />
Utilities $0 $0 $0 $0 $0 $8,<strong>12</strong>4<br />
Bldg. Maint. $0 $0 $0 $0 $0 $26,588<br />
Landscape $0 $0 $0 $0 $0 $343,113<br />
Water $0 $0 $0 $0 $0 $797<br />
Refuse $0 $0 $0 $0 $0 $7,559<br />
TOTAL $0 $0 $0 $0 $0 $392,763<br />
* New Project<br />
N=New Asset, R=Replacement <strong>of</strong> Existing Asset, I=Improvement <strong>of</strong> Existing Asset<br />
324<br />
Return to CIP TOC
FY 20<strong>12</strong>-2021 Capital Improvement Plan<br />
Capital Project Expenses Detail<br />
2060 - Parks Construction Category: 20%<br />
Project: 70509 - Manistee Ranch Development (I) Funding Source:<br />
General Obligation Bonds<br />
Project Description:<br />
Enhance various aspects <strong>of</strong> the historical area that would improve the aesthetics and functionality <strong>of</strong> Manistee<br />
Ranch Historical park site. This may include additional lighting, enhanced pathways, and/or landscape<br />
improvements.<br />
Capital Costs: FY 20<strong>12</strong> FY 2013 FY 2014 FY 2015 FY 2016 FYs 17-21<br />
Design $0 $0 $0 $0 $0 $18,840<br />
Construction $0 $0 $0 $0 $0 $<strong>12</strong>5,600<br />
Finance Charges $0 $0 $0 $0 $0 $4,231<br />
Engineering Charges $0 $0 $0 $0 $0 $11,000<br />
Arts $0 $0 $0 $0 $0 $1,256<br />
Contingency $0 $0 $0 $0 $0 $<strong>12</strong>,874<br />
TOTAL $0 $0 $0 $0 $0 $173,801<br />
Operating Description:<br />
Additional low level security includes 30 low level security lights x $75, and $13 per light for bulb replacement.<br />
Operating Costs: FY 20<strong>12</strong> FY 2013 FY 2014 FY 2015 FY 2016 FYs 17-21<br />
Bldg. Maint. $0 $0 $0 $0 $0 $16,249<br />
TOTAL $0 $0 $0 $0 $0 $16,249<br />
* New Project<br />
N=New Asset, R=Replacement <strong>of</strong> Existing Asset, I=Improvement <strong>of</strong> Existing Asset<br />
325<br />
Return to CIP TOC
FY 20<strong>12</strong>-2021 Capital Improvement Plan<br />
Capital Project Expenses Detail<br />
2060 - Parks Construction Category: 20%<br />
Project: 70510 - Park Enhancements (I) Funding Source:<br />
General Obligation Bonds<br />
Project Description:<br />
Ongoing park enhancements are vital in the <strong>city</strong>'s effort to improve and enhance park functionality and appeal.<br />
Staff continually assesses park amenities and infrastructure, and strive to meet the demands park users place on<br />
park land and facilities. Park enhancements focus on a variety <strong>of</strong> elements and amenities within the existing park<br />
setting, and can be urgent in nature or planned. Typical park enhancements include new sport courts, additional<br />
low-level security lighting, picnic areas, picnic benches, Americans with Disabilities Act (ADA) play surface for<br />
playgrounds, shade structures, landscape, and other amenities added to existing park sites. Ongoing<br />
enhancements typically address service gaps in the level <strong>of</strong> service requirements outlined in the Parks and<br />
Recreation Master Plan.<br />
Capital Costs: FY 20<strong>12</strong> FY 2013 FY 2014 FY 2015 FY 2016 FYs 17-21<br />
Design $0 $0 $0 $0 $0 $1,067,302<br />
Construction $0 $0 $0 $0 $0 $6,177,247<br />
Finance Charges $0 $0 $0 $0 $0 $206,517<br />
Engineering Charges $0 $0 $0 $0 $0 $92,500<br />
Arts $0 $0 $0 $0 $0 $61,773<br />
Equipment $0 $0 $0 $0 $0 $250,000<br />
Contingency $0 $0 $0 $0 $0 $628,427<br />
Sub-Total New Funding $0<br />
$0 $0 $0 $0 $8,483,766<br />
FY 20<strong>12</strong> Carryover<br />
$<strong>12</strong>,134 $0 $0 $0 $0 $0<br />
TOTAL $<strong>12</strong>,134 $0 $0 $0 $0 $8,483,766<br />
Operating Description:<br />
In most cases, park enhancements will have little or no impact on the O and M. In fact, in many cases the<br />
enhancements allow for a more efficient operation <strong>of</strong> infrastructure and amenities. O and M will be impacted<br />
when additional amenities are introduced to the park, such as ramadas, additional low level lighting, etc.<br />
Supplies/contracts include $601 x 4 acre. Building Maintenance includes an average <strong>of</strong> 10 additional low level<br />
security lighting x $75 for electri<strong>city</strong>, and $13 per lamp for replacement. Landscape maintenance $0.0927 per x<br />
43,560 sq ft, and landscape water at $0.0495 per sq ft x 43,560 sq ft. The additional O and M will be absorbed by<br />
the department.<br />
Operating Costs: FY 20<strong>12</strong> FY 2013 FY 2014 FY 2015 FY 2016 FYs 17-21<br />
Supplies/Contr $0 $0 $0 $0 $0 $14,796<br />
Bldg. Maint. $0 $0 $0 $0 $0 $5,416<br />
Landscape $0 $0 $0 $0 $0 $38,<strong>12</strong>2<br />
TOTAL $0 $0 $0 $0 $0 $58,334<br />
* New Project<br />
N=New Asset, R=Replacement <strong>of</strong> Existing Asset, I=Improvement <strong>of</strong> Existing Asset<br />
326<br />
Return to CIP TOC
FY 20<strong>12</strong>-2021 Capital Improvement Plan<br />
Capital Project Expenses Detail<br />
2060 - Parks Construction Category: 20%<br />
Project: 70514 - O'Neil Center Expansion (I) Funding Source:<br />
General Obligation Bonds<br />
Project Description:<br />
The O'Neil Recreation Center expansion includes an additional 10,000 sq ft to accommodate the growing<br />
participation and need for recreation programming, which is supported by attendance and participation levels.<br />
This improvement is identified in the 2002 Parks and Recreation Master Plan.<br />
Capital Costs: FY 20<strong>12</strong> FY 2013 FY 2014 FY 2015 FY 2016 FYs 17-21<br />
Design $0 $0 $0 $0 $0 $952,000<br />
Construction $0 $0 $0 $0 $0 $2,720,000<br />
Finance Charges $0 $0 $0 $0 $0 $117,131<br />
IT/Phone/Security $0 $0 $0 $0 $0 $35,000<br />
Engineering Charges $0 $0 $0 $0 $0 $67,932<br />
Arts $0 $0 $0 $0 $0 $27,200<br />
Equipment $0 $0 $0 $0 $0 $272,000<br />
Contingency $0 $0 $0 $0 $0 $628,689<br />
TOTAL $0 $0 $0 $0 $0 $4,819,952<br />
Operating Description:<br />
Staffing includes one Senior Recreation Coordinator $76,245 (benefits included) and five part-time Recreation<br />
Leaders at $45,000 <strong>annual</strong>ly. Utilities includes additional electrical for 10,000 sq ft x $2.70 per sq ft. Building<br />
Maintenance includes $2.70 per sq ft for operating and maintaining an additional 10,000 sq ft for HVAC,<br />
custodial service is $2.07 per sq ft x 10,000 sq ft, and plumbing maintenance is $4.60 per sq ft x $10,000 sq ft.<br />
Insurance is $824 x 1 additional staff. Electrical includes $2,400 <strong>annual</strong>ly for a fire alarm. PC/Vehicle<br />
Replacement includes three laptops x $640 and three color printers x $1053. Landscape maintenance and<br />
landscape water will not be impacted by the project expansion. Water include building water at $0.195 per sq ft x<br />
10,000 sq ft. Refuse includes 6-yard container x 3 pick-ups per week at $2,047<br />
Operating Costs: FY 20<strong>12</strong> FY 2013 FY 2014 FY 2015 FY 2016 FYs 17-21<br />
Staffing $0 $0 $0 $0 $0 $373,116<br />
Supplies/Contr $0 $0 $0 $0 $0 $84,627<br />
Utilities $0 $0 $0 $0 $0 $84,627<br />
Bldg. Maint. $0 $0 $0 $0 $0 $136,5<strong>12</strong><br />
Insurance $0 $0 $0 $0 $0 $2,536<br />
Electrical $0 $0 $0 $0 $0 $7,385<br />
PC/Vehicle Replacement $0 $0 $0 $0 $0 $6,398<br />
Water $0 $0 $0 $0 $0 $6,001<br />
Refuse $0 $0 $0 $0 $0 $6,299<br />
TOTAL $0 $0 $0 $0 $0 $707,501<br />
* New Project<br />
N=New Asset, R=Replacement <strong>of</strong> Existing Asset, I=Improvement <strong>of</strong> Existing Asset<br />
327<br />
Return to CIP TOC
FY 20<strong>12</strong>-2021 Capital Improvement Plan<br />
Capital Project Expenses Detail<br />
2060 - Parks Construction Category: 20%<br />
Project: 70515 - T-Bird Park Improvements (I) Funding Source:<br />
General Obligation Bonds<br />
Project Description:<br />
Continue to implement the Conservation Park Master Plan recommendations and improvements, removal <strong>of</strong><br />
invasive plant species and re-vegetation, signage upgrades, repairs or replacements to existing ramadas, picnic<br />
tables, grills, restrooms and other infrastructure. This funding also addresses the continuation <strong>of</strong> re-vegetation,<br />
as well as the installation <strong>of</strong> new park elements, such as trail head improvements, ramadas and parking lot<br />
improvements.<br />
Capital Costs: FY 20<strong>12</strong> FY 2013 FY 2014 FY 2015 FY 2016 FYs 17-21<br />
Design $0 $0 $0 $0 $0 $646,739<br />
Construction $0 $0 $0 $0 $0 $1,847,826<br />
Finance Charges $0 $0 $0 $0 $0 $56,644<br />
Engineering Charges $0 $0 $0 $0 $0 $55,000<br />
Arts $0 $0 $0 $0 $0 $18,478<br />
Contingency $0 $0 $0 $0 $0 $264,195<br />
TOTAL $0 $0 $0 $0 $0 $2,888,882<br />
Operating Description:<br />
Improvements have O and M impact for two new 750 square feet restrooms with associated utilities and supplies<br />
and a 1,500 sq ft Ranger/Information building. Improvements will require a Service Worker II at $52,940 with<br />
benefits, a Ranger with benefits at $50,736, contracted labor assistance at $25,000 per year, supplies are<br />
$20,000 a year; utilities at $2.06 per sq ft X 3,000 sq ft = $6,180; building maintenance at $1.62 X 3,000 sq ft =<br />
$4,860 <strong>annual</strong>ly; equipment maintenance is for two added pole lights at $300 <strong>annual</strong>ly; insurance is for 2 new<br />
employees at $824 per person; ramada cleaning at $3,000 each at five new ramadas, building water at $0.195<br />
sq ft or $49 per month; equipment replacement is a computer, printer purchase and their replacement cost.<br />
Calculations are based on a 34 month operating period.<br />
Operating Costs: FY 20<strong>12</strong> FY 2013 FY 2014 FY 2015 FY 2016 FYs 17-21<br />
Staffing $0 $0 $0 $0 $0 $375,519<br />
Supplies/Contr $0 $0 $0 $0 $0 $115,479<br />
Utilities $0 $0 $0 $0 $0 $20,390<br />
Bldg. Maint. $0 $0 $0 $0 $0 $16,035<br />
Equip. Maint. $0 $0 $0 $0 $0 $989<br />
Insurance $0 $0 $0 $0 $0 $5,437<br />
PC/Vehicle Replacement $0 $0 $0 $0 $0 $5,943<br />
Landscape $0 $0 $0 $0 $0 $21,431<br />
Water $0 $0 $0 $0 $0 $1,930<br />
TOTAL $0 $0 $0 $0 $0 $563,153<br />
* New Project<br />
N=New Asset, R=Replacement <strong>of</strong> Existing Asset, I=Improvement <strong>of</strong> Existing Asset<br />
328<br />
Return to CIP TOC
FY 20<strong>12</strong>-2021 Capital Improvement Plan<br />
Capital Project Expenses Detail<br />
2060 - Parks Construction Category: 20%<br />
Project: 70523 - 79th/Orangewood (I) Funding Source:<br />
General Obligation Bonds<br />
Project Description:<br />
Completes the development <strong>of</strong> a 10-acre neighborhood/school joint use park to serve a one mile radius as per<br />
Glendale Elementary School District and Glendale Parks and Recreation Master Plan. Improvements include a<br />
looped pathway, low-level security lighting, ramadas, and landscape. Phase I development included<br />
approximately six acres, leaving approximately 3 to 4 undeveloped acres.<br />
Capital Costs: FY 20<strong>12</strong> FY 2013 FY 2014 FY 2015 FY 2016 FYs 17-21<br />
Design $0 $0 $0 $0 $0 $220,690<br />
Construction $0 $0 $0 $0 $0 $630,544<br />
Finance Charges $0 $0 $0 $0 $0 $24,141<br />
Engineering Charges $0 $0 $0 $0 $0 $36,603<br />
Arts $0 $0 $0 $0 $0 $6,305<br />
Contingency $0 $0 $0 $0 $0 $73,463<br />
TOTAL $0 $0 $0 $0 $0 $991,746<br />
Operating Description:<br />
Supplies and contracts include three acres x $602 per acre. Park area lighting includes $88 per pole x 20 poles.<br />
Landscape maintenance include 130,680 sq ft x .0927 and landscape water includes 130,680 sq ft x .0495.<br />
Operating Costs: FY 20<strong>12</strong> FY 2013 FY 2014 FY 2015 FY 2016 FYs 17-21<br />
Supplies/Contr $0 $0 $0 $0 $0 $11,115<br />
Bldg. Maint. $0 $0 $0 $0 $0 $10,832<br />
Landscape $0 $0 $0 $0 $0 $114,386<br />
TOTAL $0 $0 $0 $0 $0 $136,333<br />
* New Project<br />
N=New Asset, R=Replacement <strong>of</strong> Existing Asset, I=Improvement <strong>of</strong> Existing Asset<br />
329<br />
Return to CIP TOC
FY 20<strong>12</strong>-2021 Capital Improvement Plan<br />
Capital Project Expenses Detail<br />
2060 - Parks Construction Category: 20%<br />
Project: 70532 - Western Area Regional Park (I) Funding Source:<br />
General Obligation Bonds<br />
Project Description:<br />
Phased development <strong>of</strong> an 88 acre regional park and municipal campus. Includes construction <strong>of</strong> an urban lake,<br />
turf and landscaping improvements, feeder stream through the park, irrigation adjacent to lake and stream,<br />
ramadas and picnic areas, sport courts, playground areas, baseball/s<strong>of</strong>tball complex, soccer fields, trail<br />
connections, and infrastructure for this phase. Developing the remaining park amenities and infrastructure for<br />
this phase will help meet the recommended guidelines proposed in the park site master plan and the 2002 Parks<br />
and Recreation Department Master Plan.<br />
Capital Costs: FY 20<strong>12</strong> FY 2013 FY 2014 FY 2015 FY 2016 FYs 17-21<br />
Design $0 $0 $0 $0 $0 $1,760,149<br />
Construction $0 $0 $0 $0 $0 $10,101,496<br />
Finance Charges $0 $0 $0 $0 $0 $358,770<br />
IT/Phone/Security $0 $0 $0 $0 $0 $200,000<br />
Engineering Charges $0 $0 $0 $0 $0 $115,000<br />
Arts $0 $0 $0 $0 $0 $101,015<br />
Equipment $0 $0 $0 $0 $0 $1,010,149<br />
Contingency $0 $0 $0 $0 $0 $1,091,726<br />
TOTAL $0 $0 $0 $0 $0 $14,738,305<br />
Operating Description:<br />
O and M includes the addition <strong>of</strong> two Service Worker II's at $51,654 each (including benefits). Supplies and<br />
contracts include $601 x 50 acres. Utilities includes $2.70 per sq ft x 2000 sq ft control building in the s<strong>of</strong>tball<br />
complex. Equipment Maintenance includes 110 light poles x $171 each for electri<strong>city</strong> and lamp replacement.<br />
Building Maintenance includes $2.70 per sq ft for a 2,000 sq ft building, $4.60 per sq ft for the 2.000 sq ft<br />
building, $750 per sports court x two sport courts, $133 per court for light maintenance, $16,000 per sports field<br />
for lighting x 6, 3,166 for lamp replacement x 6, $75 per low-level security light x 250, $13 per low-level security<br />
light lamp replacement. Insurance reflects $824 per person. PC/Vehicle replacement includes $3,000 per phone<br />
x 6, $640 per lap top x 3, $1,053 per printer x 3, $2,050 for 1/2 ton pick up replacement charges, 8,000 miles x<br />
$0.17 for maintenance costs, 8,000 miles x $0.22 for fuel charges. Of the 50 + acres to be completed,<br />
approximately 34 acres (1,481,040 sq ft ) will be landscaped. The remaining 16 acres will be hardscape.<br />
Landscape maintenance includes 1,481,040 sq ft x $0.0927 and landscape water 1,481,040 sq ft x $0.016335<br />
(SRP water). Building water at $0.195 per sq ft x 2,000. Refuse include five containers located throughout the<br />
park at $2,047 per year.<br />
Operating Costs: FY 20<strong>12</strong> FY 2013 FY 2014 FY 2015 FY 2016 FYs 17-21<br />
Staffing $0 $0 $0 $0 $0 $635,834<br />
Supplies/Contr $0 $0 $0 $0 $0 $184,950<br />
Utilities $0 $0 $0 $0 $0 $33,851<br />
Bldg. Maint. $0 $0 $0 $0 $0 $943,904<br />
Equip. Maint. $0 $0 $0 $0 $0 $115,771<br />
Insurance $0 $0 $0 $0 $0 $10,143<br />
PC/Vehicle Replacement $0 $0 $0 $0 $0 $173,865<br />
Landscape $0 $0 $0 $0 $0 $993,899<br />
Water $0 $0 $0 $0 $0 $2,400<br />
Refuse $0 $0 $0 $0 $0 $62,994<br />
TOTAL $0 $0 $0 $0 $0 $3,157,611<br />
* New Project<br />
N=New Asset, R=Replacement <strong>of</strong> Existing Asset, I=Improvement <strong>of</strong> Existing Asset<br />
330<br />
Return to CIP TOC
FY 20<strong>12</strong>-2021 Capital Improvement Plan<br />
Capital Project Expenses Detail<br />
2060 - Parks Construction Category: 20%<br />
Project: 70535 - Paseo Racquet Center Park (I) Funding Source:<br />
General Obligation Bonds<br />
Project Description:<br />
The park project has two components: Paseo Sports Complex and Paseo Racquet Center, both <strong>of</strong> which are in<br />
this park. The Sports Complex work would include installation <strong>of</strong> <strong>12</strong>,500 sq ft <strong>of</strong> spectator seating, addition <strong>of</strong><br />
concrete surfacing, replacement <strong>of</strong> the lighting system, restroom and concessions building. At the Paseo<br />
Racquet Center, necessary maintenance repairs include court overlays, court resurfacing, lighting, fencing and<br />
building restoration and improvements per the pending new agreement with lessee.<br />
Capital Costs: FY 20<strong>12</strong> FY 2013 FY 2014 FY 2015 FY 2016 FYs 17-21<br />
Design $0 $0 $0 $0 $0 $1,005,416<br />
Construction $0 $0 $0 $0 $0 $2,872,616<br />
Finance Charges $0 $0 $0 $0 $0 $87,326<br />
Engineering Charges $0 $0 $0 $0 $0 $71,744<br />
Arts $0 $0 $0 $0 $0 $28,726<br />
Contingency $0 $0 $0 $0 $0 $387,803<br />
TOTAL $0 $0 $0 $0 $0 $4,453,631<br />
Operating Description:<br />
These capital improvements are to existing facilities and will likely decrease O and M expenses.<br />
Project: 70540 - Grounds & Facilities Imprvmnts (I) Funding Source:<br />
General Obligation Bonds<br />
Project Description:<br />
Renovate and enhance golf course grounds and infrastructure at Glendale's Glen Lakes and Desert Mirage golf<br />
courses. Improvements will include modi<strong>fy</strong>ing or enhancing greens, tees, fairways, cart paths, irrigation system,<br />
lakes, driving range, parking lot, and pro-shop for both municipal golf courses.<br />
Capital Costs: FY 20<strong>12</strong> FY 2013 FY 2014 FY 2015 FY 2016 FYs 17-21<br />
Miscellaneous/Other $0 $0 $0 $0 $0 $200,000<br />
Sub-Total New Funding $0<br />
$0 $0 $0 $0 $200,000<br />
FY 20<strong>12</strong> Carryover<br />
$9,665 $0 $0 $0 $0 $0<br />
TOTAL $9,665 $0 $0 $0 $0 $200,000<br />
Operating Description:<br />
No additional O and M is needed.<br />
* New Project<br />
N=New Asset, R=Replacement <strong>of</strong> Existing Asset, I=Improvement <strong>of</strong> Existing Asset<br />
331<br />
Return to CIP TOC
FY 20<strong>12</strong>-2021 Capital Improvement Plan<br />
Capital Project Expenses Detail<br />
2060 - Parks Construction Category: 20%<br />
Project: T1710 - Adult Center Expansion (I) Funding Source:<br />
General Obligation Bonds<br />
Project Description:<br />
Improvements to the 17,000 sq ft <strong>of</strong> unfinished interior space on the second level <strong>of</strong> the Adult Center. Expansion<br />
will help meet the needs <strong>of</strong> present center users and will also accommodate the additional programs needed for<br />
the growing number <strong>of</strong> seniors in the <strong>city</strong> and the increasing adult center attendance. The expansion could<br />
include meeting rooms, relocated billiards room, aerobics, specialty crafts and programmer <strong>of</strong>fices.<br />
Capital Costs: FY 20<strong>12</strong> FY 2013 FY 2014 FY 2015 FY 2016 FYs 17-21<br />
Design $0 $0 $0 $0 $0 $1,909,950<br />
Construction $0 $0 $0 $0 $0 $5,457,000<br />
Finance Charges $0 $0 $0 $0 $0 $183,552<br />
IT/Phone/Security $0 $0 $0 $0 $0 $107,853<br />
Engineering Charges $0 $0 $0 $0 $0 $92,500<br />
Arts $0 $0 $0 $0 $0 $54,570<br />
Equipment $0 $0 $0 $0 $0 $700,034<br />
Contingency $0 $0 $0 $0 $0 $855,722<br />
TOTAL $0 $0 $0 $0 $0 $9,361,181<br />
Operating Description:<br />
Staffing includes 1 Senior Recreation Coordinator at $72,275 including benefits, 1 Recreation Programmer at<br />
$51,554 including benefits, 1 FTE Office Support Supervisor at $58,394 including benefits, 1 Custodian with<br />
benefits at $47,025, 2-19 hour Recreation Programmers at $55,218 with benefits. Supplies and contracts include<br />
$2.70 per sq ft x 17,000 sq ft. Utilities include the cost <strong>of</strong> electri<strong>city</strong> at $2.70 x 17,000 sq ft. Building Maintenance<br />
includes HVAC maintenance at $2.50 x 17,000 sq ft; Insurance is 5 employees x $824 plus inflation, per<br />
employee. Electrical is $100 additional monthly security monitoring; building water is $0.195 per sq ft x 17,000 sq<br />
ft . All are factored for inflation and calculated for 27 months <strong>of</strong> operation. A supplemental <strong>budget</strong> request will be<br />
submitted once the project is near completion.<br />
Operating Costs: FY 20<strong>12</strong> FY 2013 FY 2014 FY 2015 FY 2016 FYs 17-21<br />
Staffing $0 $0 $0 $0 $0 $787,867<br />
Supplies/Contr $0 $0 $0 $0 $0 $<strong>12</strong>7,<strong>12</strong>6<br />
Utilities $0 $0 $0 $0 $0 $<strong>12</strong>7,<strong>12</strong>6<br />
Bldg. Maint. $0 $0 $0 $0 $0 $117,710<br />
Equip. Maint. $0 $0 $0 $0 $0 $14,329<br />
Insurance $0 $0 $0 $0 $0 $11,411<br />
Electrical $0 $0 $0 $0 $0 $3,324<br />
Water $0 $0 $0 $0 $0 $1,492<br />
TOTAL $0 $0 $0 $0 $0 $1,190,385<br />
* New Project<br />
N=New Asset, R=Replacement <strong>of</strong> Existing Asset, I=Improvement <strong>of</strong> Existing Asset<br />
332<br />
Return to CIP TOC
FY 20<strong>12</strong>-2021 Capital Improvement Plan<br />
Capital Project Expenses Detail<br />
2060 - Parks Construction Category: 20%<br />
Project: T1714* - O'Neil Park Splash Pad (I) Funding Source:<br />
General Obligation Bonds<br />
Project Description:<br />
Demolition <strong>of</strong> an existing pool site and construction <strong>of</strong> a 15,000 - 20,000 sq ft splash pad. The new splash pad<br />
would include state-<strong>of</strong>-the-art themed spray components, concrete pad with a synthetic aquatic service, shade<br />
structures, controlled access points, outdoor lighting, and a re-circulating pump station to conserve water.<br />
Capital Costs: FY 20<strong>12</strong> FY 2013 FY 2014 FY 2015 FY 2016 FYs 17-21<br />
Design $0 $0 $0 $0 $0 $169,050<br />
Construction $0 $0 $0 $0 $0 $483,000<br />
Finance Charges $0 $0 $0 $0 $0 $14,685<br />
Engineering Charges $0 $0 $0 $0 $0 $29,400<br />
Arts $0 $0 $0 $0 $0 $4,830<br />
Contingency $0 $0 $0 $0 $0 $48,000<br />
TOTAL $0 $0 $0 $0 $0 $748,965<br />
Operating Description:<br />
Supplies and Contracts includes chemicals for water treatment at $.23 per sq ft, Building maintenance accounts<br />
for 10 low level lighting for night use at $188 x 10, and water accounts for the evaporation <strong>of</strong> the re-circulating<br />
water at $.06 per square foot. A supplemental <strong>budget</strong> request will be submitted once the project is near<br />
completion.<br />
Operating Costs: FY 20<strong>12</strong> FY 2013 FY 2014 FY 2015 FY 2016 FYs 17-21<br />
Supplies/Contr $0 $0 $0 $0 $0 $8,370<br />
Bldg. Maint. $0 $0 $0 $0 $0 $4,210<br />
Water $0 $0 $0 $0 $0 $2,277<br />
TOTAL $0 $0 $0 $0 $0 $14,857<br />
* New Project<br />
N=New Asset, R=Replacement <strong>of</strong> Existing Asset, I=Improvement <strong>of</strong> Existing Asset<br />
333<br />
Return to CIP TOC
FY 20<strong>12</strong>-2021 Capital Improvement Plan<br />
Capital Project Expenses Detail<br />
2060 - Parks Construction Category: 20%<br />
Project: 70500 - Parks Redevelopment (R) Funding Source:<br />
General Obligation Bonds<br />
Project Description:<br />
This project is designed as a proactive focus for revitalizing parks currently in the <strong>city</strong>'s inventory that have<br />
shown signs <strong>of</strong> deteriorating infrastructure, amenities, and/or landscape. The purpose <strong>of</strong> the redevelopment<br />
process is to heighten or restore the overall functionality <strong>of</strong> the park for the users, while at the same time<br />
enhancing the operating efficiency. As in the past, staff identi<strong>fy</strong> strategies that are designed to revive the park’s<br />
existing strengths and develop new or enhanced functions <strong>of</strong> the park. Development strategies, service gaps and<br />
needs are identified and addressed during the design and construction phase. Depending on the park category,<br />
location, size, and level <strong>of</strong> service, each requires a distinct level <strong>of</strong> funding to address an assortment <strong>of</strong> services<br />
or operational improvements.<br />
Capital Costs: FY 20<strong>12</strong> FY 2013 FY 2014 FY 2015 FY 2016 FYs 17-21<br />
Design $0 $0 $0 $0 $0 $6,283,947<br />
Construction $0 $0 $0 $0 $0 $18,239,851<br />
Finance Charges $0 $0 $0 $0 $0 $680,571<br />
Engineering Charges $0 $0 $0 $0 $0 $<strong>12</strong>2,000<br />
Arts $0 $0 $0 $0 $0 $182,398<br />
Contingency $0 $0 $0 $0 $0 $2,040,702<br />
Sub-Total New Funding $0<br />
$0 $0 $0 $0 $27,549,469<br />
FY 20<strong>12</strong> Carryover<br />
$106,518 $0 $0 $0 $0 $0<br />
TOTAL $106,518 $0 $0 $0 $0 $27,549,469<br />
Operating Description:<br />
Supplies and contracts are based on 10 acres x $601 per acre. Building Maintenance includes an additional 30,<br />
low-level park lighting at $88 per pole. These parks are currently maintained, so staff doesn't project additional<br />
landscape maintenance or water costs. Water would include the addition <strong>of</strong> 40 drinking fountains at $66 each. A<br />
supplemental <strong>budget</strong> request will be submitted once the project is near completion.<br />
Operating Costs: FY 20<strong>12</strong> FY 2013 FY 2014 FY 2015 FY 2016 FYs 17-21<br />
Supplies/Contr $0 $0 $0 $0 $0 $36,990<br />
Bldg. Maint. $0 $0 $0 $0 $0 $16,249<br />
Water $0 $0 $0 $0 $0 $16,249<br />
TOTAL $0 $0 $0 $0 $0 $69,488<br />
* New Project<br />
N=New Asset, R=Replacement <strong>of</strong> Existing Asset, I=Improvement <strong>of</strong> Existing Asset<br />
334<br />
Return to CIP TOC
FY 20<strong>12</strong>-2021 Capital Improvement Plan<br />
Capital Project Expenses Detail<br />
2060 - Parks Construction Category: 20%<br />
Project: 705<strong>12</strong> - Facilities Renovation (R) Funding Source:<br />
General Obligation Bonds<br />
Project Description:<br />
Renovations address planned and/or unexpected restoration improvements and infrastructure replacement at<br />
existing park and recreation buildings, centers, ball field complex sites, group ramada pavilions, restrooms and<br />
tennis and golf complexes. Funds are used <strong>city</strong>wide to provide ongoing renovation to existing facilities. The<br />
specific facilities that receive assistance from this fund are targeted through an ongoing assessment and<br />
feedback from citizens and staff.<br />
Capital Costs: FY 20<strong>12</strong> FY 2013 FY 2014 FY 2015 FY 2016 FYs 17-21<br />
Construction $0 $0 $0 $0 $0 $8,093,137<br />
Finance Charges $0 $0 $0 $0 $0 $186,870<br />
Engineering Charges $0 $0 $0 $0 $0 $<strong>12</strong>0,000<br />
Arts $0 $0 $0 $0 $0 $80,931<br />
Equipment $0 $0 $0 $0 $0 $200,000<br />
Contingency $0 $0 $0 $0 $0 $849,407<br />
Sub-Total New Funding $0<br />
$0 $0 $0 $0 $9,530,345<br />
FY 20<strong>12</strong> Carryover<br />
$4,942 $0 $0 $0 $0 $0<br />
TOTAL $4,942 $0 $0 $0 $0 $9,530,345<br />
Operating Description:<br />
New O and M expenses are not usually encountered with restoration activities.<br />
Project: 70526 - Multiuse Sports Field Lighting (R) Funding Source:<br />
General Obligation Bonds<br />
Project Description:<br />
Renovation or replacement <strong>of</strong> existing sports lights that have illumination depreciation or nor longer meet current<br />
illumination standards.<br />
Capital Costs: FY 20<strong>12</strong> FY 2013 FY 2014 FY 2015 FY 2016 FYs 17-21<br />
Design $0 $0 $0 $0 $0 $700,000<br />
Construction $0 $0 $0 $0 $0 $2,000,000<br />
Finance Charges $0 $0 $0 $0 $0 $79,781<br />
Engineering Charges $0 $0 $0 $0 $0 $55,000<br />
Arts $0 $0 $0 $0 $0 $20,000<br />
Contingency $0 $0 $0 $0 $0 $428,217<br />
TOTAL $0 $0 $0 $0 $0 $3,282,998<br />
Operating Description:<br />
O and M cost is based on six multi-use fields with new lighting. Building maintenance costs include electrical at<br />
$16,000 per field and lamp replacement at $3,166 per field. $3,000 for sinking fund for repair and renovation per<br />
IGA.<br />
Operating Costs: FY 20<strong>12</strong> FY 2013 FY 2014 FY 2015 FY 2016 FYs 17-21<br />
Bldg. Maint. $0 $0 $0 $0 $0 $818,556<br />
TOTAL $0 $0 $0 $0 $0 $818,556<br />
* New Project<br />
N=New Asset, R=Replacement <strong>of</strong> Existing Asset, I=Improvement <strong>of</strong> Existing Asset<br />
335<br />
Return to CIP TOC
FY 20<strong>12</strong>-2021 Capital Improvement Plan<br />
Capital Project Expenses Detail<br />
2060 - Parks Construction Category: 20%<br />
Project: 70541 - Parks Capital Equipment (R) Funding Source:<br />
General Obligation Bonds<br />
Project Description:<br />
Purchase new and replace old, outdated equipment such as mowers, trailers, utility vehicles, ball field<br />
preparation machines and pick-up trucks that have outlasted their effective life span for use at parks and<br />
maintenance <strong>of</strong> <strong>city</strong> green spaces and grounds.<br />
Capital Costs: FY 20<strong>12</strong> FY 2013 FY 2014 FY 2015 FY 2016 FYs 17-21<br />
Finance Charges $0 $0 $0 $0 $0 $<strong>12</strong>,500<br />
Equipment $0 $0 $0 $0 $0 $487,500<br />
Sub-Total New Funding $0<br />
$0 $0 $0 $0 $500,000<br />
FY 20<strong>12</strong> Carryover<br />
$22,810 $0 $0 $0 $0 $0<br />
TOTAL $22,810 $0 $0 $0 $0 $500,000<br />
Operating Description:<br />
PC/Vehicle Replacement includes maintenance for 5 mowers, 5 trailers, 5 ball field prep. machines and 2 pickup<br />
trucks. Equipment maintenance is $75 per hour x 20 (# <strong>of</strong> visits) x pieces <strong>of</strong> equipment. Two pick up trucks at<br />
$2,050, $.17 per mile for maintenance costs x 8,000 miles, and $.22 per mile x 8,000 miles for fuel costs. The<br />
remaining equipment will calculated as the equivalent as one vehicle, which is one truck at $2,050, $.17 per mile<br />
for maintenance costs x 8,000 miles, and $.22 per mile x 8,000 miles for fuel costs. A supplemental <strong>budget</strong><br />
request will be submitted once the project is near completion.<br />
Operating Costs: FY 20<strong>12</strong> FY 2013 FY 2014 FY 2015 FY 2016 FYs 17-21<br />
Equip. Maint. $0 $0 $0 $0 $0 $138,482<br />
PC/Vehicle Replacement $0 $0 $0 $0 $0 $<strong>12</strong>7,280<br />
TOTAL $0 $0 $0 $0 $0 $265,762<br />
Project: 70542 - Parks Master Plan Update (R) Funding Source:<br />
General Obligation Bonds<br />
Project Description:<br />
The <strong>city</strong> seeks an updated Parks and Recreation Master Plan document that is concise, performance<br />
measurement based, user friendly and visionary with regards to the health and vibrancy <strong>of</strong> the <strong>city</strong>, its<br />
commercial areas and its neighborhoods. The scheduled update is required to meet agency accreditation<br />
standards.<br />
Capital Costs: FY 20<strong>12</strong> FY 2013 FY 2014 FY 2015 FY 2016 FYs 17-21<br />
FY 20<strong>12</strong> Carryover<br />
$10,177 $0 $0 $0 $0 $0<br />
TOTAL $10,177 $0 $0 $0 $0 $0<br />
Operating Description:<br />
No additional O and M is needed.<br />
* New Project<br />
N=New Asset, R=Replacement <strong>of</strong> Existing Asset, I=Improvement <strong>of</strong> Existing Asset<br />
336<br />
Return to CIP TOC
FY 20<strong>12</strong>-2021 Capital Improvement Plan<br />
Capital Project Expenses Detail<br />
2060 - Parks Construction Category: 20%<br />
Project: T17<strong>12</strong> - Aquatic Facility Restoration (R) Funding Source:<br />
General Obligation Bonds<br />
Project Description:<br />
The renovation and restoration <strong>of</strong> existing swimming pools. The aquatic facilities require <strong>annual</strong> attention. Typical<br />
repair projects at each pool include replastering <strong>of</strong> the water vessels, patching and repairs to the pool decking,<br />
replacement <strong>of</strong> shade canopies, pool pumps and other equipment to ensure continued compliance with all<br />
federal, state and county health code requirements.<br />
Capital Costs: FY 20<strong>12</strong> FY 2013 FY 2014 FY 2015 FY 2016 FYs 17-21<br />
Design $0 $0 $0 $0 $0 $1,350,822<br />
Construction $0 $0 $0 $0 $0 $4,650,207<br />
Finance Charges $0 $0 $0 $0 $0 $181,672<br />
Engineering Charges $0 $0 $0 $0 $0 $92,500<br />
Arts $0 $0 $0 $0 $0 $46,502<br />
Contingency $0 $0 $0 $0 $0 $948,255<br />
TOTAL $0 $0 $0 $0 $0 $7,269,958<br />
Operating Description:<br />
No additional O and M needed.<br />
Project: T1713 - Foothills Center Restoration (R) Funding Source:<br />
General Obligation Bonds<br />
Project Description:<br />
Replacement <strong>of</strong> recreation center equipment that had a useful life <strong>of</strong> 5-7 years and renovation <strong>of</strong> the facility.<br />
Replacement <strong>of</strong> fitness room equipment, existing audio/visual equipment, carpeting, room dividers, window<br />
blinds and other items due to normal wear and tear.<br />
Capital Costs: FY 20<strong>12</strong> FY 2013 FY 2014 FY 2015 FY 2016 FYs 17-21<br />
Design $0 $0 $0 $0 $0 $189,625<br />
Construction $0 $0 $0 $0 $0 $758,500<br />
Finance Charges $0 $0 $0 $0 $0 $37,040<br />
IT/Phone/Security $0 $0 $0 $0 $0 $80,500<br />
Engineering Charges $0 $0 $0 $0 $0 $40,769<br />
Arts $0 $0 $0 $0 $0 $7,585<br />
Equipment $0 $0 $0 $0 $0 $634,500<br />
Contingency $0 $0 $0 $0 $0 $140,506<br />
TOTAL $0 $0 $0 $0 $0 $1,889,025<br />
Operating Description:<br />
No additional O and M is need for this project.<br />
* New Project<br />
N=New Asset, R=Replacement <strong>of</strong> Existing Asset, I=Improvement <strong>of</strong> Existing Asset<br />
337<br />
Return to CIP TOC
FY 20<strong>12</strong>-2021 Capital Improvement Plan<br />
Capital Project Expenses Detail<br />
2060 - Parks Construction Category: 20%<br />
Project: 70527 - West Area Pool (N) Funding Source:<br />
General Obligation Bonds<br />
Project Description:<br />
Design and construction <strong>of</strong> a new aquatic center to accommodate growth in the western area <strong>of</strong> the <strong>city</strong>. Design<br />
and construction <strong>of</strong> a zero depth swimming pool with children's play features, 50 yard competitive swimming pool<br />
with heat, dive well with heat, waterslides, wave in a box feature, lighting, decking, a bath house with classroom<br />
and a parking lot.<br />
Capital Costs: FY 20<strong>12</strong> FY 2013 FY 2014 FY 2015 FY 2016 FYs 17-21<br />
Design $0 $0 $0 $0 $0 $2,116,595<br />
Construction $0 $0 $0 $0 $0 $7,149,660<br />
Finance Charges $0 $0 $0 $0 $0 $255,287<br />
IT/Phone/Security $0 $0 $0 $0 $0 $24,840<br />
Engineering Charges $0 $0 $0 $0 $0 $92,500<br />
Arts $0 $0 $0 $0 $0 $71,497<br />
Contingency $0 $0 $0 $0 $0 $776,830<br />
TOTAL $0 $0 $0 $0 $0 $10,487,209<br />
Operating Description:<br />
Staffing: FTE Programmer = $44,271. FTE Crew Leader = $50,145. Hourly staffing = $250,000, 1 summer pool<br />
manager, 2 assistant pool managers, year round Lifeguards, Water Safety Instructors, and Cashiers. TOTAL:<br />
$344,416<br />
Supplies: Chemicals: $25,000, programming supplies, $30,000, Red Cross $1,000, TOTAL: $56,000.<br />
Utilities: Electri<strong>city</strong>: $35,000, Natural Gas, $40,000, TOTAL: $75,000.<br />
Bldg Maintenance: 8 poles x $150=$1,200, 16 lamps x $21=$336, custodial .=5,650 sq ft x $1.62=$9,513, HVAC<br />
5,650 sq ft $2.50 = $14,<strong>12</strong>5, Plumbing 5,650 sq ft x $4.60=$25,990, TOTAL: $51,164<br />
Equip Maintenance: $15,000 – pool pumps, filters, etc, based on current costs at Rose Lane/Foothills<br />
Insurance: 2 new employees, $1,074 per person x 2 = $2,148 TOTAL.<br />
Electrical systems: fire alarm monitoring and maintenance, security camera maintenance, security system<br />
monitoring and maintenance, $5,000.<br />
PC/Vehicle replacement: 4 PCs @ $540 each per year, and 1 truck @ $2,050 per year, TOTAL: $4,210.<br />
Landscape Maintenance: Landscape Maintenance 56,500 sq ft x $0.22=$<strong>12</strong>,430.<br />
Water: 5,650 sq. ft <strong>of</strong> building x $.195= $1,101, Pool Water $15,000 per year, TOTAL: $16,101.<br />
Refuse: $341.26 x <strong>12</strong> months = $4,095.<br />
Operating Costs: FY 20<strong>12</strong> FY 2013 FY 2014 FY 2015 FY 2016 FYs 17-21<br />
Staffing $0 $0 $0 $0 $0 $861,040<br />
Supplies/Contr $0 $0 $0 $0 $0 $140,000<br />
Utilities $0 $0 $0 $0 $0 $187,500<br />
Bldg. Maint. $0 $0 $0 $0 $0 $<strong>12</strong>7,910<br />
Equip. Maint. $0 $0 $0 $0 $0 $37,500<br />
Insurance $0 $0 $0 $0 $0 $5,370<br />
Electrical $0 $0 $0 $0 $0 $<strong>12</strong>,500<br />
PC/Vehicle Replacement $0 $0 $0 $0 $0 $10,525<br />
Landscape $0 $0 $0 $0 $0 $31,075<br />
Water $0 $0 $0 $0 $0 $40,253<br />
Refuse $0 $0 $0 $0 $0 $10,238<br />
TOTAL $0 $0 $0 $0 $0 $1,463,911<br />
* New Project<br />
N=New Asset, R=Replacement <strong>of</strong> Existing Asset, I=Improvement <strong>of</strong> Existing Asset<br />
338<br />
Return to CIP TOC
FY 20<strong>12</strong>-2021 Capital Improvement Plan<br />
Capital Project Expenses Detail<br />
2060 - Parks Construction Category: 20%<br />
Project: 70528 - Family Recreation Center-West (N) Funding Source:<br />
General Obligation Bonds<br />
Project Description:<br />
Development <strong>of</strong> a multi-generational recreation center that targets a diverse demographic. The construction <strong>of</strong><br />
the 70,000 sq ft family recreation center would provide a gymnasium, multi-purpose rooms, activity areas and<br />
exercise centers. Equipment furnishings include estimated costs for furnishing a recreation facility and exercise<br />
room amenities, such as fitness equipment, tables, chairs, and audio/visual equipment. Project addresses the<br />
Parks and Recreation Master Plan recommendation to develop a multi-generational recreation center that target<br />
a diverse demographic.<br />
Capital Costs: FY 20<strong>12</strong> FY 2013 FY 2014 FY 2015 FY 2016 FYs 17-21<br />
Design $0 $0 $0 $0 $0 $5,271,175<br />
Construction $0 $0 $0 $0 $0 $15,060,500<br />
Finance Charges $0 $0 $0 $0 $0 $615,184<br />
IT/Phone/Security $0 $0 $0 $0 $0 $260,000<br />
Engineering Charges $0 $0 $0 $0 $0 $<strong>12</strong>2,000<br />
Arts $0 $0 $0 $0 $0 $150,605<br />
Equipment $0 $0 $0 $0 $0 $1,506,050<br />
Contingency $0 $0 $0 $0 $0 $2,298,551<br />
TOTAL $0 $0 $0 $0 $0 $25,284,065<br />
Operating Description:<br />
Additional O and M calculated for 21 months beginning in September 2019. Staffing levels are based on a seven<br />
day per week operation and includes a Recreation Manager, a Office Support Supervisor, 3 Senior Recreation<br />
Coordinators, 2 Secretaries, 3 Recreation Programmers, a Service Worker II, a Service Worker III, 2 Building<br />
Maintenance Workers, and 10 PT Recreation Programmers (benefits included for FTE's only).<br />
Supplies/Contracts include $2.70 sq ft x 70,000 sq ft facility. Utilities include $2.70 sq ft for electri<strong>city</strong> x 70,000 sq<br />
ft. Building maintenance includes HVAC at $2.50 sq ft x 70,000 sq ft, custodial services at $1.62 per sq ft x<br />
70,000, plumbing costs at $4.60 per sq ft x 70,000 sq ft. Equipment maintenance includes vehicle maintenance<br />
($0.17 per mile) and fuel ($0.22 per mile) for three 1/2 ton pickup trucks driven 8,000 miles <strong>annual</strong>ly. Insurance<br />
includes $786 x 19 employees. Electrical includes fire alarm system at $150 per month, which includes the<br />
monitoring subscription dedicated phone lines. Vehicle replacement includes vehicle replacement at $2,050 x 3.<br />
Technology replacement includes $540 x 8 desktop computers and a network printer at $1,053 per year.<br />
Landscape maintenance and water costs are included in project 2060-70532. Building water is calculated at<br />
$0.195 x 70,000 sq ft. Refuse includes two 6-yard containers x 3 pick-ups per week at $2,047 <strong>annual</strong>ly.<br />
Operating Costs: FY 20<strong>12</strong> FY 2013 FY 2014 FY 2015 FY 2016 FYs 17-21<br />
Staffing $0 $0 $0 $0 $0 $2,500,847<br />
Supplies/Contr $0 $0 $0 $0 $0 $426,167<br />
Utilities $0 $0 $0 $0 $0 $426,167<br />
Bldg. Maint. $0 $0 $0 $0 $0 $1,376,361<br />
Equip. Maint. $0 $0 $0 $0 $0 $21,105<br />
Insurance $0 $0 $0 $0 $0 $33,674<br />
Electrical $0 $0 $0 $0 $0 $4,059<br />
PC/Vehicle Replacement $0 $0 $0 $0 $0 $25,983<br />
Water $0 $0 $0 $0 $0 $30,779<br />
Refuse $0 $0 $0 $0 $0 $9,234<br />
TOTAL $0 $0 $0 $0 $0 $4,854,376<br />
* New Project<br />
N=New Asset, R=Replacement <strong>of</strong> Existing Asset, I=Improvement <strong>of</strong> Existing Asset<br />
339<br />
Return to CIP TOC
FY 20<strong>12</strong>-2021 Capital Improvement Plan<br />
Capital Project Expenses Detail<br />
2060 - Parks Construction Category: 20%<br />
Project: 70531 - Sahuaro Ranch Visitor Ctr. (N) Funding Source:<br />
General Obligation Bonds<br />
Project Description:<br />
Construction <strong>of</strong> a visitor center that will serve as a customer service point <strong>of</strong> contact for the Sahuaro Ranch Park<br />
historical area and information for the rest <strong>of</strong> the park areas. Building will include display areas, meeting rooms,<br />
restrooms and display areas.<br />
Capital Costs: FY 20<strong>12</strong> FY 2013 FY 2014 FY 2015 FY 2016 FYs 17-21<br />
Design $0 $0 $0 $0 $0 $158,182<br />
Construction $0 $0 $0 $0 $0 $925,000<br />
Finance Charges $0 $0 $0 $0 $0 $35,830<br />
IT/Phone/Security $0 $0 $0 $0 $0 $75,000<br />
Engineering Charges $0 $0 $0 $0 $0 $43,000<br />
Arts $0 $0 $0 $0 $0 $9,250<br />
Equipment $0 $0 $0 $0 $0 $92,500<br />
Contingency $0 $0 $0 $0 $0 $133,876<br />
TOTAL $0 $0 $0 $0 $0 $1,472,638<br />
Operating Description:<br />
Staffing includes one Office Support Supervisor at $62,256 and (benefits included) and two part-time hourly staff<br />
at $15,000 each <strong>annual</strong>ly. Supplies and contracts include $2.70 per sq ft x 5,000 sq ft. Utilities include the cost<br />
for electri<strong>city</strong> at $2.70 per sq ft x 5,000. Building Maintenance includes maintenance <strong>of</strong> the HVAC at $2.50 per sq<br />
ft x 5,000 sq ft, custodial services at $1.62 per sq ft x 5,000 sq ft, and plumbing at $4.60 per sq ft x 5,000 sq ft.<br />
Insurance is $824 x per staff member. Electrical includes $10,000 security alarm system and $10,000 for fire<br />
alarm system. PC/Vehicle Replacement includes three computer lap tops x $640 three printers x $1,053, $3,000<br />
for telephones (6), $1,500 for wireless service. Landscape maintenance and landscape water preexisting,<br />
consequently, the new facility would not incur new landscape water and landscape maintenance O and M<br />
expenses. Water includes building water usage at 5,000 sq ft x .195 per sq ft.<br />
Operating Costs: FY 20<strong>12</strong> FY 2013 FY 2014 FY 2015 FY 2016 FYs 17-21<br />
Staffing $0 $0 $0 $0 $0 $567,8<strong>12</strong><br />
Supplies/Contr $0 $0 $0 $0 $0 $83,089<br />
Utilities $0 $0 $0 $0 $0 $83,089<br />
Bldg. Maint. $0 $0 $0 $0 $0 $268,347<br />
Insurance $0 $0 $0 $0 $0 $5,072<br />
Electrical $0 $0 $0 $0 $0 $<strong>12</strong>3,095<br />
PC/Vehicle Replacement $0 $0 $0 $0 $0 $58,956<br />
Water $0 $0 $0 $0 $0 $6,001<br />
TOTAL $0 $0 $0 $0 $0 $1,195,461<br />
* New Project<br />
N=New Asset, R=Replacement <strong>of</strong> Existing Asset, I=Improvement <strong>of</strong> Existing Asset<br />
340<br />
Return to CIP TOC
20<strong>12</strong>-2021 CAPITAL IMPROVEMENT PLAN<br />
Library - Construction Fund<br />
LIBRARY<br />
CONSTRUCTION FUND<br />
The continued decline in Glendale’s secondary assessed value required the Western Area Library<br />
originally planned for FY 2009 and FY 2010 to be pushed to the last five years <strong>of</strong> the capital<br />
improvement plan joining the renovation project for the three existing <strong>city</strong> libraries.<br />
Project Name: Int. Renovation-Main, VT, FH<br />
Funding Source: G.O. Bond<br />
Fund #: 2160<br />
Project #: T2810<br />
Picture Note: Foothills Branch Library above, Main Library Below<br />
341<br />
Return to CIP TOC
FY 20<strong>12</strong> - 2021 Capital Improvement Plan<br />
Fund and Project Summary<br />
2160 - Library Construction Category: 6%<br />
FY 20<strong>12</strong>: FY 2013: FY 2014: FY 2015: FY 2016: FYs 17-21:<br />
Estimated Beginning Balance: $0 $0 $0 $0 $0 $0<br />
Revenue<br />
Bond Proceeds^ 0 0 0 0 0 35,610,000<br />
Total Revenue:<br />
0 0 0 0 0 35,610,000<br />
Project Expenses Carryover New Funding<br />
Existing Assets<br />
Improvement <strong>of</strong> Existing Assets<br />
T2810 Int. Renovation-Main, VT, FH<br />
0 0 0 0 0 0 <strong>12</strong>,579,433<br />
Sub-Total - Existing Assets 0<br />
0 0 0 0 0 <strong>12</strong>,579,433<br />
New Assets<br />
74000 West Branch Library<br />
0 0 0 0 0 0 23,029,715<br />
Sub-Total - New Assets 0<br />
0 0 0 0 0 23,029,715<br />
Total Project Expenses:<br />
0 0 0 0 0 0 35,609,148<br />
Total FY 20<strong>12</strong> Funding:<br />
0<br />
Estimated Ending Balance: $0 $0 $0 $0 $0 $852<br />
*New Project<br />
^Will require additional voter authorization in last 5 years <strong>of</strong> the plan.<br />
342<br />
Return to CIP TOC
FY 20<strong>12</strong>-2021 Capital Improvement Plan<br />
Capital Project Expenses Detail<br />
2160 - Library Construction Category: 6%<br />
Project: T2810 - Int. Renovation-Main, VT, FH (I) Funding Source:<br />
General Obligation Bonds<br />
Project Description:<br />
This project includes renovating and updating interior spaces at Velma Teague, Foothills and the Main Library,<br />
including shelving, tables, chairs and other furnishings. It also includes upgrading the security camera systems at<br />
the libraries. This upgrade would provide for a greater number <strong>of</strong> cameras both inside and outside <strong>of</strong> the facilities<br />
and will provide higher quality images than currently available with our existing equipment.<br />
Capital Costs: FY 20<strong>12</strong> FY 2013 FY 2014 FY 2015 FY 2016 FYs 17-21<br />
Finance Charges $0 $0 $0 $0 $0 $246,656<br />
IT/Phone/Security $0 $0 $0 $0 $0 $43,692<br />
Equipment $0 $0 $0 $0 $0 $<strong>12</strong>,289,085<br />
TOTAL $0 $0 $0 $0 $0 $<strong>12</strong>,579,433<br />
Operating Description:<br />
No additional O and M is need for this project.<br />
* New Project<br />
N=New Asset, R=Replacement <strong>of</strong> Existing Asset, I=Improvement <strong>of</strong> Existing Asset<br />
343<br />
Return to CIP TOC
FY 20<strong>12</strong>-2021 Capital Improvement Plan<br />
Capital Project Expenses Detail<br />
2160 - Library Construction Category: 6%<br />
Project: 74000 - West Branch Library (N) Funding Source:<br />
General Obligation Bonds<br />
Project Description:<br />
This request is for funding to construct and furnish a branch library to serve the western portion <strong>of</strong> the <strong>city</strong>. This<br />
includes the design and construction <strong>of</strong> a 33,500 sq ft facility on approximately 7 acres <strong>of</strong> land at the Western<br />
Area Regional Facility site at 83rd Avenue and Bethany Home Road. This project is being funded by a<br />
combination <strong>of</strong> Library Bonds and Development Impact Fees. The total project cost is estimated at $26,592,494<br />
in FY 2017. A total <strong>of</strong> $23,029,715 in general obligation bonds will be needed for this project with the remaining<br />
cost covered by DIF. The design <strong>of</strong> the building was completed in 2009, and was paid from DIF Account 1380-<br />
74250. By 2017, it is anticipated that considerable redesign may be necessary.<br />
Capital Costs: FY 20<strong>12</strong> FY 2013 FY 2014 FY 2015 FY 2016 FYs 17-21<br />
Design $0 $0 $0 $0 $0 $2,549,996<br />
Construction $0 $0 $0 $0 $0 $14,974,202<br />
Finance Charges $0 $0 $0 $0 $0 $561,718<br />
IT/Phone/Security $0 $0 $0 $0 $0 $440,000<br />
Engineering Charges $0 $0 $0 $0 $0 $101,862<br />
Arts $0 $0 $0 $0 $0 $149,742<br />
Equipment $0 $0 $0 $0 $0 $1,221,001<br />
Contingency $0 $0 $0 $0 $0 $1,801,194<br />
Miscellaneous/Other $0 $0 $0 $0 $0 $1,230,000<br />
TOTAL $0 $0 $0 $0 $0 $23,029,715<br />
Operating Description:<br />
Additional O and M would be needed starting in September 2018. Staffing includes the salary and benefits for a<br />
branch manager, 2 Librarian III's, 7 Librarian I's, a Library Operations Supervisor, 4 Library Assistant III's, a<br />
Library Assistant II, a Library Assistant I, 2.5 Public Service Assistants, 0.5 Courier, 0.5 Office Assistant, a PC<br />
Support Specialist II, a Security Officer and a Building Maintenance Worker for the Facilities Management<br />
Department that must be added to support the addition <strong>of</strong> this building. Staffing also includes eight 19-hour<br />
pages and two 19-hour Information Services Assistants. Additionally, a building maintenance truck will be<br />
provided for the Building Maintenance Worker. The operating <strong>budget</strong> also includes <strong>book</strong>s, periodicals, electronic<br />
resources, supplies and contracts (including contracted custodial services), a library vehicle, pr<strong>of</strong>essional<br />
development, equipment maintenance, building maintenance, utilities and insurance. A supplemental <strong>budget</strong><br />
request will be submitted once the project is near completion.<br />
Operating Costs: FY 20<strong>12</strong> FY 2013 FY 2014 FY 2015 FY 2016 FYs 17-21<br />
Staffing $0 $0 $0 $0 $0 $5,730,470<br />
Supplies/Contr $0 $0 $0 $0 $0 $1,784,895<br />
Utilities $0 $0 $0 $0 $0 $343,743<br />
Bldg. Maint. $0 $0 $0 $0 $0 $291,623<br />
Equip. Maint. $0 $0 $0 $0 $0 $360,839<br />
Insurance $0 $0 $0 $0 $0 $51,857<br />
PC/Vehicle Replacement $0 $0 $0 $0 $0 $395,056<br />
Landscape $0 $0 $0 $0 $0 $26,176<br />
Water $0 $0 $0 $0 $0 $33,461<br />
Refuse $0 $0 $0 $0 $0 $5,746<br />
TOTAL $0 $0 $0 $0 $0 $9,023,866<br />
* New Project<br />
N=New Asset, R=Replacement <strong>of</strong> Existing Asset, I=Improvement <strong>of</strong> Existing Asset<br />
344<br />
Return to CIP TOC
20<strong>12</strong>-2021 CAPITAL IMPROVEMENT PLAN<br />
Public Safety – Construction Funds<br />
PUBLIC SAFETY<br />
CONSTRUCTION FUNDS<br />
Public safety projects are funded by a combination <strong>of</strong> public safety general obligation bonds and<br />
development impact fees. This section highlights the G.O. projects funded in Fund 2040 for the<br />
Fire, Police and City Court Departments.<br />
Carryover and new funding within the Public Safety Communication System project will be<br />
utilized to complete the necessary steps in order for the Police and Fire Departments to join the<br />
Regional Wireless Cooperative (RWC). The Fire Department also has carryover funding<br />
available for the purchase <strong>of</strong> radios that are interoperable with the radios currently used by the<br />
RWC. All remaining carryover will be used to complete equipping fire vehicles with the<br />
necessary apparatus.<br />
Due to the continued drop in secondary assessed valuation, funding for the City Court Building,<br />
which was previously scheduled for completion in FY 20<strong>12</strong>, has been deferred until the last five<br />
years <strong>of</strong> the capital improvement plan, joining Phase II <strong>of</strong> the Western Public Safety Training<br />
Facility.<br />
Project Name: Training Facility Phase II<br />
Funding Source: G.O. Bond<br />
Fund #: 2040<br />
Project #: T5370<br />
345<br />
Return to CIP TOC
FY 20<strong>12</strong> - 2021 Capital Improvement Plan<br />
Fund and Project Summary<br />
2040 - Public Safety Construction Category: 20%<br />
FY 20<strong>12</strong>: FY 2013: FY 2014: FY 2015: FY 2016: FYs 17-21:<br />
Estimated Beginning Balance: $4,683,078 $2,272,052 $2,036,383 $1,954,820 $1,742,609 $1,658,879<br />
Revenue<br />
Bond Proceeds 0 0 0 0 0 98,475,000<br />
Interest Income 5,907 1,728 1,272 555 664 1,659<br />
Intergovernmental Revenue 0 0 0 0 0 11,114,239<br />
Investment Income 187 0 0 0 0 0<br />
Total Revenue:<br />
Operating Expenses<br />
6,094 1,728 1,272 555 664 109,590,898<br />
Advisor Fees 2,000 0 0 0 0 0<br />
Total Operating Expenses:<br />
2,000 0 0 0 0 0<br />
Project Expenses Carryover New Funding<br />
Existing Assets<br />
Improvement <strong>of</strong> Existing Assets<br />
750<strong>12</strong> PS Digital Comm. System<br />
698,539 163,241 237,397 82,835 2<strong>12</strong>,766 84,394 868,309<br />
Replacement <strong>of</strong> Existing Assets<br />
75024 800MHz Comm Equip<br />
1,263,671 0 0 0 0 0 1,937,<strong>12</strong>8<br />
75034 Engine & Ladder Replacement<br />
0 0 0 0 0 0 3,938,255<br />
75036 Replace Utility Truck<br />
76,768 0 0 0 0 0 0<br />
T2520 Infor & Imaging Systems<br />
0 0 0 0 0 0 735,420<br />
T5320 EOC Equipment Replacement<br />
0 0 0 0 0 0 4,800,6<strong>12</strong><br />
T5380 Replace H<strong>az</strong>Mat Vehicle<br />
0 0 0 0 0 0 916,199<br />
T5450 30 Heart Monitors<br />
0 0 0 0 0 0 799,500<br />
T5537 Fire Facility Assessment<br />
0 0 0 0 0 0 768,750<br />
T5539 Replacement <strong>of</strong> Airpacks<br />
0 0 0 0 0 0 1,543,110<br />
Sub-Total - Existing Assets 2,038,978 163,241 237,397 82,835 2<strong>12</strong>,766 84,394 16,307,283<br />
New Assets<br />
75020 City Court Building<br />
0 0 0 0 0 0 43,005,399<br />
75035 Fire Ladder Truck & Tender<br />
2<strong>12</strong>,901 0 0 0 0 0 0<br />
T5370 Training Facility Phase II<br />
0 0 0 0 0 0 38,532,554<br />
T5400 Purchase Type 3 Brush Truck<br />
0 0 0 0 0 0 489,819<br />
T5536 Fire Station - Western Area<br />
0 0 0 0 0 0 <strong>12</strong>,910,118<br />
Sub-Total - New Assets 2<strong>12</strong>,901<br />
0 0 0 0 0 94,937,890<br />
Total Project Expenses:<br />
2,251,879 163,241 237,397 82,835 2<strong>12</strong>,766 84,394 111,245,173<br />
Total FY 20<strong>12</strong> Funding:<br />
2,415,<strong>12</strong>0<br />
Estimated Ending Balance: $2,272,052 $2,036,383 $1,954,820 $1,742,609 $1,658,879 $4,603<br />
*New Project<br />
346<br />
Return to CIP TOC
FY 20<strong>12</strong>-2021 Capital Improvement Plan<br />
Capital Project Expenses Detail<br />
2040 - Public Safety Construction Category: 20%<br />
Project: 750<strong>12</strong> - PS Digital Comm. System (I) Funding Source:<br />
General Obligation Bonds<br />
Project Description:<br />
This project helps fund the <strong>city</strong>'s share <strong>of</strong> membership in the Regional Wireless Cooperative (RWC) digital<br />
communications system (two-way radio). Fees associated with this membership cover the operational and<br />
maintenance costs on a per radio basis as well as special assessment fees. Membership in the RWC provides<br />
for enhanced service, redundancy and increased coverage for all <strong>city</strong> departments. Most importantly,<br />
interoperability not only within <strong>city</strong> departments but also valley wide partners is greatly increased.<br />
Capital Costs: FY 20<strong>12</strong> FY 2013 FY 2014 FY 2015 FY 2016 FYs 17-21<br />
Finance Charges $3,265 $4,748 $1,657 $4,255 $1,688 $19,157<br />
IT/Phone/Security $73,530 $79,775 $81,178 $81,939 $82,706 $429,983<br />
Miscellaneous/Other $86,446 $152,874 $0 $<strong>12</strong>6,572 $0 $419,169<br />
Sub-Total New Funding $163,241 $237,397 $82,835 $2<strong>12</strong>,766 $84,394 $868,309<br />
FY 20<strong>12</strong> Carryover<br />
$698,539 $0 $0 $0 $0 $0<br />
TOTAL $861,780 $237,397 $82,835 $2<strong>12</strong>,766 $84,394 $868,309<br />
Operating Description:<br />
Maintenance costs on hardware/s<strong>of</strong>tware. The costs associated with equipment maintenance includes the<br />
additional fees <strong>of</strong> $<strong>12</strong>5,000 per year (including a 3% inflation rate) for the s<strong>of</strong>tware subscription agreement which<br />
upgrades the actual s<strong>of</strong>tware that operates the handheld and mobile radios and was covered in the past by the<br />
initial warranty and system upgrade. A supplemental <strong>budget</strong> request will be submitted once the project is near<br />
completion.<br />
Operating Costs: FY 20<strong>12</strong> FY 2013 FY 2014 FY 2015 FY 2016 FYs 17-21<br />
Equip. Maint. $0 $0 $0 $0 $0 $1,432,986<br />
TOTAL $0 $0 $0 $0 $0 $1,432,986<br />
Project: 75024 - 800MHz Comm Equip (R) Funding Source:<br />
General Obligation Bonds<br />
Project Description:<br />
Replacement and/or upgrade <strong>of</strong> existing 800 MHz radios for the Regional Wireless Cooperative to ensure the<br />
department continues to meet Federal Communications Commission requirements for Public Safety radio<br />
transmissions as mandated.<br />
Capital Costs: FY 20<strong>12</strong> FY 2013 FY 2014 FY 2015 FY 2016 FYs 17-21<br />
Finance Charges $0 $0 $0 $0 $0 $28,628<br />
Equipment $0 $0 $0 $0 $0 $1,908,500<br />
Sub-Total New Funding $0<br />
$0 $0 $0 $0 $1,937,<strong>12</strong>8<br />
FY 20<strong>12</strong> Carryover<br />
$1,263,671 $0 $0 $0 $0 $0<br />
TOTAL $1,263,671 $0 $0 $0 $0 $1,937,<strong>12</strong>8<br />
Operating Description:<br />
O and M includes network fees <strong>annual</strong>ly at $49 per month, per radio for 275 radios x five years. The department<br />
will submit a supplemental in the future for the additional O and M.<br />
Operating Costs: FY 20<strong>12</strong> FY 2013 FY 2014 FY 2015 FY 2016 FYs 17-21<br />
Supplies/Contr $0 $0 $0 $0 $0 $808,500<br />
TOTAL $0 $0 $0 $0 $0 $808,500<br />
* New Project<br />
N=New Asset, R=Replacement <strong>of</strong> Existing Asset, I=Improvement <strong>of</strong> Existing Asset<br />
347<br />
Return to CIP TOC
FY 20<strong>12</strong>-2021 Capital Improvement Plan<br />
Capital Project Expenses Detail<br />
2040 - Public Safety Construction Category: 20%<br />
Project: 75034 - Engine & Ladder Replacement (R) Funding Source:<br />
General Obligation Bonds<br />
Project Description:<br />
To maximize the safe use <strong>of</strong> Emergency Code 3 Apparatus the fire department's replacement plan indicates that<br />
front line engines be replaced at seven years or 100,000 miles and be moved into a reserve status. Ladder<br />
trucks after 15 years or 100,000 miles. The department will maintain a reserve fleet <strong>of</strong> one reserve truck for every<br />
two front line. This CIP request is for a continuous plan for replacement <strong>of</strong> the department's Code 3 Apparatus in<br />
an effort to be compliant with the National Fire Protection Association Standards for emergency apparatus.<br />
Capital Costs: FY 20<strong>12</strong> FY 2013 FY 2014 FY 2015 FY 2016 FYs 17-21<br />
Finance Charges $0 $0 $0 $0 $0 $96,055<br />
Equipment $0 $0 $0 $0 $0 $3,842,200<br />
TOTAL $0 $0 $0 $0 $0 $3,938,255<br />
Operating Description:<br />
No additional O and M is needed since this is the replacement <strong>of</strong> existing equipment.<br />
Project: 75036 - Replace Utility Truck (R) Funding Source:<br />
General Obligation Bonds<br />
Project Description:<br />
Replacement <strong>of</strong> a nine year old utility truck. This is a specialized vehicle used in the fire service primarily for: 1)<br />
exterior lighting tower; 2) mobile fresh breathing air station; 3) mobile rehabilitation and re-hydration unit; 4)<br />
electri<strong>city</strong> for fans and lights inside buildings. This vehicle is used for the delivery <strong>of</strong> electric power, both for<br />
exterior lighting needs and interior electrical needs, on fire and emergency calls. It is also used to refill<br />
firefighter's self-contained breathing apparatus on all calls requiring self-contained air use, and also provides for<br />
firefighter rehabilitation and re-hydration on all events that require administration <strong>of</strong> water and fluids to sustain<br />
firefighters.<br />
Capital Costs: FY 20<strong>12</strong> FY 2013 FY 2014 FY 2015 FY 2016 FYs 17-21<br />
FY 20<strong>12</strong> Carryover<br />
$76,768 $0 $0 $0 $0 $0<br />
TOTAL $76,768 $0 $0 $0 $0 $0<br />
Operating Description:<br />
No additional O and M is need for this project.<br />
Project: T2520 - Infor & Imaging Systems (R) Funding Source:<br />
General Obligation Bonds<br />
Project Description:<br />
This project will replace the digital system utilized for crime scene documentation and other digital<br />
documentation.<br />
Capital Costs: FY 20<strong>12</strong> FY 2013 FY 2014 FY 2015 FY 2016 FYs 17-21<br />
Finance Charges $0 $0 $0 $0 $0 $14,420<br />
Equipment $0 $0 $0 $0 $0 $721,000<br />
TOTAL $0 $0 $0 $0 $0 $735,420<br />
Operating Description:<br />
This project will entail establishing a maintenance agreement with a vendor to provide updated s<strong>of</strong>tware,<br />
hardware and IT technical support on a contract basis for several years. A supplemental <strong>budget</strong> request will be<br />
submitted once the project is near completion.<br />
Operating Costs: FY 20<strong>12</strong> FY 2013 FY 2014 FY 2015 FY 2016 FYs 17-21<br />
Equip. Maint. $0 $0 $0 $0 $0 $309,000<br />
TOTAL $0 $0 $0 $0 $0 $309,000<br />
* New Project<br />
N=New Asset, R=Replacement <strong>of</strong> Existing Asset, I=Improvement <strong>of</strong> Existing Asset<br />
348<br />
Return to CIP TOC
FY 20<strong>12</strong>-2021 Capital Improvement Plan<br />
Capital Project Expenses Detail<br />
2040 - Public Safety Construction Category: 20%<br />
Project: T5320 - EOC Equipment Replacement (R) Funding Source:<br />
General Obligation Bonds<br />
Project Description:<br />
The <strong>city</strong>'s Hirsch Security System, Blackberry Enterprise Service, <strong>city</strong>'s Geographical Information Systems (GIS),<br />
Regional Training Center Wireless Access Control System, Emergency Management System S<strong>of</strong>tware,<br />
Emergency Operations Center (EOC) Interoperable Communications System, Fire Department Meeting Room<br />
Management (MRM) Systems, Weather System, and Public Safety Critical Infrastructure Protection System all<br />
reside on the EOC servers and equipment. This project will fund the replacement <strong>of</strong> telecommunication,<br />
audio/visual, computer infrastructure, data storage, radios and other equipment in the <strong>city</strong> EOC that will enable<br />
the continued operation <strong>of</strong> these and future technology based systems.<br />
Capital Costs: FY 20<strong>12</strong> FY 2013 FY 2014 FY 2015 FY 2016 FYs 17-21<br />
Finance Charges $0 $0 $0 $0 $0 $94,130<br />
IT/Phone/Security $0 $0 $0 $0 $0 $4,706,482<br />
TOTAL $0 $0 $0 $0 $0 $4,800,6<strong>12</strong><br />
Operating Description:<br />
This project will replace existing equipment and systems at the EOC. This equipment will be placed in the<br />
Technology Replacement Fund at a cost <strong>of</strong> $1,176,620 <strong>annual</strong>ly, or $4,706,482 over the four year replacement<br />
cycle. The equipment replaced includes 117 computers and associated s<strong>of</strong>tware; <strong>12</strong>3-17" monitors; 32 radios<br />
(UHF/VHF/800 MHz) and antennae; 72 headsets; 11-52" LCD monitors; 10-40" LCD monitors; 21-20" LCD<br />
monitors; 36 servers associated s<strong>of</strong>tware and equipment racks; 57 video servers associated s<strong>of</strong>tware and<br />
equipment racks; 15 network switches; 3 routers; <strong>12</strong>-67" video cubes associated controllers and s<strong>of</strong>tware; 7 dual<br />
zone net clocks; video teleconferencing systems; 4 sound systems and microphones; 3 weather stations; the<br />
data storage system; wireless control access system; 5 Wi-Fi touch panel control devices; the security system;<br />
the emergency management s<strong>of</strong>tware; the EOC radio interoperability system; video surveillance system<br />
including 6 control points; and the structured cabling to support all <strong>of</strong> these systems. A supplemental <strong>budget</strong><br />
request will be submitted once the project is near completion.<br />
Operating Costs: FY 20<strong>12</strong> FY 2013 FY 2014 FY 2015 FY 2016 FYs 17-21<br />
PC/Vehicle Replacement $0 $0 $0 $0 $0 $4,706,482<br />
TOTAL $0 $0 $0 $0 $0 $4,706,482<br />
Project: T5380 - Replace H<strong>az</strong>Mat Vehicle (R) Funding Source:<br />
General Obligation Bonds<br />
Project Description:<br />
Replacement <strong>of</strong> a H<strong>az</strong>Mat vehicle for the h<strong>az</strong>ardous materials team. The current truck will have served its useful<br />
life <strong>of</strong> 10 years in FY 2019.<br />
Capital Costs: FY 20<strong>12</strong> FY 2013 FY 2014 FY 2015 FY 2016 FYs 17-21<br />
Finance Charges $0 $0 $0 $0 $0 $13,540<br />
Equipment $0 $0 $0 $0 $0 $902,659<br />
TOTAL $0 $0 $0 $0 $0 $916,199<br />
Operating Description:<br />
No additional O and M is needed since the H<strong>az</strong>mat truck will be replacing the current vehicle.<br />
* New Project<br />
N=New Asset, R=Replacement <strong>of</strong> Existing Asset, I=Improvement <strong>of</strong> Existing Asset<br />
349<br />
Return to CIP TOC
FY 20<strong>12</strong>-2021 Capital Improvement Plan<br />
Capital Project Expenses Detail<br />
2040 - Public Safety Construction Category: 20%<br />
Project: T5450 - 30 Heart Monitors (R) Funding Source:<br />
General Obligation Bonds<br />
Project Description:<br />
Purchase <strong>of</strong> 30 cardiac monitors. The life span is difficult to gauge as wear and tear is a factor that plays into<br />
how long these units last. These monitors are used multiple times daily. Emergency medical incidents account<br />
for 80% <strong>of</strong> all calls for service. New technology also plays a part in how long we can continue to use older<br />
equipment. Currently, the department’s heart monitors are adequate through FY 2017, at which time they are<br />
expected to reach the end <strong>of</strong> their useful life. Heart monitors are considered a capital expenditure due to the type<br />
<strong>of</strong> equipment requiring to be updated all at the same time; which cannot be phased in when replaced. Personnel<br />
must all be able to train and work on the same type, make and model <strong>of</strong> equipment. The department will<br />
continue to seek alternative funding mechanisms such as grants as they become available.<br />
Capital Costs: FY 20<strong>12</strong> FY 2013 FY 2014 FY 2015 FY 2016 FYs 17-21<br />
Finance Charges $0 $0 $0 $0 $0 $19,500<br />
Equipment $0 $0 $0 $0 $0 $780,000<br />
TOTAL $0 $0 $0 $0 $0 $799,500<br />
Operating Description:<br />
O and M for the heart monitors would be needed starting in FY 2019. O and M includes the ongoing <strong>annual</strong><br />
maintenance cost <strong>of</strong> $20,000 for all units and two batteries a year ($200 per battery) for each unit. O and M<br />
calculated with 3% inflation per year. A supplemental <strong>budget</strong> request will be submitted once the project is near<br />
completion.<br />
Operating Costs: FY 20<strong>12</strong> FY 2013 FY 2014 FY 2015 FY 2016 FYs 17-21<br />
Equip. Maint. $0 $0 $0 $0 $0 $<strong>12</strong>1,645<br />
TOTAL $0 $0 $0 $0 $0 $<strong>12</strong>1,645<br />
Project: T5537 - Fire Facility Assessment (R) Funding Source:<br />
General Obligation Bonds<br />
Project Description:<br />
A comprehensive facility condition assessment (FCA) for the four Glendale Fire Stations that are over 20 years<br />
old (FS152, FS153, FS154 and FS155). An FCA will provide detailed data to support a capital renewal and<br />
deferred maintenance program. The FCA will assist facility administrators to identi<strong>fy</strong>, estimate and prioritize<br />
existing deferred maintenance and predict capital renewal requirements. Accurate information about the<br />
condition <strong>of</strong> facilities and building systems forms the foundation for ensuring smooth operations today and<br />
planning for future needs.<br />
Capital Costs: FY 20<strong>12</strong> FY 2013 FY 2014 FY 2015 FY 2016 FYs 17-21<br />
Finance Charges $0 $0 $0 $0 $0 $18,750<br />
Miscellaneous/Other $0 $0 $0 $0 $0 $750,000<br />
TOTAL $0 $0 $0 $0 $0 $768,750<br />
Operating Description:<br />
No additional O and M is needed.<br />
* New Project<br />
N=New Asset, R=Replacement <strong>of</strong> Existing Asset, I=Improvement <strong>of</strong> Existing Asset<br />
350<br />
Return to CIP TOC
FY 20<strong>12</strong>-2021 Capital Improvement Plan<br />
Capital Project Expenses Detail<br />
2040 - Public Safety Construction Category: 20%<br />
Project: T5539 - Replacement <strong>of</strong> Airpacks (R) Funding Source:<br />
General Obligation Bonds<br />
Project Description:<br />
Replacement <strong>of</strong> self-contained breathing apparatus (SCBAs) or air packs. The current supply is in compliance<br />
with National Fire Protection Association Standards through FY 2017. In FY 2017, 150 air packs will be outdated<br />
and in need <strong>of</strong> replacement. The useful life span <strong>of</strong> SCBAs is 7-10 years. Airpacks are considered a capital<br />
expenditure due to the type <strong>of</strong> equipment requiring to be updated all at the same time; which cannot be phased<br />
in when replaced. Personnel must all be able to train and work on the same type, make and model <strong>of</strong> equipment.<br />
The department will continue to seek alternative funding mechanisms such as grants as they become available.<br />
Capital Costs: FY 20<strong>12</strong> FY 2013 FY 2014 FY 2015 FY 2016 FYs 17-21<br />
Finance Charges $0 $0 $0 $0 $0 $37,637<br />
Equipment $0 $0 $0 $0 $0 $1,505,473<br />
TOTAL $0 $0 $0 $0 $0 $1,543,110<br />
Operating Description:<br />
O and M includes maintenance and repair at $25,000 <strong>annual</strong>ly and an additional $36,000 (once every 5 years)<br />
for 2 hydro tests on 300 bottles at $60.00 per bottle that is performed every 5 years. The current SCBA <strong>budget</strong> is<br />
$17,291 and does not cover the O and M identified; an additional $74,545 is necessary. The $25,000 for <strong>annual</strong><br />
maintenance and repair will be needed the year after purchase. A supplemental <strong>budget</strong> request will be submitted<br />
once the project is near completion.<br />
Operating Costs: FY 20<strong>12</strong> FY 2013 FY 2014 FY 2015 FY 2016 FYs 17-21<br />
Supplies/Contr $0 $0 $0 $0 $0 $74,545<br />
TOTAL $0 $0 $0 $0 $0 $74,545<br />
* New Project<br />
N=New Asset, R=Replacement <strong>of</strong> Existing Asset, I=Improvement <strong>of</strong> Existing Asset<br />
351<br />
Return to CIP TOC
FY 20<strong>12</strong>-2021 Capital Improvement Plan<br />
Capital Project Expenses Detail<br />
2040 - Public Safety Construction Category: 20%<br />
Project: 75020 - City Court Building (N) Funding Source:<br />
General Obligation Bonds<br />
Project Description:<br />
Construction will resume on the <strong>city</strong> court building in FY 2017. As <strong>of</strong> the end <strong>of</strong> December 2009, the structure<br />
was built to ground level. When completed the building is expected to be approximately 90,000 net square feet<br />
and include 10 courtrooms. There is the possibility <strong>of</strong> additional costs due to the delay in construction.<br />
Capital Costs: FY 20<strong>12</strong> FY 2013 FY 2014 FY 2015 FY 2016 FYs 17-21<br />
Design $0 $0 $0 $0 $0 $4,742,010<br />
Construction $0 $0 $0 $0 $0 $31,613,404<br />
Finance Charges $0 $0 $0 $0 $0 $791,603<br />
IT/Phone/Security $0 $0 $0 $0 $0 $2,235,868<br />
Engineering Charges $0 $0 $0 $0 $0 $139,968<br />
Arts $0 $0 $0 $0 $0 $316,134<br />
Contingency $0 $0 $0 $0 $0 $3,166,4<strong>12</strong><br />
TOTAL $0 $0 $0 $0 $0 $43,005,399<br />
Operating Description:<br />
O and M would be needed starting in FY 2019 and includes a Building Maintenance Worker, two Custodians, a<br />
Day Porter and three Detention Officers. Other items include, utilities and electri<strong>city</strong>, security, building and<br />
elevator maintenance, parking lot sweeping and custodial supplies. There are $213,800 in one-time expenses in<br />
FY 2019 including one-time purchases <strong>of</strong> vehicles and other essential supplies. The O and M related to opening<br />
the new facility does not include current grant-funded and one-time funded staff and operational costs. These<br />
costs total $577,269. O and M costs for additional court positions will also be needed starting in the year the<br />
building is occupied. A supplemental <strong>budget</strong> request will be submitted once the project is near completion.<br />
Operating Costs: FY 20<strong>12</strong> FY 2013 FY 2014 FY 2015 FY 2016 FYs 17-21<br />
Staffing $0 $0 $0 $0 $0 $1,453,002<br />
Supplies/Contr $0 $0 $0 $0 $0 $693,971<br />
Utilities $0 $0 $0 $0 $0 $184,533<br />
Bldg. Maint. $0 $0 $0 $0 $0 $250,966<br />
Equip. Maint. $0 $0 $0 $0 $0 $47,056<br />
Insurance $0 $0 $0 $0 $0 $51,671<br />
Electrical $0 $0 $0 $0 $0 $1,107,210<br />
PC/Vehicle Replacement $0 $0 $0 $0 $0 $18,684<br />
Landscape $0 $0 $0 $0 $0 $27,426<br />
Water $0 $0 $0 $0 $0 $38,579<br />
Refuse $0 $0 $0 $0 $0 $22,492<br />
TOTAL $0 $0 $0 $0 $0 $3,895,590<br />
Project: 75035 - Fire Ladder Truck & Tender (N) Funding Source:<br />
General Obligation Bonds<br />
Project Description:<br />
1 fully equipped ladder truck and ladder tender vehicle. Furnishings to accommodate additional ladder company<br />
in existing station. Over 50% <strong>of</strong> structure fires occur in central Glendale which has numerous multi-residential<br />
structures and contains the <strong>city</strong>'s industrial area. Based on current growth, call volume and demand for the<br />
ladder services this equipment and company will be located at FS151.<br />
Capital Costs: FY 20<strong>12</strong> FY 2013 FY 2014 FY 2015 FY 2016 FYs 17-21<br />
FY 20<strong>12</strong> Carryover<br />
$2<strong>12</strong>,901 $0 $0 $0 $0 $0<br />
TOTAL $2<strong>12</strong>,901 $0 $0 $0 $0 $0<br />
Operating Description:<br />
No additional O and M is needed.<br />
* New Project<br />
N=New Asset, R=Replacement <strong>of</strong> Existing Asset, I=Improvement <strong>of</strong> Existing Asset<br />
352<br />
Return to CIP TOC
FY 20<strong>12</strong>-2021 Capital Improvement Plan<br />
Capital Project Expenses Detail<br />
2040 - Public Safety Construction Category: 20%<br />
Project: T5370 - Training Facility Phase II (N) Funding Source:<br />
General Obligation Bonds<br />
Project Description:<br />
Phase II <strong>of</strong> the Glendale Regional Public Safety Training Center will include shared site improvements such as<br />
landscaping, street lighting, earthwork, utility modifications, retaining walls, parking lots, etc. Shared buildings for<br />
police and fire will include classrooms, administrative <strong>of</strong>fices, break room, lockers, showers and a maintenance<br />
and tire shop. Police specific buildings and props will include a shoot house, rubberized running track and an<br />
obstacle course. Fire specific building and props will include a mock strip mall, single family house, big box store,<br />
semi-truck prop and additional natural gas burn props. The Phase II cost estimate were provided by LEA<br />
Architects, LLC and was last revised on 02/05/2008.<br />
Capital Costs: FY 20<strong>12</strong> FY 2013 FY 2014 FY 2015 FY 2016 FYs 17-21<br />
Design $0 $0 $0 $0 $0 $2,937,655<br />
Construction $0 $0 $0 $0 $0 $29,376,550<br />
Finance Charges $0 $0 $0 $0 $0 $961,520<br />
IT/Phone/Security $0 $0 $0 $0 $0 $15,<strong>12</strong>3<br />
Engineering Charges $0 $0 $0 $0 $0 $<strong>12</strong>4,410<br />
Arts $0 $0 $0 $0 $0 $293,766<br />
Equipment $0 $0 $0 $0 $0 $587,531<br />
Contingency $0 $0 $0 $0 $0 $3,501,585<br />
Miscellaneous/Other $0 $0 $0 $0 $0 $734,414<br />
TOTAL $0 $0 $0 $0 $0 $38,532,554<br />
Operating Description:<br />
Additional O and M would be needed starting in December 2019. Staffing includes salaries and benefits for 1<br />
Battalion Chief, 2 Captains, 1 Secretary, 1 Records Technician and 1 Custodian. No additional staffing is needed<br />
for police. Equipment maintenance is $439,392 <strong>annual</strong>ly; PD vehicle O and M $17,530, (Per year costs PD<br />
Training Equip. $88,860 - one time, workstations $17,877one time, PD training equipment and supplies<br />
$<strong>12</strong>9,139, PD tuition and lab fees $2,595 x 100, FD items $14,000). Supplies and contracts also includes a three<br />
year maintenance contract at $72,000 for driving simulator. Utilities includes an estimate received from architect.<br />
Building maintenance 99,515 sq ft x $0.35. Landscape maintenance and water usage is calculated at 10 acres<br />
(438,600 x 0.22 per sq ft); building water usage 99,515 sq ft x 0.195; and refuse is calculated using two 6 yard<br />
containers on site with pick up three days per week ($341.26 x <strong>12</strong>). A supplemental <strong>budget</strong> request will be<br />
submitted once the project is near completion.<br />
Operating Costs: FY 20<strong>12</strong> FY 2013 FY 2014 FY 2015 FY 2016 FYs 17-21<br />
Staffing $0 $0 $0 $0 $0 $860,678<br />
Supplies/Contr $0 $0 $0 $0 $0 $268,807<br />
Utilities $0 $0 $0 $0 $0 $172,874<br />
Bldg. Maint. $0 $0 $0 $0 $0 $71,183<br />
Equip. Maint. $0 $0 $0 $0 $0 $708,886<br />
Insurance $0 $0 $0 $0 $0 $26,781<br />
PC/Vehicle Replacement $0 $0 $0 $0 $0 $71,771<br />
Landscape $0 $0 $0 $0 $0 $195,854<br />
Water $0 $0 $0 $0 $0 $39,659<br />
Refuse $0 $0 $0 $0 $0 $8,369<br />
TOTAL $0 $0 $0 $0 $0 $2,424,862<br />
* New Project<br />
N=New Asset, R=Replacement <strong>of</strong> Existing Asset, I=Improvement <strong>of</strong> Existing Asset<br />
353<br />
Return to CIP TOC
FY 20<strong>12</strong>-2021 Capital Improvement Plan<br />
Capital Project Expenses Detail<br />
2040 - Public Safety Construction Category: 20%<br />
Project: T5400 - Purchase Type 3 Brush Truck (N) Funding Source:<br />
General Obligation Bonds<br />
Project Description:<br />
Purchase a Type 3 brush truck vehicle. Thunderbird Park, the Agua Fria and Skunk Creek create <strong>of</strong>f-road<br />
firefighting equipment needs. This type <strong>of</strong> vehicle provides fire suppression <strong>of</strong>f-road when dealing with brush<br />
fires requiring a specialized 4-wheel drive or a "brush truck" unit.<br />
Capital Costs: FY 20<strong>12</strong> FY 2013 FY 2014 FY 2015 FY 2016 FYs 17-21<br />
Finance Charges $0 $0 $0 $0 $0 $7,239<br />
Equipment $0 $0 $0 $0 $0 $482,580<br />
TOTAL $0 $0 $0 $0 $0 $489,819<br />
Operating Description:<br />
O and M includes shop and fuel <strong>of</strong> $7,000 <strong>annual</strong>ly and radio fees at $49 per month <strong>annual</strong>ly. Vehicle<br />
Replacement Funds were not included as this piece <strong>of</strong> apparatus will be replaced as needed through future CIP<br />
projects. A supplemental <strong>budget</strong> request will be submitted once the project is near completion.<br />
Operating Costs: FY 20<strong>12</strong> FY 2013 FY 2014 FY 2015 FY 2016 FYs 17-21<br />
Equip. Maint. $0 $0 $0 $0 $0 $7,588<br />
TOTAL $0 $0 $0 $0 $0 $7,588<br />
* New Project<br />
N=New Asset, R=Replacement <strong>of</strong> Existing Asset, I=Improvement <strong>of</strong> Existing Asset<br />
354<br />
Return to CIP TOC
FY 20<strong>12</strong>-2021 Capital Improvement Plan<br />
Capital Project Expenses Detail<br />
2040 - Public Safety Construction Category: 20%<br />
Project: T5536 - Fire Station - Western Area (N) Funding Source:<br />
General Obligation Bonds<br />
Project Description:<br />
Design and construction <strong>of</strong> a 15,000 sq ft, four bay fire station, with firefighter quarters for 18 personnel, furniture,<br />
fixtures, equipment, <strong>of</strong>fice space and storage. Equipment includes one engine. This facility will respond to the<br />
surrounding areas between Northern Avenue and Camelback Road and 83rd to 115th Avenues. This fire station<br />
would house a fire pumper 24/7 initially, with further expansion <strong>of</strong> ladders and medic units as growth demands.<br />
Formally referred to as Fire Station - 99th and Maryland.<br />
Capital Costs: FY 20<strong>12</strong> FY 2013 FY 2014 FY 2015 FY 2016 FYs 17-21<br />
Land $0 $0 $0 $0 $0 $2,395,800<br />
Design $0 $0 $0 $0 $0 $2,613,000<br />
Construction $0 $0 $0 $0 $0 $4,020,000<br />
Finance Charges $0 $0 $0 $0 $0 $365,803<br />
IT/Phone/Security $0 $0 $0 $0 $0 $156,000<br />
Engineering Charges $0 $0 $0 $0 $0 $92,500<br />
Arts $0 $0 $0 $0 $0 $40,200<br />
Equipment $0 $0 $0 $0 $0 $1,601,040<br />
Contingency $0 $0 $0 $0 $0 $1,625,775<br />
TOTAL $0 $0 $0 $0 $0 $<strong>12</strong>,910,118<br />
Operating Description:<br />
Additional O and M would be needed starting in March <strong>of</strong> 2019. Staffing includes the salary and benefits for <strong>12</strong><br />
Firefighters, 3 Captains, 3 Engineers and .5 FTE Building Maintenance Worker. Also includes promotions,<br />
training, medic pay, station supplies, station and equipment maintenance, telephone charges, grounds<br />
maintenance, insurance and one-time cost in the amount <strong>of</strong> $486,895 to recruit, test, hire and to send 18<br />
firefighters to the training academy and six to medic school. Utilities, building maintenance, supplies and<br />
custodial services for 15,000 sq ft <strong>of</strong> space. PC replacement contributions for network replacement at $1,600<br />
and PC and printer replacement = $3,753. Landscaping estimated at $0.22 per sq ft. Water estimated at $0.195<br />
per sq ft. Refuse estimated at $342.26 x <strong>12</strong> months. A supplemental <strong>budget</strong> request will be submitted once the<br />
project is near completion.<br />
Operating Costs: FY 20<strong>12</strong> FY 2013 FY 2014 FY 2015 FY 2016 FYs 17-21<br />
Staffing $0 $0 $0 $0 $0 $3,844,622<br />
Supplies/Contr $0 $0 $0 $0 $0 $697,886<br />
Utilities $0 $0 $0 $0 $0 $146,398<br />
Bldg. Maint. $0 $0 $0 $0 $0 $434,875<br />
Equip. Maint. $0 $0 $0 $0 $0 $57,327<br />
Insurance $0 $0 $0 $0 $0 $36,165<br />
Electrical $0 $0 $0 $0 $0 $72,695<br />
PC/Vehicle Replacement $0 $0 $0 $0 $0 $15,411<br />
Landscape $0 $0 $0 $0 $0 $9,501<br />
Water $0 $0 $0 $0 $0 $8,421<br />
Refuse $0 $0 $0 $0 $0 $11,824<br />
TOTAL $0 $0 $0 $0 $0 $5,335,<strong>12</strong>5<br />
* New Project<br />
N=New Asset, R=Replacement <strong>of</strong> Existing Asset, I=Improvement <strong>of</strong> Existing Asset<br />
355<br />
Return to CIP TOC
20<strong>12</strong>-2021 CAPITAL IMPROVEMENT PLAN<br />
Government Facilities - Construction Fund<br />
GOVERNMENT FACILITIES<br />
CONSTRUCTION FUND<br />
Carryover in FY 20<strong>12</strong> is available for the completion <strong>of</strong> the sales tax and license system<br />
replacement project and the repair, maintenance and/or replacement <strong>of</strong> ro<strong>of</strong>ing, electrical/<br />
lighting and mechanical systems. The Government Facility Construction Fund will not receive<br />
new funding until the last five years <strong>of</strong> the capital improvement plan due to the continued decline<br />
in secondary assessed valuation.<br />
Project Name: City Hall Parking Garage<br />
Funding Source: G.O. Bond<br />
Fund #: 2080<br />
Project #: T1160<br />
356<br />
Return to CIP TOC
FY 20<strong>12</strong> - 2021 Capital Improvement Plan<br />
Fund and Project Summary<br />
2080 - Government Facilities Construction Category: 6%<br />
FY 20<strong>12</strong>: FY 2013: FY 2014: FY 2015: FY 2016: FYs 17-21:<br />
Estimated Beginning Balance: $1,132,337 $0 $0 $0 $0 $0<br />
Revenue<br />
Bond Proceeds 0 0 0 0 0 16,135,000<br />
Interest Income 1,092 0 0 0 0 0<br />
Investment Income 8 0 0 0 0 0<br />
Total Revenue:<br />
Operating Expenses<br />
1,100 0 0 0 0 16,135,000<br />
Advisor Fees 2,000 0 0 0 0 0<br />
Total Operating Expenses:<br />
2,000 0 0 0 0 0<br />
Project Expenses Carryover New Funding<br />
Existing Assets<br />
Replacement <strong>of</strong> Existing Assets<br />
77503 Exterior Closure (Ro<strong>of</strong>ing)<br />
709,659 0 0 0 0 0 921,858<br />
77504 City Hall - HVAC System<br />
0 0 0 0 0 0 5,432,824<br />
77507 Interior Finishes (Flooring)<br />
0 0 0 0 0 0 1,966,111<br />
77508 Interior Finishes (Paint)<br />
0 0 0 0 0 0 1,051,101<br />
77509 Mechanical Upgrades<br />
2<strong>12</strong>,149 0 0 0 0 0 2,315,858<br />
77510 Electrical/Lighting Upgrades<br />
93,965 0 0 0 0 0 1,276,474<br />
775<strong>12</strong> Exterior Closure (Paint)<br />
0 0 0 0 0 0 1,114,471<br />
77513 Sales Tax System<br />
27,363 0 0 0 0 0 0<br />
77514 Civic Ctr Storage Fac Repair<br />
88,301 0 0 0 0 0 0<br />
T1160 City Hall Parking Garage<br />
0 0 0 0 0 0 1,831,799<br />
T4730 Fuel Sites Equipment Upgrade<br />
0 0 0 0 0 0 223,193<br />
Sub-Total - Existing Assets 1,131,437<br />
0 0 0 0 0 16,133,689<br />
Total Project Expenses:<br />
1,131,437 0 0 0 0 0 16,133,689<br />
Total FY 20<strong>12</strong> Funding:<br />
1,131,437<br />
Estimated Ending Balance: $0 $0 $0 $0 $0 $1,311<br />
*New Project<br />
357<br />
Return to CIP TOC
FY 20<strong>12</strong>-2021 Capital Improvement Plan<br />
Capital Project Expenses Detail<br />
2080 - Government Facilities Construction Category: 6%<br />
Project: 77503 - Exterior Closure (Ro<strong>of</strong>ing) (R) Funding Source:<br />
General Obligation Bonds<br />
Project Description:<br />
Citywide ro<strong>of</strong>ing upgrades will require a total <strong>of</strong> $921,858 in FY 2017 to improve the condition <strong>of</strong> several facilities<br />
and extend the useful life <strong>of</strong> the infrastructure. There will be over 80 different ro<strong>of</strong>ing-related projects needed on<br />
all <strong>city</strong> buildings over a 10 year period.<br />
Capital Costs: FY 20<strong>12</strong> FY 2013 FY 2014 FY 2015 FY 2016 FYs 17-21<br />
Design $0 $0 $0 $0 $0 $16,913<br />
Finance Charges $0 $0 $0 $0 $0 $16,913<br />
Engineering Charges $0 $0 $0 $0 $0 $7,370<br />
Equipment $0 $0 $0 $0 $0 $808,666<br />
Contingency $0 $0 $0 $0 $0 $71,996<br />
Sub-Total New Funding $0<br />
$0 $0 $0 $0 $921,858<br />
FY 20<strong>12</strong> Carryover<br />
$709,659 $0 $0 $0 $0 $0<br />
TOTAL $709,659 $0 $0 $0 $0 $921,858<br />
Operating Description:<br />
No additional O and M is need for this project.<br />
Project: 77504 - City Hall - HVAC System (R) Funding Source:<br />
General Obligation Bonds<br />
Project Description:<br />
The existing heating, ventilating and air conditioning (HVAC) system at Glendale City Hall is projected to reach<br />
its capa<strong>city</strong> with the future occupancy and use <strong>of</strong> the building, which will exceed the original design in the next 10<br />
years. These replacements and upgrades will improve indoor air quality and provide a new HVAC system life<br />
capa<strong>city</strong> <strong>of</strong> an additional 20+ years.<br />
Capital Costs: FY 20<strong>12</strong> FY 2013 FY 2014 FY 2015 FY 2016 FYs 17-21<br />
Design $0 $0 $0 $0 $0 $75,000<br />
Construction $0 $0 $0 $0 $0 $1,346,000<br />
Finance Charges $0 $0 $0 $0 $0 $<strong>12</strong>3,487<br />
Engineering Charges $0 $0 $0 $0 $0 $43,000<br />
Arts $0 $0 $0 $0 $0 $13,460<br />
Equipment $0 $0 $0 $0 $0 $3,429,446<br />
Contingency $0 $0 $0 $0 $0 $402,431<br />
TOTAL $0 $0 $0 $0 $0 $5,432,824<br />
Operating Description:<br />
No additional O and M is needed at this time.<br />
* New Project<br />
N=New Asset, R=Replacement <strong>of</strong> Existing Asset, I=Improvement <strong>of</strong> Existing Asset<br />
358<br />
Return to CIP TOC
FY 20<strong>12</strong>-2021 Capital Improvement Plan<br />
Capital Project Expenses Detail<br />
2080 - Government Facilities Construction Category: 6%<br />
Project: 77507 - Interior Finishes (Flooring) (R) Funding Source:<br />
General Obligation Bonds<br />
Project Description:<br />
Make <strong>city</strong>wide interior flooring replacements and upgrades that would require a total <strong>of</strong> $1,966,111 over a ten<br />
year period to improve the condition age <strong>of</strong> several facilities and extend the useful life <strong>of</strong> the infrastructure. There<br />
will be a total <strong>of</strong> approximately 100 different flooring related projects completed on all <strong>city</strong> buildings over the 10-<br />
year period.<br />
Capital Costs: FY 20<strong>12</strong> FY 2013 FY 2014 FY 2015 FY 2016 FYs 17-21<br />
Design $0 $0 $0 $0 $0 $39,826<br />
Finance Charges $0 $0 $0 $0 $0 $39,826<br />
Engineering Charges $0 $0 $0 $0 $0 $2,000<br />
Equipment $0 $0 $0 $0 $0 $1,741,030<br />
Contingency $0 $0 $0 $0 $0 $143,429<br />
TOTAL $0 $0 $0 $0 $0 $1,966,111<br />
Operating Description:<br />
No additional O and M is need for this project.<br />
Project: 77508 - Interior Finishes (Paint) (R) Funding Source:<br />
General Obligation Bonds<br />
Project Description:<br />
Make <strong>city</strong>wide interior paint and wall covering replacements and upgrades that would require a total <strong>of</strong><br />
$1,051,101 over a 10-year period to improve the condition <strong>of</strong> several facilities and extend the useful life <strong>of</strong> the<br />
infrastructure. There are over 142 paint/wall covering related projects needed on all <strong>city</strong> buildings.<br />
Capital Costs: FY 20<strong>12</strong> FY 2013 FY 2014 FY 2015 FY 2016 FYs 17-21<br />
Design $0 $0 $0 $0 $0 $25,048<br />
Finance Charges $0 $0 $0 $0 $0 $25,048<br />
Engineering Charges $0 $0 $0 $0 $0 $9,900<br />
Equipment $0 $0 $0 $0 $0 $991,105<br />
TOTAL $0 $0 $0 $0 $0 $1,051,101<br />
Operating Description:<br />
No additional O and M is need for this project.<br />
* New Project<br />
N=New Asset, R=Replacement <strong>of</strong> Existing Asset, I=Improvement <strong>of</strong> Existing Asset<br />
359<br />
Return to CIP TOC
FY 20<strong>12</strong>-2021 Capital Improvement Plan<br />
Capital Project Expenses Detail<br />
2080 - Government Facilities Construction Category: 6%<br />
Project: 77509 - Mechanical Upgrades (R) Funding Source:<br />
General Obligation Bonds<br />
Project Description:<br />
Citywide mechanical replacement and upgrades would require a total <strong>of</strong> $2,315,858 to improve the mechanical<br />
systems <strong>of</strong> several facilities, as well as extend the useful life <strong>of</strong> the infrastructure. There will be a total <strong>of</strong> nine<br />
heating, ventilating, and air conditioning (HVAC) mechanical related projects completed on different <strong>city</strong><br />
buildings. Major projects include: replacing all the HVAC equipment and adding capa<strong>city</strong> to cool the data center<br />
for the entire <strong>city</strong> located at the Public Safety Building, replacing the cooling tower drive motor at the Main<br />
Library, replacing the heat pumps at Fire Station 154 and renovating the mechanical systems at the Operations<br />
Center.<br />
Capital Costs: FY 20<strong>12</strong> FY 2013 FY 2014 FY 2015 FY 2016 FYs 17-21<br />
Design $0 $0 $0 $0 $0 $21,233<br />
Finance Charges $0 $0 $0 $0 $0 $21,233<br />
Engineering Charges $0 $0 $0 $0 $0 $11,000<br />
Equipment $0 $0 $0 $0 $0 $2,084,049<br />
Contingency $0 $0 $0 $0 $0 $178,343<br />
Sub-Total New Funding $0<br />
$0 $0 $0 $0 $2,315,858<br />
FY 20<strong>12</strong> Carryover<br />
$2<strong>12</strong>,149 $0 $0 $0 $0 $0<br />
TOTAL $2<strong>12</strong>,149 $0 $0 $0 $0 $2,315,858<br />
Operating Description:<br />
No additional O and M is need for this project.<br />
Project: 77510 - Electrical/Lighting Upgrades (R) Funding Source:<br />
General Obligation Bonds<br />
Project Description:<br />
The replacement and upgrade <strong>of</strong> lighting and electrical systems in <strong>city</strong> buildings is estimated to cost a total <strong>of</strong><br />
$1,276,474 over several years. These upgrades are expected to reduce the consumption <strong>of</strong> electri<strong>city</strong> usage<br />
<strong>city</strong>wide, with an anticipated return on investment savings in less than three years. Improvements are needed for<br />
the O'Neil and Rose Lane community center recreation buildings, Fire Stations 152, 153, 154 and 155; and the<br />
Apollo, Glendale and Cactus pool buildings. This project will include the replacement <strong>of</strong> old coil and core light<br />
fixture ballasts with energy efficient electronic ones and the replacement <strong>of</strong> the fluorescent lamps with higher<br />
efficient ones.<br />
Capital Costs: FY 20<strong>12</strong> FY 2013 FY 2014 FY 2015 FY 2016 FYs 17-21<br />
Design $0 $0 $0 $0 $0 $32,1<strong>12</strong><br />
Finance Charges $0 $0 $0 $0 $0 $32,1<strong>12</strong><br />
Engineering Charges $0 $0 $0 $0 $0 $11,000<br />
Equipment $0 $0 $0 $0 $0 $1,095,742<br />
Contingency $0 $0 $0 $0 $0 $105,508<br />
Sub-Total New Funding $0<br />
$0 $0 $0 $0 $1,276,474<br />
FY 20<strong>12</strong> Carryover<br />
$93,965 $0 $0 $0 $0 $0<br />
TOTAL $93,965 $0 $0 $0 $0 $1,276,474<br />
Operating Description:<br />
No additional O and M is need for this project.<br />
* New Project<br />
N=New Asset, R=Replacement <strong>of</strong> Existing Asset, I=Improvement <strong>of</strong> Existing Asset<br />
360<br />
Return to CIP TOC
FY 20<strong>12</strong>-2021 Capital Improvement Plan<br />
Capital Project Expenses Detail<br />
2080 - Government Facilities Construction Category: 6%<br />
Project: 775<strong>12</strong> - Exterior Closure (Paint) (R) Funding Source:<br />
General Obligation Bonds<br />
Project Description:<br />
Citywide painting related replacements and upgrades that would require a total <strong>of</strong> $1,114,471 over a several<br />
year period to improve the condition <strong>of</strong> several facilities and extend the useful life <strong>of</strong> the infrastructure.<br />
Capital Costs: FY 20<strong>12</strong> FY 2013 FY 2014 FY 2015 FY 2016 FYs 17-21<br />
Design $0 $0 $0 $0 $0 $17,067<br />
Finance Charges $0 $0 $0 $0 $0 $17,067<br />
Engineering Charges $0 $0 $0 $0 $0 $6,050<br />
Equipment $0 $0 $0 $0 $0 $988,924<br />
Contingency $0 $0 $0 $0 $0 $85,363<br />
TOTAL $0 $0 $0 $0 $0 $1,114,471<br />
Operating Description:<br />
No additional O and M is need for this project.<br />
Project: 77513 - Sales Tax System (R) Funding Source:<br />
General Obligation Bonds<br />
Project Description:<br />
Purchase <strong>of</strong> a new s<strong>of</strong>tware application system which tracks revenue for the <strong>city</strong>. The system being replaced is<br />
20+ years old and runs on hardware and operating systems which are no longer cost effective to support. This is<br />
the Fund 2080 portion <strong>of</strong> the project.<br />
Capital Costs: FY 20<strong>12</strong> FY 2013 FY 2014 FY 2015 FY 2016 FYs 17-21<br />
FY 20<strong>12</strong> Carryover<br />
$27,363 $0 $0 $0 $0 $0<br />
TOTAL $27,363 $0 $0 $0 $0 $0<br />
Operating Description:<br />
Refer to PAYGO Project No. 1000-81055 for O and M impact.<br />
Project: 77514 - Civic Ctr Storage Fac Repair (R) Funding Source:<br />
General Obligation Bonds<br />
Project Description:<br />
This project will provide necessary repairs and restoration to the Civic Center storage facility. Damages were<br />
caused by a leaking water line, resulting in slab settlement and wall cracking.<br />
Capital Costs: FY 20<strong>12</strong> FY 2013 FY 2014 FY 2015 FY 2016 FYs 17-21<br />
FY 20<strong>12</strong> Carryover<br />
$88,301 $0 $0 $0 $0 $0<br />
TOTAL $88,301 $0 $0 $0 $0 $0<br />
Operating Description:<br />
No additional O and M is needed.<br />
* New Project<br />
N=New Asset, R=Replacement <strong>of</strong> Existing Asset, I=Improvement <strong>of</strong> Existing Asset<br />
361<br />
Return to CIP TOC
FY 20<strong>12</strong>-2021 Capital Improvement Plan<br />
Capital Project Expenses Detail<br />
2080 - Government Facilities Construction Category: 6%<br />
Project: T1160 - City Hall Parking Garage (R) Funding Source:<br />
General Obligation Bonds<br />
Project Description:<br />
As part <strong>of</strong> the emergency garage repair in FY 2009, the structural engineer provided additional maintenance<br />
recommendations for the remainder <strong>of</strong> the garage related to replacement or repair <strong>of</strong> synthetic cushions. Over<br />
the past 25 years, the natural expansion and contraction <strong>of</strong> the structure's elements have pushed out <strong>of</strong> place<br />
many <strong>of</strong> the synthetic cushions on which the 366 concrete beams are seated. This has caused the concrete to<br />
wear against bare concrete causing considerable deterioration. Also, there are four locations that have<br />
significant deterioration that will require extra maintenance and repair before the deterioration becomes more<br />
costly.<br />
Capital Costs: FY 20<strong>12</strong> FY 2013 FY 2014 FY 2015 FY 2016 FYs 17-21<br />
Design $0 $0 $0 $0 $0 $150,000<br />
Construction $0 $0 $0 $0 $0 $1,100,000<br />
Finance Charges $0 $0 $0 $0 $0 $392,110<br />
Engineering Charges $0 $0 $0 $0 $0 $43,000<br />
Arts $0 $0 $0 $0 $0 $11,000<br />
Contingency $0 $0 $0 $0 $0 $135,689<br />
TOTAL $0 $0 $0 $0 $0 $1,831,799<br />
Operating Description:<br />
No additional O and M is need for this project.<br />
Project: T4730 - Fuel Sites Equipment Upgrade (R) Funding Source:<br />
General Obligation Bonds<br />
Project Description:<br />
This project reflects the replacement <strong>of</strong> all <strong>city</strong> <strong>of</strong> Glendale fuel dispensing equipment that will reach their<br />
maximum useful life over the next ten years. The project includes installation <strong>of</strong> new fuel monitoring and tank<br />
leak detection systems and replacement <strong>of</strong> the fuel tracking system at the <strong>city</strong>’s three fueling sites. Completion <strong>of</strong><br />
this project will ensure reporting accuracy, equipment stability and integrity, and improved customer service.<br />
Capital Costs: FY 20<strong>12</strong> FY 2013 FY 2014 FY 2015 FY 2016 FYs 17-21<br />
Design $0 $0 $0 $0 $0 $5,250<br />
Construction $0 $0 $0 $0 $0 $94,500<br />
Finance Charges $0 $0 $0 $0 $0 $86,525<br />
Engineering Charges $0 $0 $0 $0 $0 $10,973<br />
Arts $0 $0 $0 $0 $0 $945<br />
Contingency $0 $0 $0 $0 $0 $25,000<br />
TOTAL $0 $0 $0 $0 $0 $223,193<br />
Operating Description:<br />
No additional O and M is required as new equipment will replace aging existing equipment. No <strong>annual</strong><br />
maintenance is required, if repairs are required vendors will be paid through existing <strong>budget</strong>s. Contributions to<br />
the Technology Replacement Fund are being made for the hardware currently being used and no additional<br />
hardware would be needed at this time. The s<strong>of</strong>tware is a one-time purchase and the yearly license agreement<br />
will be paid through the departments existing <strong>budget</strong>. The additional O and M will be absorbed by the department.<br />
* New Project<br />
N=New Asset, R=Replacement <strong>of</strong> Existing Asset, I=Improvement <strong>of</strong> Existing Asset<br />
362<br />
Return to CIP TOC
20<strong>12</strong>-2021 CAPITAL IMPROVEMENT PLAN<br />
Cultural Facility/Historical Preservation – Construction Fund<br />
CULTURAL FACILITY/HISTORICAL PRESERVATION<br />
CONSTRUCTION FUND<br />
This general obligation category will fund the continuation <strong>of</strong> repair and rehabilitation work at<br />
the Morcomb property. Work will include restoration <strong>of</strong> both the historic house and gas station<br />
in order to preserve the historic integrity <strong>of</strong> the property. In conjecture with Maricopa<br />
Community Colleges, a Cultural Arts Facility is planned in the last five years <strong>of</strong> the CIP which<br />
would host community theater groups, small venue concerts, films and other performances.<br />
Project Name: Sahuaro Ranch Carriage House<br />
Funding Source: G. O. Bond<br />
Fund #: 2130<br />
Project #: 84308<br />
363<br />
Return to CIP TOC
FY 20<strong>12</strong> - 2021 Capital Improvement Plan<br />
Fund and Project Summary<br />
2130 - Cultural Facility Construction Category: 6%<br />
FY 20<strong>12</strong>: FY 2013: FY 2014: FY 2015: FY 2016: FYs 17-21:<br />
Estimated Beginning Balance: $355,626 $250,750 $250,750 $250,750 $250,750 $250,750<br />
Revenue<br />
Bond Proceeds^ 0 0 0 0 0 14,<strong>12</strong>0,000<br />
Intergovernmental Revenue 0 0 0 0 0 4,704,748<br />
Total Revenue:<br />
0 0 0 0 0 18,824,748<br />
Project Expenses Carryover New Funding<br />
Existing Assets<br />
Improvement <strong>of</strong> Existing Assets<br />
84307 Morcomb Property<br />
104,876 0 0 0 0 0 0<br />
Replacement <strong>of</strong> Existing Assets<br />
84308 Sahuaro Ranch Carriage House<br />
0 0 0 0 0 0 252,980<br />
Sub-Total - Existing Assets 104,876<br />
0 0 0 0 0 252,980<br />
New Assets<br />
84300 Cultural Arts Facility<br />
0 0 0 0 0 0 18,818,992<br />
Sub-Total - New Assets 0<br />
0 0 0 0 0 18,818,992<br />
Total Project Expenses:<br />
104,876 0 0 0 0 0 19,071,972<br />
Total FY 20<strong>12</strong> Funding:<br />
104,876<br />
Estimated Ending Balance: $250,750 $250,750 $250,750 $250,750 $250,750 $3,526<br />
*New Project<br />
^Will require additional voter authorization in last 5 years <strong>of</strong> the plan.<br />
364<br />
Return to CIP TOC
FY 20<strong>12</strong>-2021 Capital Improvement Plan<br />
Capital Project Expenses Detail<br />
2130 - Cultural Facility Construction Category: 6%<br />
Project: 84307 - Morcomb Property (I) Funding Source:<br />
General Obligation Bonds<br />
Project Description:<br />
Restoration <strong>of</strong> the historic 1936 Morcomb Adobe House and the historic Morcomb Service Station located at<br />
6040 West Myrtle Avenue and listed on the National Register. The project is part <strong>of</strong> the Myrtle Avenue Cultural<br />
Entryway. The project will consist <strong>of</strong> restoration <strong>of</strong> the historic house and historic gas station. This project will<br />
complete the Cultural Entryway.<br />
Capital Costs: FY 20<strong>12</strong> FY 2013 FY 2014 FY 2015 FY 2016 FYs 17-21<br />
FY 20<strong>12</strong> Carryover<br />
$104,876 $0 $0 $0 $0 $0<br />
TOTAL $104,876 $0 $0 $0 $0 $0<br />
Operating Description:<br />
Property will be owned by the City <strong>of</strong> Glendale. Field Operations and Parks & Recreation will maintain the<br />
buildings and landscaping. No occupancy <strong>of</strong> either building is contemplated. The additional O and M will be<br />
absorbed by the department.<br />
Operating Costs: FY 20<strong>12</strong> FY 2013 FY 2014 FY 2015 FY 2016 FYs 17-21<br />
Bldg. Maint. $1,000 $1,030 $1,061 $1,093 $1,<strong>12</strong>6 $6,155<br />
Landscape $1,000 $1,030 $1,061 $1,093 $1,<strong>12</strong>6 $6,155<br />
TOTAL $2,000 $2,060 $2,<strong>12</strong>2 $2,186 $2,252 $<strong>12</strong>,310<br />
Project: 84308 - Sahuaro Ranch Carriage House (R) Funding Source:<br />
General Obligation Bonds<br />
Project Description:<br />
Repair and replace the interior wood siding with the intent being to restore the weather tightness <strong>of</strong> the structure.<br />
Repair the deteriorating parts <strong>of</strong> the bay window. Replace the metal flashing at the ro<strong>of</strong> <strong>of</strong> the bay and install<br />
flooring with materials that meet ADA and historical standards. Replace all electrical infrastructure and prepare<br />
and re-paint all previously painted interior surfaces,<br />
Capital Costs: FY 20<strong>12</strong> FY 2013 FY 2014 FY 2015 FY 2016 FYs 17-21<br />
Design $0 $0 $0 $0 $0 $46,200<br />
Construction $0 $0 $0 $0 $0 $132,000<br />
Finance Charges $0 $0 $0 $0 $0 $4,960<br />
Engineering Charges $0 $0 $0 $0 $0 $11,000<br />
Arts $0 $0 $0 $0 $0 $1,320<br />
Equipment $0 $0 $0 $0 $0 $35,000<br />
Contingency $0 $0 $0 $0 $0 $22,500<br />
TOTAL $0 $0 $0 $0 $0 $252,980<br />
Operating Description:<br />
No additional O and M is needed.<br />
* New Project<br />
N=New Asset, R=Replacement <strong>of</strong> Existing Asset, I=Improvement <strong>of</strong> Existing Asset<br />
365<br />
Return to CIP TOC
FY 20<strong>12</strong>-2021 Capital Improvement Plan<br />
Capital Project Expenses Detail<br />
2130 - Cultural Facility Construction Category: 6%<br />
Project: 84300 - Cultural Arts Facility (N) Funding Source:<br />
General Obligation Bonds<br />
Project Description:<br />
Construction <strong>of</strong> a cultural arts facility in Glendale was identified in the 1999 Bond Election. Budget estimates are<br />
based on a 30,150 sq ft building, equipment and furniture. Glendale Community College (GCC) developed a<br />
prospectus in February 2005, which was updated in September 2008. The goal is to provide access to art and<br />
art programs for residents <strong>of</strong> Glendale and the surrounding area. GCC is committed to raising 25% <strong>of</strong> the capital<br />
costs for construction and will provide all O and M costs for this project. GCC's contribution to the construction <strong>of</strong><br />
this project would reduce the $18,818,992 cost by $4,704,748 for a total <strong>city</strong> cost <strong>of</strong> $14,114,244.<br />
Capital Costs: FY 20<strong>12</strong> FY 2013 FY 2014 FY 2015 FY 2016 FYs 17-21<br />
Design $0 $0 $0 $0 $0 $3,554,026<br />
Construction $0 $0 $0 $0 $0 $10,154,360<br />
Finance Charges $0 $0 $0 $0 $0 $369,000<br />
IT/Phone/Security $0 $0 $0 $0 $0 $158,687<br />
Engineering Charges $0 $0 $0 $0 $0 $115,000<br />
Arts $0 $0 $0 $0 $0 $101,544<br />
Equipment $0 $0 $0 $0 $0 $1,015,436<br />
Contingency $0 $0 $0 $0 $0 $1,320,067<br />
Miscellaneous/Other $0 $0 $0 $0 $0 $2,030,872<br />
TOTAL $0 $0 $0 $0 $0 $18,818,992<br />
Operating Description:<br />
All O and M costs will be covered by Glendale Community College.<br />
* New Project<br />
N=New Asset, R=Replacement <strong>of</strong> Existing Asset, I=Improvement <strong>of</strong> Existing Asset<br />
366<br />
Return to CIP TOC
20<strong>12</strong>-2021 CAPITAL IMPROVEMENT PLAN<br />
Economic Development – Construction Fund<br />
ECONOMIC DEVELOPMENT<br />
CONSTRUCTION FUND<br />
This general obligation bond category includes $1.7 million in carryover for economic<br />
development capital projects in FY 20<strong>12</strong>. These funds are intended for the purchase <strong>of</strong> land for<br />
redevelopment, the upgrade and repair <strong>of</strong> older infrastructure and new development<br />
infrastructure. The overall goal <strong>of</strong> the economic development capital projects is to attract high<br />
quality economic development projects that create or retain well-paying jobs in Glendale,<br />
enhance the <strong>city</strong>’s financial stability and attract new capital investment. Due to the continued<br />
decline in Glendale’s secondary assessed valuation, additional funding for economic<br />
development related projects will be deferred to the last five year <strong>of</strong> the plan.<br />
Project Name: Loop 303 Infrastructure<br />
Funding Source: G.O. Bond<br />
Fund #: 2100<br />
Project #: 84406<br />
367<br />
Return to CIP TOC
FY 20<strong>12</strong> - 2021 Capital Improvement Plan<br />
Fund and Project Summary<br />
2100 - Economic Development Construction Category: 6%<br />
FY 20<strong>12</strong>: FY 2013: FY 2014: FY 2015: FY 2016: FYs 17-21:<br />
Estimated Beginning Balance: $1,804,329 $61,531 $61,877 $62,256 $62,635 $63,047<br />
Revenue<br />
Bond Proceeds^ 0 0 0 0 0 91,495,000<br />
Interest Income 5,251 346 378 379 4<strong>12</strong> 1,030<br />
Investment Income 45 0 0 0 0 0<br />
Total Revenue:<br />
Operating Expenses<br />
5,296 346 378 379 4<strong>12</strong> 91,496,030<br />
Advisor Fees 2,000 0 0 0 0 0<br />
Total Operating Expenses:<br />
2,000 0 0 0 0 0<br />
Project Expenses Carryover New Funding<br />
Existing Assets<br />
Improvement <strong>of</strong> Existing Assets<br />
84401 Downtown Redevelopment<br />
450,000 0 0 0 0 0 25,625,000<br />
Sub-Total - Existing Assets 450,000<br />
0 0 0 0 0 25,625,000<br />
New Assets<br />
84400 Downtown Land Acquisition<br />
846,094 0 0 0 0 0 23,062,500<br />
84406 Loop 303 Infrastructure<br />
0 0 0 0 0 0 5,966,771<br />
84407 New Development Infrastructure 450,000 0 0 0 0 0 36,900,000<br />
Sub-Total - New Assets 1,296,094<br />
0 0 0 0 0 65,929,271<br />
Total Project Expenses:<br />
1,746,094 0 0 0 0 0 91,554,271<br />
Total FY 20<strong>12</strong> Funding:<br />
1,746,094<br />
Estimated Ending Balance: $61,531 $61,877 $62,256 $62,635 $63,047 $4,806<br />
*New Project<br />
^Will require additional voter authorization in last 5 years <strong>of</strong> the plan.<br />
368<br />
Return to CIP TOC
FY 20<strong>12</strong>-2021 Capital Improvement Plan<br />
Capital Project Expenses Detail<br />
2100 - Economic Development Construction Category: 6%<br />
Project: 84401 - Downtown Redevelopment (I) Funding Source:<br />
General Obligation Bonds<br />
Project Description:<br />
Redevelopment <strong>of</strong> infrastructure that needs to be upgraded or repaired to encourage private investment in<br />
redevelopment <strong>of</strong> the downtown area. Use funds to assist in any aspect <strong>of</strong> redevelopment.<br />
Capital Costs: FY 20<strong>12</strong> FY 2013 FY 2014 FY 2015 FY 2016 FYs 17-21<br />
Land $0 $0 $0 $0 $0 $25,000,000<br />
Finance Charges $0 $0 $0 $0 $0 $625,000<br />
Sub-Total New Funding $0<br />
$0 $0 $0 $0 $25,625,000<br />
FY 20<strong>12</strong> Carryover<br />
$450,000 $0 $0 $0 $0 $0<br />
TOTAL $450,000 $0 $0 $0 $0 $25,625,000<br />
Operating Description:<br />
Land acquisition only. Acquired land would be <strong>of</strong>fered to developers for purchase and development as desired<br />
within scope <strong>of</strong> a development agreement. O and M costs would be included within the scope <strong>of</strong> a development<br />
agreement or absorbed by the carryover portion <strong>of</strong> projects in FYs 20<strong>12</strong>-2016. A supplemental <strong>budget</strong> request<br />
will be submitted once the project is near completion.<br />
Operating Costs: FY 20<strong>12</strong> FY 2013 FY 2014 FY 2015 FY 2016 FYs 17-21<br />
Landscape $3,183 $3,278 $3,377 $3,478 $3,582 $19,586<br />
TOTAL $3,183 $3,278 $3,377 $3,478 $3,582 $19,586<br />
Project: 84400 - Downtown Land Acquisition (N) Funding Source:<br />
General Obligation Bonds<br />
Project Description:<br />
Districts affected include Ocotillo and Cactus. Purchase <strong>of</strong> underperforming properties in the City Center Master<br />
Plan area which can be assembled and re-marketed to businesses and establishments that desire to locate in<br />
the downtown redevelopment area, spurring economic growth. Funding will also cover associated costs <strong>of</strong><br />
appraisals, environmental assessments, title searches, demolitions, etc. The <strong>city</strong> will undertake requests for<br />
proposals to identi<strong>fy</strong> and negotiate development agreements. Continue implementation <strong>of</strong> the City Center Master<br />
Plan.<br />
Capital Costs: FY 20<strong>12</strong> FY 2013 FY 2014 FY 2015 FY 2016 FYs 17-21<br />
Land $0 $0 $0 $0 $0 $21,500,000<br />
Design $0 $0 $0 $0 $0 $250,000<br />
Finance Charges $0 $0 $0 $0 $0 $562,500<br />
Engineering Charges $0 $0 $0 $0 $0 $<strong>12</strong>,250<br />
Miscellaneous/Other $0 $0 $0 $0 $0 $737,750<br />
Sub-Total New Funding $0<br />
$0 $0 $0 $0 $23,062,500<br />
FY 20<strong>12</strong> Carryover<br />
$846,094 $0 $0 $0 $0 $0<br />
TOTAL $846,094 $0 $0 $0 $0 $23,062,500<br />
Operating Description:<br />
Minimal O and M associated with this project related to land acquisition. Only for weed control maintenance<br />
which would be absorbed by operating and maintenance <strong>budget</strong>. Acquired land would be <strong>of</strong>fered to developer for<br />
purchase and development as desired by <strong>city</strong> within scope <strong>of</strong> a development agreement. Estimation for weed<br />
control and maintenance is just over $2,000 per year for FYs 20<strong>12</strong>-2016. The additional O and M will be<br />
absorbed by the department.<br />
Operating Costs: FY 20<strong>12</strong> FY 2013 FY 2014 FY 2015 FY 2016 FYs 17-21<br />
Landscape $2,380 $2,452 $2,525 $2,601 $2,679 $14,649<br />
TOTAL $2,380 $2,452 $2,525 $2,601 $2,679 $14,649<br />
* New Project<br />
N=New Asset, R=Replacement <strong>of</strong> Existing Asset, I=Improvement <strong>of</strong> Existing Asset<br />
369<br />
Return to CIP TOC
FY 20<strong>12</strong>-2021 Capital Improvement Plan<br />
Capital Project Expenses Detail<br />
2100 - Economic Development Construction Category: 6%<br />
Project: 84406 - Loop 303 Infrastructure (N) Funding Source:<br />
General Obligation Bonds<br />
Project Description:<br />
Construction <strong>of</strong> new infrastructure and other development costs for new retail or mixed-use development near<br />
Loop 303 in fulfillment <strong>of</strong> development agreement. As development along the Loop 101 continues, the Loop 303<br />
area is becoming the hot spot for new development within the <strong>city</strong>. Attracting high-quality development projects<br />
to spur economic growth, requires infrastructure to be in place.<br />
Capital Costs: FY 20<strong>12</strong> FY 2013 FY 2014 FY 2015 FY 2016 FYs 17-21<br />
Design $0 $0 $0 $0 $0 $500,000<br />
Construction $0 $0 $0 $0 $0 $4,143,603<br />
Finance Charges $0 $0 $0 $0 $0 $148,150<br />
Engineering Charges $0 $0 $0 $0 $0 $85,907<br />
Arts $0 $0 $0 $0 $0 $41,436<br />
Contingency $0 $0 $0 $0 $0 $866,675<br />
Miscellaneous/Other $0 $0 $0 $0 $0 $181,000<br />
TOTAL $0 $0 $0 $0 $0 $5,966,771<br />
Operating Description:<br />
No additional O and M is needed at this time. If needed for weed control, etc., a supplemental would be<br />
submitted at a later time.<br />
Project: 84407 - New Development Infrastructure (N) Funding Source:<br />
General Obligation Bonds<br />
Project Description:<br />
Funding to provide new infrastructure to recruit and encourage new high quality private development <strong>city</strong>wide.<br />
The <strong>city</strong> incurs infrastructure and development costs as new economic development projects occur. Funds are<br />
needed to assist with infrastructure costs to support major development projects which will generate new<br />
revenues and economic benefits for the <strong>city</strong> as a tool to recruit high quality employers to the <strong>city</strong>.<br />
Capital Costs: FY 20<strong>12</strong> FY 2013 FY 2014 FY 2015 FY 2016 FYs 17-21<br />
Land $0 $0 $0 $0 $0 $10,000,000<br />
Design $0 $0 $0 $0 $0 $10,728,000<br />
Construction $0 $0 $0 $0 $0 $15,000,000<br />
Finance Charges $0 $0 $0 $0 $0 $900,000<br />
Engineering Charges $0 $0 $0 $0 $0 $<strong>12</strong>2,000<br />
Arts $0 $0 $0 $0 $0 $150,000<br />
Sub-Total New Funding $0<br />
$0 $0 $0 $0 $36,900,000<br />
FY 20<strong>12</strong> Carryover<br />
$450,000 $0 $0 $0 $0 $0<br />
TOTAL $450,000 $0 $0 $0 $0 $36,900,000<br />
Operating Description:<br />
O and M costs would be included within the scope <strong>of</strong> a development agreement.<br />
* New Project<br />
N=New Asset, R=Replacement <strong>of</strong> Existing Asset, I=Improvement <strong>of</strong> Existing Asset<br />
370<br />
Return to CIP TOC
20<strong>12</strong>-2021 CAPITAL IMPROVEMENT PLAN<br />
Flood Control – Construction Fund<br />
FLOOD CONTROL<br />
CONSTRUCTION FUND<br />
FY 20<strong>12</strong> projects include the completion <strong>of</strong> several storm drain projects including 67 th Avenue<br />
between Peoria and the Arizona Canal Diversion Channel (ACDC), Northern Avenue between<br />
47 th and 63 rd Avenues, and Camelback Road between 59 th and 75 th Avenues which is part <strong>of</strong> the<br />
Bethany Home Outfall Channel Project. With the exception <strong>of</strong> the ongoing AZDES Permit<br />
Project, no new funding is included in the first five years <strong>of</strong> the CIP plan due to the continued<br />
decline in Glendale’s secondary assessed valuation. The AZDES Permit Project ensures that the<br />
<strong>city</strong> remains compliant with the requirements <strong>of</strong> a permit obtained under the Clean Water Act.<br />
Project Name: Northern Ave. SD-47 th to 63 rd<br />
Funding Source: G.O. Bond<br />
Fund #: 2180<br />
Project #: 79008<br />
371<br />
Return to CIP TOC
FY 20<strong>12</strong> - 2021 Capital Improvement Plan<br />
Fund and Project Summary<br />
2180 - Flood Control Construction Category: 20%<br />
FY 20<strong>12</strong>: FY 2013: FY 2014: FY 2015: FY 2016: FYs 17-21:<br />
Estimated Beginning Balance: $11,877,203 $1,555,175 $1,401,360 $1,247,450 $1,092,706 $937,635<br />
Revenue<br />
Bond Proceeds^ 0 0 0 0 0 30,750,000<br />
Interest Income 30,981 6,803 6,739 5,938 5,643 14,108<br />
Intergovernmental Revenue 0 0 0 0 0 8,535,000<br />
Investment Income 1,644 362 324 286 248 621<br />
Total Revenue:<br />
Operating Expenses<br />
32,625 7,164 7,063 6,224 5,891 39,299,729<br />
Advisor Fees 5,213 54 49 43 37 93<br />
Total Operating Expenses:<br />
5,213 54 49 43 37 93<br />
Project Expenses Carryover New Funding<br />
Existing Assets<br />
Improvement <strong>of</strong> Existing Assets<br />
79004 Local Drainage Problems<br />
1,054,710 0 0 0 0 0 5,293,992<br />
79005 Collector Drains<br />
558,130 0 0 0 0 0 0<br />
79006 AZDES Permit<br />
465,907 160,925 160,925 160,925 160,925 160,925 804,625<br />
T2944 *51st Ave. SD; Northern - Olive<br />
0 0 0 0 0 0 2,077,840<br />
Replacement <strong>of</strong> Existing Assets<br />
79010 Storm Water Master Plan<br />
98,695 0 0 0 0 0 843,750<br />
Sub-Total - Existing Assets 2,177,442 160,925 160,925 160,925 160,925 160,925 9,020,207<br />
New Assets<br />
79000 Bethany Home Outfall Channel 3,441,598 0 0 0 0 0 0<br />
79001 Bethany Home 58th - 51st<br />
0 0 0 0 0 0 5,014,601<br />
79002 67th Ave/Peoria to ACDC<br />
371,516 0 0 0 0 0 0<br />
79007 Greenway Drain - 59th to 67th<br />
0 0 0 0 0 0 3,684,359<br />
79008 Northern Ave. SD- 47th to 63rd 4,197,959 0 0 0 0 0 0<br />
79013 Bethany Home, 79th-67th (SD)<br />
0 0 0 0 0 0 10,608,840<br />
T2910 Bethany Home, 67th-58th (SD)<br />
0 0 0 0 0 0 8,221,654<br />
T2940 Greenway Drain - 51st-59th<br />
0 0 0 0 0 0 3,684,074<br />
Sub-Total - New Assets 8,011,073<br />
0 0 0 0 0 31,213,528<br />
Total Project Expenses:<br />
10,188,515 160,925 160,925 160,925 160,925 160,925 40,233,735<br />
Total FY 20<strong>12</strong> Funding:<br />
10,349,440<br />
Estimated Ending Balance: $1,555,175 $1,401,360 $1,247,450 $1,092,706 $937,635 $3,536<br />
*New Project<br />
^Will require additional voter authorization in last 5 years <strong>of</strong> the plan.<br />
372<br />
Return to CIP TOC
FY 20<strong>12</strong>-2021 Capital Improvement Plan<br />
Capital Project Expenses Detail<br />
2180 - Flood Control Construction Category: 20%<br />
Project: 79004 - Local Drainage Problems (I) Funding Source:<br />
General Obligation Bonds<br />
Project Description:<br />
Construct localized storm drain improvements to mitigate drainage and/or flooding problems. This is an ongoing<br />
program that typically addresses drainage problems in older neighborhoods, residential areas, and extend<br />
existing storm drain systems.<br />
Capital Costs: FY 20<strong>12</strong> FY 2013 FY 2014 FY 2015 FY 2016 FYs 17-21<br />
Construction $0 $0 $0 $0 $0 $5,099,284<br />
Finance Charges $0 $0 $0 $0 $0 $23,715<br />
Engineering Charges $0 $0 $0 $0 $0 $<strong>12</strong>0,000<br />
Arts $0 $0 $0 $0 $0 $50,993<br />
Sub-Total New Funding $0<br />
$0 $0 $0 $0 $5,293,992<br />
FY 20<strong>12</strong> Carryover<br />
$1,054,710 $0 $0 $0 $0 $0<br />
TOTAL $1,054,710 $0 $0 $0 $0 $5,293,992<br />
Operating Description:<br />
Storm drain pipe requires little or no maintenance and in most cases will reduce existing maintenance because<br />
storm water does not pond in the street or other public facility.<br />
Project: 79005 - Collector Drains (I) Funding Source:<br />
General Obligation Bonds<br />
Project Description:<br />
Ongoing program to construct storm drain improvements on collector streets to mitigate drainage and flooding<br />
problems.<br />
Capital Costs: FY 20<strong>12</strong> FY 2013 FY 2014 FY 2015 FY 2016 FYs 17-21<br />
FY 20<strong>12</strong> Carryover<br />
$558,130 $0 $0 $0 $0 $0<br />
TOTAL $558,130 $0 $0 $0 $0 $0<br />
Operating Description:<br />
Storm drain pipe requires little or no maintenance and in most cases will reduce existing maintenance because<br />
storm water does not pond in the street or other public facility.<br />
Project: 79006 - AZDES Permit (I) Funding Source:<br />
General Obligation Bonds<br />
Project Description:<br />
In 1999, the City <strong>of</strong> Glendale obtained a permit under the Clean Water Act for the National Pollutant Discharge<br />
Elimination System. The permit requires monitoring <strong>of</strong> storm water flows and preparation <strong>of</strong> <strong>annual</strong> reports. This<br />
funding will insure that the <strong>city</strong> can continue to meet the requirements <strong>of</strong> the permit and avoid fines up to $25,000<br />
per day.<br />
Capital Costs: FY 20<strong>12</strong> FY 2013 FY 2014 FY 2015 FY 2016 FYs 17-21<br />
Finance Charges $3,925 $3,925 $3,925 $3,925 $3,925 $19,625<br />
Miscellaneous/Other $157,000 $157,000 $157,000 $157,000 $157,000 $785,000<br />
Sub-Total New Funding $160,925 $160,925 $160,925 $160,925 $160,925 $804,625<br />
FY 20<strong>12</strong> Carryover<br />
$465,907 $0 $0 $0 $0 $0<br />
TOTAL $626,832 $160,925 $160,925 $160,925 $160,925 $804,625<br />
Operating Description:<br />
O and M <strong>of</strong> storm water monitoring will be done by the United States Geological Survey agency through an IGA<br />
requiring <strong>annual</strong> payments.<br />
* New Project<br />
N=New Asset, R=Replacement <strong>of</strong> Existing Asset, I=Improvement <strong>of</strong> Existing Asset<br />
373<br />
Return to CIP TOC
FY 20<strong>12</strong>-2021 Capital Improvement Plan<br />
Capital Project Expenses Detail<br />
2180 - Flood Control Construction Category: 20%<br />
Project: T2944* - 51st Ave. SD; Northern - Olive (I) Funding Source:<br />
General Obligation Bonds<br />
Project Description:<br />
Project will construct a 42" storm drain pipe, inlets, and other appurtenances in 51st Avenue between Northern<br />
Avenue and Olive Avenue.<br />
Capital Costs: FY 20<strong>12</strong> FY 2013 FY 2014 FY 2015 FY 2016 FYs 17-21<br />
Design $0 $0 $0 $0 $0 $100,000<br />
Construction $0 $0 $0 $0 $0 $1,700,000<br />
Finance Charges $0 $0 $0 $0 $0 $41,340<br />
Engineering Charges $0 $0 $0 $0 $0 $49,500<br />
Arts $0 $0 $0 $0 $0 $17,000<br />
Contingency $0 $0 $0 $0 $0 $170,000<br />
TOTAL $0 $0 $0 $0 $0 $2,077,840<br />
Operating Description:<br />
The storm drain will not require O and M.<br />
Project: 79010 - Storm Water Master Plan (R) Funding Source:<br />
General Obligation Bonds<br />
Project Description:<br />
Update a <strong>city</strong>wide master plan completed in <strong>2011</strong> to determine the adequacy <strong>of</strong> existing facilities and prioritize<br />
new facilities. Project will include new drainage facilities, detailed aerial mapping and hydrologic modeling to<br />
determine storm water flows and volumes.<br />
Capital Costs: FY 20<strong>12</strong> FY 2013 FY 2014 FY 2015 FY 2016 FYs 17-21<br />
Finance Charges $0 $0 $0 $0 $0 $18,750<br />
Miscellaneous/Other $0 $0 $0 $0 $0 $825,000<br />
Sub-Total New Funding $0<br />
$0 $0 $0 $0 $843,750<br />
FY 20<strong>12</strong> Carryover<br />
$98,695 $0 $0 $0 $0 $0<br />
TOTAL $98,695 $0 $0 $0 $0 $843,750<br />
Operating Description:<br />
No additional O and M is needed.<br />
Project: 79000 - Bethany Home Outfall Channel (N) Funding Source:<br />
General Obligation Bonds<br />
Project Description:<br />
This is the last phase <strong>of</strong> the Bethany Home Outfall Channel project with the Flood Control District <strong>of</strong> Maricopa<br />
County. The portions <strong>of</strong> the outfall channel between the Loop 101 and 83rd Avenue are complete and the storm<br />
drain piping between 83rd and 75th Avenues along the Grand Canal are complete. This phase will complete the<br />
storm drain in Camelback Road from 75th to 59th Avenues.<br />
Capital Costs: FY 20<strong>12</strong> FY 2013 FY 2014 FY 2015 FY 2016 FYs 17-21<br />
FY 20<strong>12</strong> Carryover<br />
$3,441,598 $0 $0 $0 $0 $0<br />
TOTAL $3,441,598 $0 $0 $0 $0 $0<br />
Operating Description:<br />
Storm drain pipe requires little or no maintenance and in most cases will reduce existing maintenance because<br />
storm water does not pond in the street or other public facility. The outfall channel will be maintained by the flood<br />
control district.<br />
* New Project<br />
N=New Asset, R=Replacement <strong>of</strong> Existing Asset, I=Improvement <strong>of</strong> Existing Asset<br />
374<br />
Return to CIP TOC
FY 20<strong>12</strong>-2021 Capital Improvement Plan<br />
Capital Project Expenses Detail<br />
2180 - Flood Control Construction Category: 20%<br />
Project: 79001 - Bethany Home 58th - 51st (N) Funding Source:<br />
General Obligation Bonds<br />
Project Description:<br />
Construct a storm drain along Bethany Home Road between 51st and 58th Avenues including mainline pipe,<br />
catch basins and appurtenances.<br />
Capital Costs: FY 20<strong>12</strong> FY 2013 FY 2014 FY 2015 FY 2016 FYs 17-21<br />
Design $0 $0 $0 $0 $0 $300,000<br />
Construction $0 $0 $0 $0 $0 $4,000,000<br />
Finance Charges $0 $0 $0 $0 $0 $1<strong>12</strong>,551<br />
Engineering Charges $0 $0 $0 $0 $0 $79,550<br />
Arts $0 $0 $0 $0 $0 $40,000<br />
Contingency $0 $0 $0 $0 $0 $400,000<br />
Miscellaneous/Other $0 $0 $0 $0 $0 $82,500<br />
TOTAL $0 $0 $0 $0 $0 $5,014,601<br />
Operating Description:<br />
O and M will not occur until project is actually constructed in the future. Storm drain pipe requires little or no<br />
maintenance and in most cases will reduce existing maintenance because storm water does not pond in the<br />
street or other public facility.<br />
Project: 79002 - 67th Ave/Peoria to ACDC (N) Funding Source:<br />
General Obligation Bonds<br />
Project Description:<br />
Construct a storm drain on 67th Avenue from Peoria to the Arizona Canal Diversion Channel to include mainline<br />
piping, catch basins and appurtenances. Through an IGA, 50% <strong>of</strong> the storm drain cost will be shared with the<br />
Flood Control District <strong>of</strong> Maricopa Co<br />
Capital Costs: FY 20<strong>12</strong> FY 2013 FY 2014 FY 2015 FY 2016 FYs 17-21<br />
FY 20<strong>12</strong> Carryover<br />
$371,516 $0 $0 $0 $0 $0<br />
TOTAL $371,516 $0 $0 $0 $0 $0<br />
Operating Description:<br />
Storm drain pipe requires little or no maintenance and in most cases will reduce existing maintenance because<br />
storm water does not pond in the street or other public facility.<br />
Project: 79007 - Greenway Drain - 59th to 67th (N) Funding Source:<br />
General Obligation Bonds<br />
Project Description:<br />
Construct a storm drain at Greenway Road from 59th to 67th Avenues. Project includes catch basins and<br />
appurtenances. This project will intercept storm water flows east <strong>of</strong> 67th Avenue.<br />
Capital Costs: FY 20<strong>12</strong> FY 2013 FY 2014 FY 2015 FY 2016 FYs 17-21<br />
Design $0 $0 $0 $0 $0 $500,000<br />
Construction $0 $0 $0 $0 $0 $2,640,000<br />
Finance Charges $0 $0 $0 $0 $0 $89,869<br />
Engineering Charges $0 $0 $0 $0 $0 $58,090<br />
Arts $0 $0 $0 $0 $0 $26,400<br />
Contingency $0 $0 $0 $0 $0 $370,000<br />
TOTAL $0 $0 $0 $0 $0 $3,684,359<br />
Operating Description:<br />
No additional O and M is needed.<br />
* New Project<br />
N=New Asset, R=Replacement <strong>of</strong> Existing Asset, I=Improvement <strong>of</strong> Existing Asset<br />
375<br />
Return to CIP TOC
FY 20<strong>12</strong>-2021 Capital Improvement Plan<br />
Capital Project Expenses Detail<br />
2180 - Flood Control Construction Category: 20%<br />
Project: 79008 - Northern Ave. SD- 47th to 63rd (N) Funding Source:<br />
General Obligation Bonds<br />
Project Description:<br />
Construct a storm drain on Northern Avenue from the basin at 63rd Avenue to approximately 47th Avenue, and a<br />
raw 24" water line from 51st Avenue to 63rd Avenue.<br />
Capital Costs: FY 20<strong>12</strong> FY 2013 FY 2014 FY 2015 FY 2016 FYs 17-21<br />
FY 20<strong>12</strong> Carryover<br />
$4,197,959 $0 $0 $0 $0 $0<br />
TOTAL $4,197,959 $0 $0 $0 $0 $0<br />
Operating Description:<br />
Storm drain pipe requires little or no maintenance and in most cases will reduce existing maintenance because<br />
storm water does not pond in the street or other public facility.<br />
Project: 79013 - Bethany Home, 79th-67th (SD) (N) Funding Source:<br />
General Obligation Bonds<br />
Project Description:<br />
Construct storm drain pipe, inlets, and other appurtenances in Bethany Home Road from 79th Avenue to 67th<br />
Avenue.<br />
Capital Costs: FY 20<strong>12</strong> FY 2013 FY 2014 FY 2015 FY 2016 FYs 17-21<br />
Design $0 $0 $0 $0 $0 $600,000<br />
Construction $0 $0 $0 $0 $0 $9,000,000<br />
Finance Charges $0 $0 $0 $0 $0 $40,500<br />
Engineering Charges $0 $0 $0 $0 $0 $92,500<br />
Arts $0 $0 $0 $0 $0 $90,000<br />
Contingency $0 $0 $0 $0 $0 $785,840<br />
TOTAL $0 $0 $0 $0 $0 $10,608,840<br />
Operating Description:<br />
Storm drain pipe requires little or no maintenance and in most cases will reduce existing maintenance because<br />
storm water does not pond in the street or other public facility.<br />
Project: T2910 - Bethany Home, 67th-58th (SD) (N) Funding Source:<br />
General Obligation Bonds<br />
Project Description:<br />
Construct a storm drain in Bethany Home Road from 67th to 58th Avenues. Construction costs are to be shared<br />
with Maricopa County Flood Control District (50%) per an existing Intergovernmental agreement. Project will<br />
include storm drain pipe, catch basins and appurtenances.<br />
Capital Costs: FY 20<strong>12</strong> FY 2013 FY 2014 FY 2015 FY 2016 FYs 17-21<br />
Design $0 $0 $0 $0 $0 $1,200,000<br />
Construction $0 $0 $0 $0 $0 $6,000,000<br />
Finance Charges $0 $0 $0 $0 $0 $161,209<br />
Engineering Charges $0 $0 $0 $0 $0 $92,500<br />
Arts $0 $0 $0 $0 $0 $60,000<br />
Contingency $0 $0 $0 $0 $0 $597,070<br />
Miscellaneous/Other $0 $0 $0 $0 $0 $110,875<br />
TOTAL $0 $0 $0 $0 $0 $8,221,654<br />
Operating Description:<br />
Storm drain pipe requires little or no maintenance and in most cases will reduce existing maintenance because<br />
storm water does not pond in the street or other public facility.<br />
* New Project<br />
N=New Asset, R=Replacement <strong>of</strong> Existing Asset, I=Improvement <strong>of</strong> Existing Asset<br />
376<br />
Return to CIP TOC
FY 20<strong>12</strong>-2021 Capital Improvement Plan<br />
Capital Project Expenses Detail<br />
2180 - Flood Control Construction Category: 20%<br />
Project: T2940 - Greenway Drain - 51st-59th (N) Funding Source:<br />
General Obligation Bonds<br />
Project Description:<br />
Construct a storm drain in Greenway Road between 51st and 59th Avenues to include mainline piping, catch<br />
basins, and appurtenances.<br />
Capital Costs: FY 20<strong>12</strong> FY 2013 FY 2014 FY 2015 FY 2016 FYs 17-21<br />
Design $0 $0 $0 $0 $0 $500,000<br />
Construction $0 $0 $0 $0 $0 $2,630,000<br />
Finance Charges $0 $0 $0 $0 $0 $89,869<br />
Engineering Charges $0 $0 $0 $0 $0 $57,905<br />
Arts $0 $0 $0 $0 $0 $26,300<br />
Contingency $0 $0 $0 $0 $0 $380,000<br />
TOTAL $0 $0 $0 $0 $0 $3,684,074<br />
Operating Description:<br />
Storm drain pipe requires little or no maintenance and in most cases will reduce existing maintenance because<br />
storm water does not pond in the street or other public facility.<br />
* New Project<br />
N=New Asset, R=Replacement <strong>of</strong> Existing Asset, I=Improvement <strong>of</strong> Existing Asset<br />
377<br />
Return to CIP TOC
20<strong>12</strong>-2021 CAPITAL IMPROVEMENT PLAN<br />
Development Impact Fee Funds<br />
DEVELOPMENT IMPACT FEE FUNDS<br />
Impact fees are one-time charges to developers that are used to <strong>of</strong>fset a <strong>city</strong>’s capital costs<br />
resulting from new development. Developers pay development impact fees when they construct<br />
new residential and commercial developments. These fees are designed to cover a <strong>city</strong>’s<br />
increased costs for providing new or expanded infrastructure in the following categories:<br />
roadway improvements, open space and trails, parks, libraries, police, fire, general government,<br />
solid waste services and water/sewer. In this section you will find separate DIF fund summaries<br />
for each <strong>of</strong> these categories with the exception <strong>of</strong> solid waste services and water/sewer which are<br />
included in the Enterprise/Other Fund section <strong>of</strong> the Capital Improvement Plan.<br />
Planning and zoning information, such as anticipated population growth and expected density <strong>of</strong><br />
residential and commercial development, is the foundation for impact fee revenue estimates.<br />
Given this information, the <strong>city</strong> then estimates the amount <strong>of</strong> impact fee revenue available to pay<br />
for growth-related capital projects.<br />
In normal economic conditions a number <strong>of</strong> DIF funded projects would be included in the capital<br />
plan to supplement the growth related portion <strong>of</strong> projects funded with other resources. However<br />
with the drastic decline in secondary assessed value, most G. O. bond funded projects have either<br />
been removed or deferred to the last five years <strong>of</strong> the plan. Since DIF revenue alone <strong>of</strong>ten is not<br />
sufficient to fund 100% <strong>of</strong> the cost <strong>of</strong> growth-related projects, the current plan is to evaluate<br />
options over the next year as staff continues to identi<strong>fy</strong> appropriate uses for DIF revenue.<br />
Late in FY <strong>2011</strong> Senate Bill 1525 was signed into law. The new law changes how development<br />
impact fees will be administered and places heavier restrictions on how DIF revenue can be used.<br />
Staff will work to evaluate how the new law will affect the current capital plan and incorporate<br />
into the capital plan the new DIF framework by August 1, 2014 as required by the law.<br />
Fund # - Name Carryover FY 20<strong>12</strong> FY 2013 FY 2014 FY 2015 FY 2016 FYs 17-21<br />
1600-Roadway Improvements 131,958 0 22,064 0 194,908 171,500 1,766,178<br />
1520-Citywide Open Space 171,473 44,000 46,216 44,000 46,350 0 85,140<br />
1460-Citywide Parks 0 0 2,216 0 2,350 0 5,140<br />
1480-Citywide Rec Facility 0 0 2,216 0 2,350 0 5,140<br />
1540-Park Dev Zone 1 39,632 0 2,216 0 2,350 0 5,140<br />
1560-Park Dev Zone 2 <strong>12</strong>3,506 15,000 7,816 5,600 2,350 0 5,140<br />
1580-Park Dev Zone 3 11,905 19,999 7,516 6,000 2,350 0 5,140<br />
1380-Library Buildings 0 0 0 0 0 0 1,609,288<br />
1500-Libraries 72,665 200,000 213,265 200,000 214,073 200,000 2,484259<br />
1440-Police Dept Facilities 0 0 10,919 0 11,584 0 25,329<br />
1420-Fire Protect Facilities 0 0 11,480 0 <strong>12</strong>,179 0 26,627<br />
1620-General Government 0 0 <strong>12</strong>,799 0 13,578 0 29,687<br />
Total DIF Funds $551,139 $278,999 $338,723 $255,600 $504,422 $371,500 $6,052,208<br />
378<br />
Return to CIP TOC
20<strong>12</strong>-2021 CAPITAL IMPROVEMENT PLAN<br />
Roadway Improvements - DIF<br />
ROADWAY IMPROVEMENTS<br />
DIF FUND<br />
This category includes development impact fees paid by developers for roadway improvements<br />
that are needed because <strong>of</strong> new residential and commercial developments within <strong>city</strong> limits.<br />
Continuing through FY 2014, the DIF-Roadway Improvement Fund will contribute $1M per<br />
year to cover a portion <strong>of</strong> debt service associated with growth related HURF projects.<br />
Carryover will be available for development agreements involving arterial streets and<br />
intersection such as improvements to curbs/gutters, sidewalks, street lights, traffic signals and<br />
landscaping. However, due to the slowdown in residential and commercial development, no new<br />
funding is anticipated for these types <strong>of</strong> development agreements until FY 2015. Any remaining<br />
funds collected in prior FYs are set aside for the HURF debt service contributions and future DIF<br />
updates.<br />
Project Name: Dev. Agree. - Signals<br />
Funding Source: DIF<br />
Fund #: 1600<br />
Project #: 67803<br />
379<br />
Return to CIP TOC
FY 20<strong>12</strong> - 2021 Capital Improvement Plan<br />
Fund and Project Summary<br />
1600 - DIF-Roadway Improvements Category: DIF<br />
FY 20<strong>12</strong>: FY 2013: FY 2014: FY 2015: FY 2016: FYs 17-21:<br />
Estimated Beginning Balance: $2,575,366 $1,727,748 $987,071 $267,561 $354,046 $467,518<br />
Revenue<br />
Development Impact Fees 272,699 274,062 276,803 279,571 282,367 1,404,844<br />
Interest Income 11,641 7,325 3,688 1,822 2,605 5,210<br />
Total Revenue:<br />
Operating Expenses<br />
284,340 281,387 280,491 281,393 284,972 1,410,054<br />
Transfer Out** 1,000,000 1,000,000 1,000,000 0 0 0<br />
Total Operating Expenses:<br />
1,000,000 1,000,000 1,000,000 0 0 0<br />
Project Expenses Carryover New Funding<br />
Existing Assets<br />
Improvement <strong>of</strong> Existing Assets<br />
67802 Dev. Agree. - Arterials<br />
65,110 0 0 0 0 0 857,500<br />
Replacement <strong>of</strong> Existing Assets<br />
67809 DIF Update<br />
0 0 22,064 0 23,408 0 51,178<br />
Sub-Total - Existing Assets 65,110<br />
0 22,064 0 23,408 0 908,678<br />
New Assets<br />
67803 Dev. Agree. - Signals<br />
66,848 0 0 0 171,500 171,500 857,500<br />
Sub-Total - New Assets 66,848<br />
0 0 0 171,500 171,500 857,500<br />
Total Project Expenses:<br />
131,958 0 22,064 0 194,908 171,500 1,766,178<br />
Total FY 20<strong>12</strong> Funding:<br />
131,958<br />
Estimated Ending Balance: $1,727,748 $987,071 $267,561 $354,046 $467,518 $111,394<br />
*New Project<br />
**DIF Roadway Improvement contribution for HURF debt payment.<br />
380<br />
Return to CIP TOC
FY 20<strong>12</strong>-2021 Capital Improvement Plan<br />
Capital Project Expenses Detail<br />
1600 - DIF-Roadway Improvements Category: DIF<br />
Project: 67802 - Dev. Agree. - Arterials (I) Funding Source:<br />
Development Impact Fees<br />
Project Description:<br />
This program is to fund partial street improvements agreed to in development agreements for Arterial streets as<br />
an incentive to the developer. Some <strong>of</strong> the improvements could include pavement widening, curb and gutter,<br />
sidewalks, landscaping, and street lights to accommodate growth.<br />
Capital Costs: FY 20<strong>12</strong> FY 2013 FY 2014 FY 2015 FY 2016 FYs 17-21<br />
Miscellaneous/Other $0 $0 $0 $0 $0 $857,500<br />
Sub-Total New Funding $0<br />
$0 $0 $0 $0 $857,500<br />
FY 20<strong>12</strong> Carryover<br />
$65,110 $0 $0 $0 $0 $0<br />
TOTAL $65,110 $0 $0 $0 $0 $857,500<br />
Operating Description:<br />
No additional O and M is needed at this time.<br />
Project: 67809 - DIF Update (R) Funding Source:<br />
Development Impact Fees<br />
Project Description:<br />
The Development Impact Fee (DIF) Report should be updated every two years to adjust the fees based on<br />
current level <strong>of</strong> service for additional infrastructure needs related to new growth throughout the <strong>city</strong>. This is the<br />
roadway improvements portion <strong>of</strong> the cost to update the report.<br />
Capital Costs: FY 20<strong>12</strong> FY 2013 FY 2014 FY 2015 FY 2016 FYs 17-21<br />
Miscellaneous/Other $0 $22,064 $0 $23,408 $0 $51,178<br />
TOTAL $0 $22,064 $0 $23,408 $0 $51,178<br />
Operating Description:<br />
No O and M is needed.<br />
* New Project<br />
N=New Asset, R=Replacement <strong>of</strong> Existing Asset, I=Improvement <strong>of</strong> Existing Asset<br />
381<br />
Return to CIP TOC
FY 20<strong>12</strong>-2021 Capital Improvement Plan<br />
Capital Project Expenses Detail<br />
1600 - DIF-Roadway Improvements Category: DIF<br />
Project: 67803 - Dev. Agree. - Signals (N) Funding Source:<br />
Development Impact Fees<br />
Project Description:<br />
Fees charged to developers are used to improve intersections that have experienced increased vehicular traffic<br />
generated by new development. This project provides for the installation or upgrades <strong>of</strong> traffic signals and<br />
Intelligent Transportation Systems equipment at various locations throughout the <strong>city</strong>.<br />
Capital Costs: FY 20<strong>12</strong> FY 2013 FY 2014 FY 2015 FY 2016 FYs 17-21<br />
Land $0 $0 $0 $6,018 $6,018 $30,088<br />
Design $0 $0 $0 $10,531 $10,531 $52,654<br />
Construction $0 $0 $0 $137,563 $137,563 $687,814<br />
Engineering Charges $0 $0 $0 $6,143 $6,143 $30,714<br />
Arts $0 $0 $0 $1,376 $1,376 $6,878<br />
Contingency $0 $0 $0 $9,869 $9,869 $49,352<br />
Sub-Total New Funding $0<br />
$0 $0 $171,500 $171,500 $857,500<br />
FY 20<strong>12</strong> Carryover<br />
$66,848 $0 $0 $0 $0 $0<br />
TOTAL $66,848 $0 $0 $171,500 $171,500 $857,500<br />
Operating Description:<br />
O and M costs are for the electri<strong>city</strong> and maintenance <strong>of</strong> new traffic signal installations. A supplemental <strong>budget</strong><br />
request will be made as new equipment is added to the system.<br />
Operating Costs: FY 20<strong>12</strong> FY 2013 FY 2014 FY 2015 FY 2016 FYs 17-21<br />
Utilities $0 $0 $0 $<strong>12</strong>,155 $<strong>12</strong>,520 $68,465<br />
Equip. Maint. $0 $0 $0 $6,078 $6,260 $34,231<br />
TOTAL $0 $0 $0 $18,233 $18,780 $102,696<br />
* New Project<br />
N=New Asset, R=Replacement <strong>of</strong> Existing Asset, I=Improvement <strong>of</strong> Existing Asset<br />
382<br />
Return to CIP TOC
20<strong>12</strong>-2021 CAPITAL IMPROVEMENT PLAN<br />
Open Space – DIF<br />
OPEN SPACE<br />
DIF FUND<br />
This category includes development impact fees paid by developers for new or expanded<br />
infrastructure related to open space and multiuse trails that are needed as a result <strong>of</strong> new<br />
residential developments within <strong>city</strong> limits.<br />
For FY 20<strong>12</strong>, carryover funding will be used for trail/walkway improvements to accommodate<br />
increased use by residents from new and/or growing residential developments. Funding also is<br />
available for similar improvements specifically for Discovery and Pasadena Parks.<br />
Project Name: Discovery Park<br />
Source: DIF<br />
Fund #: 1520<br />
Project #: 70453<br />
Project Name: Pasadena Park<br />
Source: DIF<br />
Fund #: 1520<br />
Project #: 70454<br />
383<br />
Return to CIP TOC
FY 20<strong>12</strong> - 2021 Capital Improvement Plan<br />
Fund and Project Summary<br />
1520 - DIF-Citywide Open Space Category: DIF<br />
FY 20<strong>12</strong>: FY 2013: FY 2014: FY 2015: FY 2016: FYs 17-21:<br />
Estimated Beginning Balance: $419,629 $290,606 $331,069 $374,957 $417,562 $507,932<br />
Revenue<br />
Development Impact Fees 84,903 85,328 86,181 87,043 87,913 437,391<br />
Interest Income 1,547 1,351 1,707 1,911 2,457 9,828<br />
Total Revenue:<br />
86,450 86,679 87,888 88,954 90,370 447,219<br />
Project Expenses Carryover New Funding<br />
Existing Assets<br />
Improvement <strong>of</strong> Existing Assets<br />
70452 Park Improvements - City Wide 33,<strong>12</strong>8 0 0 0 0 0 0<br />
70453 Discovery Park<br />
92,966 21,000 21,000 21,000 21,000 0 35,000<br />
70454 Pasadena Park<br />
45,379 23,000 23,000 23,000 23,000 0 45,000<br />
Replacement <strong>of</strong> Existing Assets<br />
70450 DIF Update<br />
0 0 2,216 0 2,350 0 5,140<br />
Sub-Total - Existing Assets 171,473 44,000 46,216 44,000 46,350 0 85,140<br />
Total Project Expenses:<br />
171,473 44,000 46,216 44,000 46,350 0 85,140<br />
Total FY 20<strong>12</strong> Funding:<br />
215,473<br />
Estimated Ending Balance: $290,606 $331,069 $374,957 $417,562 $507,932 $870,011<br />
*New Project<br />
384<br />
Return to CIP TOC
FY 20<strong>12</strong>-2021 Capital Improvement Plan<br />
Capital Project Expenses Detail<br />
1520 - DIF-Citywide Open Space Category: DIF<br />
Project: 70452 - Park Improvements - City Wide (I) Funding Source:<br />
Development Impact Fees<br />
Project Description:<br />
Develop and update parks <strong>city</strong>wide to accommodate growth per the Parks and Recreation 2002 Master Plan.<br />
Funding will be used to develop facilities and parks to accommodate increased use by residents from new or<br />
growing residential developments. Examples <strong>of</strong> improvements may include playgrounds, ball fields, ramadas, etc.<br />
Capital Costs: FY 20<strong>12</strong> FY 2013 FY 2014 FY 2015 FY 2016 FYs 17-21<br />
FY 20<strong>12</strong> Carryover<br />
$33,<strong>12</strong>8 $0 $0 $0 $0 $0<br />
TOTAL $33,<strong>12</strong>8 $0 $0 $0 $0 $0<br />
Operating Description:<br />
No additional O and M is needed.<br />
Project: 70453 - Discovery Park (I) Funding Source:<br />
Development Impact Fees<br />
Project Description:<br />
The project will create new amenities and infrastructure related to open space. Potential improvements include<br />
additional trails in the park and trail connections to the adjacent neighborhoods. Other improvements may<br />
include picnic ramadas, shaded rest areas, drinking fountains, enhanced open play areas, playground or<br />
exercise equipment, and other trail amenities and site improvements that address growth within the <strong>city</strong>.<br />
Capital Costs: FY 20<strong>12</strong> FY 2013 FY 2014 FY 2015 FY 2016 FYs 17-21<br />
Construction $18,071 $18,071 $18,071 $18,071 $0 $30,118<br />
Engineering Charges $1,193 $1,193 $1,193 $1,193 $0 $1,988<br />
Arts $181 $181 $181 $181 $0 $301<br />
Contingency $1,555 $1,555 $1,555 $1,555 $0 $2,593<br />
Sub-Total New Funding $21,000 $21,000 $21,000 $21,000 $0 $35,000<br />
FY 20<strong>12</strong> Carryover<br />
$92,966 $0 $0 $0 $0 $0<br />
TOTAL $113,966 $21,000 $21,000 $21,000 $0 $35,000<br />
Operating Description:<br />
No additional O and M is needed at this time.<br />
Project: 70454 - Pasadena Park (I) Funding Source:<br />
Development Impact Fees<br />
Project Description:<br />
The project will create new amenities and infrastructure related to open space. The most likely improvement<br />
includes connections to adjacent sidewalks in the park and trail connections to the current and future<br />
neighborhoods. Other improvements or additions may include picnic ramadas, shaded rest areas, drinking<br />
fountains, enhanced open play areas, playground or exercise equipment, and other trail amenities and site<br />
improvements that address growth within the <strong>city</strong>.<br />
Capital Costs: FY 20<strong>12</strong> FY 2013 FY 2014 FY 2015 FY 2016 FYs 17-21<br />
Construction $19,792 $19,792 $19,792 $19,792 $0 $38,724<br />
Engineering Charges $1,306 $1,306 $1,306 $1,306 $0 $2,556<br />
Arts $198 $198 $198 $198 $0 $387<br />
Contingency $1,704 $1,704 $1,704 $1,704 $0 $3,333<br />
Sub-Total New Funding $23,000 $23,000 $23,000 $23,000 $0 $45,000<br />
FY 20<strong>12</strong> Carryover<br />
$45,379 $0 $0 $0 $0 $0<br />
TOTAL $68,379 $23,000 $23,000 $23,000 $0 $45,000<br />
Operating Description:<br />
No additional O and M is needed at this time.<br />
* New Project<br />
N=New Asset, R=Replacement <strong>of</strong> Existing Asset, I=Improvement <strong>of</strong> Existing Asset<br />
385<br />
Return to CIP TOC
FY 20<strong>12</strong>-2021 Capital Improvement Plan<br />
Capital Project Expenses Detail<br />
1520 - DIF-Citywide Open Space Category: DIF<br />
Project: 70450 - DIF Update (R) Funding Source:<br />
Development Impact Fees<br />
Project Description:<br />
The Development Impact Fee (DIF) Report should be updated every two years to adjust the fees based on<br />
current level <strong>of</strong> service for additional infrastructure needs related to new growth throughout the <strong>city</strong>. This is the<br />
<strong>city</strong>wide open space and trails portion <strong>of</strong> the cost to update the report.<br />
Capital Costs: FY 20<strong>12</strong> FY 2013 FY 2014 FY 2015 FY 2016 FYs 17-21<br />
Miscellaneous/Other $0 $2,216 $0 $2,350 $0 $5,140<br />
TOTAL $0 $2,216 $0 $2,350 $0 $5,140<br />
Operating Description:<br />
No O and M is needed.<br />
* New Project<br />
N=New Asset, R=Replacement <strong>of</strong> Existing Asset, I=Improvement <strong>of</strong> Existing Asset<br />
386<br />
Return to CIP TOC
20<strong>12</strong>-2021 CAPITAL IMPROVEMENT PLAN<br />
Parks & Recreation – DIF<br />
PARKS & RECREATION<br />
DIF FUNDS<br />
This category includes development impact fees paid by developers for new or expanded park<br />
infrastructure that is needed because <strong>of</strong> new residential developments within <strong>city</strong> limits.<br />
The majority <strong>of</strong> park impact fee revenue is restricted for use in specific areas, as defined below:<br />
• DIF Citywide Parks: Eligible for use <strong>city</strong>wide.<br />
• DIF Citywide Rec Fac: Eligible for use <strong>city</strong>wide on recreation facilities.<br />
• DIF Parks Dev Zone 1: Restricted to areas west <strong>of</strong> 75 th Avenue, south <strong>of</strong> Greenway Road.<br />
• DIF Parks Dev Zone 2: Restricted to areas east <strong>of</strong> 75 th Avenue, south <strong>of</strong> Greenway Road.<br />
• DIF Parks Dev Zone 3: Restricted to areas north <strong>of</strong> Greenway Road.<br />
Continuing through FY 2019, the existing funds in the DIF-Citywide Recreation Facility Fund<br />
will cover a portion <strong>of</strong> the debt service payments attributed to growth for the Foothills<br />
Recreation and Aquatic Center.<br />
Also in FY 20<strong>12</strong>, carryover funding will be used for: the completion <strong>of</strong> a neighborhood, joint-use<br />
park at 79 th Avenue and Orangewood to serve residents within a one-mile radius per the Park’s<br />
2002 Master Plan in Zone 1; growth related improvements to Paseo Linear Park in Zone 2; and<br />
the addition <strong>of</strong> kiosks at Thunderbird Conservation Park in Zone 3.<br />
Project Name: Thunderbird Park Kiosks<br />
Source: DIF<br />
Fund #: 1580<br />
Project #: 73704<br />
387<br />
Return to CIP TOC
FY 20<strong>12</strong> - 2021 Capital Improvement Plan<br />
Fund and Project Summary<br />
1460 - DIF-Citywide Parks Category: DIF<br />
FY 20<strong>12</strong>: FY 2013: FY 2014: FY 2015: FY 2016: FYs 17-21:<br />
Estimated Beginning Balance: $193,863 $229,557 $263,360 $300,020 $334,853 $372,742<br />
Revenue<br />
Development Impact Fees 34,762 34,936 35,285 35,638 35,994 179,081<br />
Interest Income 932 1,083 1,375 1,546 1,895 7,578<br />
Total Revenue:<br />
35,694 36,019 36,660 37,184 37,889 186,659<br />
Project Expenses Carryover New Funding<br />
Existing Assets<br />
Replacement <strong>of</strong> Existing Assets<br />
72502 DIF Update<br />
0 0 2,216 0 2,350 0 5,140<br />
Sub-Total - Existing Assets 0<br />
0 2,216 0 2,350 0 5,140<br />
Total Project Expenses:<br />
0 0 2,216 0 2,350 0 5,140<br />
Total FY 20<strong>12</strong> Funding:<br />
0<br />
Estimated Ending Balance: $229,557 $263,360 $300,020 $334,853 $372,742 $554,261<br />
*New Project<br />
388<br />
Return to CIP TOC
FY 20<strong>12</strong>-2021 Capital Improvement Plan<br />
Capital Project Expenses Detail<br />
1460 - DIF-Citywide Parks Category: DIF<br />
Project: 72502 - DIF Update (R) Funding Source:<br />
Development Impact Fees<br />
Project Description:<br />
The Development Impact Fee (DIF) Report should be updated every two years to adjust the fees based on<br />
current level <strong>of</strong> service for additional infrastructure needs related to new growth throughout the <strong>city</strong>. This is the<br />
<strong>city</strong>wide parks portion <strong>of</strong> the cost to update the report.<br />
Capital Costs: FY 20<strong>12</strong> FY 2013 FY 2014 FY 2015 FY 2016 FYs 17-21<br />
Miscellaneous/Other $0 $2,216 $0 $2,350 $0 $5,140<br />
TOTAL $0 $2,216 $0 $2,350 $0 $5,140<br />
Operating Description:<br />
No O and M is needed.<br />
* New Project<br />
N=New Asset, R=Replacement <strong>of</strong> Existing Asset, I=Improvement <strong>of</strong> Existing Asset<br />
389<br />
Return to CIP TOC
FY 20<strong>12</strong> - 2021 Capital Improvement Plan<br />
Fund and Project Summary<br />
1480 - DIF-Citywide Rec Facility Category: DIF<br />
FY 20<strong>12</strong>: FY 2013: FY 2014: FY 2015: FY 2016: FYs 17-21:<br />
Estimated Beginning Balance: $1,354,<strong>12</strong>0 $1,189,275 $1,022,315 $857,322 $689,498 $523,000<br />
Revenue<br />
Development Impact Fees 37,310 37,497 37,872 38,251 38,634 192,211<br />
Interest Income 6,613 6,276 6,430 5,989 5,843 11,686<br />
Total Revenue:<br />
Operating Expenses<br />
43,923 43,773 44,302 44,240 44,477 203,897<br />
Bond Interest** 61,017 55,108 48,971 42,157 35,246 55,415<br />
Bond Principal** 147,751 153,409 160,325 167,556 175,729 575,600<br />
Total Operating Expenses:<br />
208,768 208,517 209,296 209,713 210,975 631,015<br />
Project Expenses Carryover New Funding<br />
Existing Assets<br />
Replacement <strong>of</strong> Existing Assets<br />
72801 DIF Update<br />
0 0 2,216 0 2,350 0 5,140<br />
Sub-Total - Existing Assets 0<br />
0 2,216 0 2,350 0 5,140<br />
Total Project Expenses:<br />
0 0 2,216 0 2,350 0 5,140<br />
Total FY 20<strong>12</strong> Funding:<br />
0<br />
Estimated Ending Balance: $1,189,275 $1,022,315 $857,322 $689,498 $523,000 $90,742<br />
*New Project<br />
**Debt payment for bond sales for Foothills Recreation & Aquatic Center (2004).<br />
390<br />
Return to CIP TOC
FY 20<strong>12</strong>-2021 Capital Improvement Plan<br />
Capital Project Expenses Detail<br />
1480 - DIF-Citywide Rec Facility Category: DIF<br />
Project: 72801 - DIF Update (R) Funding Source:<br />
Development Impact Fees<br />
Project Description:<br />
The Development Impact Fee (DIF) Report should be updated every two years to adjust the fees based on<br />
current level <strong>of</strong> service for additional infrastructure needs related to new growth throughout the <strong>city</strong>. This is the<br />
<strong>city</strong>wide recreation facilities portion <strong>of</strong> the cost to update the report.<br />
Capital Costs: FY 20<strong>12</strong> FY 2013 FY 2014 FY 2015 FY 2016 FYs 17-21<br />
Miscellaneous/Other $0 $2,216 $0 $2,350 $0 $5,140<br />
TOTAL $0 $2,216 $0 $2,350 $0 $5,140<br />
Operating Description:<br />
No O and M is needed.<br />
* New Project<br />
N=New Asset, R=Replacement <strong>of</strong> Existing Asset, I=Improvement <strong>of</strong> Existing Asset<br />
391<br />
Return to CIP TOC
FY 20<strong>12</strong> - 2021 Capital Improvement Plan<br />
Fund and Project Summary<br />
1540 - DIF-Park Dev Zone 1 Category: DIF<br />
FY 20<strong>12</strong>: FY 2013: FY 2014: FY 2015: FY 2016: FYs 17-21:<br />
Estimated Beginning Balance: $108,479 $89,062 $107,156 $<strong>12</strong>7,807 $146,404 $167,727<br />
Revenue<br />
Development Impact Fees 19,779 19,878 20,077 20,278 20,481 101,897<br />
Interest Income 436 432 574 669 842 3,369<br />
Total Revenue:<br />
20,215 20,310 20,651 20,947 21,323 105,266<br />
Project Expenses Carryover New Funding<br />
Existing Assets<br />
Improvement <strong>of</strong> Existing Assets<br />
73104 79th Ave & Orangewood<br />
39,632 0 0 0 0 0 0<br />
Replacement <strong>of</strong> Existing Assets<br />
73102 DIF Update<br />
0 0 2,216 0 2,350 0 5,140<br />
Sub-Total - Existing Assets 39,632<br />
0 2,216 0 2,350 0 5,140<br />
Total Project Expenses:<br />
39,632 0 2,216 0 2,350 0 5,140<br />
Total FY 20<strong>12</strong> Funding:<br />
39,632<br />
Estimated Ending Balance: $89,062 $107,156 $<strong>12</strong>7,807 $146,404 $167,727 $267,853<br />
*New Project<br />
392<br />
Return to CIP TOC
FY 20<strong>12</strong>-2021 Capital Improvement Plan<br />
Capital Project Expenses Detail<br />
1540 - DIF-Park Dev Zone 1 Category: DIF<br />
Project: 73104 - 79th Ave & Orangewood (I) Funding Source:<br />
Development Impact Fees<br />
Project Description:<br />
Final phase for development <strong>of</strong> a 10 acre joint-use neighborhood park that will include pathway, park lighting,<br />
ramadas, landscape and irrigation. Additional funding to support this project is included in park project 2060-<br />
70523. The school and the joint-use park were constructed to address the growth in the area and the increasing<br />
student enrollment taking place in the neighboring schools in the Glendale Elementary School District. The<br />
service area <strong>of</strong> where the joint-use park was constructed is still without a neighborhood ramada and concrete<br />
walkways. The ramada, concrete pathway, and surrounding ground stabilization is highest priority. The closest<br />
ramada is outside the one mile service radius for this park.<br />
Capital Costs: FY 20<strong>12</strong> FY 2013 FY 2014 FY 2015 FY 2016 FYs 17-21<br />
FY 20<strong>12</strong> Carryover<br />
$39,632 $0 $0 $0 $0 $0<br />
TOTAL $39,632 $0 $0 $0 $0 $0<br />
Operating Description:<br />
No additional O and M is needed for this project. Ramada cleaning would simply be incorporated into the park<br />
maintenance routine.<br />
Project: 73102 - DIF Update (R) Funding Source:<br />
Development Impact Fees<br />
Project Description:<br />
The Development Impact Fee (DIF) Report should be updated every two years to adjust the fees based on<br />
current level <strong>of</strong> service for additional infrastructure needs related to new growth throughout the <strong>city</strong>. This is the<br />
neighborhood parks zone 1 portion <strong>of</strong> the cost to update the report.<br />
Capital Costs: FY 20<strong>12</strong> FY 2013 FY 2014 FY 2015 FY 2016 FYs 17-21<br />
Miscellaneous/Other $0 $2,216 $0 $2,350 $0 $5,140<br />
TOTAL $0 $2,216 $0 $2,350 $0 $5,140<br />
Operating Description:<br />
No O and M is needed.<br />
* New Project<br />
N=New Asset, R=Replacement <strong>of</strong> Existing Asset, I=Improvement <strong>of</strong> Existing Asset<br />
393<br />
Return to CIP TOC
FY 20<strong>12</strong> - 2021 Capital Improvement Plan<br />
Fund and Project Summary<br />
1560 - DIF-Park Dev Zone 2 Category: DIF<br />
FY 20<strong>12</strong>: FY 2013: FY 2014: FY 2015: FY 2016: FYs 17-21:<br />
Estimated Beginning Balance: $173,002 $44,477 $46,400 $50,671 $58,318 $68,488<br />
Revenue<br />
Development Impact Fees 9,485 9,532 9,627 9,723 9,820 48,858<br />
Interest Income 496 207 245 274 349 1,398<br />
Total Revenue:<br />
9,981 9,739 9,872 9,997 10,169 50,256<br />
Project Expenses Carryover New Funding<br />
Existing Assets<br />
Improvement <strong>of</strong> Existing Assets<br />
73400 Park Improvements/Enhance<br />
105,506 0 0 0 0 0 0<br />
73404 Paseo Linear Park Additions<br />
18,000 15,000 5,600 5,600 0 0 0<br />
Replacement <strong>of</strong> Existing Assets<br />
73403 DIF Update<br />
0 0 2,216 0 2,350 0 5,140<br />
Sub-Total - Existing Assets <strong>12</strong>3,506 15,000 7,816 5,600 2,350 0 5,140<br />
Total Project Expenses:<br />
<strong>12</strong>3,506 15,000 7,816 5,600 2,350 0 5,140<br />
Total FY 20<strong>12</strong> Funding:<br />
138,506<br />
Estimated Ending Balance: $44,477 $46,400 $50,671 $58,318 $68,488 $113,604<br />
*New Project<br />
394<br />
Return to CIP TOC
FY 20<strong>12</strong>-2021 Capital Improvement Plan<br />
Capital Project Expenses Detail<br />
1560 - DIF-Park Dev Zone 2 Category: DIF<br />
Project: 73400 - Park Improvements/Enhance (I) Funding Source:<br />
Development Impact Fees<br />
Project Description:<br />
The currrent Parks and Recreation Master Plan identiifies action strategies to develop, enhance and improve<br />
parks between Greenway Road and Olive Avenue, and 51st Avenue and 73rd Avenue, that have been impacted<br />
by community growth.<br />
Capital Costs: FY 20<strong>12</strong> FY 2013 FY 2014 FY 2015 FY 2016 FYs 17-21<br />
FY 20<strong>12</strong> Carryover<br />
$105,506 $0 $0 $0 $0 $0<br />
TOTAL $105,506 $0 $0 $0 $0 $0<br />
Operating Description:<br />
No additional O and M is needed for these projects.<br />
Project: 73404 - Paseo Linear Park Additions (I) Funding Source:<br />
Development Impact Fees<br />
Project Description:<br />
Additional amenities consist <strong>of</strong> accommodating community growth by adding active recreation elements, such as<br />
playground equipment, shade structures or exercise equipment stations that are growth related into Paseo<br />
Linear Park.<br />
Capital Costs: FY 20<strong>12</strong> FY 2013 FY 2014 FY 2015 FY 2016 FYs 17-21<br />
Contingency $1,111 $415 $415 $0 $0 $0<br />
Miscellaneous/Other $13,889 $5,185 $5,185 $0 $0 $0<br />
Sub-Total New Funding $15,000 $5,600 $5,600 $0 $0 $0<br />
FY 20<strong>12</strong> Carryover<br />
$18,000 $0 $0 $0 $0 $0<br />
TOTAL $33,000 $5,600 $5,600 $0 $0 $0<br />
Operating Description:<br />
No additional O and M is need for this project.<br />
Project: 73403 - DIF Update (R) Funding Source:<br />
Development Impact Fees<br />
Project Description:<br />
The Development Impact Fee (DIF) Report should be updated every two years to adjust the fees based on<br />
current level <strong>of</strong> service for additional infrastructure needs related to new growth throughout the <strong>city</strong>. This is the<br />
neighborhood parks zone 2 portion <strong>of</strong> the cost to update the report.<br />
Capital Costs: FY 20<strong>12</strong> FY 2013 FY 2014 FY 2015 FY 2016 FYs 17-21<br />
Miscellaneous/Other $0 $2,216 $0 $2,350 $0 $5,140<br />
TOTAL $0 $2,216 $0 $2,350 $0 $5,140<br />
Operating Description:<br />
No O and M is needed.<br />
* New Project<br />
N=New Asset, R=Replacement <strong>of</strong> Existing Asset, I=Improvement <strong>of</strong> Existing Asset<br />
395<br />
Return to CIP TOC
FY 20<strong>12</strong> - 2021 Capital Improvement Plan<br />
Fund and Project Summary<br />
1580 - DIF-Park Dev Zone 3 Category: DIF<br />
FY 20<strong>12</strong>: FY 2013: FY 2014: FY 2015: FY 2016: FYs 17-21:<br />
Estimated Beginning Balance: $38,379 $8,457 $3,458 $0 $217 $2,810<br />
Revenue<br />
Development Impact Fees 1,851 2,517 2,542 2,567 2,593 <strong>12</strong>,899<br />
Interest Income 131 0 0 0 0 4<br />
Total Revenue:<br />
1,982 2,517 2,542 2,567 2,593 <strong>12</strong>,903<br />
Project Expenses Carryover New Funding<br />
Existing Assets<br />
Improvement <strong>of</strong> Existing Assets<br />
73700 Park Enhancements/Ren<br />
6,905 0 0 0 0 0 0<br />
73704 Thunderbird Park Kiosks<br />
5,000 19,999 5,300 6,000 0 0 0<br />
Replacement <strong>of</strong> Existing Assets<br />
73702 DIF Update<br />
0 0 2,216 0 2,350 0 5,140<br />
Sub-Total - Existing Assets 11,905 19,999 7,516 6,000 2,350 0 5,140<br />
Total Project Expenses:<br />
11,905 19,999 7,516 6,000 2,350 0 5,140<br />
Total FY 20<strong>12</strong> Funding:<br />
31,904<br />
Estimated Ending Balance: $8,457 $3,458 $0 $217 $2,810 $10,573<br />
*New Project<br />
396<br />
Return to CIP TOC
FY 20<strong>12</strong>-2021 Capital Improvement Plan<br />
Capital Project Expenses Detail<br />
1580 - DIF-Park Dev Zone 3 Category: DIF<br />
Project: 73700 - Park Enhancements/Ren (I) Funding Source:<br />
Development Impact Fees<br />
Project Description:<br />
Growth related enhancements to parks in Park Zone 3 (north <strong>of</strong> Greenway Road). Current plans are to make<br />
growth related enhancements to Thunderbird Conservation Park or other Zone 3 parks when funds become<br />
available.<br />
Capital Costs: FY 20<strong>12</strong> FY 2013 FY 2014 FY 2015 FY 2016 FYs 17-21<br />
FY 20<strong>12</strong> Carryover<br />
$6,905 $0 $0 $0 $0 $0<br />
TOTAL $6,905 $0 $0 $0 $0 $0<br />
Operating Description:<br />
No additional O and M is needed for these projects.<br />
Project: 73704 - Thunderbird Park Kiosks (I) Funding Source:<br />
Development Impact Fees<br />
Project Description:<br />
Increased usage <strong>of</strong> Thunderbird Conservation Park due to growth is requiring the construction <strong>of</strong> trail head<br />
informational kiosks in the park. Kiosks will provide trail users with information about wildlife in the park,<br />
maintenance notifications and trail lengths/difficulty/elevations.<br />
Capital Costs: FY 20<strong>12</strong> FY 2013 FY 2014 FY 2015 FY 2016 FYs 17-21<br />
Contingency $1,481 $393 $444 $0 $0 $0<br />
Miscellaneous/Other $18,518 $4,907 $5,556 $0 $0 $0<br />
Sub-Total New Funding $19,999 $5,300 $6,000 $0 $0 $0<br />
FY 20<strong>12</strong> Carryover<br />
$5,000 $0 $0 $0 $0 $0<br />
TOTAL $24,999 $5,300 $6,000 $0 $0 $0<br />
Operating Description:<br />
No additional O and M is need for this project.<br />
Project: 73702 - DIF Update (R) Funding Source:<br />
Development Impact Fees<br />
Project Description:<br />
The Development Impact Fee (DIF) Report should be updated every two years to adjust the fees based on<br />
current level <strong>of</strong> service for additional infrastructure needs related to new growth throughout the <strong>city</strong>. This is the<br />
neighborhood parks zone 3 portion <strong>of</strong> the cost to update the report.<br />
Capital Costs: FY 20<strong>12</strong> FY 2013 FY 2014 FY 2015 FY 2016 FYs 17-21<br />
Miscellaneous/Other $0 $2,216 $0 $2,350 $0 $5,140<br />
TOTAL $0 $2,216 $0 $2,350 $0 $5,140<br />
Operating Description:<br />
No O and M is needed.<br />
* New Project<br />
N=New Asset, R=Replacement <strong>of</strong> Existing Asset, I=Improvement <strong>of</strong> Existing Asset<br />
397<br />
Return to CIP TOC
20<strong>12</strong>-2021 CAPITAL IMPROVEMENT PLAN<br />
Library – DIF<br />
LIBRARY<br />
DIF FUNDS<br />
This category includes development impact fees paid by developers for new or expanded library<br />
infrastructure that is needed due to new residential developments within <strong>city</strong> limits.<br />
Impact fees in this category are used <strong>annual</strong>ly for the purchase <strong>of</strong> additional library materials due<br />
to residential growth. A portion <strong>of</strong> the design and construction <strong>of</strong> a new branch library in the<br />
western area <strong>of</strong> Glendale, which is now planned for the last five years <strong>of</strong> the capital plan, will be<br />
covered with development impact fee revenue. Funding has also been set aside for the DIF study<br />
to update the <strong>city</strong>’s development impact fees starting in FY 2013.<br />
Project Name: Library Books – Pop. Growth<br />
Funding Source: DIF<br />
Fund #: 1500<br />
Project #: 74751<br />
398<br />
Return to CIP TOC
FY 20<strong>12</strong> - 2021 Capital Improvement Plan<br />
Fund and Project Summary<br />
1380 - DIF-Library Buildings Category: DIF<br />
FY 20<strong>12</strong>: FY 2013: FY 2014: FY 2015: FY 2016: FYs 17-21:<br />
Estimated Beginning Balance: $1,730,860 $1,738,916 $1,746,991 $1,755,958 $1,764,948 $1,774,844<br />
Revenue<br />
Interest Income 8,056 8,075 8,967 8,990 9,896 19,791<br />
Total Revenue:<br />
8,056 8,075 8,967 8,990 9,896 19,791<br />
Project Expenses Carryover New Funding<br />
New Assets<br />
74250 West Branch Library<br />
0 0 0 0 0 0 1,609,288<br />
Sub-Total - New Assets 0<br />
0 0 0 0 0 1,609,288<br />
Total Project Expenses:<br />
0 0 0 0 0 0 1,609,288<br />
Total FY 20<strong>12</strong> Funding:<br />
0<br />
Estimated Ending Balance: $1,738,916 $1,746,991 $1,755,958 $1,764,948 $1,774,844 $185,347<br />
*New Project<br />
399<br />
Return to CIP TOC
FY 20<strong>12</strong>-2021 Capital Improvement Plan<br />
Capital Project Expenses Detail<br />
1380 - DIF-Library Buildings Category: DIF<br />
Project: 74250 - West Branch Library (N) Funding Source:<br />
Development Impact Fees<br />
Project Description:<br />
Design and construction <strong>of</strong> a 33,500 sq ft facility on approximately 7 acres <strong>of</strong> land at the Western Area Regional<br />
Facility site. Necessary equipment for the operation <strong>of</strong> the library includes a 3M theft detection system, gates,<br />
self checks, Radio Frequency Identification Technology, a fire alarm system and a burglar alarm with motion<br />
sensor and cameras.<br />
Capital Costs: FY 20<strong>12</strong> FY 2013 FY 2014 FY 2015 FY 2016 FYs 17-21<br />
Design $0 $0 $0 $0 $0 $1,313,132<br />
Construction $0 $0 $0 $0 $0 $284,032<br />
Engineering Charges $0 $0 $0 $0 $0 $9,284<br />
Arts $0 $0 $0 $0 $0 $2,840<br />
TOTAL $0 $0 $0 $0 $0 $1,609,288<br />
Operating Description:<br />
Refer to Library Project No. 2160-74000 for O and M impact.<br />
* New Project<br />
N=New Asset, R=Replacement <strong>of</strong> Existing Asset, I=Improvement <strong>of</strong> Existing Asset<br />
400<br />
Return to CIP TOC
FY 20<strong>12</strong> - 2021 Capital Improvement Plan<br />
Fund and Project Summary<br />
1500 - DIF-Libraries Category: DIF<br />
FY 20<strong>12</strong>: FY 2013: FY 2014: FY 2015: FY 2016: FYs 17-21:<br />
Estimated Beginning Balance: $3,220,771 $3,017,482 $2,873,045 $2,743,171 $2,599,061 $2,470,130<br />
Revenue<br />
Development Impact Fees 55,146 55,422 55,976 56,536 57,101 284,093<br />
Interest Income 14,230 13,406 14,150 13,426 13,969 27,937<br />
Total Revenue:<br />
69,376 68,828 70,<strong>12</strong>6 69,962 71,070 3<strong>12</strong>,030<br />
Project Expenses Carryover New Funding<br />
Existing Assets<br />
Replacement <strong>of</strong> Existing Assets<br />
74752 DIF Update<br />
0 0 13,265 0 14,073 0 30,769<br />
Sub-Total - Existing Assets 0<br />
0 13,265 0 14,073 0 30,769<br />
New Assets<br />
74750 West Branch Library/Books<br />
0 0 0 0 0 0 1,953,490<br />
74751 Library Books - Pop. Growth<br />
72,665 200,000 200,000 200,000 200,000 200,000 500,000<br />
Sub-Total - New Assets 72,665 200,000 200,000 200,000 200,000 200,000 2,453,490<br />
Total Project Expenses:<br />
72,665 200,000 213,265 200,000 214,073 200,000 2,484,259<br />
Total FY 20<strong>12</strong> Funding:<br />
272,665<br />
Estimated Ending Balance: $3,017,482 $2,873,045 $2,743,171 $2,599,061 $2,470,130 $297,901<br />
*New Project<br />
401<br />
Return to CIP TOC
FY 20<strong>12</strong>-2021 Capital Improvement Plan<br />
Capital Project Expenses Detail<br />
1500 - DIF-Libraries Category: DIF<br />
Project: 74752 - DIF Update (R) Funding Source:<br />
Development Impact Fees<br />
Project Description:<br />
The Development Impact Fee (DIF) Report should be updated every two years to adjust the fees based on<br />
current level <strong>of</strong> service for additional infrastructure needs related to new growth throughout the <strong>city</strong>. This is the<br />
library portion <strong>of</strong> the cost to update the report.<br />
Capital Costs: FY 20<strong>12</strong> FY 2013 FY 2014 FY 2015 FY 2016 FYs 17-21<br />
Miscellaneous/Other $0 $13,265 $0 $14,073 $0 $30,769<br />
TOTAL $0 $13,265 $0 $14,073 $0 $30,769<br />
Operating Description:<br />
No O and M is needed.<br />
Project: 74750 - West Branch Library/Books (N) Funding Source:<br />
Development Impact Fees<br />
Project Description:<br />
Request is for funding to construct a branch library and to purchase materials to serve the western portion <strong>of</strong> the<br />
<strong>city</strong>. Design and construction <strong>of</strong> a 33,500 sq ft facility on approximately 7 acres <strong>of</strong> land at the Western Area<br />
Regional Facility site.<br />
Capital Costs: FY 20<strong>12</strong> FY 2013 FY 2014 FY 2015 FY 2016 FYs 17-21<br />
Design $0 $0 $0 $0 $0 $334,606<br />
Construction $0 $0 $0 $0 $0 $1,532,703<br />
IT/Phone/Security $0 $0 $0 $0 $0 $60,000<br />
Engineering Charges $0 $0 $0 $0 $0 $10,854<br />
Arts $0 $0 $0 $0 $0 $15,327<br />
TOTAL $0 $0 $0 $0 $0 $1,953,490<br />
Operating Description:<br />
Refer to Library Project No. 2160-74000 for O and M impact.<br />
Project: 74751 - Library Books - Pop. Growth (N) Funding Source:<br />
Development Impact Fees<br />
Project Description:<br />
Request is for funds to continue the phased-in approach <strong>of</strong> increasing the number <strong>of</strong> library <strong>book</strong>s related to the<br />
growth <strong>of</strong> the <strong>city</strong>.<br />
Capital Costs: FY 20<strong>12</strong> FY 2013 FY 2014 FY 2015 FY 2016 FYs 17-21<br />
Miscellaneous/Other $200,000 $200,000 $200,000 $200,000 $200,000 $500,000<br />
Sub-Total New Funding $200,000 $200,000 $200,000 $200,000 $200,000 $500,000<br />
FY 20<strong>12</strong> Carryover<br />
$72,665 $0 $0 $0 $0 $0<br />
TOTAL $272,665 $200,000 $200,000 $200,000 $200,000 $500,000<br />
Operating Description:<br />
No additional O and M is need for this project.<br />
* New Project<br />
N=New Asset, R=Replacement <strong>of</strong> Existing Asset, I=Improvement <strong>of</strong> Existing Asset<br />
402<br />
Return to CIP TOC
20<strong>12</strong>-2021 CAPITAL IMPROVEMENT PLAN<br />
Public Safety - DIF<br />
PUBLIC SAFETY<br />
DIF FUNDS<br />
This category includes development impact fees paid by developers for new or expanded public<br />
safety infrastructure that is needed because <strong>of</strong> new residential and commercial developments<br />
within <strong>city</strong> limits.<br />
FY <strong>2011</strong> was the last year that the Police and Fire DIF funds contributed to the debt service<br />
payments for the growth related aspect <strong>of</strong> the Gateway Public Safety Facility at 6261 North 83 rd<br />
Avenue in the western area <strong>of</strong> Glendale. Funding is set aside for the biennial development<br />
impact fee update. No other projects are planned at this time although potential eligible uses <strong>of</strong><br />
the remaining fund balance will be evaluated over the next FY.<br />
Debt Service: Gateway Public Safety Facility<br />
Funding Source: DIF<br />
Fund #’s: 1420 & 1440<br />
403<br />
Return to CIP TOC
FY 20<strong>12</strong> - 2021 Capital Improvement Plan<br />
Fund and Project Summary<br />
1440 - DIF-Police Dept Facilities Category: DIF<br />
FY 20<strong>12</strong>: FY 2013: FY 2014: FY 2015: FY 2016: FYs 17-21:<br />
Estimated Beginning Balance: $1,107,168 $1,159,410 $1,201,188 $1,255,189 $1,298,326 $1,354,436<br />
Revenue<br />
Development Impact Fees 46,534 46,767 47,235 47,707 48,184 48,666<br />
Interest Income 5,708 5,930 6,766 7,014 7,926 31,704<br />
Total Revenue:<br />
52,242 52,697 54,001 54,721 56,110 80,370<br />
Project Expenses Carryover New Funding<br />
Existing Assets<br />
Replacement <strong>of</strong> Existing Assets<br />
77300 DIF Update<br />
0 0 10,919 0 11,584 0 25,329<br />
Sub-Total - Existing Assets 0<br />
0 10,919 0 11,584 0 25,329<br />
Total Project Expenses:<br />
0 0 10,919 0 11,584 0 25,329<br />
Total FY 20<strong>12</strong> Funding:<br />
0<br />
Estimated Ending Balance: $1,159,410 $1,201,188 $1,255,189 $1,298,326 $1,354,436 $1,409,477<br />
*New Project<br />
404<br />
Return to CIP TOC
FY 20<strong>12</strong>-2021 Capital Improvement Plan<br />
Capital Project Expenses Detail<br />
1440 - DIF-Police Dept Facilities Category: DIF<br />
Project: 77300 - DIF Update (R) Funding Source:<br />
Development Impact Fees<br />
Project Description:<br />
The Development Impact Fee (DIF) Report should be updated every two years to adjust the fees based on<br />
current level <strong>of</strong> service for additional infrastructure needs related to new growth throughout the <strong>city</strong>. This is the<br />
police facilities portion <strong>of</strong> the cost to update the report.<br />
Capital Costs: FY 20<strong>12</strong> FY 2013 FY 2014 FY 2015 FY 2016 FYs 17-21<br />
Miscellaneous/Other $0 $10,919 $0 $11,584 $0 $25,329<br />
TOTAL $0 $10,919 $0 $11,584 $0 $25,329<br />
Operating Description:<br />
No O and M is needed.<br />
* New Project<br />
N=New Asset, R=Replacement <strong>of</strong> Existing Asset, I=Improvement <strong>of</strong> Existing Asset<br />
405<br />
Return to CIP TOC
FY 20<strong>12</strong> - 2021 Capital Improvement Plan<br />
Fund and Project Summary<br />
1420 - DIF-Fire Protection Facilities Category: DIF<br />
FY 20<strong>12</strong>: FY 2013: FY 2014: FY 2015: FY 2016: FYs 17-21:<br />
Estimated Beginning Balance: $0 $20,909 $31,<strong>12</strong>7 $53,525 $64,417 $88,260<br />
Revenue<br />
Development Impact Fees 20,909 21,014 21,224 21,436 21,650 107,716<br />
Interest Income 0 684 1,174 1,635 2,193 8,771<br />
Total Revenue:<br />
20,909 21,698 22,398 23,071 23,843 116,487<br />
Project Expenses Carryover New Funding<br />
Existing Assets<br />
Replacement <strong>of</strong> Existing Assets<br />
77001 DIF Update<br />
0 0 11,480 0 <strong>12</strong>,179 0 26,627<br />
Sub-Total - Existing Assets 0<br />
0 11,480 0 <strong>12</strong>,179 0 26,627<br />
Total Project Expenses:<br />
0 0 11,480 0 <strong>12</strong>,179 0 26,627<br />
Total FY 20<strong>12</strong> Funding:<br />
0<br />
Estimated Ending Balance: $20,909 $31,<strong>12</strong>7 $53,525 $64,417 $88,260 $178,<strong>12</strong>0<br />
*New Project<br />
406<br />
Return to CIP TOC
FY 20<strong>12</strong>-2021 Capital Improvement Plan<br />
Capital Project Expenses Detail<br />
1420 - DIF-Fire Protection Facilities Category: DIF<br />
Project: 77001 - DIF Update (R) Funding Source:<br />
Development Impact Fees<br />
Project Description:<br />
The Development Impact Fee (DIF) Report should be updated every two years to adjust the fees based on<br />
current level <strong>of</strong> service for additional infrastructure needs related to new growth throughout the <strong>city</strong>. This is the<br />
fire facilities portion <strong>of</strong> the cost to update the report.<br />
Capital Costs: FY 20<strong>12</strong> FY 2013 FY 2014 FY 2015 FY 2016 FYs 17-21<br />
Miscellaneous/Other $0 $11,480 $0 $<strong>12</strong>,179 $0 $26,627<br />
TOTAL $0 $11,480 $0 $<strong>12</strong>,179 $0 $26,627<br />
Operating Description:<br />
No O and M is needed.<br />
* New Project<br />
N=New Asset, R=Replacement <strong>of</strong> Existing Asset, I=Improvement <strong>of</strong> Existing Asset<br />
407<br />
Return to CIP TOC
20<strong>12</strong>-2021 CAPITAL IMPROVEMENT PLAN<br />
General Government - DIF<br />
GENERAL GOVERNMENT<br />
DIF FUND<br />
This category includes development impact fees paid by developers for new or expanded general<br />
government infrastructure that are needed because <strong>of</strong> new residential and commercial<br />
developments within <strong>city</strong> limits.<br />
Due to the slowdown in residential and commercial development, the General Government DIF<br />
Fund was only able to cover a portion <strong>of</strong> the last lease purchase payment in FY 2010 for the land<br />
for the future City Court Building along Glendale Avenue. Because <strong>of</strong> the resulting low fund<br />
balance and no projected increase in development, with the exception <strong>of</strong> biennial development<br />
impact fee update, no projects are currently identified under the General Government DIF Fund.<br />
Staff will evaluate how to best utilize available funds during preparation for the FY 2013-2022<br />
Capital Improvement Plan.<br />
Project Name: Land for City Court Building<br />
Funding Source: DIF<br />
Fund #: 1620<br />
Project #: 77752<br />
Note: The last lease purchase payment was in FY 2010.<br />
408<br />
Return to CIP TOC
FY 20<strong>12</strong> - 2021 Capital Improvement Plan<br />
Fund and Project Summary<br />
1620 - DIF-General Government Category: DIF<br />
FY 20<strong>12</strong>: FY 2013: FY 2014: FY 2015: FY 2016: FYs 17-21:<br />
Estimated Beginning Balance: $93,865 $188,255 $270,363 $366,421 $449,948 $548,359<br />
Revenue<br />
Development Impact Fees 94,320 94,792 95,740 96,697 97,664 485,902<br />
Interest Income 70 115 318 408 748 2,991<br />
Total Revenue:<br />
94,390 94,907 96,058 97,105 98,4<strong>12</strong> 488,893<br />
Project Expenses Carryover New Funding<br />
Existing Assets<br />
Replacement <strong>of</strong> Existing Assets<br />
77753 DIF Update<br />
0 0 <strong>12</strong>,799 0 13,578 0 29,687<br />
Sub-Total - Existing Assets 0<br />
0 <strong>12</strong>,799 0 13,578 0 29,687<br />
Total Project Expenses:<br />
0 0 <strong>12</strong>,799 0 13,578 0 29,687<br />
Total FY 20<strong>12</strong> Funding:<br />
0<br />
Estimated Ending Balance: $188,255 $270,363 $366,421 $449,948 $548,359 $1,007,565<br />
*New Project<br />
409<br />
Return to CIP TOC
FY 20<strong>12</strong>-2021 Capital Improvement Plan<br />
Capital Project Expenses Detail<br />
1620 - DIF-General Government Category: DIF<br />
Project: 77753 - DIF Update (R) Funding Source:<br />
Development Impact Fees<br />
Project Description:<br />
The Development Impact Fee (DIF) Report should be updated every two years to adjust the fees based on<br />
current level <strong>of</strong> service for additional infrastructure needs related to new growth throughout the <strong>city</strong>. This is the<br />
general government portion <strong>of</strong> the cost to update the report.<br />
Capital Costs: FY 20<strong>12</strong> FY 2013 FY 2014 FY 2015 FY 2016 FYs 17-21<br />
Miscellaneous/Other $0 $<strong>12</strong>,799 $0 $13,578 $0 $29,687<br />
TOTAL $0 $<strong>12</strong>,799 $0 $13,578 $0 $29,687<br />
Operating Description:<br />
No O and M is needed.<br />
* New Project<br />
N=New Asset, R=Replacement <strong>of</strong> Existing Asset, I=Improvement <strong>of</strong> Existing Asset<br />
410<br />
Return to CIP TOC
20<strong>12</strong>-2021 CAPITAL IMPROVEMENT PLAN<br />
Enterprise and Other Funds<br />
ENTERPRISE AND OTHER FUNDS<br />
This category <strong>of</strong> funds captures the capital expenses for the enterprise funds (water/sewer,<br />
landfill and sanitation), the designated sales tax fund for the GO transportation capital program,<br />
the fund designated for transportation capital grants from federal, the HURF bond fund, state and<br />
county government agencies, and a few other funds set up for specific purposes such as airport<br />
and civic center capital needs.<br />
The General Fund represents the <strong>city</strong>’s pay-as-you-go program (PAYGO). The Technology<br />
Infrastructure Fund was established to address the capital needs <strong>of</strong> major technology systems that<br />
are critical to <strong>city</strong> operations such as the PeopleS<strong>of</strong>t financial management system. Both the<br />
PAYGO and Technology Infrastructure Fund are funded with GF operating dollars.<br />
The Arts Commission Fund represents the program funded by the one percent for the arts<br />
program that the <strong>city</strong> administers. One percent <strong>of</strong> the construction costs <strong>of</strong> each capital project<br />
are allocated for this program.<br />
Fire<br />
Station<br />
151<br />
Note: Because these funds include both operating divisions and CIP projects,<br />
the fund summaries are limited to the project expenses only.<br />
Fund # - Name Carryover FY 20<strong>12</strong> FY 2013 FY 2014 FY 2015 FY 2016 FYs 17-21<br />
2360-Water & Sewer 4,427,688 7,250,000 750,000 2,580,720 4,389,700 9,792,030 53,921,823<br />
2400-Water 27,914,867 4,177,000 3,661,000 4,469,000 7,418,090 14,088,384 90,769,536<br />
2420-Sewer 4,494,114 4,918,480 5,984,973 6,378,552 16,394,116 26,773,149 39,911,243<br />
2210-Transportation Construction 31,183,100 8,321,290 8,608,921 8,581,328 8,438,738 4,580,989 22,985,155<br />
2000-HURF/Street Bonds 197,379 0 0 0 0 0 <strong>12</strong>,076,659<br />
1340 - HURF/Streets Fund 0 0 0 0 0 0 1,677,285<br />
1650-Transportation Grants 3,518,115 2,000,000 2,000,000 2,000,000 2,000,000 2,000,000 10,000,000<br />
2480-Sanitation 0 1,863,645 1,299,787 3,140,259 2,738,000 3,778,990 <strong>12</strong>,723,434<br />
2440-Landfill 492,901 1,237,740 2,018,202 15,350,131 5,953,730 9,379,879 7,983,017<br />
2<strong>12</strong>0-Airport Capital Grants 1,755,000 15,693,481 150,000 525,000 3,146,000 8,550,000 0<br />
1840-Other Federal & State Grants 811,252 2,000,000 2,000,000 2,000,000 2,000,000 2,000,000 10,000,000<br />
1000-General Fund 529,498 752,859 752,859 50,000 50,000 50,000 4,281,360<br />
1740-Civic Center 0 350,000 50,000 50,000 50,000 50,000 4,145,734<br />
2150-Technology Infrastructure 0 0 1,097,200 0 0 0 28,491,879<br />
<strong>12</strong>20-Arts Commission 0 500,000 500,000 500,000 500,000 500,000 1,750,000<br />
Total Enterprise/Other Funds $75,323,914 $49,064,495 $28,872,942 $45,624,990 $53,078,374 $81,543,421 $300,717,<strong>12</strong>5<br />
411<br />
Return to CIP TOC
20<strong>12</strong>-2021 CAPITAL IMPROVEMENT PLAN<br />
Water & Sewer - Enterprise Funds<br />
WATER & SEWER<br />
ENTERPRISE FUNDS<br />
Water and sewer capital projects account for the largest portion <strong>of</strong> current capital improvement<br />
plan. These projects will be funded from water/sewer fund revenues. The FY 20<strong>12</strong>-2021 <strong>budget</strong><br />
reflects recommendations from the Red Oak rate study completed in <strong>2011</strong>.<br />
The combined Water/Sewer Fund (2360) reflects continued and new funding in FY 20<strong>12</strong> for the<br />
expansion and enhancement <strong>of</strong> the <strong>city</strong>’s water reclamation facilities, the West Area Water<br />
Reclamation Facility and the Arrowhead Water Reclamation Facility.<br />
FY 20<strong>12</strong> for the Water Fund (2400) reflects carryover funding for the Zone 4 Groundwater<br />
Treatment Plant that will provide capa<strong>city</strong> <strong>of</strong> 10 million gallons per day (MGD) for the drinking<br />
water system. FY 20<strong>12</strong> also includes funding for <strong>city</strong>wide water line replacement and extensions<br />
where needed, Cholla Water Treatment Plant process improvements and the completion <strong>of</strong> a<br />
water line crossing at the New River.<br />
In FY 20<strong>12</strong>, the Sewer Fund (2420) projects include carryover and new funding for sewer line<br />
replacement and/or rehabilitation, as well as new funding for the continued expansion <strong>of</strong> the 91 st<br />
Avenue Wastewater Treatment Plan co-owned by the City <strong>of</strong> Phoenix and other valley cities.<br />
This project will expand the facility’s treatment capa<strong>city</strong> from 153 MGD to 250 MGD.<br />
Project Name: Oasis Water Campus<br />
Funding Source: Revenue Bond<br />
Fund #: 2400<br />
Project #: 61003<br />
4<strong>12</strong><br />
Return to CIP TOC
FY <strong>2011</strong> - 2020 Capital Improvement Program<br />
Capital Projects By Fund and Project Number<br />
2360 - Water & Sewer Category: Revenue<br />
Capital Project Expenses<br />
Carryover<br />
FY 20<strong>12</strong>: FY 2013: FY 2014: FY 2015: FY 2016: FYs 17-21:<br />
New Funding<br />
Existing Assets<br />
Improvement <strong>of</strong> Existing Assets<br />
60007 Arrwhd Wtr Reclam Fac Imps 4,283,654 6,500,000 750,000 750,000 3,000,000 5,000,000 0<br />
Replacement <strong>of</strong> Existing Assets<br />
60001 Water Quality Instruments 0<br />
0 0 0 58,000 350,000 335,000<br />
60009 West Area WRF Service Wtr Sys. 100,001 100,000 0 0 0 0 0<br />
T2250 WAWRF Clarifier Replacement 0<br />
0 0 277,770 0 0 0<br />
T2270 WAWRF Fine Screen Replacement 0<br />
0 0 752,950 0 0 0<br />
T2280 WAWRF Odor Control Replacement 0<br />
0 0 0 1,081,700 0 0<br />
T2282 Lab Data Management System 0 300,000 0 0 0 0 0<br />
T2283 Computerized Maint. Mgmt Sys. 0<br />
0 0 0 <strong>12</strong>5,000 3,000,000 5,000,000<br />
T2284 Radio Phase IV Equipment 0<br />
0 0 800,000 0 0 800,000<br />
Sub-Total - Existing Assets 4,383,655 6,900,000 750,000 2,580,720 4,264,700 8,350,000 6,135,000<br />
New Assets<br />
60008 WAWRF Phase IV 44,033 350,000 0 0 <strong>12</strong>5,000 1,442,030 47,786,823<br />
Sub-Total - New Assets 44,033 350,000 0 0 <strong>12</strong>5,000 1,442,030 47,786,823<br />
Total Project Expenses: $4,427,688<br />
Total FY 20<strong>12</strong> Funding: $11,677,688<br />
* New Project<br />
$7,250,000 $750,000 $2,580,720 $4,389,700 $9,792,030 $53,921,823<br />
413<br />
Return to CIP TOC
FY 20<strong>12</strong>-2021 Capital Improvement Plan<br />
Capital Project Expenses Detail<br />
2360 - Water & Sewer Category: Revenue<br />
Project: 60007 - Arrwhd Wtr Reclam Fac Imps (I) Funding Source:<br />
Water & Sewer Revenues<br />
Project Description:<br />
To ensure reliable and safe treatment <strong>of</strong> wastewater in the Arrowhead area and meet upcoming regulatory<br />
requirements, the treatment plant processes will be upgraded. This project will replace the aging sand filters and<br />
ultraviolet light disinfection system at the Arrowhead Ranch Water Reclamation Facility. This project will also<br />
include civil, mechanical, and electrical improvements. These improvements will enable the plant to consistently<br />
meet the A+ effluent water quality requirements and help assure personnel safety by meeting Occupational<br />
Safety and Health Administration (OSHA) standards.<br />
Capital Costs: FY 20<strong>12</strong> FY 2013 FY 2014 FY 2015 FY 2016 FYs 17-21<br />
Design $650,000 $140,000 $300,000 $800,000 $500,000 $0<br />
Construction $5,100,000 $521,000 $365,000 $1,830,000 $3,880,000 $0<br />
Finance Charges $86,250 $9,915 $9,975 $39,450 $65,700 $0<br />
Engineering Charges $46,944 $5,396 $5,429 $21,472 $35,759 $0<br />
Arts $51,000 $5,210 $3,650 $18,300 $38,800 $0<br />
Contingency $565,806 $68,479 $65,946 $290,778 $479,741 $0<br />
Sub-Total New Funding $6,500,000 $750,000 $750,000 $3,000,000 $5,000,000 $0<br />
FY 20<strong>12</strong> Carryover<br />
$4,283,654 $0 $0 $0 $0 $0<br />
TOTAL $10,783,654 $750,000 $750,000 $3,000,000 $5,000,000 $0<br />
Operating Description:<br />
No additional O and M is need for this project.<br />
Project: 60001 - Water Quality Instruments (R) Funding Source:<br />
Water & Sewer Revenues<br />
Project Description:<br />
This project reflects a replacement program for the major analytical instrumentation at the <strong>city</strong>'s water quality<br />
laboratory. Highly sensitive and precise analytical instrumentation is required for the regulatory analysis <strong>of</strong> the<br />
<strong>city</strong>'s water.<br />
Capital Costs: FY 20<strong>12</strong> FY 2013 FY 2014 FY 2015 FY 2016 FYs 17-21<br />
Equipment $0 $0 $0 $58,000 $350,000 $335,000<br />
TOTAL $0 $0 $0 $58,000 $350,000 $335,000<br />
Operating Description:<br />
Replacement <strong>of</strong> water quality testing instruments with more sensitive detectors results in additional ongoing<br />
maintenance costs. Because <strong>of</strong> the initial warranties on each instrument, these operating impacts are expected<br />
to begin the year following instrument replacement. A supplemental <strong>budget</strong> request will be submitted once the<br />
project is near completion.<br />
Operating Costs: FY 20<strong>12</strong> FY 2013 FY 2014 FY 2015 FY 2016 FYs 17-21<br />
Supplies/Contr $0 $0 $0 $0 $0 $55,725<br />
TOTAL $0 $0 $0 $0 $0 $55,725<br />
* New Project<br />
N=New Asset, R=Replacement <strong>of</strong> Existing Asset, I=Improvement <strong>of</strong> Existing Asset<br />
414<br />
Return to CIP TOC
FY 20<strong>12</strong>-2021 Capital Improvement Plan<br />
Capital Project Expenses Detail<br />
2360 - Water & Sewer Category: Revenue<br />
Project: 60009 - West Area WRF Service Wtr Sys. (R) Funding Source:<br />
Water & Sewer Revenues<br />
Project Description:<br />
This project will include replacement <strong>of</strong> the existing 2 inch galvanized water lines at the West Area Water<br />
Reclamation Facility. Numerous areas <strong>of</strong> the pipeline system have leaks indicating pipeline corrosion. Leaks<br />
currently have temporary repairs done by Utilities staff.<br />
Capital Costs: FY 20<strong>12</strong> FY 2013 FY 2014 FY 2015 FY 2016 FYs 17-21<br />
Construction $82,000 $0 $0 $0 $0 $0<br />
Engineering Charges $9,840 $0 $0 $0 $0 $0<br />
Arts $820 $0 $0 $0 $0 $0<br />
Contingency $7,340 $0 $0 $0 $0 $0<br />
Sub-Total New Funding $100,000<br />
$0 $0 $0 $0 $0<br />
FY 20<strong>12</strong> Carryover<br />
$100,001 $0 $0 $0 $0 $0<br />
TOTAL $200,001 $0 $0 $0 $0 $0<br />
Operating Description:<br />
No additional O and M is need for this project.<br />
Project: T2250 - WAWRF Clarifier Replacement (R) Funding Source:<br />
Water & Sewer Revenues<br />
Project Description:<br />
This project will repair or replace the clarifier mechanical drive units and associated equipment at the West Area<br />
Water Reclamation Facility in three <strong>of</strong> the six clarifiers. The heavy drive motors, pulleys, chains, bearings and<br />
scrapers will wear out over time and need to be replaced.<br />
Capital Costs: FY 20<strong>12</strong> FY 2013 FY 2014 FY 2015 FY 2016 FYs 17-21<br />
Design $0 $0 $30,000 $0 $0 $0<br />
Construction $0 $0 $200,000 $0 $0 $0<br />
Engineering Charges $0 $0 $11,270 $0 $0 $0<br />
Arts $0 $0 $2,000 $0 $0 $0<br />
Contingency $0 $0 $34,500 $0 $0 $0<br />
TOTAL $0 $0 $277,770 $0 $0 $0<br />
Operating Description:<br />
No additional O and M is need for this project.<br />
Project: T2270 - WAWRF Fine Screen Replacement (R) Funding Source:<br />
Water & Sewer Revenues<br />
Project Description:<br />
The West Area Water Reclamation Facility (WAWRF) fine screens are mechanical devices that remove solid<br />
materials from the influent flows. These devices are subject to wear and tear and need to be replaced<br />
periodically.<br />
Capital Costs: FY 20<strong>12</strong> FY 2013 FY 2014 FY 2015 FY 2016 FYs 17-21<br />
Design $0 $0 $50,000 $0 $0 $0<br />
Construction $0 $0 $580,000 $0 $0 $0<br />
Engineering Charges $0 $0 $29,400 $0 $0 $0<br />
Arts $0 $0 $5,800 $0 $0 $0<br />
Contingency $0 $0 $87,750 $0 $0 $0<br />
TOTAL $0 $0 $752,950 $0 $0 $0<br />
Operating Description:<br />
No additional O and M is need for this project.<br />
* New Project<br />
N=New Asset, R=Replacement <strong>of</strong> Existing Asset, I=Improvement <strong>of</strong> Existing Asset<br />
415<br />
Return to CIP TOC
FY 20<strong>12</strong>-2021 Capital Improvement Plan<br />
Capital Project Expenses Detail<br />
2360 - Water & Sewer Category: Revenue<br />
Project: T2280 - WAWRF Odor Control Replacement (R) Funding Source:<br />
Water & Sewer Revenues<br />
Project Description:<br />
The West Area Water Reclamation Facility Odor Control System is required to meet air quality regulatory<br />
standards and minimize/prevent odor complaints. Elements <strong>of</strong> the odor control system will require rehabilitation<br />
or replacement due to normal wear and tear.<br />
Capital Costs: FY 20<strong>12</strong> FY 2013 FY 2014 FY 2015 FY 2016 FYs 17-21<br />
Design $0 $0 $0 $100,000 $0 $0<br />
Construction $0 $0 $0 $839,000 $0 $0<br />
Engineering Charges $0 $0 $0 $40,377 $0 $0<br />
Arts $0 $0 $0 $8,390 $0 $0<br />
Contingency $0 $0 $0 $93,933 $0 $0<br />
TOTAL $0 $0 $0 $1,081,700 $0 $0<br />
Operating Description:<br />
No additional O and M is need for this project.<br />
Project: T2282 - Lab Data Management System (R) Funding Source:<br />
Water & Sewer Revenues<br />
Project Description:<br />
Purchase <strong>of</strong> a new information management system to replace an outdated data system. The new information<br />
system will interface directly with laboratory instrumentation, integrate quality control processes, eliminate<br />
duplicate and manual data entry, and automate regulatory reporting.<br />
Capital Costs: FY 20<strong>12</strong> FY 2013 FY 2014 FY 2015 FY 2016 FYs 17-21<br />
IT/Phone/Security $300,000 $0 $0 $0 $0 $0<br />
TOTAL $300,000 $0 $0 $0 $0 $0<br />
Operating Description:<br />
Additional O and M expenses are related to s<strong>of</strong>tware license renewals / updates and system configuration<br />
hardware requirements. The additional O and M will be absorbed by the department.<br />
Operating Costs: FY 20<strong>12</strong> FY 2013 FY 2014 FY 2015 FY 2016 FYs 17-21<br />
Supplies/Contr $0 $17,000 $17,510 $18,035 $18,576 $101,583<br />
TOTAL $0 $17,000 $17,510 $18,035 $18,576 $101,583<br />
* New Project<br />
N=New Asset, R=Replacement <strong>of</strong> Existing Asset, I=Improvement <strong>of</strong> Existing Asset<br />
416<br />
Return to CIP TOC
FY 20<strong>12</strong>-2021 Capital Improvement Plan<br />
Capital Project Expenses Detail<br />
2360 - Water & Sewer Category: Revenue<br />
Project: T2283 - Computerized Maint. Mgmt Sys. (R) Funding Source:<br />
Water & Sewer Revenues<br />
Project Description:<br />
The City <strong>of</strong> Glendale Utilities Department utilizes Computerized Maintenance Management System (CMMS), to<br />
track data regarding the operation and maintenance <strong>of</strong> the <strong>city</strong>'s water and wastewater treatment, distribution<br />
and collection systems. This database system eliminates manual record keeping. The CMMS s<strong>of</strong>tware is<br />
dependent on both computer hardware and the operating system. By FY 2015, the computer hardware and<br />
operating system are not expected to support the current version <strong>of</strong> CMMS.<br />
Capital Costs: FY 20<strong>12</strong> FY 2013 FY 2014 FY 2015 FY 2016 FYs 17-21<br />
Design $0 $0 $0 $1<strong>12</strong>,550 $130,000 $400,000<br />
Construction $0 $0 $0 $0 $2,465,000 $4,000,000<br />
Finance Charges $0 $0 $0 $0 $39,300 $66,000<br />
Engineering Charges $0 $0 $0 $1,465 $33,772 $57,263<br />
Arts $0 $0 $0 $0 $24,650 $40,000<br />
Contingency $0 $0 $0 $10,985 $307,278 $436,737<br />
TOTAL $0 $0 $0 $<strong>12</strong>5,000 $3,000,000 $5,000,000<br />
Operating Description:<br />
A current position will need to be reclassified once the project begins as staff will be providing a higher level <strong>of</strong><br />
s<strong>of</strong>tware support services. $20,000 <strong>annual</strong>ly will cover the reclassified positions additional salary and salary<br />
related benefits. A supplemental <strong>budget</strong> request will be submitted once the project is near completion.<br />
Operating Costs: FY 20<strong>12</strong> FY 2013 FY 2014 FY 2015 FY 2016 FYs 17-21<br />
Supplies/Contr $0 $0 $0 $20,000 $20,600 $1<strong>12</strong>,649<br />
TOTAL $0 $0 $0 $20,000 $20,600 $1<strong>12</strong>,649<br />
Project: T2284 - Radio Phase IV Equipment (R) Funding Source:<br />
Water & Sewer Revenues<br />
Project Description:<br />
This project includes the replacement <strong>of</strong> the existing microwave radio equipment that is a critical component for<br />
the wide area networking <strong>of</strong> the Supervisory Control and Data Acquisition (SCADA) system. The microwave<br />
radio equipment installed under the Radio Phase III project has a supportable and operational life span <strong>of</strong><br />
approximately five years.<br />
Capital Costs: FY 20<strong>12</strong> FY 2013 FY 2014 FY 2015 FY 2016 FYs 17-21<br />
Construction $0 $0 $700,000 $0 $0 $700,000<br />
Engineering Charges $0 $0 $25,200 $0 $0 $25,200<br />
Arts $0 $0 $7,000 $0 $0 $7,000<br />
Contingency $0 $0 $67,800 $0 $0 $67,800<br />
TOTAL $0 $0 $800,000 $0 $0 $800,000<br />
Operating Description:<br />
No additional O and M is need for this project.<br />
* New Project<br />
N=New Asset, R=Replacement <strong>of</strong> Existing Asset, I=Improvement <strong>of</strong> Existing Asset<br />
417<br />
Return to CIP TOC
FY 20<strong>12</strong>-2021 Capital Improvement Plan<br />
Capital Project Expenses Detail<br />
2360 - Water & Sewer Category: Revenue<br />
Project: 60008 - WAWRF Phase IV (N) Funding Source:<br />
Water & Sewer Revenues<br />
Project Description:<br />
The funding request for FY 20<strong>12</strong> reflects treatment system improvements to address corrosion <strong>of</strong> various steel<br />
elements in the building. The funding request for FY 2015 and beyond includes an engineering assessment,<br />
design and construction <strong>of</strong> additional treatment system improvements and capa<strong>city</strong> expansion to address the<br />
expected increase in wastewater flows from the developing areas along the Loop 101 and west area. The plant<br />
improvements and expansion were identified in the West Area Water Reclamation Facility Phase V Master Plan<br />
conducted by the Damon S. Williams Associates (DSWA) team in 2009.<br />
Capital Costs: FY 20<strong>12</strong> FY 2013 FY 2014 FY 2015 FY 2016 FYs 17-21<br />
Design $0 $0 $0 $113,500 $1,290,000 $3,900,000<br />
Construction $315,000 $0 $0 $0 $0 $39,000,000<br />
Finance Charges $0 $0 $0 $0 $19,350 $643,500<br />
Engineering Charges $1,213 $0 $0 $437 $4,966 $165,165<br />
Arts $3,150 $0 $0 $0 $0 $390,000<br />
Contingency $30,637 $0 $0 $11,063 $<strong>12</strong>7,714 $3,688,158<br />
Sub-Total New Funding $350,000<br />
$0 $0 $<strong>12</strong>5,000 $1,442,030 $47,786,823<br />
FY 20<strong>12</strong> Carryover<br />
$44,033 $0 $0 $0 $0 $0<br />
TOTAL $394,033 $0 $0 $<strong>12</strong>5,000 $1,442,030 $47,786,823<br />
Operating Description:<br />
Addional O and M would be needed starting in FY 2020. An expanded facility is estimated to require two new<br />
plant operators and one new plant electrician once construction nears completion. Other additional operating<br />
expenses are projected as a result <strong>of</strong> increases in supplies (chemicals), utilities and equipment maintenance. No<br />
new telephones, PC's or vehicles will be required.<br />
Operating Costs: FY 20<strong>12</strong> FY 2013 FY 2014 FY 2015 FY 2016 FYs 17-21<br />
Staffing $0 $0 $0 $0 $0 $410,881<br />
Supplies/Contr $0 $0 $0 $0 $0 $514,309<br />
Utilities $0 $0 $0 $0 $0 $771,463<br />
Equip. Maint. $0 $0 $0 $0 $0 $169,722<br />
Insurance $0 $0 $0 $0 $0 $<strong>12</strong>,660<br />
TOTAL $0 $0 $0 $0 $0 $1,879,035<br />
* New Project<br />
N=New Asset, R=Replacement <strong>of</strong> Existing Asset, I=Improvement <strong>of</strong> Existing Asset<br />
418<br />
Return to CIP TOC
FY <strong>2011</strong> - 2020 Capital Improvement Program<br />
Capital Projects By Fund and Project Number<br />
2400 - Water Category: Revenue<br />
Capital Project Expenses<br />
Carryover<br />
FY 20<strong>12</strong>: FY 2013: FY 2014: FY 2015: FY 2016: FYs 17-21:<br />
New Funding<br />
Existing Assets<br />
Improvement <strong>of</strong> Existing Assets<br />
61023 Water System Security 281,215<br />
0 0 0 0 0 2,519,715<br />
61024 Cholla Water Plant Process Imp 1,186,806 400,000 500,000 0 0 0 0<br />
61036 Zn4 Groundwater Trtment Plant 20,794,830<br />
0 0 0 1,000,000 0 17,500,000<br />
61040 Loop 101 Wells & Piping 0<br />
0 0 0 0 0 1,900,000<br />
T3540 WTPs Chlorine Gas Elimination 0<br />
0 0 0 3,500,000 4,200,000 0<br />
T3555 Fiber Optic Cable at Reservoir 0<br />
0 0 0 0 0 225,000<br />
T3558 *Thunderbird Reservoir Misc. Im 0 180,000 0 0 0 300,000 0<br />
T3559 *SRP Well Imp (67 Ave/Myrtle) 0 280,000 0 0 0 0 0<br />
T3560 *Citywide Meter Vault Imp 0 <strong>12</strong>5,000 <strong>12</strong>5,000 0 0 0 0<br />
Replacement <strong>of</strong> Existing Assets<br />
61001 Fire Hydrant Replacement 296,074 300,000 0 0 300,000 300,000 300,000<br />
610<strong>12</strong> Citywide Irrigation System 0<br />
0 0 0 200,000 200,000 400,000<br />
61013 Water Line Replacement 1,<strong>12</strong>0,645 700,000 2,000,000 3,000,000 2,168,090 3,500,157 13,347,369<br />
61015 Outer Loop Effluent Line 0<br />
0 0 69,000 0 0 4,200,000<br />
61043 Pyramid Pk WTP Train #1 Equip 0 100,000 100,000 100,000 150,000 2,250,000 3,000,000<br />
T3550 Hillcrest Ranch Booster Rehab 0<br />
0 0 0 0 552,775 0<br />
T3557 *Zone 4 Reservoir Misc Imp 0<br />
0 180,000 0 0 0 0<br />
Sub-Total - Existing Assets 23,679,570 2,085,000 2,905,000 3,169,000 7,318,090 11,302,932 43,392,084<br />
New Assets<br />
61003 Oasis Water Campus 222,686<br />
0 0 0 0 0 0<br />
61009 Drinking Water Well Head Trmt 0<br />
0 0 0 0 0 1,774,450<br />
61019 Storage and Recovery Well 0<br />
0 0 0 0 745,453 4,005,475<br />
61020 West Area Reuse Pipelines 0<br />
0 0 0 0 0 500,000<br />
61021 N River/Agua Fria Storage Proj 1,257,030<br />
0 0 1,300,000 0 0 0<br />
61027 Water Line Extension 1,472,297<br />
0 0 0 0 1,989,999 4,500,000<br />
61029 Regional GAC Plant 0<br />
0 0 0 0 0 100,000<br />
61038 Loop 101 Water Treatment 0 792,000 756,000 0 0 0 26,499,527<br />
61044 New River Waterline Crossing 1,283,284 1,300,000 0 0 0 0 0<br />
T3510 Orangewood Water Trans Main 0<br />
0 0 0 100,000 0 0<br />
T3552 Additional Water Supply 0<br />
0 0 0 0 0 9,998,000<br />
T3561 *Northern Ave PRV Station Reloc 0<br />
0 0 0 0 50,000 0<br />
Sub-Total - New Assets 4,235,297 2,092,000 756,000 1,300,000 100,000 2,785,452 47,377,452<br />
Total Project Expenses: $27,914,867<br />
Total FY 20<strong>12</strong> Funding: $32,091,867<br />
* New Project<br />
$4,177,000 $3,661,000 $4,469,000 $7,418,090 $14,088,384 $90,769,536<br />
419<br />
Return to CIP TOC
FY 20<strong>12</strong>-2021 Capital Improvement Plan<br />
Capital Project Expenses Detail<br />
2400 - Water Category: Revenue<br />
Project: 61023 - Water System Security (I) Funding Source:<br />
Water & Sewer Revenues<br />
Project Description:<br />
Installation <strong>of</strong> equipment to further enhance security <strong>of</strong> the <strong>city</strong>'s water supply, treatment plants and distribution<br />
system.<br />
Capital Costs: FY 20<strong>12</strong> FY 2013 FY 2014 FY 2015 FY 2016 FYs 17-21<br />
Design $0 $0 $0 $0 $0 $117,000<br />
Construction $0 $0 $0 $0 $0 $2,065,000<br />
Finance Charges $0 $0 $0 $0 $0 $33,000<br />
Engineering Charges $0 $0 $0 $0 $0 $55,000<br />
Arts $0 $0 $0 $0 $0 $20,650<br />
Contingency $0 $0 $0 $0 $0 $229,065<br />
Sub-Total New Funding $0<br />
$0 $0 $0 $0 $2,519,715<br />
FY 20<strong>12</strong> Carryover<br />
$281,215 $0 $0 $0 $0 $0<br />
TOTAL $281,215 $0 $0 $0 $0 $2,519,715<br />
Operating Description:<br />
No additional O and M is need for this project.<br />
Project: 61024 - Cholla Water Plant Process Imp (I) Funding Source:<br />
Water & Sewer Revenues<br />
Project Description:<br />
This project will include improvements at Cholla Water Treatment Plant to meet new regulatory requirements.<br />
The improvements include the installation <strong>of</strong> new variable frequency drive systems, odor control, soil<br />
stabilization, solids handling facility repair and improvements, and reservoir lining rehabilitation or replacement.<br />
Capital Costs: FY 20<strong>12</strong> FY 2013 FY 2014 FY 2015 FY 2016 FYs 17-21<br />
Design $70,000 $100,000 $0 $0 $0 $0<br />
Construction $275,000 $330,000 $0 $0 $0 $0<br />
Engineering Charges $14,835 $18,490 $0 $0 $0 $0<br />
Arts $2,750 $3,300 $0 $0 $0 $0<br />
Contingency $37,415 $48,210 $0 $0 $0 $0<br />
Sub-Total New Funding $400,000 $500,000 $0 $0 $0 $0<br />
FY 20<strong>12</strong> Carryover<br />
$1,186,806 $0 $0 $0 $0 $0<br />
TOTAL $1,586,806 $500,000 $0 $0 $0 $0<br />
Operating Description:<br />
No additional O and M is need for this project.<br />
* New Project<br />
N=New Asset, R=Replacement <strong>of</strong> Existing Asset, I=Improvement <strong>of</strong> Existing Asset<br />
420<br />
Return to CIP TOC
FY 20<strong>12</strong>-2021 Capital Improvement Plan<br />
Capital Project Expenses Detail<br />
2400 - Water Category: Revenue<br />
Project: 61036 - Zn4 Groundwater Trtment Plant (I) Funding Source:<br />
Water & Sewer Revenues<br />
Project Description:<br />
This 10 million gallons per day (MGD) Groundwater Treatment Plant was identified in the Black & Veatch<br />
"Comprehensive Water Facilities Planning and Design" report <strong>of</strong> September 2003 as a key water supply<br />
component to provide additional water during plant outages such as canal dry-ups and to help meet peak water<br />
demands. This project will include additional conveyance pipeline, a supply well, and brine disposal ponds.<br />
Capital Costs: FY 20<strong>12</strong> FY 2013 FY 2014 FY 2015 FY 2016 FYs 17-21<br />
Design $0 $0 $0 $80,000 $0 $1,400,000<br />
Construction $0 $0 $0 $810,000 $0 $14,060,000<br />
Finance Charges $0 $0 $0 $13,350 $0 $231,000<br />
Engineering Charges $0 $0 $0 $6,260 $0 $108,740<br />
Arts $0 $0 $0 $8,100 $0 $140,600<br />
Contingency $0 $0 $0 $82,290 $0 $1,559,660<br />
Sub-Total New Funding $0<br />
$0 $0 $1,000,000 $0 $17,500,000<br />
FY 20<strong>12</strong> Carryover<br />
$20,794,830 $0 $0 $0 $0 $0<br />
TOTAL $20,794,830 $0 $0 $1,000,000 $0 $17,500,000<br />
Operating Description:<br />
This is an expansion <strong>of</strong> treatment capa<strong>city</strong> for the Zone 4 Water Treatment Plant between FY's 2015 and 2021.<br />
Therefore the new O and M costs reflect the need for additional staff, chemicals and utilities. FTE = Three plant<br />
operators @ $71,500 per year. Chemical, utilities, and maintenance cost are based on actual cost during a pilot<br />
study to treat groundwater. A supplemental will be submitted in the future for the additional O and M costs.<br />
Operating Costs: FY 20<strong>12</strong> FY 2013 FY 2014 FY 2015 FY 2016 FYs 17-21<br />
Staffing $0 $0 $0 $0 $0 $1,320,192<br />
Supplies/Contr $0 $0 $0 $0 $0 $2,219,401<br />
Utilities $0 $0 $0 $0 $0 $336,270<br />
Equip. Maint. $0 $0 $0 $0 $0 $298,771<br />
Insurance $0 $0 $0 $0 $0 $39,446<br />
TOTAL $0 $0 $0 $0 $0 $4,214,080<br />
Project: 61040 - Loop 101 Wells & Piping (I) Funding Source:<br />
Water & Sewer Revenues<br />
Project Description:<br />
Rehabilitate existing wells in Zone 4 to supply raw water to the projected Loop 101 Ground Water Treatment<br />
Plant (GWTP) (see the Loop 101 Water Treatment Project # 61038). These improvements will be needed to<br />
meet the potable water demand at build out for this area <strong>of</strong> the <strong>city</strong> and to also meet water quality regulations.<br />
These improvements are identified in the revised Utilities Water Master Plan completed by Black and Veatch.<br />
Capital Costs: FY 20<strong>12</strong> FY 2013 FY 2014 FY 2015 FY 2016 FYs 17-21<br />
Design $0 $0 $0 $0 $0 $140,000<br />
Construction $0 $0 $0 $0 $0 $1,510,000<br />
Finance Charges $0 $0 $0 $0 $0 $24,750<br />
Engineering Charges $0 $0 $0 $0 $0 $45,375<br />
Arts $0 $0 $0 $0 $0 $15,100<br />
Contingency $0 $0 $0 $0 $0 $164,775<br />
TOTAL $0 $0 $0 $0 $0 $1,900,000<br />
Operating Description:<br />
No additional O and M is need for this project.<br />
* New Project<br />
N=New Asset, R=Replacement <strong>of</strong> Existing Asset, I=Improvement <strong>of</strong> Existing Asset<br />
421<br />
Return to CIP TOC
FY 20<strong>12</strong>-2021 Capital Improvement Plan<br />
Capital Project Expenses Detail<br />
2400 - Water Category: Revenue<br />
Project: T3540 - WTPs Chlorine Gas Elimination (I) Funding Source:<br />
Water & Sewer Revenues<br />
Project Description:<br />
This project includes the design and construction <strong>of</strong> a chlorine gas elimination system as well as the removal <strong>of</strong><br />
the current on site storage system for chlorine gas, which is the current disinfection method for potable water.<br />
The chlorine gas will be replaced with equipment that will provide on site generation <strong>of</strong> sodium hypochlorite as<br />
the disinfection chemical for Pyramid Peak and Cholla Water Treatment Plants.<br />
Capital Costs: FY 20<strong>12</strong> FY 2013 FY 2014 FY 2015 FY 2016 FYs 17-21<br />
Design $0 $0 $0 $730,000 $730,000 $0<br />
Construction $0 $0 $0 $2,370,000 $2,970,000 $0<br />
Finance Charges $0 $0 $0 $43,950 $55,500 $0<br />
Engineering Charges $0 $0 $0 $42,169 $50,331 $0<br />
Arts $0 $0 $0 $23,700 $29,700 $0<br />
Contingency $0 $0 $0 $290,181 $364,469 $0<br />
TOTAL $0 $0 $0 $3,500,000 $4,200,000 $0<br />
Operating Description:<br />
Additional <strong>annual</strong> cost for supplies and electri<strong>city</strong> are $20,000 and $15,000 respectively. Costs are based on<br />
engineering studies. A supplemental <strong>budget</strong> request will be submitted once the project is near completion.<br />
Operating Costs: FY 20<strong>12</strong> FY 2013 FY 2014 FY 2015 FY 2016 FYs 17-21<br />
Supplies/Contr $0 $0 $0 $0 $15,913 $87,017<br />
Utilities $0 $0 $0 $0 $21,219 $116,032<br />
TOTAL $0 $0 $0 $0 $37,132 $203,049<br />
Project: T3555 - Fiber Optic Cable at Reservoir (I) Funding Source:<br />
Water & Sewer Revenues<br />
Project Description:<br />
The installation <strong>of</strong> fiber optic cables at Thunderbird Reservoir and Zone 4 Reservoir. A recent assessment<br />
recommends fiber optic cables as the least expensive, long-term solution for wide area network communications<br />
at Thunderbird and Zone 4 Reservoirs to replace the T1 data line that currently is being leased from Qwest. The<br />
new fiber optic cables will permit remote monitoring <strong>of</strong> the numerous security cameras at the reservoirs and also<br />
provide a more reliable access for the Supervisory Control and Data Acquisition (SCADA) system.<br />
Capital Costs: FY 20<strong>12</strong> FY 2013 FY 2014 FY 2015 FY 2016 FYs 17-21<br />
Design $0 $0 $0 $0 $0 $10,000<br />
Construction $0 $0 $0 $0 $0 $200,000<br />
IT/Phone/Security $0 $0 $0 $0 $0 $2,000<br />
Engineering Charges $0 $0 $0 $0 $0 $11,000<br />
Arts $0 $0 $0 $0 $0 $2,000<br />
TOTAL $0 $0 $0 $0 $0 $225,000<br />
Operating Description:<br />
O and M will include $2,000 per year <strong>of</strong> Technology Replacement Fund (TRF) starting FY 2020. A supplemental<br />
<strong>budget</strong> request will be submitted once the project is near completion.<br />
Operating Costs: FY 20<strong>12</strong> FY 2013 FY 2014 FY 2015 FY 2016 FYs 17-21<br />
PC/Vehicle Replacement $0 $0 $0 $0 $0 $2,000<br />
TOTAL $0 $0 $0 $0 $0 $2,000<br />
* New Project<br />
N=New Asset, R=Replacement <strong>of</strong> Existing Asset, I=Improvement <strong>of</strong> Existing Asset<br />
422<br />
Return to CIP TOC
FY 20<strong>12</strong>-2021 Capital Improvement Plan<br />
Capital Project Expenses Detail<br />
2400 - Water Category: Revenue<br />
Project: T3558* - Thunderbird Reservoir Misc. Im (I) Funding Source:<br />
Water & Sewer Revenues<br />
Project Description:<br />
The requested funding addresses an engineering study to evaluate alternatives for enhancing water quality<br />
during the hot summer months for water stored at the Thunderbird Reservoir. Once the study is completed,<br />
design and construction <strong>of</strong> the recommended improvements are projected to proceed in FY 2016.<br />
Capital Costs: FY 20<strong>12</strong> FY 2013 FY 2014 FY 2015 FY 2016 FYs 17-21<br />
Design $73,000 $0 $0 $0 $35,000 $0<br />
Construction $80,000 $0 $0 $0 $221,000 $0<br />
Engineering Charges $7,497 $0 $0 $0 $<strong>12</strong>,544 $0<br />
Arts $800 $0 $0 $0 $2,210 $0<br />
Contingency $18,703 $0 $0 $0 $29,246 $0<br />
TOTAL $180,000 $0 $0 $0 $300,000 $0<br />
Operating Description:<br />
No additional O and M is need for this project.<br />
Project: T3559* - SRP Well Imp (67 Ave/Myrtle) (I) Funding Source:<br />
Water & Sewer Revenues<br />
Project Description:<br />
The project will include the rehabilitation <strong>of</strong> the Salt River Project well at 67th and Myrtle Avenues to reduce<br />
nitrate levels to meet new drinking water standards.<br />
Capital Costs: FY 20<strong>12</strong> FY 2013 FY 2014 FY 2015 FY 2016 FYs 17-21<br />
Design $45,000 $0 $0 $0 $0 $0<br />
Construction $198,000 $0 $0 $0 $0 $0<br />
Engineering Charges $11,907 $0 $0 $0 $0 $0<br />
Arts $1,980 $0 $0 $0 $0 $0<br />
Contingency $23,113 $0 $0 $0 $0 $0<br />
TOTAL $280,000 $0 $0 $0 $0 $0<br />
Operating Description:<br />
No additional O and M is need for this project.<br />
Project: T3560* - Citywide Meter Vault Imp (I) Funding Source:<br />
Water & Sewer Revenues<br />
Project Description:<br />
Based on a field condition assessment conducted by staff, modifications to large meter vaults are recommended<br />
to enhance safe entry. The meter vault covers will be replaced with spring-torsion type covers per the <strong>city</strong>’s<br />
design standards and meter vaults will be retr<strong>of</strong>itted or replaced as needed.<br />
Capital Costs: FY 20<strong>12</strong> FY 2013 FY 2014 FY 2015 FY 2016 FYs 17-21<br />
Construction $106,000 $106,000 $0 $0 $0 $0<br />
Engineering Charges $6,996 $6,996 $0 $0 $0 $0<br />
Arts $1,060 $1,060 $0 $0 $0 $0<br />
Contingency $10,944 $10,944 $0 $0 $0 $0<br />
TOTAL $<strong>12</strong>5,000 $<strong>12</strong>5,000 $0 $0 $0 $0<br />
Operating Description:<br />
No additional O and M is need for this project.<br />
* New Project<br />
N=New Asset, R=Replacement <strong>of</strong> Existing Asset, I=Improvement <strong>of</strong> Existing Asset<br />
423<br />
Return to CIP TOC
FY 20<strong>12</strong>-2021 Capital Improvement Plan<br />
Capital Project Expenses Detail<br />
2400 - Water Category: Revenue<br />
Project: 61001 - Fire Hydrant Replacement (R) Funding Source:<br />
Water & Sewer Revenues<br />
Project Description:<br />
This project funds a replacement program for approximately 800 existing fire hydrants. To date, 285 fire hydrants<br />
have been replaced. The existing fire hydrants need to be replaced due to age and lack <strong>of</strong> replacement parts.<br />
The new fire hydrants will be installed to meet the <strong>city</strong> and industry spacing guidelines. In addition, the new fire<br />
hydrants will be accessible for routine maintenance to ensure fire system integrity.<br />
Capital Costs: FY 20<strong>12</strong> FY 2013 FY 2014 FY 2015 FY 2016 FYs 17-21<br />
Construction $262,000 $0 $0 $262,000 $262,000 $262,000<br />
Engineering Charges $<strong>12</strong>,000 $0 $0 $<strong>12</strong>,000 $<strong>12</strong>,000 $<strong>12</strong>,000<br />
Arts $2,620 $0 $0 $2,620 $2,620 $2,620<br />
Contingency $23,380 $0 $0 $23,380 $23,380 $23,380<br />
Sub-Total New Funding $300,000<br />
$0 $0 $300,000 $300,000 $300,000<br />
FY 20<strong>12</strong> Carryover<br />
$296,074 $0 $0 $0 $0 $0<br />
TOTAL $596,074 $0 $0 $300,000 $300,000 $300,000<br />
Operating Description:<br />
No additional O and M is need for this project.<br />
Project: 610<strong>12</strong> - Citywide Irrigation System (R) Funding Source:<br />
Water & Sewer Revenues<br />
Project Description:<br />
Irrigation pipelines and related irrigation structure in the <strong>city</strong> owned portion <strong>of</strong> the flood irrigation system will be<br />
rehabilitated or replaced.<br />
Capital Costs: FY 20<strong>12</strong> FY 2013 FY 2014 FY 2015 FY 2016 FYs 17-21<br />
Miscellaneous/Other $0 $0 $0 $200,000 $200,000 $400,000<br />
TOTAL $0 $0 $0 $200,000 $200,000 $400,000<br />
Operating Description:<br />
No additional O and M is need for this project.<br />
* New Project<br />
N=New Asset, R=Replacement <strong>of</strong> Existing Asset, I=Improvement <strong>of</strong> Existing Asset<br />
424<br />
Return to CIP TOC
FY 20<strong>12</strong>-2021 Capital Improvement Plan<br />
Capital Project Expenses Detail<br />
2400 - Water Category: Revenue<br />
Project: 61013 - Water Line Replacement (R) Funding Source:<br />
Water & Sewer Revenues<br />
Project Description:<br />
The Water Distribution System Evaluation Study conducted by CH2M-Hill identified the segments <strong>of</strong> water lines<br />
to be rehabilitated and/or replaced. In addition, the <strong>city</strong> Utilities Department has also identified the water lines<br />
that are in need <strong>of</strong> rehabilitation and/or replacement based on historic repair and maintenance records. This<br />
project will include water line rehabilitation and/or replacement to ensure effective water distribution system<br />
operations and regulatory compliance.<br />
Capital Costs: FY 20<strong>12</strong> FY 2013 FY 2014 FY 2015 FY 2016 FYs 17-21<br />
Design $138,000 $200,000 $330,000 $250,000 $330,000 $1,850,000<br />
Construction $490,000 $1,550,800 $2,330,400 $1,600,000 $2,730,000 $9,800,000<br />
Finance Charges $0 $26,262 $39,906 $27,750 $45,900 $174,750<br />
Engineering Charges $3,547 $9,889 $15,027 $10,449 $17,284 $65,803<br />
Arts $4,900 $15,508 $23,304 $16,000 $27,300 $98,000<br />
Contingency $63,553 $197,541 $261,363 $263,891 $349,673 $1,358,816<br />
Sub-Total New Funding $700,000 $2,000,000 $3,000,000 $2,168,090 $3,500,157 $13,347,369<br />
FY 20<strong>12</strong> Carryover<br />
$1,<strong>12</strong>0,645 $0 $0 $0 $0 $0<br />
TOTAL $1,820,645 $2,000,000 $3,000,000 $2,168,090 $3,500,157 $13,347,369<br />
Operating Description:<br />
No additional O and M is needed for this project.<br />
Project: 61015 - Outer Loop Effluent Line (R) Funding Source:<br />
Water & Sewer Revenues<br />
Project Description:<br />
The Arrowhead Ranch Water Reclamation Facility (ARWRF) effluent transmission line has been in service since<br />
the late 1980's. This effluent transmission line is essential for conveying and disposal <strong>of</strong> the effluent from the<br />
ARWRF. This project will include effluent line inspection, evaluation and applicable rehabilitation, to ensure<br />
effluent transmission system integrity and reliability.<br />
Capital Costs: FY 20<strong>12</strong> FY 2013 FY 2014 FY 2015 FY 2016 FYs 17-21<br />
Design $0 $0 $59,989 $0 $0 $600,000<br />
Construction $0 $0 $0 $0 $0 $3,075,000<br />
Finance Charges $0 $0 $0 $0 $0 $55,<strong>12</strong>5<br />
Engineering Charges $0 $0 $1,110 $0 $0 $67,987<br />
Arts $0 $0 $0 $0 $0 $30,750<br />
Contingency $0 $0 $7,901 $0 $0 $371,138<br />
TOTAL $0 $0 $69,000 $0 $0 $4,200,000<br />
Operating Description:<br />
No additional O and M is need for this project.<br />
* New Project<br />
N=New Asset, R=Replacement <strong>of</strong> Existing Asset, I=Improvement <strong>of</strong> Existing Asset<br />
425<br />
Return to CIP TOC
FY 20<strong>12</strong>-2021 Capital Improvement Plan<br />
Capital Project Expenses Detail<br />
2400 - Water Category: Revenue<br />
Project: 61043 - Pyramid Pk WTP Train #1 Equip (R) Funding Source:<br />
Water & Sewer Revenues<br />
Project Description:<br />
This project will include equipment improvements and rehabilitation (FY's 20<strong>12</strong> through 2014), an engineering<br />
assessment (FY 2015) and equipment replacement (FY 2016 and beyond) at the Pyramid Peak Water<br />
Treatment Plant related to Train No. 1 and other related equipment. The original equipment will be approximately<br />
23 years old and will be at the end <strong>of</strong> its useful life. Based on the existing Intergovernmental Agreement (IGA)<br />
between Glendale and Peoria, this cost will be split between the two cities - with Peoria being responsible for<br />
approximately 23% <strong>of</strong> the project costs.<br />
Capital Costs: FY 20<strong>12</strong> FY 2013 FY 2014 FY 2015 FY 2016 FYs 17-21<br />
Design $89,500 $89,500 $10,000 $14,000 $550,000 $550,000<br />
Construction $0 $0 $79,000 $<strong>12</strong>0,000 $1,430,000 $2,100,000<br />
Finance Charges $0 $0 $0 $0 $29,700 $39,750<br />
Engineering Charges $1,645 $1,645 $1,636 $2,463 $36,397 $48,713<br />
Arts $0 $0 $790 $1,200 $14,300 $21,000<br />
Contingency $8,855 $8,855 $8,574 $<strong>12</strong>,337 $189,603 $240,537<br />
TOTAL $100,000 $100,000 $100,000 $150,000 $2,250,000 $3,000,000<br />
Operating Description:<br />
No additional O and M is need for this project.<br />
Project: T3550 - Hillcrest Ranch Booster Rehab (R) Funding Source:<br />
Water & Sewer Revenues<br />
Project Description:<br />
The pump equipment at the Hillcrest Ranch booster station will be rebuilt or serviced to ensure the station<br />
operates effectively and efficiently. This booster station will provide an emergency back up supply <strong>of</strong> water<br />
pressure for the Zone 3 Water Pressure Zone. Zone 3 is in the northernmost part <strong>of</strong> the <strong>city</strong>.<br />
Capital Costs: FY 20<strong>12</strong> FY 2013 FY 2014 FY 2015 FY 2016 FYs 17-21<br />
Design $0 $0 $0 $0 $25,000 $0<br />
Construction $0 $0 $0 $0 $450,000 $0<br />
Engineering Charges $0 $0 $0 $0 $23,275 $0<br />
Arts $0 $0 $0 $0 $4,500 $0<br />
Contingency $0 $0 $0 $0 $50,000 $0<br />
TOTAL $0 $0 $0 $0 $552,775 $0<br />
Operating Description:<br />
No additional O and M is need for this project.<br />
* New Project<br />
N=New Asset, R=Replacement <strong>of</strong> Existing Asset, I=Improvement <strong>of</strong> Existing Asset<br />
426<br />
Return to CIP TOC
FY 20<strong>12</strong>-2021 Capital Improvement Plan<br />
Capital Project Expenses Detail<br />
2400 - Water Category: Revenue<br />
Project: T3557* - Zone 4 Reservoir Misc Imp (R) Funding Source:<br />
Water & Sewer Revenues<br />
Project Description:<br />
Based on an assessment <strong>of</strong> valve conditions at the Zone 4 reservoir, the existing sleeve valve and ancillaries<br />
require replacement to ensure a continued reliable water supply to citizens. The requested funding will address<br />
the design and construction costs associated with this project. The Zone 4 reservoir supplies water to the west<br />
area <strong>of</strong> the <strong>city</strong>.<br />
Capital Costs: FY 20<strong>12</strong> FY 2013 FY 2014 FY 2015 FY 2016 FYs 17-21<br />
Design $0 $45,000 $0 $0 $0 $0<br />
Construction $0 $106,000 $0 $0 $0 $0<br />
Engineering Charges $0 $11,000 $0 $0 $0 $0<br />
Arts $0 $1,060 $0 $0 $0 $0<br />
Contingency $0 $16,940 $0 $0 $0 $0<br />
TOTAL $0 $180,000 $0 $0 $0 $0<br />
Operating Description:<br />
No additional O and M is need for this project.<br />
Project: 61003 - Oasis Water Campus (N) Funding Source:<br />
Water & Sewer Revenues<br />
Project Description:<br />
A "Comprehensive Water Facilities Planning and Design" plan has been prepared and the design is complete for<br />
the new 10 million gallon per day (MGD) surface water treatment plant that will serve mainly western Glendale<br />
with fresh drinking water.<br />
Capital Costs: FY 20<strong>12</strong> FY 2013 FY 2014 FY 2015 FY 2016 FYs 17-21<br />
FY 20<strong>12</strong> Carryover<br />
$222,686 $0 $0 $0 $0 $0<br />
TOTAL $222,686 $0 $0 $0 $0 $0<br />
Operating Description:<br />
No additional O and M is needed.<br />
Project: 61009 - Drinking Water Well Head Trmt (N) Funding Source:<br />
Water & Sewer Revenues<br />
Project Description:<br />
This project will include the design <strong>of</strong> a new Zone 4 wellhead treatment system to remove nitrates and arsenic<br />
from groundwater to meet federal drinking water standards. This new wellhead treatment system was<br />
recommended in the Groundwater Master Plan in 2008 in order to meet the projected growth in the west areas <strong>of</strong><br />
the <strong>city</strong>.<br />
Capital Costs: FY 20<strong>12</strong> FY 2013 FY 2014 FY 2015 FY 2016 FYs 17-21<br />
Design $0 $0 $0 $0 $0 $140,000<br />
Construction $0 $0 $0 $0 $0 $1,400,000<br />
Finance Charges $0 $0 $0 $0 $0 $23,100<br />
Engineering Charges $0 $0 $0 $0 $0 $43,000<br />
Arts $0 $0 $0 $0 $0 $14,000<br />
Contingency $0 $0 $0 $0 $0 $154,350<br />
TOTAL $0 $0 $0 $0 $0 $1,774,450<br />
Operating Description:<br />
No additional O and M is needed.<br />
* New Project<br />
N=New Asset, R=Replacement <strong>of</strong> Existing Asset, I=Improvement <strong>of</strong> Existing Asset<br />
427<br />
Return to CIP TOC
FY 20<strong>12</strong>-2021 Capital Improvement Plan<br />
Capital Project Expenses Detail<br />
2400 - Water Category: Revenue<br />
Project: 61019 - Storage and Recovery Well (N) Funding Source:<br />
Water & Sewer Revenues<br />
Project Description:<br />
The project will result in the installation <strong>of</strong> one or more groundwater recharge and recovery wells for the purpose<br />
<strong>of</strong> recharging effluent and/or "recovering" recharge credits by pumping groundwater. The recovered groundwater<br />
will be pumped to the Arrowhead amenities customers.<br />
Capital Costs: FY 20<strong>12</strong> FY 2013 FY 2014 FY 2015 FY 2016 FYs 17-21<br />
Design $0 $0 $0 $0 $500,000 $500,000<br />
Construction $0 $0 $0 $0 $150,000 $3,300,000<br />
Finance Charges $0 $0 $0 $0 $9,750 $57,000<br />
Engineering Charges $0 $0 $0 $0 $<strong>12</strong>,025 $70,300<br />
Arts $0 $0 $0 $0 $1,500 $33,000<br />
Contingency $0 $0 $0 $0 $72,178 $45,175<br />
TOTAL $0 $0 $0 $0 $745,453 $4,005,475<br />
Operating Description:<br />
Beginning in FY 2019, additional O and M expenses are related to chemicals and maintenance based on pilot<br />
studies. A supplemental <strong>budget</strong> request will be submitted once the project is near completion.<br />
Operating Costs: FY 20<strong>12</strong> FY 2013 FY 2014 FY 2015 FY 2016 FYs 17-21<br />
Supplies/Contr $0 $0 $0 $0 $0 $148,526<br />
Utilities $0 $0 $0 $0 $0 $106,090<br />
Equip. Maint. $0 $0 $0 $0 $0 $47,741<br />
TOTAL $0 $0 $0 $0 $0 $302,357<br />
Project: 61020 - West Area Reuse Pipelines (N) Funding Source:<br />
Water & Sewer Revenues<br />
Project Description:<br />
New water reuse pipeline projects will be developed and constructed based on a master plan for the reuse <strong>of</strong><br />
effluent from the West Area Water Reclamation Facility that was completed in May 2003.<br />
Capital Costs: FY 20<strong>12</strong> FY 2013 FY 2014 FY 2015 FY 2016 FYs 17-21<br />
Design $0 $0 $0 $0 $0 $100,000<br />
Construction $0 $0 $0 $0 $0 $345,000<br />
Engineering Charges $0 $0 $0 $0 $0 $21,805<br />
Arts $0 $0 $0 $0 $0 $3,450<br />
Contingency $0 $0 $0 $0 $0 $29,745<br />
TOTAL $0 $0 $0 $0 $0 $500,000<br />
Operating Description:<br />
No additional O and M is need for this project.<br />
* New Project<br />
N=New Asset, R=Replacement <strong>of</strong> Existing Asset, I=Improvement <strong>of</strong> Existing Asset<br />
428<br />
Return to CIP TOC
FY 20<strong>12</strong>-2021 Capital Improvement Plan<br />
Capital Project Expenses Detail<br />
2400 - Water Category: Revenue<br />
Project: 61021 - N River/Agua Fria Storage Proj (N) Funding Source:<br />
Water & Sewer Revenues<br />
Project Description:<br />
To acquire a 20% ownership in the New River/Agua Fria Underground Storage Facility administered by the Salt<br />
River Project. The additional recharge capa<strong>city</strong> developed through this project will accommodate the effluent<br />
produced at the recently expanded West Area Water Reclamation Facility.<br />
Capital Costs: FY 20<strong>12</strong> FY 2013 FY 2014 FY 2015 FY 2016 FYs 17-21<br />
Miscellaneous/Other $0 $0 $1,300,000 $0 $0 $0<br />
Sub-Total New Funding $0<br />
$0 $1,300,000 $0 $0 $0<br />
FY 20<strong>12</strong> Carryover<br />
$1,257,030 $0 $0 $0 $0 $0<br />
TOTAL $1,257,030 $0 $1,300,000 $0 $0 $0<br />
Operating Description:<br />
No additional O and M is need for this project.<br />
Project: 61027 - Water Line Extension (N) Funding Source:<br />
Water & Sewer Revenues<br />
Project Description:<br />
Water line extensions are installed where needed to extend the <strong>city</strong>'s water transmission and distribution<br />
systems to meet projected demand from future development. Projects funded from this account typically involve<br />
<strong>city</strong> participation in pipeline over sizing and other distribution piping extensions as needed to accommodate<br />
projected growth.<br />
Capital Costs: FY 20<strong>12</strong> FY 2013 FY 2014 FY 2015 FY 2016 FYs 17-21<br />
Design $0 $0 $0 $0 $600,000 $700,000<br />
Construction $0 $0 $0 $0 $1,150,000 $3,250,000<br />
Finance Charges $0 $0 $0 $0 $26,100 $59,250<br />
Engineering Charges $0 $0 $0 $0 $28,399 $64,101<br />
Arts $0 $0 $0 $0 $11,500 $32,500<br />
Contingency $0 $0 $0 $0 $174,000 $394,149<br />
Sub-Total New Funding $0<br />
$0 $0 $0 $1,989,999 $4,500,000<br />
FY 20<strong>12</strong> Carryover<br />
$1,472,297 $0 $0 $0 $0 $0<br />
TOTAL $1,472,297 $0 $0 $0 $1,989,999 $4,500,000<br />
Operating Description:<br />
No additional O and M is need for this project.<br />
Project: 61029 - Regional GAC Plant (N) Funding Source:<br />
Water & Sewer Revenues<br />
Project Description:<br />
The <strong>city</strong> currently pays $1.00 per pound for granular activated carbon (GAC) regeneration at the Oasis Water<br />
Campus and Cholla Water Treatment Plant. An evaluation will be conducted to determine whether the <strong>city</strong><br />
should pursue the purchase <strong>of</strong> a share <strong>of</strong> a regional GAC plant to possibly reduce costs for the <strong>city</strong>.<br />
Capital Costs: FY 20<strong>12</strong> FY 2013 FY 2014 FY 2015 FY 2016 FYs 17-21<br />
Design $0 $0 $0 $0 $0 $82,900<br />
Engineering Charges $0 $0 $0 $0 $0 $9,119<br />
Contingency $0 $0 $0 $0 $0 $7,981<br />
TOTAL $0 $0 $0 $0 $0 $100,000<br />
Operating Description:<br />
There are no direct O and M costs to the City <strong>of</strong> Glendale related to this project. All O and M costs will be<br />
included in the cost <strong>of</strong> GAC regeneration. Regeneration costs are based on a per pound rate and will include any<br />
ongoing project O and M costs.<br />
* New Project<br />
N=New Asset, R=Replacement <strong>of</strong> Existing Asset, I=Improvement <strong>of</strong> Existing Asset<br />
429<br />
Return to CIP TOC
FY 20<strong>12</strong>-2021 Capital Improvement Plan<br />
Capital Project Expenses Detail<br />
2400 - Water Category: Revenue<br />
Project: 61038 - Loop 101 Water Treatment (N) Funding Source:<br />
Water & Sewer Revenues<br />
Project Description:<br />
The <strong>city</strong> is projected to build a 10 million gallon per day (MGD) groundwater treatment plant and storage<br />
reservoir in Zone 4 to meet the expected potable water demand at build out <strong>of</strong> the west area <strong>of</strong> the <strong>city</strong>. The 11.7<br />
acres <strong>of</strong> land is located at 99th and Northern Avenues. The land was purchased in FY 2009 with payments from<br />
FY 2009 through FY 2013. The funding request for the last five years <strong>of</strong> the plan reflects the estimated cost <strong>of</strong><br />
design and construction for the facility. This facility is identified in the revised Glendale Water Master Plan.<br />
Capital Costs: FY 20<strong>12</strong> FY 2013 FY 2014 FY 2015 FY 2016 FYs 17-21<br />
Land $792,000 $756,000 $0 $0 $0 $0<br />
Design $0 $0 $0 $0 $0 $520,000<br />
Construction $0 $0 $0 $0 $0 $23,150,000<br />
Finance Charges $0 $0 $0 $0 $0 $355,050<br />
Engineering Charges $0 $0 $0 $0 $0 $<strong>12</strong>2,000<br />
Arts $0 $0 $0 $0 $0 $231,500<br />
Contingency $0 $0 $0 $0 $0 $2,<strong>12</strong>0,977<br />
TOTAL $792,000 $756,000 $0 $0 $0 $26,499,527<br />
Operating Description:<br />
The additional O and M expense will be determined when the project is closer to completion as operations are<br />
not expected to begin until FY 2021. A supplemental <strong>budget</strong> request will be submitted once the project is near<br />
completion.<br />
Project: 61044 - New River Waterline Crossing (N) Funding Source:<br />
Water & Sewer Revenues<br />
Project Description:<br />
A new water line will be installed to connect Zone 1 (south central part <strong>of</strong> the <strong>city</strong>) and Zone 4 (western part <strong>of</strong><br />
the <strong>city</strong>) to enhance water quality in the west area <strong>of</strong> the <strong>city</strong>.<br />
Capital Costs: FY 20<strong>12</strong> FY 2013 FY 2014 FY 2015 FY 2016 FYs 17-21<br />
Design $198,000 $0 $0 $0 $0 $0<br />
Construction $910,000 $0 $0 $0 $0 $0<br />
Finance Charges $18,000 $0 $0 $0 $0 $0<br />
Engineering Charges $43,000 $0 $0 $0 $0 $0<br />
Arts $9,100 $0 $0 $0 $0 $0<br />
Contingency $<strong>12</strong>1,900 $0 $0 $0 $0 $0<br />
Sub-Total New Funding $1,300,000<br />
$0 $0 $0 $0 $0<br />
FY 20<strong>12</strong> Carryover<br />
$1,283,284 $0 $0 $0 $0 $0<br />
TOTAL $2,583,284 $0 $0 $0 $0 $0<br />
Operating Description:<br />
No additional O and M is need for this project.<br />
* New Project<br />
N=New Asset, R=Replacement <strong>of</strong> Existing Asset, I=Improvement <strong>of</strong> Existing Asset<br />
430<br />
Return to CIP TOC
FY 20<strong>12</strong>-2021 Capital Improvement Plan<br />
Capital Project Expenses Detail<br />
2400 - Water Category: Revenue<br />
Project: T3510 - Orangewood Water Trans Main (N) Funding Source:<br />
Water & Sewer Revenues<br />
Project Description:<br />
This project includes the installation <strong>of</strong> a new water transmission main within Orangewood Avenue from 99th<br />
Avenue west to 105th Avenue to convey water from Oasis Water Campus to the west area <strong>of</strong> the <strong>city</strong>. This new<br />
water transmission main was recommended in the Black & Veatch "Comprehensive Water Facilities Planning<br />
and Design" report dated September 2003. A study will be conducted and the results will be presented to the<br />
<strong>city</strong>, construction is expected to begin sometime after FY 2021.<br />
Capital Costs: FY 20<strong>12</strong> FY 2013 FY 2014 FY 2015 FY 2016 FYs 17-21<br />
Design $0 $0 $0 $83,000 $0 $0<br />
Engineering Charges $0 $0 $0 $9,130 $0 $0<br />
Contingency $0 $0 $0 $7,870 $0 $0<br />
TOTAL $0 $0 $0 $100,000 $0 $0<br />
Operating Description:<br />
No additional O and M is need for this project.<br />
Project: T3552 - Additional Water Supply (N) Funding Source:<br />
Water & Sewer Revenues<br />
Project Description:<br />
Acquisition and development <strong>of</strong> renewable water supplies to meet increasing demand for water, maintain <strong>city</strong>'s<br />
designation <strong>of</strong> assured water supply, and to minimize drought impacts on Glendale water system customers. The<br />
$9,998,000 represents the cost <strong>of</strong> acquiring a 100-year lease <strong>of</strong> water rights per the White Mountain Apache<br />
Tribe Water Settlement in FY 2019.<br />
Capital Costs: FY 20<strong>12</strong> FY 2013 FY 2014 FY 2015 FY 2016 FYs 17-21<br />
Finance Charges $0 $0 $0 $0 $0 $148,000<br />
Miscellaneous/Other $0 $0 $0 $0 $0 $9,850,000<br />
TOTAL $0 $0 $0 $0 $0 $9,998,000<br />
Operating Description:<br />
O and M includes projected payment to Central Arizona Water Conservation District for water delivery costs and<br />
<strong>city</strong> treatment costs relating to the additional water supply. Starting in FY 2020, O and M cost are projected to be<br />
$365,000 per year. A supplemental <strong>budget</strong> request will be submitted once the project is near completion.<br />
Operating Costs: FY 20<strong>12</strong> FY 2013 FY 2014 FY 2015 FY 2016 FYs 17-21<br />
Supplies/Contr $0 $0 $0 $0 $0 $730,000<br />
TOTAL $0 $0 $0 $0 $0 $730,000<br />
* New Project<br />
N=New Asset, R=Replacement <strong>of</strong> Existing Asset, I=Improvement <strong>of</strong> Existing Asset<br />
431<br />
Return to CIP TOC
FY 20<strong>12</strong>-2021 Capital Improvement Plan<br />
Capital Project Expenses Detail<br />
2400 - Water Category: Revenue<br />
Project: T3561* - Northern Ave PRV Station Reloc (N) Funding Source:<br />
Water & Sewer Revenues<br />
Project Description:<br />
The <strong>city</strong> needs to relocate the pressure reducing valve (PRV) station on Northern Ave. to provide more<br />
operational flexibility and better access to conduct maintenance work, meet safety requirements, and increase<br />
sustainability <strong>of</strong> chlorine residual. The relocation <strong>of</strong> the PRV station will assist the <strong>city</strong> in meeting the federal and<br />
state regulation <strong>of</strong> disinfection byproduct products such as trihalomethanes formation (TTHM). A <strong>preliminary</strong><br />
engineering study will be conducted and recommendations will be presented to the <strong>city</strong> for construction after FY<br />
2021.<br />
Capital Costs: FY 20<strong>12</strong> FY 2013 FY 2014 FY 2015 FY 2016 FYs 17-21<br />
Design $0 $0 $0 $0 $41,000 $0<br />
Engineering Charges $0 $0 $0 $0 $4,510 $0<br />
Contingency $0 $0 $0 $0 $4,490 $0<br />
TOTAL $0 $0 $0 $0 $50,000 $0<br />
Operating Description:<br />
No additional O and M is need for this project.<br />
* New Project<br />
N=New Asset, R=Replacement <strong>of</strong> Existing Asset, I=Improvement <strong>of</strong> Existing Asset<br />
432<br />
Return to CIP TOC
FY <strong>2011</strong> - 2020 Capital Improvement Program<br />
Capital Projects By Fund and Project Number<br />
2420 - Sewer Category: Revenue<br />
Capital Project Expenses<br />
Carryover<br />
FY 20<strong>12</strong>: FY 2013: FY 2014: FY 2015: FY 2016: FYs 17-21:<br />
New Funding<br />
Existing Assets<br />
Improvement <strong>of</strong> Existing Assets<br />
63006 Arrowhead Sewer Lines 0<br />
0 0 0 1,719,575 2,035,490 0<br />
63010 91st Ave. Construction 0 1,500,000 1,500,000 525,000 700,000 3,000,000 11,210,000<br />
63023 City Wide Sewer Odor Control 0<br />
0 0 0 770,000 1,1<strong>12</strong>,000 0<br />
Replacement <strong>of</strong> Existing Assets<br />
63003 99th Ave Interceptor Line 0<br />
0 650,000 700,000 2,100,000 2,100,000 0<br />
63016 Sewer Line Replacement 2,952,397 3,209,935 3,313,609 3,432,188 3,432,188 3,500,000 16,565,998<br />
63018 Camelback Swr Rehab 1,000,001<br />
0 0 0 0 0 0<br />
63021 Sweetwater & 55th Ave SLS 0<br />
0 0 1,000,000 999,784 0 0<br />
T3614 *Citywide Manhole Rehab 0 208,545 521,364 521,364 521,364 521,364 0<br />
Sub-Total - Existing Assets 3,952,398 4,918,480 5,984,973 6,178,552 10,242,911 <strong>12</strong>,268,854 27,775,998<br />
New Assets<br />
63000 67th-115th, Northern-C'Back 0<br />
0 0 0 4,551,205 5,164,295 0<br />
63007 Sewer 99th Ave. W. Water Meter 0<br />
0 0 0 600,000 3,800,000 0<br />
63008 Sewers for Areas on Septic Sys 231,787<br />
0 0 200,000 0 0 0<br />
63015 CMOM Implementation 0<br />
0 0 0 100,000 0 0<br />
63017 Sewer Line Extension 309,929<br />
0 0 0 400,000 400,000 800,000<br />
63020 Security Enhance Wastewtr Ops 0<br />
0 0 0 0 0 7,000,000<br />
T3610 Bethany Hme Rd Interceptor 0<br />
0 0 0 0 0 3,950,000<br />
T3611 Glendale Ave 93rd-99th Ave 0<br />
0 0 0 0 540,000 385,245<br />
T36<strong>12</strong> Influent Pump Sta (RSPS) Imp 0<br />
0 0 0 500,000 4,600,000 0<br />
Sub-Total - New Assets 541,716<br />
0 0 200,000 6,151,205 14,504,295 <strong>12</strong>,135,245<br />
Total Project Expenses: $4,494,114<br />
Total FY 20<strong>12</strong> Funding: $9,4<strong>12</strong>,594<br />
* New Project<br />
$4,918,480 $5,984,973 $6,378,552 $16,394,116 $26,773,149 $39,911,243<br />
433<br />
Return to CIP TOC
FY 20<strong>12</strong>-2021 Capital Improvement Plan<br />
Capital Project Expenses Detail<br />
2420 - Sewer Category: Revenue<br />
Project: 63006 - Arrowhead Sewer Lines (I) Funding Source:<br />
Water & Sewer Revenues<br />
Project Description:<br />
Replacement or rehabilitation <strong>of</strong> various wastewater collection lines in the Arrowhead Ranch area to improve<br />
sewer flow conditions and reduce sewer odors. This work was identified in a report completed by the consulting<br />
firm, Damon Williams and Associates. The work will be done in phases.<br />
Capital Costs: FY 20<strong>12</strong> FY 2013 FY 2014 FY 2015 FY 2016 FYs 17-21<br />
Design $0 $0 $0 $350,000 $480,000 $0<br />
Construction $0 $0 $0 $1,158,000 $1,300,000 $0<br />
Finance Charges $0 $0 $0 $22,620 $26,700 $0<br />
Engineering Charges $0 $0 $0 $27,898 $32,930 $0<br />
Arts $0 $0 $0 $11,580 $13,000 $0<br />
Contingency $0 $0 $0 $149,477 $182,860 $0<br />
TOTAL $0 $0 $0 $1,719,575 $2,035,490 $0<br />
Operating Description:<br />
No additional O and M is need for this project.<br />
Project: 63010 - 91st Ave. Construction (I) Funding Source:<br />
Water & Sewer Revenues<br />
Project Description:<br />
This project consists <strong>of</strong> continuing improvements and expansion <strong>of</strong> the Regional 91st Ave Wastewater Treatment<br />
Plant (WWTP) <strong>of</strong> which Glendale is part owner as member <strong>of</strong> the Sub-Regional operating Group (SROG). SROG<br />
consists <strong>of</strong> Glendale, Mesa, Phoenix, Tempe and Scottsdale. The last 91st Ave WWTP expansion<br />
decommissioned one <strong>of</strong> the oldest sections <strong>of</strong> the facility and replaced that section with new biological treatment,<br />
enlarged blowers and new clarifiers. This large regional plant requires improvements that are usually addressed<br />
in "Five Year Plans" referred to as a Unified Projects generally identified as UP10 or UP15 for example referring<br />
to the year the project will be completed. The next Unified Project is projected to be UP20 since UP15 was<br />
delayed due to <strong>budget</strong>ary constraints.<br />
Capital Costs: FY 20<strong>12</strong> FY 2013 FY 2014 FY 2015 FY 2016 FYs 17-21<br />
Finance Charges $20,000 $20,000 $<strong>12</strong>,000 $10,000 $40,000 $210,000<br />
Miscellaneous/Other $1,480,000 $1,480,000 $513,000 $690,000 $2,960,000 $11,000,000<br />
TOTAL $1,500,000 $1,500,000 $525,000 $700,000 $3,000,000 $11,210,000<br />
Operating Description:<br />
No additional O and M is need for this project.<br />
Project: 63023 - City Wide Sewer Odor Control (I) Funding Source:<br />
Water & Sewer Revenues<br />
Project Description:<br />
Addition <strong>of</strong> permanent hydrogen peroxide chemical dosing stations to various sewer lines for odor control and<br />
control <strong>of</strong> hydrogen sulfide gas.<br />
Capital Costs: FY 20<strong>12</strong> FY 2013 FY 2014 FY 2015 FY 2016 FYs 17-21<br />
Design $0 $0 $0 $100,000 $0 $0<br />
Construction $0 $0 $0 $575,000 $975,000 $0<br />
Engineering Charges $0 $0 $0 $18,563 $26,813 $0<br />
Arts $0 $0 $0 $5,750 $9,750 $0<br />
Contingency $0 $0 $0 $70,687 $100,437 $0<br />
TOTAL $0 $0 $0 $770,000 $1,1<strong>12</strong>,000 $0<br />
Operating Description:<br />
No additional O and M is need for this project.<br />
* New Project<br />
N=New Asset, R=Replacement <strong>of</strong> Existing Asset, I=Improvement <strong>of</strong> Existing Asset<br />
434<br />
Return to CIP TOC
FY 20<strong>12</strong>-2021 Capital Improvement Plan<br />
Capital Project Expenses Detail<br />
2420 - Sewer Category: Revenue<br />
Project: 63003 - 99th Ave Interceptor Line (R) Funding Source:<br />
Water & Sewer Revenues<br />
Project Description:<br />
The Sewer Condition Assessment Study conducted by Project Engineering Consultants in 2005 recommended<br />
that the 99th Avenue sewer line be repaired or rehabilitated. This project will include rehabilitation <strong>of</strong> Glendale’s<br />
portion <strong>of</strong> the 99th Avenue sewer line; Glendale currently owns 70% <strong>of</strong> the 99th Avenue sewer line. Pipe lining<br />
will be replaced and the corroded manhole structures will be rehabilitated.<br />
Capital Costs: FY 20<strong>12</strong> FY 2013 FY 2014 FY 2015 FY 2016 FYs 17-21<br />
Finance Charges $0 $0 $0 $31,034 $31,034 $0<br />
Miscellaneous/Other $0 $650,000 $700,000 $2,068,966 $2,068,966 $0<br />
TOTAL $0 $650,000 $700,000 $2,100,000 $2,100,000 $0<br />
Operating Description:<br />
No additional O and M is needed.<br />
Project: 63016 - Sewer Line Replacement (R) Funding Source:<br />
Water & Sewer Revenues<br />
Project Description:<br />
Replacement and/or rehabilitation <strong>of</strong> existing sanitary sewer lines and manholes as identified by the Sewer<br />
Evaluation Study prepared by Henningson, Durham and Richardson (HDR) Engineers and to be completed by<br />
Camp, Dresser and McKee (CDM) Engineers. Projects will be developed as funds are available.<br />
Capital Costs: FY 20<strong>12</strong> FY 2013 FY 2014 FY 2015 FY 2016 FYs 17-21<br />
Design $270,000 $280,000 $290,000 $290,000 $300,000 $1,000,000<br />
Construction $2,430,000 $2,520,000 $2,610,000 $2,610,000 $2,700,000 $13,000,000<br />
Finance Charges $40,500 $42,000 $43,500 $43,500 $45,000 $210,000<br />
Engineering Charges $11,640 $<strong>12</strong>,071 $<strong>12</strong>,502 $<strong>12</strong>,502 $<strong>12</strong>,933 $60,353<br />
Arts $24,300 $25,200 $26,100 $26,100 $27,000 $130,000<br />
Contingency $433,495 $434,338 $450,086 $450,086 $415,067 $2,165,645<br />
Sub-Total New Funding $3,209,935 $3,313,609 $3,432,188 $3,432,188 $3,500,000 $16,565,998<br />
FY 20<strong>12</strong> Carryover<br />
$2,952,397 $0 $0 $0 $0 $0<br />
TOTAL $6,162,332 $3,313,609 $3,432,188 $3,432,188 $3,500,000 $16,565,998<br />
Operating Description:<br />
No additional O and M is needed for this project.<br />
Project: 63018 - Camelback Swr Rehab (R) Funding Source:<br />
Water & Sewer Revenues<br />
Project Description:<br />
This project will include sewer and manhole rehabilitation or replacement in the area <strong>of</strong> Camelback Road and<br />
75th Avenue. The 75th Avenue and Camelback Road Sewer and Manhole Rehabilitation Study conducted by<br />
Camp,Dresser, and McKee (CDM) in 2008 identified the sewer segments and manholes that need to be<br />
rehabilitated or replaced.<br />
Capital Costs: FY 20<strong>12</strong> FY 2013 FY 2014 FY 2015 FY 2016 FYs 17-21<br />
FY 20<strong>12</strong> Carryover<br />
$1,000,001 $0 $0 $0 $0 $0<br />
TOTAL $1,000,001 $0 $0 $0 $0 $0<br />
Operating Description:<br />
No additional O and M is need for this project.<br />
* New Project<br />
N=New Asset, R=Replacement <strong>of</strong> Existing Asset, I=Improvement <strong>of</strong> Existing Asset<br />
435<br />
Return to CIP TOC
FY 20<strong>12</strong>-2021 Capital Improvement Plan<br />
Capital Project Expenses Detail<br />
2420 - Sewer Category: Revenue<br />
Project: 63021 - Sweetwater & 55th Ave SLS (R) Funding Source:<br />
Water & Sewer Revenues<br />
Project Description:<br />
The sewage lift station (SLS) at Sweetwater and 55th Avenue requires equipment upgrades in order to ensure<br />
continued system reliability, sufficient treatment capa<strong>city</strong> and public health. This project includes the design and<br />
construction <strong>of</strong> new flow metering equipment and odor control elements as well as the replacement or<br />
rehabilitation <strong>of</strong> the station's pumps, valves, piping, electrical system elements, etc.<br />
Capital Costs: FY 20<strong>12</strong> FY 2013 FY 2014 FY 2015 FY 2016 FYs 17-21<br />
Design $0 $0 $100,000 $100,000 $0 $0<br />
Construction $0 $0 $769,000 $781,000 $0 $0<br />
Finance Charges $0 $0 $13,035 $0 $0 $0<br />
Engineering Charges $0 $0 $23,898 $24,228 $0 $0<br />
Arts $0 $0 $7,690 $7,810 $0 $0<br />
Contingency $0 $0 $86,377 $86,746 $0 $0<br />
TOTAL $0 $0 $1,000,000 $999,784 $0 $0<br />
Operating Description:<br />
No additional O and M is need for this project.<br />
Project: T3614* - Citywide Manhole Rehab (R) Funding Source:<br />
Water & Sewer Revenues<br />
Project Description:<br />
The requested funding will be used to rehabilitate existing sewer manholes that have reached the end <strong>of</strong> their<br />
expected life as identified in the 2008 Sewer Master Plan and Evaluation by Camp, Dresser, and McKee (CDM).<br />
Capital Costs: FY 20<strong>12</strong> FY 2013 FY 2014 FY 2015 FY 2016 FYs 17-21<br />
Construction $200,000 $500,000 $500,000 $500,000 $500,000 $0<br />
Engineering Charges $6,545 $16,364 $16,364 $16,364 $16,364 $0<br />
Arts $2,000 $5,000 $5,000 $5,000 $5,000 $0<br />
TOTAL $208,545 $521,364 $521,364 $521,364 $521,364 $0<br />
Operating Description:<br />
No additional O and M is need for this project.<br />
Project: 63000 - 67th-115th, Northern-C'Back (N) Funding Source:<br />
Water & Sewer Revenues<br />
Project Description:<br />
Installation <strong>of</strong> new sewer lines to improve existing sewer mains as identified by Hennings, Durham, and<br />
Richardson (HDR) West Area Sewer Depth Study <strong>of</strong> December 2000. These projects will provide deeper outfall<br />
sewers for development in the area and will relieve or replace existing sewers that have inadequate slope.<br />
Capital Costs: FY 20<strong>12</strong> FY 2013 FY 2014 FY 2015 FY 2016 FYs 17-21<br />
Design $0 $0 $0 $550,000 $550,000 $0<br />
Construction $0 $0 $0 $3,460,000 $4,000,000 $0<br />
Finance Charges $0 $0 $0 $61,650 $68,250 $0<br />
Engineering Charges $0 $0 $0 $43,332 $49,168 $0<br />
Arts $0 $0 $0 $34,600 $40,000 $0<br />
Contingency $0 $0 $0 $401,623 $456,877 $0<br />
TOTAL $0 $0 $0 $4,551,205 $5,164,295 $0<br />
Operating Description:<br />
No additional O and M is need for this project.<br />
* New Project<br />
N=New Asset, R=Replacement <strong>of</strong> Existing Asset, I=Improvement <strong>of</strong> Existing Asset<br />
436<br />
Return to CIP TOC
FY 20<strong>12</strong>-2021 Capital Improvement Plan<br />
Capital Project Expenses Detail<br />
2420 - Sewer Category: Revenue<br />
Project: 63007 - Sewer 99th Ave. W. Water Meter (N) Funding Source:<br />
Water & Sewer Revenues<br />
Project Description:<br />
The existing Meter Station, GL03, is located within the 99th Avenue Alignment. This project will include<br />
relocation <strong>of</strong> the GL03 meter station to the existing influent pump station site located on the northeast corner <strong>of</strong><br />
Camelback Road and 99th Avenue. The project will also upgrade the meter station to meet the Sub-Regional<br />
Operating Group (SROG) standards.<br />
Capital Costs: FY 20<strong>12</strong> FY 2013 FY 2014 FY 2015 FY 2016 FYs 17-21<br />
Design $0 $0 $0 $315,000 $278,000 $0<br />
Construction $0 $0 $0 $218,600 $3,065,000 $0<br />
Finance Charges $0 $0 $0 $0 $62,068 $0<br />
Engineering Charges $0 $0 $0 $9,872 $61,845 $0<br />
Arts $0 $0 $0 $2,186 $30,650 $0<br />
Contingency $0 $0 $0 $54,342 $302,437 $0<br />
TOTAL $0 $0 $0 $600,000 $3,800,000 $0<br />
Operating Description:<br />
O and M includes service and replacement <strong>of</strong> automatic sampling units, miscellaneous telemetry and flow<br />
recording equipment at the metering stations on a periodic basis. A supplemental <strong>budget</strong> request will be<br />
submitted once the project is near completion.<br />
Operating Costs: FY 20<strong>12</strong> FY 2013 FY 2014 FY 2015 FY 2016 FYs 17-21<br />
Utilities $0 $0 $0 $0 $0 $26,524<br />
Equip. Maint. $0 $0 $0 $0 $0 $132,616<br />
TOTAL $0 $0 $0 $0 $0 $159,140<br />
Project: 63008 - Sewers for Areas on Septic Sys (N) Funding Source:<br />
Water & Sewer Revenues<br />
Project Description:<br />
This project will include installation <strong>of</strong> sewers in the areas currently on septic systems. This is a citizen driven<br />
program in which citizens must request that their area (subdivision, neighborhood, street, etc.) be served by the<br />
<strong>city</strong> sewer system.<br />
Capital Costs: FY 20<strong>12</strong> FY 2013 FY 2014 FY 2015 FY 2016 FYs 17-21<br />
Design $0 $0 $30,000 $0 $0 $0<br />
Construction $0 $0 $140,000 $0 $0 $0<br />
Engineering Charges $0 $0 $11,000 $0 $0 $0<br />
Arts $0 $0 $1,400 $0 $0 $0<br />
Contingency $0 $0 $17,600 $0 $0 $0<br />
Sub-Total New Funding $0<br />
$0 $200,000 $0 $0 $0<br />
FY 20<strong>12</strong> Carryover<br />
$231,787 $0 $0 $0 $0 $0<br />
TOTAL $231,787 $0 $200,000 $0 $0 $0<br />
Operating Description:<br />
No additional O and M is need for this project.<br />
* New Project<br />
N=New Asset, R=Replacement <strong>of</strong> Existing Asset, I=Improvement <strong>of</strong> Existing Asset<br />
437<br />
Return to CIP TOC
FY 20<strong>12</strong>-2021 Capital Improvement Plan<br />
Capital Project Expenses Detail<br />
2420 - Sewer Category: Revenue<br />
Project: 63015 - CMOM Implementation (N) Funding Source:<br />
Water & Sewer Revenues<br />
Project Description:<br />
The United States Environmental Protection Agency (USEPA) has mandated a new Capa<strong>city</strong> Management<br />
Operations and Maintenance (CMOM) program for the sanitary sewer systems nationwide. The proposed<br />
program will assist in protecting the sanitary sewer system. Phase 1 and 2 have been completed. Phase 3 will<br />
update the program in FY 2015.<br />
Capital Costs: FY 20<strong>12</strong> FY 2013 FY 2014 FY 2015 FY 2016 FYs 17-21<br />
Design $0 $0 $0 $82,900 $0 $0<br />
Engineering Charges $0 $0 $0 $9,119 $0 $0<br />
Contingency $0 $0 $0 $7,981 $0 $0<br />
TOTAL $0 $0 $0 $100,000 $0 $0<br />
Operating Description:<br />
No additional O and M is need for this project.<br />
Project: 63017 - Sewer Line Extension (N) Funding Source:<br />
Water & Sewer Revenues<br />
Project Description:<br />
This project will include sewer line extensions at various locations to meet projected demand. These extensions<br />
will transfer wastewater from new developments.<br />
Capital Costs: FY 20<strong>12</strong> FY 2013 FY 2014 FY 2015 FY 2016 FYs 17-21<br />
Construction $0 $0 $0 $351,000 $351,000 $700,000<br />
Engineering Charges $0 $0 $0 $<strong>12</strong>,636 $<strong>12</strong>,636 $25,200<br />
Arts $0 $0 $0 $3,510 $3,510 $7,000<br />
Contingency $0 $0 $0 $32,854 $32,854 $67,800<br />
Sub-Total New Funding $0<br />
$0 $0 $400,000 $400,000 $800,000<br />
FY 20<strong>12</strong> Carryover<br />
$309,929 $0 $0 $0 $0 $0<br />
TOTAL $309,929 $0 $0 $400,000 $400,000 $800,000<br />
Operating Description:<br />
No additional O and M is need for this project.<br />
Project: 63020 - Security Enhance Wastewtr Ops (N) Funding Source:<br />
Water & Sewer Revenues<br />
Project Description:<br />
Add security enhancements to the water reclamation facilities, the various effluent recharge facilities and sewer<br />
lift stations. These improvements will enable the <strong>city</strong> staff to more closely monitor water reclamation and<br />
domestic water remote locations such as the raw sewage pumping station and the numerous sewage lift stations<br />
in the system.<br />
Capital Costs: FY 20<strong>12</strong> FY 2013 FY 2014 FY 2015 FY 2016 FYs 17-21<br />
Design $0 $0 $0 $0 $0 $500,000<br />
Construction $0 $0 $0 $0 $0 $6,000,000<br />
Finance Charges $0 $0 $0 $0 $0 $100,000<br />
Engineering Charges $0 $0 $0 $0 $0 $92,500<br />
Arts $0 $0 $0 $0 $0 $60,000<br />
Contingency $0 $0 $0 $0 $0 $247,500<br />
TOTAL $0 $0 $0 $0 $0 $7,000,000<br />
Operating Description:<br />
No additional O and M is needed.<br />
* New Project<br />
N=New Asset, R=Replacement <strong>of</strong> Existing Asset, I=Improvement <strong>of</strong> Existing Asset<br />
438<br />
Return to CIP TOC
FY 20<strong>12</strong>-2021 Capital Improvement Plan<br />
Capital Project Expenses Detail<br />
2420 - Sewer Category: Revenue<br />
Project: T3610 - Bethany Hme Rd Interceptor (N) Funding Source:<br />
Water & Sewer Revenues<br />
Project Description:<br />
Installation <strong>of</strong> an interceptor sewer along the Bethany Home Road alignment from 83rd to 95th Avenue. The<br />
interceptor is designed to intercept flows from the existing sewers in 83rd and 91st Avenues that had to be<br />
altered due to construction <strong>of</strong> the Bethany Home Outfall Channel.<br />
Capital Costs: FY 20<strong>12</strong> FY 2013 FY 2014 FY 2015 FY 2016 FYs 17-21<br />
Design $0 $0 $0 $0 $0 $720,000<br />
Construction $0 $0 $0 $0 $0 $2,740,000<br />
Finance Charges $0 $0 $0 $0 $0 $51,900<br />
Engineering Charges $0 $0 $0 $0 $0 $64,010<br />
Arts $0 $0 $0 $0 $0 $27,400<br />
Contingency $0 $0 $0 $0 $0 $346,690<br />
TOTAL $0 $0 $0 $0 $0 $3,950,000<br />
Operating Description:<br />
No additional O and M is needed.<br />
Project: T3611 - Glendale Ave 93rd-99th Ave (N) Funding Source:<br />
Water & Sewer Revenues<br />
Project Description:<br />
Improvements will be needed to handle the additional wastewater flows generated by projected growth at buildout<br />
in the west area <strong>of</strong> the <strong>city</strong>. Improvements include the design and construction <strong>of</strong> a parallel relief sewer on<br />
Glendale Avenue from 93rd to 99th Avenue. The relief sewer will be constructed in two phases. These proposed<br />
improvements were identified in the sewer collection study completed by Camp, Dresser, and McKee (CDM).<br />
Capital Costs: FY 20<strong>12</strong> FY 2013 FY 2014 FY 2015 FY 2016 FYs 17-21<br />
Design $0 $0 $0 $0 $50,000 $35,000<br />
Construction $0 $0 $0 $0 $422,000 $300,000<br />
Engineering Charges $0 $0 $0 $0 $20,296 $14,405<br />
Arts $0 $0 $0 $0 $4,220 $3,000<br />
Contingency $0 $0 $0 $0 $43,484 $32,840<br />
TOTAL $0 $0 $0 $0 $540,000 $385,245<br />
Operating Description:<br />
No additional O and M is need for this project.<br />
* New Project<br />
N=New Asset, R=Replacement <strong>of</strong> Existing Asset, I=Improvement <strong>of</strong> Existing Asset<br />
439<br />
Return to CIP TOC
FY 20<strong>12</strong>-2021 Capital Improvement Plan<br />
Capital Project Expenses Detail<br />
2420 - Sewer Category: Revenue<br />
Project: T36<strong>12</strong> - Influent Pump Sta (RSPS) Imp (N) Funding Source:<br />
Water & Sewer Revenues<br />
Project Description:<br />
The requested funding is for a new screening system that is expected to reduce maintenance efforts required for<br />
the waste activated sludge pumps at the West Area Water Reclamation Facility. The new screening system will<br />
include mechanical bar screens, a washer compactor conveyor system with dumpster storage area, a building<br />
and odor control system. This project will include an enclosed self cleaning bar screen and ancillary system.<br />
Capital Costs: FY 20<strong>12</strong> FY 2013 FY 2014 FY 2015 FY 2016 FYs 17-21<br />
Design $0 $0 $0 $423,000 $430,000 $0<br />
Construction $0 $0 $0 $9,819 $3,600,000 $0<br />
Finance Charges $0 $0 $0 $0 $59,910 $0<br />
Engineering Charges $0 $0 $0 $8,007 $74,555 $0<br />
Arts $0 $0 $0 $98 $36,000 $0<br />
Contingency $0 $0 $0 $59,076 $399,535 $0<br />
TOTAL $0 $0 $0 $500,000 $4,600,000 $0<br />
Operating Description:<br />
No additional O and M is need for this project.<br />
* New Project<br />
N=New Asset, R=Replacement <strong>of</strong> Existing Asset, I=Improvement <strong>of</strong> Existing Asset<br />
440<br />
Return to CIP TOC
20<strong>12</strong>-2021 CAPITAL IMPROVEMENT PLAN<br />
Transportation – Other Funds<br />
TRANSPORTATION<br />
This category includes projects funded with revenue bonds backed by the half-cent transportation<br />
sales tax approved by Glendale voters in 2001. The half-cent sales tax will fund improvement<br />
projects for all modes <strong>of</strong> transportation including transit, street, bicycle, pedestrian and aviation<br />
(Fund 2210). This category also includes projects covered by HURF revenue bonds (2000), the<br />
Street Fund (Fund 1340) and transportation related grants (Fund 1650).<br />
Over the next few years, transit projects paid from the half-cent sales tax will include projects<br />
related to bus services, a transit center and <strong>preliminary</strong> light rail studies. The street element <strong>of</strong><br />
the Transportation Plan emphasizes improvements at major intersections as well as<br />
improvements and enhancements along major streets. A majority <strong>of</strong> FY 20<strong>12</strong> funding is for the<br />
Northern Avenue Super Street Project that will create an east-west corridor between Grand<br />
Avenue and the Loop 303. Other projects and programs in the Transportation Plan include<br />
enhancing the bicycle system, traffic mitigation and providing matching funds for airport capital<br />
grants.<br />
Carryover funding is available in the HURF bond fund to complete street improvements on 67 th<br />
Avenue from Camelback to Grand Avenue. Two additional street improvement projects are<br />
included in the last five years <strong>of</strong> the capital improvement plan.<br />
In the last five years <strong>of</strong> the capital plan, the Street Fund (Fund 1340) will cover the replacement<br />
and/or new purchase <strong>of</strong> a number <strong>of</strong> street maintenance related equipment including a concrete<br />
mixer truck, asphalt roller, asphalt paving machine, water truck and right-<strong>of</strong>-way rearload truck .<br />
The Transportation Grants Fund (Fund 1650) was established to accommodate grants for capital<br />
projects from federal and state government agencies. These are open, competitive grant<br />
programs. Grant projects are <strong>budget</strong>ed in Fund 1650 upon notification that the <strong>city</strong> has received<br />
approval for grant funding. Transportation projects in which the <strong>city</strong> applies for reimbursement<br />
in a future year are <strong>budget</strong>ed in the transportation sales tax construction fund and any<br />
reimbursements are credited to the transportation sales tax construction fund as grant revenue<br />
when received. A number <strong>of</strong> transportation grant projects have carryover funding in FY 20<strong>12</strong><br />
included grant funding for the design <strong>of</strong> the transit center at Arrowhead.<br />
Project Name: Old Roma Alley Ped Project<br />
Funding Source: Transportation Grants<br />
Fund #: 1650<br />
Project #: 67511<br />
441<br />
Return to CIP TOC
FY <strong>2011</strong> - 2020 Capital Improvement Program<br />
Capital Projects By Fund and Project Number<br />
2210 - Transportation Construction Category: Transportation<br />
Capital Project Expenses<br />
Carryover<br />
FY 20<strong>12</strong>: FY 2013: FY 2014: FY 2015: FY 2016: FYs 17-21:<br />
New Funding<br />
Existing Assets<br />
Improvement <strong>of</strong> Existing Assets<br />
65005 Smart Traffic Signals 1,981,031<br />
0 <strong>12</strong>7,913 0 0 0 750,000<br />
65007 Grand Ave Access Enhancements 3,213,914<br />
0 0 0 0 0 0<br />
65008 Intersection Improvements 1,284,422<br />
0 0 0 0 0 0<br />
65013 Bus Stops and Shelters 100,000<br />
0 109,7<strong>12</strong> 1<strong>12</strong>,944 115,769 118,895 647,614<br />
65016 Northern Ave Super Street 11,813,4<strong>12</strong> 5,102,395 5,204,443 5,324,144 5,457,248 1,675,646 3,042,396<br />
65022 PE & Oversight for Transp. Pkg 1,427,461 508,501 518,670 530,599 0 0 0<br />
65072 Expanded Safety Program 933,563 105,556 109,147 1<strong>12</strong>,911 115,734 118,858 1,195,133<br />
65086 51st Avenue HES Projects 501,182<br />
0 0 0 0 0 0<br />
65088 Downtown Alley Improvements <strong>12</strong>9,913<br />
0 0 0 0 0 0<br />
T7404 Maryland Ave Bike Rte Spot Imp 0<br />
0 143,961 0 0 0 0<br />
T7405 *Pavement Management 675,009 2,000,000 2,000,000 2,000,000 2,000,000 2,000,000 10,000,000<br />
Replacement <strong>of</strong> Existing Assets<br />
65004 Buses/Vans 100,000 100,000 100,000 150,000 200,000 250,000 1,579,903<br />
65014 Transit Support Capital 50,000 50,000 75,000 100,000 <strong>12</strong>5,000 150,000 939,649<br />
65083 Speed Cushions 298,605<br />
0 156,575 161,735 167,145 0 0<br />
Sub-Total - Existing Assets 22,508,5<strong>12</strong> 7,866,452 8,545,421 8,492,333 8,180,896 4,313,399 18,154,695<br />
New Assets<br />
65006 Bus Pullouts 0<br />
0 0 0 0 0 1,146,730<br />
65017 Rail System 2,469,664 50,850 52,587 53,060 54,387 55,855 3,677,578<br />
65030 Multi-Use Pathway Grand Canal 1,157,055<br />
0 0 0 0 0 0<br />
65054 63rd Ave @ Loop 101-Bike Ove 11,666<br />
0 0 0 0 0 0<br />
65062 Glendale Sports Facilities Sgn 470,000<br />
0 0 0 0 0 0<br />
65063 New River - Multi-use Pathway 2,400,000<br />
0 0 0 0 0 0<br />
65078 Airport Matching Funds 166,203 403,988 10,913 35,935 203,455 211,735 6,152<br />
65080 Bell/101 Park&Ride/Transit Ctr 2,000,000<br />
0 0 0 0 0 0<br />
Sub-Total - New Assets 8,674,588 454,838 63,500 88,995 257,842 267,590 4,830,460<br />
Total Project Expenses: $31,183,100<br />
Total FY 20<strong>12</strong> Funding: $39,504,390<br />
* New Project<br />
$8,321,290 $8,608,921 $8,581,328 $8,438,738 $4,580,989 $22,985,155<br />
442<br />
Return to CIP TOC
FY 20<strong>12</strong>-2021 Capital Improvement Plan<br />
Capital Project Expenses Detail<br />
2210 - Transportation Construction Category: Transportation<br />
Project: 65005 - Smart Traffic Signals (I) Funding Source:<br />
Half Cent Sales Tax<br />
Project Description:<br />
A smart traffic signal system will be implemented that includes more left turn arrows, roadway sensors and fiber<br />
optic connections to a control center to make traffic signals more responsive.<br />
Capital Costs: FY 20<strong>12</strong> FY 2013 FY 2014 FY 2015 FY 2016 FYs 17-21<br />
Finance Charges $0 $1,919 $0 $0 $0 $11,250<br />
Contingency $0 $6,396 $0 $0 $0 $0<br />
Miscellaneous/Other $0 $119,598 $0 $0 $0 $738,750<br />
Sub-Total New Funding $0 $<strong>12</strong>7,913 $0 $0 $0 $750,000<br />
FY 20<strong>12</strong> Carryover<br />
$1,981,031 $0 $0 $0 $0 $0<br />
TOTAL $1,981,031 $<strong>12</strong>7,913 $0 $0 $0 $750,000<br />
Operating Description:<br />
O and M costs associated with electri<strong>city</strong> for new signal heads, cameras and communication equipment as well<br />
as maintenance <strong>of</strong> fiber optic connections. O and M for this project will be identified once federal funds have<br />
been secured and the scope <strong>of</strong> the project is available.<br />
Project: 65007 - Grand Ave Access Enhancements (I) Funding Source:<br />
Half Cent Sales Tax<br />
Project Description:<br />
This project provides enhanced access control along Grand Avenue and includes beautification and sidewalks.<br />
Capital Costs: FY 20<strong>12</strong> FY 2013 FY 2014 FY 2015 FY 2016 FYs 17-21<br />
FY 20<strong>12</strong> Carryover<br />
$3,213,914 $0 $0 $0 $0 $0<br />
TOTAL $3,213,914 $0 $0 $0 $0 $0<br />
Operating Description:<br />
O and M is associated with 1<strong>12</strong>,113 sq ft <strong>of</strong> landscape maintenance and irrigation water. A supplemental <strong>budget</strong><br />
request will be made when the project is close to completion.<br />
Operating Costs: FY 20<strong>12</strong> FY 2013 FY 2014 FY 2015 FY 2016 FYs 17-21<br />
Landscape $0 $24,665 $25,405 $26,167 $26,952 $147,385<br />
TOTAL $0 $24,665 $25,405 $26,167 $26,952 $147,385<br />
Project: 65008 - Intersection Improvements (I) Funding Source:<br />
Half Cent Sales Tax<br />
Project Description:<br />
This project provides for the design and construction <strong>of</strong> intersection improvements for capa<strong>city</strong>, safety and<br />
access as identified on an ongoing basis. Turning lanes, median barriers, lane extensions, right-<strong>of</strong>-way, utility<br />
relocations and pave access points are examples <strong>of</strong> the type <strong>of</strong> construction this project will fund.<br />
Capital Costs: FY 20<strong>12</strong> FY 2013 FY 2014 FY 2015 FY 2016 FYs 17-21<br />
FY 20<strong>12</strong> Carryover<br />
$1,284,422 $0 $0 $0 $0 $0<br />
TOTAL $1,284,422 $0 $0 $0 $0 $0<br />
Operating Description:<br />
No additional O and M is needed.<br />
* New Project<br />
N=New Asset, R=Replacement <strong>of</strong> Existing Asset, I=Improvement <strong>of</strong> Existing Asset<br />
443<br />
Return to CIP TOC
FY 20<strong>12</strong>-2021 Capital Improvement Plan<br />
Capital Project Expenses Detail<br />
2210 - Transportation Construction Category: Transportation<br />
Project: 65013 - Bus Stops and Shelters (I) Funding Source:<br />
Half Cent Sales Tax<br />
Project Description:<br />
Bus shelters, with shade and seating, will be provided where bus transfers occur and at other high demand<br />
locations. Benches will be provided at other bus stops as needed.<br />
Capital Costs: FY 20<strong>12</strong> FY 2013 FY 2014 FY 2015 FY 2016 FYs 17-21<br />
Design $0 $9,402 $9,679 $9,921 $10,189 $55,499<br />
Construction $0 $85,613 $88,136 $90,340 $92,779 $505,359<br />
Finance Charges $0 $1,643 $1,691 $1,734 $1,780 $9,698<br />
Engineering Charges $0 $4,086 $4,206 $4,311 $4,428 $24,117<br />
Arts $0 $856 $881 $903 $928 $5,054<br />
Contingency $0 $8,1<strong>12</strong> $8,351 $8,560 $8,791 $47,887<br />
Sub-Total New Funding $0 $109,7<strong>12</strong> $1<strong>12</strong>,944 $115,769 $118,895 $647,614<br />
FY 20<strong>12</strong> Carryover<br />
$100,000 $0 $0 $0 $0 $0<br />
TOTAL $100,000 $109,7<strong>12</strong> $1<strong>12</strong>,944 $115,769 $118,895 $647,614<br />
Operating Description:<br />
O and M associated with the maintenance <strong>of</strong> bus shelters as they become completed. A supplemental <strong>budget</strong><br />
requests will be made as new bus stops are added.<br />
Operating Costs: FY 20<strong>12</strong> FY 2013 FY 2014 FY 2015 FY 2016 FYs 17-21<br />
Equip. Maint. $0 $10,927 $22,510 $34,779 $47,764 $460,929<br />
TOTAL $0 $10,927 $22,510 $34,779 $47,764 $460,929<br />
Project: 65016 - Northern Ave Super Street (I) Funding Source:<br />
Half Cent Sales Tax<br />
Project Description:<br />
Per Intergovernmental Agreement, right-<strong>of</strong>-way acquisition and construction <strong>of</strong> the Northern Parkway corridor<br />
alignment between Loop 303 and Grand Avenue is targeted for completion by FY 2026. When completed the<br />
Northern Parkway will have six through lanes and grade separations at major arterials. Costs for this project are<br />
shared between the region at 70% ($221 million) and local agencies at 30%. Glendale's portion <strong>of</strong> local funding<br />
is $39 million. Other jurisdictions involved include Maricopa County, Peoria, and El Mirage.<br />
Capital Costs: FY 20<strong>12</strong> FY 2013 FY 2014 FY 2015 FY 2016 FYs 17-21<br />
Land $0 $0 $0 $0 $1,566,729 $2,844,640<br />
Finance Charges $76,540 $78,071 $79,866 $81,863 $25,135 $45,636<br />
Contingency $255,<strong>12</strong>0 $260,222 $266,207 $272,862 $83,782 $152,<strong>12</strong>0<br />
Miscellaneous/Other $4,770,735 $4,866,150 $4,978,071 $5,102,523 $0 $0<br />
Sub-Total New Funding $5,102,395 $5,204,443 $5,324,144 $5,457,248 $1,675,646 $3,042,396<br />
FY 20<strong>12</strong> Carryover<br />
$11,813,4<strong>12</strong> $0 $0 $0 $0 $0<br />
TOTAL $16,915,807 $5,204,443 $5,324,144 $5,457,248 $1,675,646 $3,042,396<br />
Operating Description:<br />
O and M costs are for landscape, water, electrical and other maintenance based on current design. A<br />
supplemental <strong>budget</strong> requests will be made when project phases are close to completion.<br />
Operating Costs: FY 20<strong>12</strong> FY 2013 FY 2014 FY 2015 FY 2016 FYs 17-21<br />
Utilities $0 $3,631 $3,740 $3,852 $3,968 $21,699<br />
Landscape $0 $18,806 $19,370 $19,951 $20,550 $1<strong>12</strong>,378<br />
TOTAL $0 $22,437 $23,110 $23,803 $24,518 $134,077<br />
* New Project<br />
N=New Asset, R=Replacement <strong>of</strong> Existing Asset, I=Improvement <strong>of</strong> Existing Asset<br />
444<br />
Return to CIP TOC
FY 20<strong>12</strong>-2021 Capital Improvement Plan<br />
Capital Project Expenses Detail<br />
2210 - Transportation Construction Category: Transportation<br />
Project: 65022 - PE & Oversight for Transp. Pkg (I) Funding Source:<br />
Half Cent Sales Tax<br />
Project Description:<br />
Pr<strong>of</strong>essional engineering for preparation <strong>of</strong> design concepts, and administration <strong>of</strong> right-<strong>of</strong>-way purchase for<br />
roadway, bicycle, pedestrian and transit projects.<br />
Capital Costs: FY 20<strong>12</strong> FY 2013 FY 2014 FY 2015 FY 2016 FYs 17-21<br />
Finance Charges $7,628 $7,780 $7,959 $0 $0 $0<br />
Contingency $25,425 $25,934 $26,530 $0 $0 $0<br />
Miscellaneous/Other $475,448 $484,956 $496,110 $0 $0 $0<br />
Sub-Total New Funding $508,501 $518,670 $530,599 $0 $0 $0<br />
FY 20<strong>12</strong> Carryover<br />
$1,427,461 $0 $0 $0 $0 $0<br />
TOTAL $1,935,962 $518,670 $530,599 $0 $0 $0<br />
Operating Description:<br />
No additional O and M is needed.<br />
Project: 65072 - Expanded Safety Program (I) Funding Source:<br />
Half Cent Sales Tax<br />
Project Description:<br />
Provide traffic safety improvements along <strong>city</strong> streets to improve the safety <strong>of</strong> motorists. Examples are safety<br />
mitigation at bridge crossing (blunt ends), lighting, signing, striping, pedestrian and bicyclist safety<br />
improvements, discontinuous roadway sections (drop-<strong>of</strong>fs), and access management.<br />
Capital Costs: FY 20<strong>12</strong> FY 2013 FY 2014 FY 2015 FY 2016 FYs 17-21<br />
Finance Charges $1,582 $1,638 $1,694 $1,736 $1,783 $17,928<br />
Contingency $5,278 $5,457 $5,646 $5,787 $5,943 $59,757<br />
Miscellaneous/Other $98,696 $102,052 $105,571 $108,211 $111,132 $1,117,448<br />
Sub-Total New Funding $105,556 $109,147 $1<strong>12</strong>,911 $115,734 $118,858 $1,195,133<br />
FY 20<strong>12</strong> Carryover<br />
$933,563 $0 $0 $0 $0 $0<br />
TOTAL $1,039,119 $109,147 $1<strong>12</strong>,911 $115,734 $118,858 $1,195,133<br />
Operating Description:<br />
No additional O and M is needed.<br />
Project: 65086 - 51st Avenue HES Projects (I) Funding Source:<br />
Half Cent Sales Tax<br />
Project Description:<br />
H<strong>az</strong>ard Elimination Safety projects provide for intersection capa<strong>city</strong> and safety improvements at the intersections<br />
<strong>of</strong> 51st Avenue and Camelback Road and 51st Avenue and Northern Avenue. Projects include right turn lanes,<br />
bus bays and shelters, modifications to traffic signals and street lights and landscaping.<br />
Capital Costs: FY 20<strong>12</strong> FY 2013 FY 2014 FY 2015 FY 2016 FYs 17-21<br />
FY 20<strong>12</strong> Carryover<br />
$501,182 $0 $0 $0 $0 $0<br />
TOTAL $501,182 $0 $0 $0 $0 $0<br />
Operating Description:<br />
O and M costs are for landscape maintenance. A supplemental <strong>budget</strong> request will be made when the project is<br />
close to completion.<br />
Operating Costs: FY 20<strong>12</strong> FY 2013 FY 2014 FY 2015 FY 2016 FYs 17-21<br />
Landscape $0 $270 $278 $286 $295 $1,613<br />
TOTAL $0 $270 $278 $286 $295 $1,613<br />
* New Project<br />
N=New Asset, R=Replacement <strong>of</strong> Existing Asset, I=Improvement <strong>of</strong> Existing Asset<br />
445<br />
Return to CIP TOC
FY 20<strong>12</strong>-2021 Capital Improvement Plan<br />
Capital Project Expenses Detail<br />
2210 - Transportation Construction Category: Transportation<br />
Project: 65088 - Downtown Alley Improvements (I) Funding Source:<br />
Half Cent Sales Tax<br />
Project Description:<br />
Design and construct transformation <strong>of</strong> existing service alley into a safe environment for pedestrian circulation<br />
and limited vehicular traffic.<br />
Capital Costs: FY 20<strong>12</strong> FY 2013 FY 2014 FY 2015 FY 2016 FYs 17-21<br />
FY 20<strong>12</strong> Carryover<br />
$<strong>12</strong>9,913 $0 $0 $0 $0 $0<br />
TOTAL $<strong>12</strong>9,913 $0 $0 $0 $0 $0<br />
Operating Description:<br />
O and M includes $2,438 for the maintenance <strong>of</strong> 10 pedestrian lights, $1,200 for water, $300 for landscape<br />
maintenance by an outside company, $2,200 for downtown beautification crew maintenance and $300 for<br />
electri<strong>city</strong>. A supplemental <strong>budget</strong> request will be submitted once the project is near completion.<br />
Operating Costs: FY 20<strong>12</strong> FY 2013 FY 2014 FY 2015 FY 2016 FYs 17-21<br />
Electrical $0 $2,738 $2,820 $2,905 $2,992 $16,361<br />
Landscape $0 $2,500 $2,575 $2,652 $2,732 $14,939<br />
Water $0 $1,200 $1,236 $1,273 $1,311 $7,171<br />
TOTAL $0 $6,438 $6,631 $6,830 $7,035 $38,471<br />
Project: T7404 - Maryland Ave Bike Rte Spot Imp (I) Funding Source:<br />
Half Cent Sales Tax<br />
Project Description:<br />
The project will add additional asphalt for bike lanes where Maryland Avenue is too narrow and build short<br />
multiuse path segments to tie Maryland Avenue into existing pathways in Discovery Park. Overall, the project<br />
would add 1,776 feet <strong>of</strong> bikeway improvements to make Maryland Avenue a more continuous bike route from<br />
43rd Avenue to 91st Avenue at the Glendale sports complex.<br />
Capital Costs: FY 20<strong>12</strong> FY 2013 FY 2014 FY 2015 FY 2016 FYs 17-21<br />
Construction $0 $<strong>12</strong>2,102 $0 $0 $0 $0<br />
Finance Charges $0 $1,440 $0 $0 $0 $0<br />
Engineering Charges $0 $<strong>12</strong>,000 $0 $0 $0 $0<br />
Arts $0 $1,221 $0 $0 $0 $0<br />
Contingency $0 $7,198 $0 $0 $0 $0<br />
TOTAL $0 $143,961 $0 $0 $0 $0<br />
Operating Description:<br />
No additional O and M is needed.<br />
* New Project<br />
N=New Asset, R=Replacement <strong>of</strong> Existing Asset, I=Improvement <strong>of</strong> Existing Asset<br />
446<br />
Return to CIP TOC
FY 20<strong>12</strong>-2021 Capital Improvement Plan<br />
Capital Project Expenses Detail<br />
2210 - Transportation Construction Category: Transportation<br />
Project: T7405* - Pavement Management (I) Funding Source:<br />
Half Cent Sales Tax<br />
Project Description:<br />
Pavement maintenance programs maximizing the life <strong>of</strong> the street network. This may include activities ranging<br />
from surface preparation, repairs and treatments, to heavy full depth paving and rubberized asphalt overlays.<br />
Pavement maintenance and rehabilitation activities are recommended to properly address the needs <strong>of</strong> each<br />
individual street segment using data gathered in the development <strong>of</strong> the pavement management program.<br />
Streets are selected and scheduled within the available funding. Carryover funding from the Collector/Residential<br />
Overlay Project and Arterial Overlay Project are included in this project.<br />
Capital Costs: FY 20<strong>12</strong> FY 2013 FY 2014 FY 2015 FY 2016 FYs 17-21<br />
Construction $1,962,709 $1,962,709 $1,962,709 $1,962,709 $1,962,709 $9,813,543<br />
Engineering Charges $17,664 $17,664 $17,664 $17,664 $17,664 $88,322<br />
Arts $19,627 $19,627 $19,627 $19,627 $19,627 $98,135<br />
Sub-Total New Funding $2,000,000 $2,000,000 $2,000,000 $2,000,000 $2,000,000 $10,000,000<br />
FY 20<strong>12</strong> Carryover<br />
$675,009 $0 $0 $0 $0 $0<br />
TOTAL $2,675,009 $2,000,000 $2,000,000 $2,000,000 $2,000,000 $10,000,000<br />
Operating Description:<br />
No additional O and M is need for this project.<br />
Project: 65004 - Buses/Vans (R) Funding Source:<br />
Half Cent Sales Tax<br />
Project Description:<br />
This project replaces buses and vans for local circulators and Dial-a-Ride service. The buses are replaced every<br />
four years or when mileage exceeds recommended limits.<br />
Capital Costs: FY 20<strong>12</strong> FY 2013 FY 2014 FY 2015 FY 2016 FYs 17-21<br />
Finance Charges $1,500 $1,500 $2,250 $3,000 $3,750 $23,699<br />
Equipment $93,500 $93,500 $140,250 $187,000 $233,750 $1,437,711<br />
Contingency $5,000 $5,000 $7,500 $10,000 $<strong>12</strong>,500 $118,493<br />
Sub-Total New Funding $100,000 $100,000 $150,000 $200,000 $250,000 $1,579,903<br />
FY 20<strong>12</strong> Carryover<br />
$100,000 $0 $0 $0 $0 $0<br />
TOTAL $200,000 $100,000 $150,000 $200,000 $250,000 $1,579,903<br />
Operating Description:<br />
No O and M associated with replacement vehicle maintenance for circulator and shuttle.<br />
* New Project<br />
N=New Asset, R=Replacement <strong>of</strong> Existing Asset, I=Improvement <strong>of</strong> Existing Asset<br />
447<br />
Return to CIP TOC
FY 20<strong>12</strong>-2021 Capital Improvement Plan<br />
Capital Project Expenses Detail<br />
2210 - Transportation Construction Category: Transportation<br />
Project: 65014 - Transit Support Capital (R) Funding Source:<br />
Half Cent Sales Tax<br />
Project Description:<br />
To continue delivery <strong>of</strong> transit services, replacement capital expenditures are needed including computer<br />
equipment, support vehicles and radio systems. Because <strong>of</strong> past federal funding sources for these items, Transit<br />
has not contributed to replacement funds for vehicles or computers.<br />
Capital Costs: FY 20<strong>12</strong> FY 2013 FY 2014 FY 2015 FY 2016 FYs 17-21<br />
Finance Charges $750 $1,<strong>12</strong>5 $1,500 $1,875 $2,250 $14,095<br />
Contingency $2,500 $3,750 $5,000 $6,250 $7,500 $46,982<br />
Miscellaneous/Other $46,750 $70,<strong>12</strong>5 $93,500 $116,875 $140,250 $878,572<br />
Sub-Total New Funding $50,000 $75,000 $100,000 $<strong>12</strong>5,000 $150,000 $939,649<br />
FY 20<strong>12</strong> Carryover<br />
$50,000 $0 $0 $0 $0 $0<br />
TOTAL $100,000 $75,000 $100,000 $<strong>12</strong>5,000 $150,000 $939,649<br />
Operating Description:<br />
No additional O and M is required for this project.<br />
Project: 65083 - Speed Cushions (R) Funding Source:<br />
Half Cent Sales Tax<br />
Project Description:<br />
This project will remove and replace existing modified speed humps with speed cushions and add mitigation<br />
devices where warranted. Replacing modified speed humps and constructing new mitigation devices will help<br />
address the current backlog <strong>of</strong> neighborhoods quali<strong>fy</strong>ing for traffic mitigation.<br />
Capital Costs: FY 20<strong>12</strong> FY 2013 FY 2014 FY 2015 FY 2016 FYs 17-21<br />
Construction $0 $132,553 $136,923 $141,503 $0 $0<br />
Finance Charges $0 $2,349 $2,426 $2,507 $0 $0<br />
Engineering Charges $0 $8,749 $9,037 $9,339 $0 $0<br />
Arts $0 $1,326 $1,369 $1,415 $0 $0<br />
Contingency $0 $11,598 $11,980 $<strong>12</strong>,381 $0 $0<br />
Sub-Total New Funding $0 $156,575 $161,735 $167,145 $0 $0<br />
FY 20<strong>12</strong> Carryover<br />
$298,605 $0 $0 $0 $0 $0<br />
TOTAL $298,605 $156,575 $161,735 $167,145 $0 $0<br />
Operating Description:<br />
No additional O and M is needed.<br />
* New Project<br />
N=New Asset, R=Replacement <strong>of</strong> Existing Asset, I=Improvement <strong>of</strong> Existing Asset<br />
448<br />
Return to CIP TOC
FY 20<strong>12</strong>-2021 Capital Improvement Plan<br />
Capital Project Expenses Detail<br />
2210 - Transportation Construction Category: Transportation<br />
Project: 65006 - Bus Pullouts (N) Funding Source:<br />
Half Cent Sales Tax<br />
Project Description:<br />
Bus pull-outs to relieve congestion, improve air quality, and provide traffic and pedestrian safety. Bus pullouts will<br />
be provided at major intersections where there are bus route extensions and new bus routes.<br />
Capital Costs: FY 20<strong>12</strong> FY 2013 FY 2014 FY 2015 FY 2016 FYs 17-21<br />
Land $0 $0 $0 $0 $0 $172,009<br />
Design $0 $0 $0 $0 $0 $172,009<br />
Construction $0 $0 $0 $0 $0 $660,516<br />
Finance Charges $0 $0 $0 $0 $0 $17,202<br />
Engineering Charges $0 $0 $0 $0 $0 $35,799<br />
Arts $0 $0 $0 $0 $0 $6,605<br />
Contingency $0 $0 $0 $0 $0 $57,336<br />
Miscellaneous/Other $0 $0 $0 $0 $0 $25,254<br />
TOTAL $0 $0 $0 $0 $0 $1,146,730<br />
Operating Description:<br />
No additional O and M is needed.<br />
Project: 65017 - Rail System (N) Funding Source:<br />
Half Cent Sales Tax<br />
Project Description:<br />
Planning studies, design, right-<strong>of</strong>-way acquisition and construction <strong>of</strong> light rail facility to be located on an<br />
alignment to be determined. Federal and regional grants will fund 60% <strong>of</strong> the project. Current cost estimates are<br />
based on regional plans prepared by Metro. Costs below reflect Glendale's fees to Metro and Alternatives<br />
Analysis studies in later years.<br />
Capital Costs: FY 20<strong>12</strong> FY 2013 FY 2014 FY 2015 FY 2016 FYs 17-21<br />
Finance Charges $763 $778 $796 $816 $838 $55,166<br />
Contingency $87 $1,809 $2,264 $3,571 $5,017 $183,879<br />
Miscellaneous/Other $50,000 $50,000 $50,000 $50,000 $50,000 $3,438,533<br />
Sub-Total New Funding $50,850 $52,587 $53,060 $54,387 $55,855 $3,677,578<br />
FY 20<strong>12</strong> Carryover<br />
$2,469,664 $0 $0 $0 $0 $0<br />
TOTAL $2,520,514 $52,587 $53,060 $54,387 $55,855 $3,677,578<br />
Operating Description:<br />
O and M costs will be requested for inclusion after completion <strong>of</strong> the project in FY 2026. A supplemental <strong>budget</strong><br />
request will be submitted once the project is near completion.<br />
* New Project<br />
N=New Asset, R=Replacement <strong>of</strong> Existing Asset, I=Improvement <strong>of</strong> Existing Asset<br />
449<br />
Return to CIP TOC
FY 20<strong>12</strong>-2021 Capital Improvement Plan<br />
Capital Project Expenses Detail<br />
2210 - Transportation Construction Category: Transportation<br />
Project: 65030 - Multi-Use Pathway Grand Canal (N) Funding Source:<br />
Half Cent Sales Tax<br />
Project Description:<br />
Construct a multiuse path from just east <strong>of</strong> the Loop 101 Freeway to New River. The project will provide a safe<br />
and convenient, <strong>of</strong>f-street facility for bicyclists and pedestrians that extends the existing Grand Canal Linear Park<br />
path to the future New River Pathway. Additional federal funds have also been awarded towards this project.<br />
Capital Costs: FY 20<strong>12</strong> FY 2013 FY 2014 FY 2015 FY 2016 FYs 17-21<br />
FY 20<strong>12</strong> Carryover<br />
$1,157,055 $0 $0 $0 $0 $0<br />
TOTAL $1,157,055 $0 $0 $0 $0 $0<br />
Operating Description:<br />
O and M associated with the maintenance <strong>of</strong> trash receptacles and 30 foot wide landscaped area along a 6,300<br />
foot long multiuse pathway. A supplemental <strong>budget</strong> request will be submitted once the project is near completion.<br />
Operating Costs: FY 20<strong>12</strong> FY 2013 FY 2014 FY 2015 FY 2016 FYs 17-21<br />
Landscape $0 $41,580 $42,827 $44,1<strong>12</strong> $45,436 $248,460<br />
Refuse $0 $8,698 $8,959 $9,228 $9,505 $51,979<br />
TOTAL $0 $50,278 $51,786 $53,340 $54,941 $300,439<br />
Project: 65054 - 63rd Ave @ Loop 101-Bike Ove (N) Funding Source:<br />
Half Cent Sales Tax<br />
Project Description:<br />
Construct an overpass at the Loop 101 near 63rd Avenue for safe bicycle and pedestrian crossing over Loop<br />
101. The amount programmed is Glendale's match and post design services cost. Design <strong>of</strong> the project is<br />
complete and ADOT is administering the construction <strong>of</strong> the project. Glendale has contracted with a consultant to<br />
provide post design services.<br />
Capital Costs: FY 20<strong>12</strong> FY 2013 FY 2014 FY 2015 FY 2016 FYs 17-21<br />
FY 20<strong>12</strong> Carryover<br />
$11,666 $0 $0 $0 $0 $0<br />
TOTAL $11,666 $0 $0 $0 $0 $0<br />
Operating Description:<br />
O and M includes bi-<strong>annual</strong> bridge inspections. A request for supplemental <strong>budget</strong> will be made in a future year<br />
and current costs will be absorbed by the Transportation <strong>budget</strong>.<br />
Operating Costs: FY 20<strong>12</strong> FY 2013 FY 2014 FY 2015 FY 2016 FYs 17-21<br />
Supplies/Contr $0 $1,545 $1,591 $1,639 $1,688 $9,232<br />
TOTAL $0 $1,545 $1,591 $1,639 $1,688 $9,232<br />
* New Project<br />
N=New Asset, R=Replacement <strong>of</strong> Existing Asset, I=Improvement <strong>of</strong> Existing Asset<br />
450<br />
Return to CIP TOC
FY 20<strong>12</strong>-2021 Capital Improvement Plan<br />
Capital Project Expenses Detail<br />
2210 - Transportation Construction Category: Transportation<br />
Project: 65062 - Glendale Sports Facilities Sgn (N) Funding Source:<br />
Half Cent Sales Tax<br />
Project Description:<br />
This project includes design, purchase and installation <strong>of</strong> full matrix arterial street Dynamic Message Signs and<br />
lane control signs around the Glendale Sports Facilities in addition to the communications connections <strong>of</strong> the<br />
signs to the central traffic control system.<br />
Capital Costs: FY 20<strong>12</strong> FY 2013 FY 2014 FY 2015 FY 2016 FYs 17-21<br />
FY 20<strong>12</strong> Carryover<br />
$470,000 $0 $0 $0 $0 $0<br />
TOTAL $470,000 $0 $0 $0 $0 $0<br />
Operating Description:<br />
O and M for this project is for electrical costs <strong>of</strong> the message signs. Equipment maintenance costs for the<br />
expected life is ten years and significant maintenance costs at $5,000 per year after five years <strong>of</strong> installation. A<br />
supplemental <strong>budget</strong> request will be made when project is close to completion.<br />
Operating Costs: FY 20<strong>12</strong> FY 2013 FY 2014 FY 2015 FY 2016 FYs 17-21<br />
Supplies/Contr $0 $0 $1,<strong>12</strong>6 $1,160 $1,194 $6,531<br />
Utilities $0 $0 $1,<strong>12</strong>6 $1,160 $1,194 $6,530<br />
Equip. Maint. $0 $0 $5,000 $5,150 $5,304 $29,005<br />
TOTAL $0 $0 $7,252 $7,470 $7,692 $42,066<br />
Project: 65063 - New River - Multi-use Pathway (N) Funding Source:<br />
Half Cent Sales Tax<br />
Project Description:<br />
Construct a multiuse path from the Bethany Home Road alignment to Northern Avenue. The project will provide<br />
a safe and convenient, <strong>of</strong>f-street facility for bicyclists and pedestrians that is part <strong>of</strong> the regional West Valley<br />
Rivers Multimodal Corridor Master Plan. Federal funds have been awarded to this project.<br />
Capital Costs: FY 20<strong>12</strong> FY 2013 FY 2014 FY 2015 FY 2016 FYs 17-21<br />
FY 20<strong>12</strong> Carryover<br />
$2,400,000 $0 $0 $0 $0 $0<br />
TOTAL $2,400,000 $0 $0 $0 $0 $0<br />
Operating Description:<br />
O and M associated with 8 foot wide landscaped area along a <strong>12</strong>,200 foot long multiuse pathway. A<br />
supplemental <strong>budget</strong> request will be made when the project is close to completion.<br />
Operating Costs: FY 20<strong>12</strong> FY 2013 FY 2014 FY 2015 FY 2016 FYs 17-21<br />
Landscape $0 $21,009 $21,639 $22,288 $22,957 $<strong>12</strong>5,538<br />
TOTAL $0 $21,009 $21,639 $22,288 $22,957 $<strong>12</strong>5,538<br />
* New Project<br />
N=New Asset, R=Replacement <strong>of</strong> Existing Asset, I=Improvement <strong>of</strong> Existing Asset<br />
451<br />
Return to CIP TOC
FY 20<strong>12</strong>-2021 Capital Improvement Plan<br />
Capital Project Expenses Detail<br />
2210 - Transportation Construction Category: Transportation<br />
Project: 65078 - Airport Matching Funds (N) Funding Source:<br />
Half Cent Sales Tax<br />
Project Description:<br />
This project provides matching funds for Glendale Airport projects as identified by Airport staff. Funding covers<br />
100% <strong>of</strong> engineering and art related charges and 2.5% <strong>of</strong> all other capital costs. Refer to the Airport Capital Fund<br />
2<strong>12</strong>0 for detailed information related to the airport projects.<br />
Capital Costs: FY 20<strong>12</strong> FY 2013 FY 2014 FY 2015 FY 2016 FYs 17-21<br />
Land $375,000 $0 $0 $0 $0 $0<br />
Design $3,601 $0 $3,650 $57,268 $8,341 $0<br />
Construction $6,916 $3,561 $4,155 $13,058 $192,718 $0<br />
Finance Charges $6,060 $164 $539 $3,052 $3,176 $92<br />
Engineering Charges $6,<strong>12</strong>5 $7,146 $22,460 $<strong>12</strong>1,900 $0 $6,060<br />
Arts $36 $42 $131 $1,927 $0 $0<br />
Miscellaneous/Other $6,250 $0 $5,000 $6,250 $7,500 $0<br />
Sub-Total New Funding $403,988 $10,913 $35,935 $203,455 $211,735 $6,152<br />
FY 20<strong>12</strong> Carryover<br />
$166,203 $0 $0 $0 $0 $0<br />
TOTAL $570,191 $10,913 $35,935 $203,455 $211,735 $6,152<br />
Operating Description:<br />
This project provides local match funds for the capital project. Refer to the Airport Capital Fund 2<strong>12</strong>0 projects for<br />
O and M impact.<br />
Project: 65080 - Bell/101 Park&Ride/Transit Ctr (N) Funding Source:<br />
Half Cent Sales Tax<br />
Project Description:<br />
This project will construct a transit center and a park-and-ride facility in the Bell Rd and Loop 101 area to serve<br />
the needs <strong>of</strong> transit passengers from multiple bus routes including express service. Federal funds have been<br />
secured for this project.<br />
Capital Costs: FY 20<strong>12</strong> FY 2013 FY 2014 FY 2015 FY 2016 FYs 17-21<br />
FY 20<strong>12</strong> Carryover<br />
$2,000,000 $0 $0 $0 $0 $0<br />
TOTAL $2,000,000 $0 $0 $0 $0 $0<br />
Operating Description:<br />
There are no direct O and M costs to the City <strong>of</strong> Glendale related to this project. The facility to be maintained by<br />
other parties.<br />
* New Project<br />
N=New Asset, R=Replacement <strong>of</strong> Existing Asset, I=Improvement <strong>of</strong> Existing Asset<br />
452<br />
Return to CIP TOC
FY <strong>2011</strong> - 2020 Capital Improvement Program<br />
Capital Projects By Fund and Project Number<br />
2000 - HURF/Street Bonds Category: HURF<br />
Capital Project Expenses<br />
Carryover<br />
FY 20<strong>12</strong>: FY 2013: FY 2014: FY 2015: FY 2016: FYs 17-21:<br />
New Funding<br />
Existing Assets<br />
Improvement <strong>of</strong> Existing Assets<br />
68909 67th Ave-Camelback to Grand 197,379<br />
0 0 0 0 0 0<br />
68913 99th Widening-Camelbck-Northrn 0<br />
0 0 0 0 0 5,154,767<br />
T2710 67th Ave Glendale to Frier 0<br />
0 0 0 0 0 6,921,892<br />
Sub-Total - Existing Assets 197,379<br />
0 0 0 0 0 <strong>12</strong>,076,659<br />
Total Project Expenses: $197,379<br />
Total FY 20<strong>12</strong> Funding: $197,379<br />
* New Project<br />
$0 $0 $0 $0 $0 $<strong>12</strong>,076,659<br />
453<br />
Return to CIP TOC
FY 20<strong>12</strong>-2021 Capital Improvement Plan<br />
Capital Project Expenses Detail<br />
2000 - HURF/Street Bonds Category: HURF<br />
Project: 68909 - 67th Ave-Camelback to Grand (I) Funding Source:<br />
HURF Bonds<br />
Project Description:<br />
Construct street improvements on 67th Avenue from Camelback to Grand Avenue. The Transportation Sales<br />
Tax will fund design and construction <strong>of</strong> 67th Avenue at Camelback Road and Glendale Avenue. Project<br />
includes underground conversion <strong>of</strong> utilities, curb, gutter, sidewalk, and landscaping. Medians to be constructed<br />
in future years after storm drain is constructed.<br />
Capital Costs: FY 20<strong>12</strong> FY 2013 FY 2014 FY 2015 FY 2016 FYs 17-21<br />
FY 20<strong>12</strong> Carryover<br />
$197,379 $0 $0 $0 $0 $0<br />
TOTAL $197,379 $0 $0 $0 $0 $0<br />
Operating Description:<br />
No additional O and M is needed.<br />
Project: 68913 - 99th Widening-Camelbck-Northrn (I) Funding Source:<br />
HURF Bonds<br />
Project Description:<br />
Complete street improvements on 99th Avenue from Camelback Road to Northern Avenue as infill as the<br />
property develops. Improvements include curb, gutter, sidewalk, streetlights, landscaping and a bridge widening<br />
over the Grand Canal. Also included will be the piping <strong>of</strong> an existing SRP irrigation ditch and the underground<br />
conversion <strong>of</strong> the existing utilities.<br />
Capital Costs: FY 20<strong>12</strong> FY 2013 FY 2014 FY 2015 FY 2016 FYs 17-21<br />
Design $0 $0 $0 $0 $0 $735,000<br />
Construction $0 $0 $0 $0 $0 $3,675,000<br />
Finance Charges $0 $0 $0 $0 $0 $157,817<br />
Engineering Charges $0 $0 $0 $0 $0 $81,585<br />
Arts $0 $0 $0 $0 $0 $36,750<br />
Contingency $0 $0 $0 $0 $0 $468,615<br />
TOTAL $0 $0 $0 $0 $0 $5,154,767<br />
Operating Description:<br />
Estimated 132 street lights ($171 ea/yr) for 21/2 years. Landscaping will be maintained by the commercial<br />
development adjacent to the roadway. A supplemental <strong>budget</strong> request will be submitted once the project is near<br />
completion.<br />
Operating Costs: FY 20<strong>12</strong> FY 2013 FY 2014 FY 2015 FY 2016 FYs 17-21<br />
Utilities $0 $0 $0 $0 $0 $56,430<br />
TOTAL $0 $0 $0 $0 $0 $56,430<br />
* New Project<br />
N=New Asset, R=Replacement <strong>of</strong> Existing Asset, I=Improvement <strong>of</strong> Existing Asset<br />
454<br />
Return to CIP TOC
FY 20<strong>12</strong>-2021 Capital Improvement Plan<br />
Capital Project Expenses Detail<br />
2000 - HURF/Street Bonds Category: HURF<br />
Project: T2710 - 67th Ave Glendale to Frier (I) Funding Source:<br />
HURF Bonds<br />
Project Description:<br />
Construct street improvements on 67th Avenue from Glendale Avenue to Frier Drive. This project will widen 67th<br />
Avenue, add curb and gutter, sidewalks, street lights, and landscaping. Project will also underground overhead<br />
<strong>12</strong>kV power lines, move 69kV power poles and underground Salt River Project (SRP) irrigation ditches.<br />
Capital Costs: FY 20<strong>12</strong> FY 2013 FY 2014 FY 2015 FY 2016 FYs 17-21<br />
Land $0 $0 $0 $0 $0 $<strong>12</strong>9,553<br />
Design $0 $0 $0 $0 $0 $1,000,000<br />
Construction $0 $0 $0 $0 $0 $5,011,697<br />
Finance Charges $0 $0 $0 $0 $0 $<strong>12</strong>5,292<br />
Engineering Charges $0 $0 $0 $0 $0 $92,500<br />
Arts $0 $0 $0 $0 $0 $50,117<br />
Contingency $0 $0 $0 $0 $0 $5<strong>12</strong>,733<br />
TOTAL $0 $0 $0 $0 $0 $6,921,892<br />
Operating Description:<br />
Estimate based on two years <strong>of</strong> Operation and Maintenance. Utility costs are for 42 street lights. Landscape and<br />
water costs are for approximately 50,000 sq ft <strong>of</strong> landscaping. A supplemental <strong>budget</strong> request will be submitted<br />
once the project is near completion.<br />
Operating Costs: FY 20<strong>12</strong> FY 2013 FY 2014 FY 2015 FY 2016 FYs 17-21<br />
Utilities $0 $0 $0 $0 $0 $18,468<br />
Landscape $0 $0 $0 $0 $0 $28,287<br />
TOTAL $0 $0 $0 $0 $0 $46,755<br />
* New Project<br />
N=New Asset, R=Replacement <strong>of</strong> Existing Asset, I=Improvement <strong>of</strong> Existing Asset<br />
455<br />
Return to CIP TOC
FY <strong>2011</strong> - 2020 Capital Improvement Program<br />
Capital Projects By Fund and Project Number<br />
1340 - HURF/Streets Fund Category: Other<br />
Capital Project Expenses<br />
Carryover<br />
FY 20<strong>12</strong>: FY 2013: FY 2014: FY 2015: FY 2016: FYs 17-21:<br />
New Funding<br />
Existing Assets<br />
Replacement <strong>of</strong> Existing Assets<br />
T0003 Replacement <strong>of</strong> Streets Equipmt 0<br />
0 0 0 0 0 530,200<br />
T0010 Right <strong>of</strong> Way Rearload Truck 0<br />
0 0 0 0 0 290,000<br />
Sub-Total - Existing Assets 0<br />
0 0 0 0 0 820,200<br />
New Assets<br />
T0005 Additional Streets Equipment 0<br />
0 0 0 0 0 857,085<br />
Sub-Total - New Assets 0<br />
0 0 0 0 0 857,085<br />
Total Project Expenses: $0<br />
Total FY 20<strong>12</strong> Funding: $0<br />
* New Project<br />
$0 $0 $0 $0 $0 $1,677,285<br />
456<br />
Return to CIP TOC
FY 20<strong>12</strong>-2021 Capital Improvement Plan<br />
Capital Project Expenses Detail<br />
1340 - HURF/Streets Fund Category: Other<br />
Project: T0003 - Replacement <strong>of</strong> Streets Equipmt (R) Funding Source:<br />
Highway User Revenue Fund<br />
Project Description:<br />
Replace four pieces <strong>of</strong> equipment that are not in the vehicle replacement program and add this equipment to the<br />
vehicle replacement program when purchased. The following four pieces <strong>of</strong> equipment will be purchased in FY<br />
2017 and then added to the vehicle replacement fund: one concrete mixer truck at a cost <strong>of</strong> $223,300; an asphalt<br />
roller at a cost <strong>of</strong> $88,000; an asphalt paving machine at a cost <strong>of</strong> $<strong>12</strong>1,000; and a water truck at a cost <strong>of</strong><br />
$97,900.<br />
Capital Costs: FY 20<strong>12</strong> FY 2013 FY 2014 FY 2015 FY 2016 FYs 17-21<br />
Equipment $0 $0 $0 $0 $0 $530,200<br />
TOTAL $0 $0 $0 $0 $0 $530,200<br />
Operating Description:<br />
Additional staffing will be required to replace staff lost due to <strong>budget</strong> reductions in order to support these<br />
operations. Staffing includes salary and benefits for 4 Service Worker II's at an <strong>annual</strong> cost <strong>of</strong> $67,823 each, 2<br />
Service Worker III's at an <strong>annual</strong> cost <strong>of</strong> $77,064, 1 Equipment Operator at an <strong>annual</strong> cost <strong>of</strong> $68,750 and 1<br />
Crew Leader at an <strong>annual</strong> cost <strong>of</strong> $80,456. Line supplies are projected to be $250,000 <strong>annual</strong>ly for cost <strong>of</strong><br />
supplies for the new crew. Equipment replacement costs are included starting in FY 2017 at $39,765 <strong>annual</strong>ly<br />
with a 10-year life. Additional equipment maintenance related O and M is not need since this is replacement<br />
equipment. A supplemental <strong>budget</strong> request will be submitted once the project is near completion.<br />
Operating Costs: FY 20<strong>12</strong> FY 2013 FY 2014 FY 2015 FY 2016 FYs 17-21<br />
Staffing $0 $0 $0 $0 $0 $2,873,130<br />
Supplies/Contr $0 $0 $0 $0 $0 $1,250,000<br />
Insurance $0 $0 $0 $0 $0 $18,832<br />
PC/Vehicle Replacement $0 $0 $0 $0 $0 $198,825<br />
TOTAL $0 $0 $0 $0 $0 $4,340,787<br />
Project: T0010 - Right <strong>of</strong> Way Rearload Truck (R) Funding Source:<br />
Highway User Revenue Fund<br />
Project Description:<br />
Replacement <strong>of</strong> the existing right-<strong>of</strong>-way rear-loading compactor truck, which is not currently in the Vehicle<br />
Replacement Fund. After replacement, the truck will be added to the Vehicle Replacement Fund. The truck is<br />
utilized by right-<strong>of</strong>-way crews in the disposal <strong>of</strong> tree trimmings and other landscaping debris.<br />
Capital Costs: FY 20<strong>12</strong> FY 2013 FY 2014 FY 2015 FY 2016 FYs 17-21<br />
Equipment $0 $0 $0 $0 $0 $290,000<br />
TOTAL $0 $0 $0 $0 $0 $290,000<br />
Operating Description:<br />
Because this new truck will replace an existing truck, funding is already available for equipment maintenance.<br />
The O and M figure <strong>of</strong> $145,000 represents the first five years (FY's 2017 though 2021) <strong>of</strong> vehicle replacement<br />
contributions required from adding the equipment to the Vehicle Replacement Fund based on a replacement<br />
cost <strong>of</strong> $290,000 and a 10-year life. A supplemental <strong>budget</strong> request will be submitted once the project is near<br />
completion.<br />
Operating Costs: FY 20<strong>12</strong> FY 2013 FY 2014 FY 2015 FY 2016 FYs 17-21<br />
PC/Vehicle Replacement $0 $0 $0 $0 $0 $145,000<br />
TOTAL $0 $0 $0 $0 $0 $145,000<br />
* New Project<br />
N=New Asset, R=Replacement <strong>of</strong> Existing Asset, I=Improvement <strong>of</strong> Existing Asset<br />
457<br />
Return to CIP TOC
FY 20<strong>12</strong>-2021 Capital Improvement Plan<br />
Capital Project Expenses Detail<br />
1340 - HURF/Streets Fund Category: Other<br />
Project: T0005 - Additional Streets Equipment (N) Funding Source:<br />
Highway User Revenue Fund<br />
Project Description:<br />
This is a request to purchase six new pieces <strong>of</strong> equipment for street maintenance based expectations <strong>of</strong><br />
deterioration due to aging <strong>of</strong> the street, curb, gutter and sidewalk network.<br />
Capital Costs: FY 20<strong>12</strong> FY 2013 FY 2014 FY 2015 FY 2016 FYs 17-21<br />
Equipment $0 $0 $0 $0 $0 $857,085<br />
TOTAL $0 $0 $0 $0 $0 $857,085<br />
Operating Description:<br />
Staffing includes salary and benefits for 4 Service Worker II's at an <strong>annual</strong> cost <strong>of</strong> $67,823 each, 2 Service<br />
Worker III's at an <strong>annual</strong> cost <strong>of</strong> $77,064, 1 Equipment Operator at an <strong>annual</strong> cost <strong>of</strong> $68,750 and 1 Crew<br />
Leader at an <strong>annual</strong> cost <strong>of</strong> $80,456. Line supplies are projected to be $250,000 <strong>annual</strong>ly for the cost <strong>of</strong> supplies<br />
for the new crew. Equipment maintenance charges and fuel costs total $23,585 <strong>annual</strong>ly. Insurance cost is<br />
calculated for eight employees at the current average cost <strong>of</strong> $2,354 per employee for Fund 1340. Equipment<br />
replacement costs are included starting in FY 2017 at $64,281 <strong>annual</strong>ly with a 10-year life. A supplemental<br />
<strong>budget</strong> request will be submitted once the project is near completion.<br />
Operating Costs: FY 20<strong>12</strong> FY 2013 FY 2014 FY 2015 FY 2016 FYs 17-21<br />
Staffing $0 $0 $0 $0 $0 $2,959,317<br />
Supplies/Contr $0 $0 $0 $0 $0 $1,250,000<br />
Equip. Maint. $0 $0 $0 $0 $0 $<strong>12</strong>1,463<br />
Insurance $0 $0 $0 $0 $0 $18,832<br />
PC/Vehicle Replacement $0 $0 $0 $0 $0 $321,405<br />
TOTAL $0 $0 $0 $0 $0 $4,671,017<br />
* New Project<br />
N=New Asset, R=Replacement <strong>of</strong> Existing Asset, I=Improvement <strong>of</strong> Existing Asset<br />
458<br />
Return to CIP TOC
FY <strong>2011</strong> - 2020 Capital Improvement Program<br />
Capital Projects By Fund and Project Number<br />
1650 - Transportation Grants Category: Other<br />
Capital Project Expenses<br />
Carryover<br />
FY 20<strong>12</strong>: FY 2013: FY 2014: FY 2015: FY 2016: FYs 17-21:<br />
New Funding<br />
Existing Assets<br />
Replacement <strong>of</strong> Existing Assets<br />
67530 Fiber & Conduit - DMS 135,000<br />
0 0 0 0 0 0<br />
67531 Fiber & Conduit for ITS 140,000<br />
0 0 0 0 0 0<br />
67534 ITS Strategic Plan 290,000<br />
0 0 0 0 0 0<br />
67536 FTA AZ-90-X103 Grant 571,909<br />
0 0 0 0 0 0<br />
67537 FTA X006 Predisign ArrowheadTC 635,896<br />
0 0 0 0 0 0<br />
67538 FTA 0203 Design ArrowheadTC 840,366<br />
0 0 0 0 0 0<br />
Sub-Total - Existing Assets 2,613,171<br />
0 0 0 0 0 0<br />
New Assets<br />
67505 CIP Transport. Grant Reserve 0 2,000,000 2,000,000 2,000,000 2,000,000 2,000,000 10,000,000<br />
67526 DS Multiuse Path: Grand Canal 136,994<br />
0 0 0 0 0 0<br />
67527 DS Multiuse Path: New River 187,714<br />
0 0 0 0 0 0<br />
67528 DS Multiuse Path: Maryland Ave 69,069<br />
0 0 0 0 0 0<br />
67529 FTA Grant X096 511,167<br />
0 0 0 0 0 0<br />
Sub-Total - New Assets 904,944 2,000,000 2,000,000 2,000,000 2,000,000 2,000,000 10,000,000<br />
Total Project Expenses: $3,518,115<br />
Total FY 20<strong>12</strong> Funding: $5,518,115<br />
* New Project<br />
$2,000,000 $2,000,000 $2,000,000 $2,000,000 $2,000,000 $10,000,000<br />
459<br />
Return to CIP TOC
FY 20<strong>12</strong>-2021 Capital Improvement Plan<br />
Capital Project Expenses Detail<br />
1650 - Transportation Grants Category: Other<br />
Project: 67530 - Fiber & Conduit - DMS (R) Funding Source:<br />
Grants<br />
Project Description:<br />
This project will complete the design <strong>of</strong> fiber, conduit, and cameras along Peoria Ave between 43rd and 67th<br />
avenues. Additionally four message signs will be designed for 59th and Glendale avenues leading into<br />
downtown Glendale.<br />
Capital Costs: FY 20<strong>12</strong> FY 2013 FY 2014 FY 2015 FY 2016 FYs 17-21<br />
FY 20<strong>12</strong> Carryover<br />
$135,000 $0 $0 $0 $0 $0<br />
TOTAL $135,000 $0 $0 $0 $0 $0<br />
Operating Description:<br />
This is a design project. There are not operating costs associated with the design. Operating funds will be<br />
identified during the construction stage <strong>of</strong> the project.<br />
Project: 67531 - Fiber & Conduit for ITS (R) Funding Source:<br />
Grants<br />
Project Description:<br />
This project will complete the design <strong>of</strong> fiber, conduit, and cameras along Cactus, Thunderbird, and Greenway.<br />
Capital Costs: FY 20<strong>12</strong> FY 2013 FY 2014 FY 2015 FY 2016 FYs 17-21<br />
FY 20<strong>12</strong> Carryover<br />
$140,000 $0 $0 $0 $0 $0<br />
TOTAL $140,000 $0 $0 $0 $0 $0<br />
Operating Description:<br />
This is a design project. There are not operating costs associated with the design. Operating funds will be<br />
identified during the construction stage <strong>of</strong> the project.<br />
Project: 67534 - ITS Strategic Plan (R) Funding Source:<br />
Grants<br />
Project Description:<br />
This project will complete a <strong>city</strong>wide Intelligent Transportation System (ITS) Strategic Plan that is consistent with<br />
federal, state, and regional plans.<br />
Capital Costs: FY 20<strong>12</strong> FY 2013 FY 2014 FY 2015 FY 2016 FYs 17-21<br />
FY 20<strong>12</strong> Carryover<br />
$290,000 $0 $0 $0 $0 $0<br />
TOTAL $290,000 $0 $0 $0 $0 $0<br />
Operating Description:<br />
This is a project to develop a study. There are not any operating costs associated with the study development.<br />
Project: 67536 - FTA AZ-90-X103 Grant (R) Funding Source:<br />
Grants<br />
Project Description:<br />
The grant includes funds for the replacement <strong>of</strong> three Dial-A-Ride buses and funds for the maintenance <strong>of</strong><br />
Transit's bus fleet. The Regional Public Transportation Authority (RPTA) will reimburse the <strong>city</strong> for the local<br />
match portion <strong>of</strong> the bus purchase.<br />
Capital Costs: FY 20<strong>12</strong> FY 2013 FY 2014 FY 2015 FY 2016 FYs 17-21<br />
FY 20<strong>12</strong> Carryover<br />
$571,909 $0 $0 $0 $0 $0<br />
TOTAL $571,909 $0 $0 $0 $0 $0<br />
Operating Description:<br />
No additional O and M is needed.<br />
* New Project<br />
N=New Asset, R=Replacement <strong>of</strong> Existing Asset, I=Improvement <strong>of</strong> Existing Asset<br />
460<br />
Return to CIP TOC
FY 20<strong>12</strong>-2021 Capital Improvement Plan<br />
Capital Project Expenses Detail<br />
1650 - Transportation Grants Category: Other<br />
Project: 67537 - FTA X006 Predisign ArrowheadTC (R) Funding Source:<br />
Grants<br />
Project Description:<br />
North Glendale is currently served by multiple routes including two express routes, three local routes and one<br />
rural connector. These routes provide regional service to the northwest valley. Many <strong>of</strong> the routes start/end in<br />
the area <strong>of</strong> Loop 101 and Bell Road. This project will provide the predesign for a centralized facility for routes<br />
serving the area to provide transit patron parking, and to promote improved bus flow and accessibility for patrons<br />
using the routes serving the area<br />
Capital Costs: FY 20<strong>12</strong> FY 2013 FY 2014 FY 2015 FY 2016 FYs 17-21<br />
FY 20<strong>12</strong> Carryover<br />
$635,896 $0 $0 $0 $0 $0<br />
TOTAL $635,896 $0 $0 $0 $0 $0<br />
Operating Description:<br />
This project is for pre-design <strong>of</strong> the Transit Center. O and M costs will be identified during the design <strong>of</strong> the<br />
project.<br />
Project: 67538 - FTA 0203 Design ArrowheadTC (R) Funding Source:<br />
Grants<br />
Project Description:<br />
North Glendale is currently served by multiple routes including two express routes, three local routes and one<br />
rural connector. These routes provide regional service to the northwest valley. Many <strong>of</strong> the routes start/end in<br />
the area <strong>of</strong> Loop 101 and Bell Road. This project will provide the predesign for a centralized facility for routes<br />
serving the area to provide transit patron parking, and to promote improved bus flow and accessibility for patrons<br />
using the routes serving the area.<br />
Capital Costs: FY 20<strong>12</strong> FY 2013 FY 2014 FY 2015 FY 2016 FYs 17-21<br />
FY 20<strong>12</strong> Carryover<br />
$840,366 $0 $0 $0 $0 $0<br />
TOTAL $840,366 $0 $0 $0 $0 $0<br />
Operating Description:<br />
O and M costs will be identified during the design <strong>of</strong> the Transit Center project.<br />
Project: 67505 - CIP Transport. Grant Reserve (N) Funding Source:<br />
Grants<br />
Project Description:<br />
This represents reserve appropriation for unanticipated transportation related grant opportunities that may arise<br />
during the fiscal year.<br />
Capital Costs: FY 20<strong>12</strong> FY 2013 FY 2014 FY 2015 FY 2016 FYs 17-21<br />
Miscellaneous/Other $2,000,000 $2,000,000 $2,000,000 $2,000,000 $2,000,000 $10,000,000<br />
TOTAL $2,000,000 $2,000,000 $2,000,000 $2,000,000 $2,000,000 $10,000,000<br />
Operating Description:<br />
No additional O and M is needed.<br />
* New Project<br />
N=New Asset, R=Replacement <strong>of</strong> Existing Asset, I=Improvement <strong>of</strong> Existing Asset<br />
461<br />
Return to CIP TOC
FY 20<strong>12</strong>-2021 Capital Improvement Plan<br />
Capital Project Expenses Detail<br />
1650 - Transportation Grants Category: Other<br />
Project: 67526 - DS Multiuse Path: Grand Canal (N) Funding Source:<br />
Grants<br />
Project Description:<br />
The project is to provide for the design <strong>of</strong> a multi-use pathway along the Grand Canal from east <strong>of</strong> Loop 101 to<br />
east bank <strong>of</strong> New River. Once complete, the pathway should connect the existing Grand Canal multi-use<br />
pathway to the future New River multi-use pathway.<br />
Capital Costs: FY 20<strong>12</strong> FY 2013 FY 2014 FY 2015 FY 2016 FYs 17-21<br />
FY 20<strong>12</strong> Carryover<br />
$136,994 $0 $0 $0 $0 $0<br />
TOTAL $136,994 $0 $0 $0 $0 $0<br />
Operating Description:<br />
No O and M associated with this design project.<br />
Project: 67527 - DS Multiuse Path: New River (N) Funding Source:<br />
Grants<br />
Project Description:<br />
This project provides for the design <strong>of</strong> a multiuse pathway along the New River east bank from Northern Avenue<br />
to Grand Canal.<br />
Capital Costs: FY 20<strong>12</strong> FY 2013 FY 2014 FY 2015 FY 2016 FYs 17-21<br />
FY 20<strong>12</strong> Carryover<br />
$187,714 $0 $0 $0 $0 $0<br />
TOTAL $187,714 $0 $0 $0 $0 $0<br />
Operating Description:<br />
No O and M associated with this design project.<br />
Project: 67528 - DS Multiuse Path: Maryland Ave (N) Funding Source:<br />
Grants<br />
Project Description:<br />
This project provides for the design <strong>of</strong> a bike lane along Maryland Avenue from 67th Avenue to 69th Avenue, a<br />
multi-use path along Maryland Avenue east <strong>of</strong> 75th Avenue, and a multi-use path along the Maryland Avenue<br />
alignment in the Discovery Park from west <strong>of</strong> 75th Lane to 77th Drive.<br />
Capital Costs: FY 20<strong>12</strong> FY 2013 FY 2014 FY 2015 FY 2016 FYs 17-21<br />
FY 20<strong>12</strong> Carryover<br />
$69,069 $0 $0 $0 $0 $0<br />
TOTAL $69,069 $0 $0 $0 $0 $0<br />
Operating Description:<br />
No O and M associated with this design project.<br />
Project: 67529 - FTA Grant X096 (N) Funding Source:<br />
Grants<br />
Project Description:<br />
Federal Transit Administration grant for replacement bus purchases, computer purchases, and preventative<br />
maintenance reimbursement.<br />
Capital Costs: FY 20<strong>12</strong> FY 2013 FY 2014 FY 2015 FY 2016 FYs 17-21<br />
FY 20<strong>12</strong> Carryover<br />
$511,167 $0 $0 $0 $0 $0<br />
TOTAL $511,167 $0 $0 $0 $0 $0<br />
Operating Description:<br />
No additional O and M is needed.<br />
* New Project<br />
N=New Asset, R=Replacement <strong>of</strong> Existing Asset, I=Improvement <strong>of</strong> Existing Asset<br />
462<br />
Return to CIP TOC
20<strong>12</strong>-2021 CAPITAL IMPROVEMENT PLAN<br />
Sanitation - Enterprise Fund<br />
SANITATION<br />
ENTERPRISE FUND<br />
The Sanitation Fund capital program includes the replacement <strong>of</strong> roll-<strong>of</strong>f trucks, frontload trucks,<br />
sideload trucks, rear load trucks, container delivery trucks, pickup trucks and various refuse<br />
containers that have reached the end <strong>of</strong> their serviceable lives. In FY 20<strong>12</strong> funding will be used<br />
to replace seven residential sideload refuse trucks and a residential container delivery truck. The<br />
plan also includes a new sanitation <strong>of</strong>fice trailer in FY 2014.<br />
Project Name: Frontloader Trucks - 17820<br />
Fund #: 2480<br />
Project #: 78002<br />
Project Name: Roll<strong>of</strong>f Trucks - 17810<br />
Fund #: 2480<br />
Project #: 78001<br />
Project Name: Commercial Trucks - 17820<br />
Fund #: 2480<br />
Project #: 78002<br />
463<br />
Return to CIP TOC
FY <strong>2011</strong> - 2020 Capital Improvement Program<br />
Capital Projects By Fund and Project Number<br />
2480 - Sanitation Category: Other<br />
Capital Project Expenses<br />
Carryover<br />
FY 20<strong>12</strong>: FY 2013: FY 2014: FY 2015: FY 2016: FYs 17-21:<br />
New Funding<br />
Existing Assets<br />
Replacement <strong>of</strong> Existing Assets<br />
78001 Roll<strong>of</strong>f Trucks-Commercial 0<br />
0 60,900 0 428,000 0 258,000<br />
78002 Frontload Trucks-Commercial 0<br />
0 525,000 265,000 280,000 885,000 1,577,000<br />
78003 Sideload Trucks-Residential 0 1,820,000 550,000 1,740,000 1,160,000 1,450,000 7,540,000<br />
78004 Loose Trash Equip.-Residential 0<br />
0 113,887 617,759 870,000 1,376,980 3,138,434<br />
78005 Repl Pickup Trucks-Sanitation 0 43,645 50,000 0 0 67,010 210,000<br />
Sub-Total - Existing Assets 0 1,863,645 1,299,787 2,622,759 2,738,000 3,778,990 <strong>12</strong>,723,434<br />
New Assets<br />
T2411 Sanitation Office Trailer 0<br />
0 0 517,500 0 0 0<br />
Sub-Total - New Assets 0<br />
0 0 517,500 0 0 0<br />
Total Project Expenses: $0<br />
Total FY 20<strong>12</strong> Funding: $1,863,645<br />
* New Project<br />
$1,863,645 $1,299,787 $3,140,259 $2,738,000 $3,778,990 $<strong>12</strong>,723,434<br />
464<br />
Return to CIP TOC
FY 20<strong>12</strong>-2021 Capital Improvement Plan<br />
Capital Project Expenses Detail<br />
2480 - Sanitation Category: Other<br />
Project: 78001 - Roll<strong>of</strong>f Trucks-Commercial (R) Funding Source:<br />
Sanitation Revenues<br />
Project Description:<br />
Replacement <strong>of</strong> three roll<strong>of</strong>f trucks and containers over a 10-year period. Roll-<strong>of</strong>f trucks are used to service the<br />
20 and 40 cubic yard dumpsters used at construction sites and for clean up projects. The service life <strong>of</strong> roll-<strong>of</strong>f<br />
trucks is projected to be nine years. None <strong>of</strong> this equipment is in the <strong>city</strong>'s vehicle replacement fund. In FY 2013,<br />
ten 40-yard containers will be purchased at a cost <strong>of</strong> $6,000 each. In FY 2015, two replacement trucks will be<br />
purchased at a cost <strong>of</strong> $214,000 to replace trucks purchased in FY 2004. In FY 2017, one replacement truck will<br />
be purchased at a cost <strong>of</strong> $258,000 to replace a truck purchased in FY 2008.<br />
Capital Costs: FY 20<strong>12</strong> FY 2013 FY 2014 FY 2015 FY 2016 FYs 17-21<br />
Finance Charges $0 $900 $0 $16,316 $0 $4,670<br />
Equipment $0 $60,000 $0 $411,684 $0 $253,330<br />
TOTAL $0 $60,900 $0 $428,000 $0 $258,000<br />
Operating Description:<br />
No additional O and M is needed since this is the replacement <strong>of</strong> existing equipment.<br />
Project: 78002 - Frontload Trucks-Commercial (R) Funding Source:<br />
Sanitation Revenues<br />
Project Description:<br />
Replacement <strong>of</strong> 10 commercial frontload refuse trucks, a commercial sideload refuse truck and a commercial<br />
container delivery truck over a 10-year period. Service life is projected to be six years, except the delivery truck<br />
which is projected at 10 years. These trucks are not in the <strong>city</strong>'s Vehicle Replacement Fund. In FY 2013, replace<br />
one frontload truck for $250,000 and one sideloader for $275,000. In FY 2014, replace one frontload truck for<br />
$265,000. In FY 2015, replace one frontload truck for $280,000. In FY 2016, replace three frontload trucks for<br />
$295,000 each. In FY 2017, replace one frontload truck for $295,000. In FY 2018, replace one frontload truck for<br />
$295,000. In FY 2019, replace one frontload truck for $295,000. In FY 2020, replace one frontload truck at a cost<br />
<strong>of</strong> $295.000, a sideload truck for $290,000 and a commercial container truck for $107,000.<br />
Capital Costs: FY 20<strong>12</strong> FY 2013 FY 2014 FY 2015 FY 2016 FYs 17-21<br />
Finance Charges $0 $9,860 $5,388 $5,765 $18,507 $44,855<br />
Equipment $0 $515,140 $259,6<strong>12</strong> $274,235 $866,493 $1,532,145<br />
TOTAL $0 $525,000 $265,000 $280,000 $885,000 $1,577,000<br />
Operating Description:<br />
No additional O and M is needed since this is the replacement <strong>of</strong> existing equipment.<br />
Project: 78003 - Sideload Trucks-Residential (R) Funding Source:<br />
Sanitation Revenues<br />
Project Description:<br />
Replacement <strong>of</strong> 50 sideload refuse trucks over a 10-year period. Service life is projected at six years for newly<br />
purchased equipment. These vehicles are not in the Vehicle Replacement Fund. In FY 20<strong>12</strong> replace seven<br />
trucks at a cost <strong>of</strong> $260,000 each. In FY 2013 replace two trucks at a cost <strong>of</strong> $275,000 each. In FY 2014 replace<br />
six trucks at a cost <strong>of</strong> $290,000 each. In FY 2015 replace four trucks at a cost <strong>of</strong> $290,000 each. In FY 2016<br />
replace five trucks at a cost <strong>of</strong> $290,000 each. In FY 2017 replace six trucks at a cost <strong>of</strong> $290,000 each. In FY<br />
2018 replace seven trucks at a cost <strong>of</strong> $290,000 each. In FY 2019 replace three trucks at a cost <strong>of</strong> $ 290,000<br />
each. In FY 2020 replace six trucks at a cost <strong>of</strong> $290,000 each. In FY 2021 replace four trucks at a cost <strong>of</strong><br />
$290,000 each.<br />
Capital Costs: FY 20<strong>12</strong> FY 2013 FY 2014 FY 2015 FY 2016 FYs 17-21<br />
Finance Charges $31,563 $9,650 $30,978 $23,106 $30,845 $181,1<strong>12</strong><br />
Equipment $1,788,437 $540,350 $1,709,022 $1,136,894 $1,419,155 $7,358,888<br />
TOTAL $1,820,000 $550,000 $1,740,000 $1,160,000 $1,450,000 $7,540,000<br />
Operating Description:<br />
No additional O and M is needed since this is the replacement <strong>of</strong> existing equipment.<br />
* New Project<br />
N=New Asset, R=Replacement <strong>of</strong> Existing Asset, I=Improvement <strong>of</strong> Existing Asset<br />
465<br />
Return to CIP TOC
FY 20<strong>12</strong>-2021 Capital Improvement Plan<br />
Capital Project Expenses Detail<br />
2480 - Sanitation Category: Other<br />
Project: 78004 - Loose Trash Equip.-Residential (R) Funding Source:<br />
Sanitation Revenues<br />
Project Description:<br />
Replacement <strong>of</strong> loose trash rearload trucks, tractors and sweepers that are expected to reach the end <strong>of</strong> their<br />
service life. Service life for rearload trucks, tractors and sweepers is about eight years. In FY 2013, replace a<br />
tractor at a cost <strong>of</strong> $113,887. In FY 2014 replace a rearload truck at a cost <strong>of</strong> $275,000, a tractor at a cost <strong>of</strong><br />
$<strong>12</strong>1,859 and a sweeper at a cost $220,900. In FY 2015 replace three rearload trucks at a cost <strong>of</strong> $290,000<br />
each. In FY 2016 replace two rearload trucks at a cost <strong>of</strong> $290,000 each, two tractors at a cost <strong>of</strong> $137,455 each<br />
and two sweepers at a cost <strong>of</strong> $261,035 each. In FY 2017 replace two rearload truck at a cost <strong>of</strong> $290,000 each,<br />
a tractor at a cost <strong>of</strong> $137,455 and two sweepers at a cost <strong>of</strong> $279,307 each. In FY 2018 replace two rearload<br />
trucks at a cost <strong>of</strong> $290,000 each and a tractor at a cost <strong>of</strong> $137,455. In FY 2020 replace three rearload trucks at<br />
a cost <strong>of</strong> $290,000 and a tractor at a cost <strong>of</strong> $137,455. In 2021 replace a tractor at a cost <strong>of</strong> $137,455.<br />
Capital Costs: FY 20<strong>12</strong> FY 2013 FY 2014 FY 2015 FY 2016 FYs 17-21<br />
Finance Charges $0 $1,683 $9,326 $14,766 $18,898 $63,425<br />
Equipment $0 $1<strong>12</strong>,204 $608,433 $855,234 $1,358,082 $3,075,009<br />
TOTAL $0 $113,887 $617,759 $870,000 $1,376,980 $3,138,434<br />
Operating Description:<br />
No additional O and M is needed since this is the replacement <strong>of</strong> existing equipment.<br />
Project: 78005 - Repl Pickup Trucks-Sanitation (R) Funding Source:<br />
Sanitation Revenues<br />
Project Description:<br />
These pickups will replace aging pickup trucks over a 10-year period. FY 20<strong>12</strong>, a replacement residential<br />
container delivery truck at a cost <strong>of</strong> $43,645. FY 2013, a replacement mechanic's truck at a cost <strong>of</strong> $50,000. FY<br />
2016, two replacement pickup trucks at a cost <strong>of</strong> $33,505 each. FY 2017, four replacement pickup trucks at a<br />
cost $35,000 each. In FY 2018, a replacement mechanic's truck at a cost <strong>of</strong> $70,000.<br />
Capital Costs: FY 20<strong>12</strong> FY 2013 FY 2014 FY 2015 FY 2016 FYs 17-21<br />
Finance Charges $645 $645 $0 $0 $1,005 $5,827<br />
Equipment $43,000 $49,355 $0 $0 $66,005 $204,173<br />
TOTAL $43,645 $50,000 $0 $0 $67,010 $210,000<br />
Operating Description:<br />
No additional O and M is needed since this is the replacement <strong>of</strong> existing equipment.<br />
* New Project<br />
N=New Asset, R=Replacement <strong>of</strong> Existing Asset, I=Improvement <strong>of</strong> Existing Asset<br />
466<br />
Return to CIP TOC
FY 20<strong>12</strong>-2021 Capital Improvement Plan<br />
Capital Project Expenses Detail<br />
2480 - Sanitation Category: Other<br />
Project: T2411 - Sanitation Office Trailer (N) Funding Source:<br />
Sanitation Revenues<br />
Project Description:<br />
Currently, sanitation staff works out <strong>of</strong> a mobile trailer <strong>of</strong>fice. There are currently 80 employees in the sanitation<br />
division and the <strong>of</strong>fice environment is very tight. Currently, managers must identi<strong>fy</strong> alternative meeting / training<br />
space for staff or break the staff into smaller groups for meetings and training. A larger replacement trailer is<br />
needed to effectively meet the current operational demand, and allow for sufficient staff meeting/training space.<br />
Capital Costs: FY 20<strong>12</strong> FY 2013 FY 2014 FY 2015 FY 2016 FYs 17-21<br />
Finance Charges $0 $0 $7,500 $0 $0 $0<br />
IT/Phone/Security $0 $0 $10,000 $0 $0 $0<br />
Equipment $0 $0 $500,000 $0 $0 $0<br />
TOTAL $0 $0 $517,500 $0 $0 $0<br />
Operating Description:<br />
Additional O and M will be incurred for phone service, computers and related s<strong>of</strong>tware, and printers. The<br />
additional O and M will be absorbed by the department.<br />
Operating Costs: FY 20<strong>12</strong> FY 2013 FY 2014 FY 2015 FY 2016 FYs 17-21<br />
Electrical $0 $0 $1,000 $1,030 $1,061 $5,801<br />
PC/Vehicle Replacement $0 $0 $20,000 $20,600 $21,218 $116,028<br />
Water $0 $0 $1,000 $1,030 $1,061 $5,801<br />
TOTAL $0 $0 $22,000 $22,660 $23,340 $<strong>12</strong>7,630<br />
* New Project<br />
N=New Asset, R=Replacement <strong>of</strong> Existing Asset, I=Improvement <strong>of</strong> Existing Asset<br />
467<br />
Return to CIP TOC
20<strong>12</strong>-2021 CAPITAL IMPROVEMENT PLAN<br />
Landfill - Enterprise Fund<br />
LANDFILL<br />
ENTERPRISE FUND<br />
FY 20<strong>12</strong> will see the replacement <strong>of</strong> a number <strong>of</strong> Glendale Municipal Landfill and Materials<br />
Recovery Facility (MRF) equipment including forklifts and a bulldozer. Starting in FY 2013 are<br />
projects that will lay the groundwork for the closing <strong>of</strong> the south area <strong>of</strong> the Glendale Landfill<br />
and preparing the north expansion area for future waste cell development as identified in Landfill<br />
Development Plan (October 2001). In preparation for the closing <strong>of</strong> the south end <strong>of</strong> the landfill,<br />
new funding is also available in FY 20<strong>12</strong> for the initial design to move the scalehouse closer to<br />
the north end.<br />
Project Name: LF Water Pull Tractor Replace<br />
Fund #: 2440<br />
Project #: 78522<br />
468<br />
Return to CIP TOC
FY <strong>2011</strong> - 2020 Capital Improvement Program<br />
Capital Projects By Fund and Project Number<br />
2440 - Landfill Category: Other<br />
Capital Project Expenses<br />
Carryover<br />
FY 20<strong>12</strong>: FY 2013: FY 2014: FY 2015: FY 2016: FYs 17-21:<br />
New Funding<br />
Existing Assets<br />
Improvement <strong>of</strong> Existing Assets<br />
78518 MRF Process Line Improvements 0<br />
0 0 659,750 0 0 0<br />
T2371 Scalehouse & Road Relocation 0 52,900 929,943 0 0 0 0<br />
Replacement <strong>of</strong> Existing Assets<br />
78506 Landfill Repl Pickup Truck 0 26,800 130,000 0 29,300 0 <strong>12</strong>4,331<br />
78509 MRF Forklifts 0 30,000 0 31,827 32,781 0 72,000<br />
78511 Landfill Compactor Replacement 0<br />
0 0 0 1,010,145 0 1,054,504<br />
785<strong>12</strong> Fuel Tanker Replacement 0<br />
0 0 0 0 0 255,780<br />
78514 Sanitation Insp Trucks - 17740 0<br />
0 0 59,406 0 136,032 70,000<br />
78520 Landfill Bulldozer Replacement 0 1,<strong>12</strong>8,040 0 0 0 0 1,187,550<br />
78521 MRF Loader Replacement 0<br />
0 0 0 0 0 228,019<br />
78522 LF Water Pull Tractor Replace 492,901<br />
0 0 0 0 0 624,063<br />
T2360 Landfill Motor Grader Replace 0<br />
0 289,275 0 0 0 0<br />
T2370 Landfill Auger Scraper Replace 0<br />
0 0 1,436,225 0 0 0<br />
Sub-Total - Existing Assets 492,901 1,237,740 1,349,218 2,187,208 1,072,226 136,032 3,616,247<br />
New Assets<br />
78503 Landfill Closure (South) 0<br />
0 0 0 256,296 9,141,306 0<br />
78505 LF Phase Construction (North) 0<br />
0 0 102,541 4,625,208 102,541 4,366,770<br />
78507 Landfill Soil Excavation 0<br />
0 102,403 13,060,382 0 0 0<br />
78508 Landfill Stormwater Drainage 0<br />
0 566,581 0 0 0 0<br />
Sub-Total - New Assets 0<br />
0 668,984 13,162,923 4,881,504 9,243,847 4,366,770<br />
Total Project Expenses: $492,901<br />
Total FY 20<strong>12</strong> Funding: $1,730,641<br />
* New Project<br />
$1,237,740 $2,018,202 $15,350,131 $5,953,730 $9,379,879 $7,983,017<br />
469<br />
Return to CIP TOC
FY 20<strong>12</strong>-2021 Capital Improvement Plan<br />
Capital Project Expenses Detail<br />
2440 - Landfill Category: Other<br />
Project: 78518 - MRF Process Line Improvements (I) Funding Source:<br />
Landfill Revenues<br />
Project Description:<br />
Improvements to the Materials Recovery Facility (MRF) processing line equipment to enhance the overall<br />
efficiency <strong>of</strong> the 10-year old recyclables processing system. Modifications are expected to include consolidation<br />
<strong>of</strong> the two fiber lines and an automated container sorting line. The fiber line consolidation and automated<br />
container sorting line will increase production throughput, separation quality and reduce operating costs related<br />
to manual labor needs.<br />
Capital Costs: FY 20<strong>12</strong> FY 2013 FY 2014 FY 2015 FY 2016 FYs 17-21<br />
Finance Charges $0 $0 $9,750 $0 $0 $0<br />
Equipment $0 $0 $650,000 $0 $0 $0<br />
TOTAL $0 $0 $659,750 $0 $0 $0<br />
Operating Description:<br />
No additional O and M is needed due to process line modifications at current amount <strong>of</strong> incoming tonnage.<br />
Project: T2371 - Scalehouse & Road Relocation (I) Funding Source:<br />
Landfill Revenues<br />
Project Description:<br />
Project provides for roadway improvements to the internal entrance roadway and relocation <strong>of</strong> the scale house to<br />
be closer to the north area. The scale house is currently located where waste will be placed prior to closing the<br />
south area <strong>of</strong> the landfill. Revised waste capa<strong>city</strong> calculations include filling in the current scale house location,<br />
and it will take approximately one year to fill this permitted air space.<br />
Capital Costs: FY 20<strong>12</strong> FY 2013 FY 2014 FY 2015 FY 2016 FYs 17-21<br />
Design $50,000 $50,000 $0 $0 $0 $0<br />
Construction $0 $821,201 $0 $0 $0 $0<br />
Finance Charges $750 $13,068 $0 $0 $0 $0<br />
Engineering Charges $2,150 $37,462 $0 $0 $0 $0<br />
Arts $0 $8,2<strong>12</strong> $0 $0 $0 $0<br />
TOTAL $52,900 $929,943 $0 $0 $0 $0<br />
Operating Description:<br />
No additional O and M is need for this project.<br />
Project: 78506 - Landfill Repl Pickup Truck (R) Funding Source:<br />
Landfill Revenues<br />
Project Description:<br />
Landfill currently has six pickup trucks in its equipment fleet that will require replacement over the next ten years.<br />
Pickup trucks are used by the landfill inspector, mechanic, crew leader, supervisor, and field employees. Three<br />
trucks will reach the end <strong>of</strong> their serviceable life in FY 20<strong>12</strong>, FY 2013, and FY 2015. The vehicle due for<br />
replacement in 2013 is the mechanic's truck, which is a heavy duty truck outfitted with an 11 foot crane, heavy<br />
duty tool boxes, air compressor, and a gas welder. Landfill vehicles and equipment are not included in the<br />
Vehicle Replacement Fund. Project also includes the replacement <strong>of</strong> three trucks reaching the end <strong>of</strong> their<br />
service life during the second five years. The replacement amounts and years are as follows (with 3% inflation<br />
adjustment): Flat bed with Tommy Lift ($52,221) and pickup truck with Tommy Lift ($36,076) in FY 2019, and<br />
pickup truck ($36,034) in 2021.<br />
Capital Costs: FY 20<strong>12</strong> FY 2013 FY 2014 FY 2015 FY 2016 FYs 17-21<br />
Equipment $26,800 $130,000 $0 $29,300 $0 $<strong>12</strong>4,331<br />
TOTAL $26,800 $130,000 $0 $29,300 $0 $<strong>12</strong>4,331<br />
Operating Description:<br />
No additional O and M cost as new equipment will replace aging existing equipment.<br />
* New Project<br />
N=New Asset, R=Replacement <strong>of</strong> Existing Asset, I=Improvement <strong>of</strong> Existing Asset<br />
470<br />
Return to CIP TOC
FY 20<strong>12</strong>-2021 Capital Improvement Plan<br />
Capital Project Expenses Detail<br />
2440 - Landfill Category: Other<br />
Project: 78509 - MRF Forklifts (R) Funding Source:<br />
Landfill Revenues<br />
Project Description:<br />
The Materials Recovery Facility (MRF) currently has a total <strong>of</strong> four forklifts in its fleet used for a variety <strong>of</strong> heavy<br />
lifting purposes including loading, unloading, and transporting recyclable bales. This project includes the<br />
replacement <strong>of</strong> three forklifts that are expected to reach the end <strong>of</strong> their serviceable lives in FY 20<strong>12</strong>, FY 2014,<br />
and FY 2015 as well as replacement <strong>of</strong> forklifts that will be due for replacement during the second five years.<br />
Replacement <strong>of</strong> forklifts in the second five years is scheduled to occur in FY 2018 and FY 2019 at an<br />
approximate cost <strong>of</strong> $36,000 per piece <strong>of</strong> equipment. The MRF forklifts have an estimated service life <strong>of</strong><br />
approximately seven years, although replacement schedules may be adjusted depending on hours <strong>of</strong> use and<br />
wear. MRF vehicles and equipment are not included in the Vehicle Replacement Fund.<br />
Capital Costs: FY 20<strong>12</strong> FY 2013 FY 2014 FY 2015 FY 2016 FYs 17-21<br />
Equipment $30,000 $0 $31,827 $32,781 $0 $72,000<br />
TOTAL $30,000 $0 $31,827 $32,781 $0 $72,000<br />
Operating Description:<br />
No additional O and M cost as new equipment will replace aging existing equipment.<br />
Project: 78511 - Landfill Compactor Replacement (R) Funding Source:<br />
Landfill Revenues<br />
Project Description:<br />
Replacement <strong>of</strong> landfill compactors that will reach the end <strong>of</strong> their serviceable lives in FY 2015 and FY 2017.<br />
Landfill vehicles and equipment are not included in the Vehicle Replacement Fund. Instead the equipment is<br />
purchased with cash or financed through bonds at the time <strong>of</strong> acquisition. The compactors are essential pieces<br />
<strong>of</strong> equipment used on a daily basis for proper placement and compaction <strong>of</strong> solid waste into the landfill.<br />
Capital Costs: FY 20<strong>12</strong> FY 2013 FY 2014 FY 2015 FY 2016 FYs 17-21<br />
Finance Charges $0 $0 $0 $14,928 $0 $15,584<br />
Equipment $0 $0 $0 $995,217 $0 $1,038,920<br />
TOTAL $0 $0 $0 $1,010,145 $0 $1,054,504<br />
Operating Description:<br />
No additional O and M cost as new equipment will replace aging existing equipment.<br />
Project: 785<strong>12</strong> - Fuel Tanker Replacement (R) Funding Source:<br />
Landfill Revenues<br />
Project Description:<br />
Replacement <strong>of</strong> a landfill fuel tanker that is expected to reach the end <strong>of</strong> its serviceable life in FY 2018. The<br />
current fuel tanker was purchased in 2008 and is anticipated to be replaced after ten years <strong>of</strong> daily use. Landfill<br />
equipment is not included in the Vehicle Replacement Fund. The fuel tanker truck refuels the diesel equipment<br />
on the site so as to maximize equipment operating time and efficiency.<br />
Capital Costs: FY 20<strong>12</strong> FY 2013 FY 2014 FY 2015 FY 2016 FYs 17-21<br />
Finance Charges $0 $0 $0 $0 $0 $3,780<br />
Equipment $0 $0 $0 $0 $0 $252,000<br />
TOTAL $0 $0 $0 $0 $0 $255,780<br />
Operating Description:<br />
No additional O and M cost as new equipment will replace aging existing equipment.<br />
* New Project<br />
N=New Asset, R=Replacement <strong>of</strong> Existing Asset, I=Improvement <strong>of</strong> Existing Asset<br />
471<br />
Return to CIP TOC
FY 20<strong>12</strong>-2021 Capital Improvement Plan<br />
Capital Project Expenses Detail<br />
2440 - Landfill Category: Other<br />
Project: 78514 - Sanitation Insp Trucks - 17740 (R) Funding Source:<br />
Landfill Revenues<br />
Project Description:<br />
Sanitation Inspectors enforce the regulations related to refuse collection, recycling collection and loose trash<br />
services. They contact residents to respond to questions and educate residents on proper procedures for<br />
services. Purchase <strong>of</strong> eight replacement pickups over a 10-year period. Service life is projected to be<br />
approximately seven year. In FY 2014, two replacement trucks costing a projected $29,703 each. In FY 2016,<br />
four replacement trucks at a cost <strong>of</strong> $34,008 each. In FY 2017, a replacement truck at a cost <strong>of</strong> $35,000. In FY<br />
2018, one replacement truck at a cost <strong>of</strong> $35,000.<br />
Capital Costs: FY 20<strong>12</strong> FY 2013 FY 2014 FY 2015 FY 2016 FYs 17-21<br />
Finance Charges $0 $0 $878 $0 $2,040 $1,050<br />
Equipment $0 $0 $58,528 $0 $133,992 $68,950<br />
TOTAL $0 $0 $59,406 $0 $136,032 $70,000<br />
Operating Description:<br />
No additional O and M is need for this project.<br />
Project: 78520 - Landfill Bulldozer Replacement (R) Funding Source:<br />
Landfill Revenues<br />
Project Description:<br />
Project includes the replacement <strong>of</strong> the landfill bulldozers at the end <strong>of</strong> their serviceable life and on an<br />
appropriate replacement schedule based on current usage and wear. One bulldozer (Model D-9) will reach the<br />
end <strong>of</strong> its serviceable life in FY 20<strong>12</strong>, and the other bulldozer (Model D-8) will need replacement in FY 2019.<br />
Landfill vehicles and equipment are not included in the Vehicle Replacement Fund. Bulldozers are used at the<br />
landfill primarily to push garbage into position so the compactors can crush the debris to maximize compaction.<br />
Capital Costs: FY 20<strong>12</strong> FY 2013 FY 2014 FY 2015 FY 2016 FYs 17-21<br />
Finance Charges $16,670 $0 $0 $0 $0 $17,550<br />
Equipment $1,111,370 $0 $0 $0 $0 $1,170,000<br />
TOTAL $1,<strong>12</strong>8,040 $0 $0 $0 $0 $1,187,550<br />
Operating Description:<br />
No additional O and M cost as new equipment will replace aging existing equipment.<br />
Project: 78521 - MRF Loader Replacement (R) Funding Source:<br />
Landfill Revenues<br />
Project Description:<br />
Replacement <strong>of</strong> loader used to move recyclables from truck tipping floor to Materials Recovery Facility<br />
processing line. The current loader was purchased in FY 2009 and this unit will be due for replacement in FY<br />
2019. MRF vehicles and equipment are not included in the Vehicle Replacement Fund.<br />
Capital Costs: FY 20<strong>12</strong> FY 2013 FY 2014 FY 2015 FY 2016 FYs 17-21<br />
Finance Charges $0 $0 $0 $0 $0 $3,420<br />
Equipment $0 $0 $0 $0 $0 $224,599<br />
TOTAL $0 $0 $0 $0 $0 $228,019<br />
Operating Description:<br />
No additional O and M cost as new equipment will replace aging existing equipment.<br />
* New Project<br />
N=New Asset, R=Replacement <strong>of</strong> Existing Asset, I=Improvement <strong>of</strong> Existing Asset<br />
472<br />
Return to CIP TOC
FY 20<strong>12</strong>-2021 Capital Improvement Plan<br />
Capital Project Expenses Detail<br />
2440 - Landfill Category: Other<br />
Project: 78522 - LF Water Pull Tractor Replace (R) Funding Source:<br />
Landfill Revenues<br />
Project Description:<br />
Replacement <strong>of</strong> water pull tractor that is expected to reach the end <strong>of</strong> its serviceable life in FY 2020. Landfill<br />
vehicles and equipment are not included in the Vehicle Replacement Fund. Instead the equipment is purchased<br />
with cash or financed through bonds at the time <strong>of</strong> acquisition. This machine is critical to reducing dust and<br />
maintaining compliance with the existing air quality permit.<br />
Capital Costs: FY 20<strong>12</strong> FY 2013 FY 2014 FY 2015 FY 2016 FYs 17-21<br />
Finance Charges $0 $0 $0 $0 $0 $9,222<br />
Equipment $0 $0 $0 $0 $0 $614,841<br />
Sub-Total New Funding $0<br />
$0 $0 $0 $0 $624,063<br />
FY 20<strong>12</strong> Carryover<br />
$492,901 $0 $0 $0 $0 $0<br />
TOTAL $492,901 $0 $0 $0 $0 $624,063<br />
Operating Description:<br />
No additional O and M cost as new equipment will replace aging existing equipment.<br />
Project: T2360 - Landfill Motor Grader Replace (R) Funding Source:<br />
Landfill Revenues<br />
Project Description:<br />
Replacement <strong>of</strong> the motor grader that is expected to reach the end <strong>of</strong> its serviceable life in FY 2013. Landfill<br />
vehicles and equipment are not included in the Vehicle Replacement Fund. Instead they are debt financed. The<br />
motor grader is used to establish and maintain the temporary roads on the active portion <strong>of</strong> the landfill.<br />
Capital Costs: FY 20<strong>12</strong> FY 2013 FY 2014 FY 2015 FY 2016 FYs 17-21<br />
Finance Charges $0 $4,275 $0 $0 $0 $0<br />
Equipment $0 $285,000 $0 $0 $0 $0<br />
TOTAL $0 $289,275 $0 $0 $0 $0<br />
Operating Description:<br />
No additional O and M cost as new equipment will replace aging existing equipment.<br />
Project: T2370 - Landfill Auger Scraper Replace (R) Funding Source:<br />
Landfill Revenues<br />
Project Description:<br />
Replacement <strong>of</strong> the auger scraper in FY 2014 when the equipment is expected to be at the end <strong>of</strong> its serviceable<br />
life. Based on current usage, this piece <strong>of</strong> equipment will be 11 years old with 15,000 to 17,000 hours. The<br />
scraper is used to remove dirt from the earth that is used for daily and intermittent cover <strong>of</strong> the refuse at the<br />
landfill. Landfill vehicles and equipment are not included in the Vehicle Replacement Fund. Instead they are debt<br />
financed.<br />
Capital Costs: FY 20<strong>12</strong> FY 2013 FY 2014 FY 2015 FY 2016 FYs 17-21<br />
Finance Charges $0 $0 $21,225 $0 $0 $0<br />
Equipment $0 $0 $1,415,000 $0 $0 $0<br />
TOTAL $0 $0 $1,436,225 $0 $0 $0<br />
Operating Description:<br />
No additional O and M cost as new equipment will replace aging existing equipment.<br />
* New Project<br />
N=New Asset, R=Replacement <strong>of</strong> Existing Asset, I=Improvement <strong>of</strong> Existing Asset<br />
473<br />
Return to CIP TOC
FY 20<strong>12</strong>-2021 Capital Improvement Plan<br />
Capital Project Expenses Detail<br />
2440 - Landfill Category: Other<br />
Project: 78503 - Landfill Closure (South) (N) Funding Source:<br />
Landfill Revenues<br />
Project Description:<br />
Closure <strong>of</strong> the south area <strong>of</strong> the landfill after the permitted air space is completely filled with waste. Completed<br />
landfills are required by federal and state law to have a final cover system designed and constructed. It is<br />
projected that the 140 acres in the south half <strong>of</strong> the landfill will reach approved filling capa<strong>city</strong> during FY 2015.<br />
Closure will take place during FY 2016.<br />
Capital Costs: FY 20<strong>12</strong> FY 2013 FY 2014 FY 2015 FY 2016 FYs 17-21<br />
Design $0 $0 $0 $250,000 $250,000 $0<br />
Construction $0 $0 $0 $0 $8,583,027 $0<br />
Finance Charges $0 $0 $0 $3,750 $132,495 $0<br />
Engineering Charges $0 $0 $0 $2,546 $89,954 $0<br />
Arts $0 $0 $0 $0 $85,830 $0<br />
TOTAL $0 $0 $0 $256,296 $9,141,306 $0<br />
Operating Description:<br />
Annual cost for post-closure landscape maintenance, methane gas management and ongoing environmental<br />
monitoring after site is closed. The additional O and M will be absorbed by the department.<br />
Operating Costs: FY 20<strong>12</strong> FY 2013 FY 2014 FY 2015 FY 2016 FYs 17-21<br />
Landscape $0 $0 $0 $0 $0 $220,554<br />
TOTAL $0 $0 $0 $0 $0 $220,554<br />
Project: 78505 - LF Phase Construction (North) (N) Funding Source:<br />
Landfill Revenues<br />
Project Description:<br />
This project is required for the development <strong>of</strong> the northern portion <strong>of</strong> the landfill and includes phased installation<br />
<strong>of</strong> liner and leachate collection system. It is anticipated that the north portion <strong>of</strong> the landfill will begin accepting<br />
waste during FY 2016. Funds identified in FY 2014 ($102,541) will be used for engineering design. Funds in FY<br />
2015 ($4,625,208) will pay for construction <strong>of</strong> North Phase 1a. Funds identified in FY 2016 ($102,541) will be<br />
used for engineering design <strong>of</strong> North Phase 1b. Funds identified in FY 2017 ($4,366,770) will pay for<br />
development <strong>of</strong> North Phase 1b, which will need to be constructed in FY 2017.<br />
Capital Costs: FY 20<strong>12</strong> FY 2013 FY 2014 FY 2015 FY 2016 FYs 17-21<br />
Design $0 $0 $100,000 $100,000 $100,000 $100,000<br />
Construction $0 $0 $0 $4,368,000 $0 $4,118,400<br />
Finance Charges $0 $0 $1,500 $67,020 $1,500 $63,276<br />
Engineering Charges $0 $0 $1,041 $46,508 $1,041 $43,910<br />
Arts $0 $0 $0 $43,680 $0 $41,184<br />
TOTAL $0 $0 $102,541 $4,625,208 $102,541 $4,366,770<br />
Operating Description:<br />
No additional O and M is required for this project<br />
* New Project<br />
N=New Asset, R=Replacement <strong>of</strong> Existing Asset, I=Improvement <strong>of</strong> Existing Asset<br />
474<br />
Return to CIP TOC
FY 20<strong>12</strong>-2021 Capital Improvement Plan<br />
Capital Project Expenses Detail<br />
2440 - Landfill Category: Other<br />
Project: 78507 - Landfill Soil Excavation (N) Funding Source:<br />
Landfill Revenues<br />
Project Description:<br />
This project provides for excavation <strong>of</strong> Phase 1 in the north expansion area to prepare for future landfill cell<br />
development. It includes excavation <strong>of</strong> approximately one-third <strong>of</strong> the north expansion area, removal <strong>of</strong> berm<br />
located between the north area and the Materials Recovery Facility (MRF) as well as utility relocation due to<br />
berm removal, and construction <strong>of</strong> a screening berm along the eastern boundary as an interim soil storage area.<br />
Excavation <strong>of</strong> the remaining two-thirds will occur as part <strong>of</strong> future landfill phase construction.<br />
Capital Costs: FY 20<strong>12</strong> FY 2013 FY 2014 FY 2015 FY 2016 FYs 17-21<br />
Design $0 $100,000 $100,000 $0 $0 $0<br />
Construction $0 $0 $<strong>12</strong>,531,498 $0 $0 $0<br />
Finance Charges $0 $1,500 $189,472 $0 $0 $0<br />
Engineering Charges $0 $903 $114,097 $0 $0 $0<br />
Arts $0 $0 $<strong>12</strong>5,315 $0 $0 $0<br />
TOTAL $0 $102,403 $13,060,382 $0 $0 $0<br />
Operating Description:<br />
No additional O and M is needed at this time.<br />
Project: 78508 - Landfill Stormwater Drainage (N) Funding Source:<br />
Landfill Revenues<br />
Project Description:<br />
Construction <strong>of</strong> a series <strong>of</strong> storm water diversion devices that are necessary to minimize erosion <strong>of</strong> the landfill's<br />
final cover surface. A total <strong>of</strong> 16 storm water drainage devices (down drains) are included in the original landfill<br />
design. This project provides for the installation <strong>of</strong> six down drains on the eastern and southern portions <strong>of</strong> the<br />
landfill, which are anticipated to reach final grade in early 2013. Installation <strong>of</strong> the remaining down drains will be<br />
completed during the south area closure project.<br />
Capital Costs: FY 20<strong>12</strong> FY 2013 FY 2014 FY 2015 FY 2016 FYs 17-21<br />
Construction $0 $451,584 $0 $0 $0 $0<br />
Finance Charges $0 $6,774 $0 $0 $0 $0<br />
Engineering Charges $0 $29,805 $0 $0 $0 $0<br />
Arts $0 $4,516 $0 $0 $0 $0<br />
Contingency $0 $73,902 $0 $0 $0 $0<br />
TOTAL $0 $566,581 $0 $0 $0 $0<br />
Operating Description:<br />
Additional O and M will be required only after the landfill's south area closure has been completed and is<br />
included in the O and M costs under the Landfill Closure (South) Project #78503.<br />
* New Project<br />
N=New Asset, R=Replacement <strong>of</strong> Existing Asset, I=Improvement <strong>of</strong> Existing Asset<br />
475<br />
Return to CIP TOC
20<strong>12</strong>-2021 CAPITAL IMPROVEMENT PLAN<br />
Airport Capital Grants<br />
AIRPORT CAPITAL GRANTS<br />
During the next decade, the Glendale Airport will continue to grow in response to the business<br />
and recreational needs <strong>of</strong> Glendale and West Valley residents. Like most municipal airports,<br />
Glendale’s airport relies heavily on federal and state grants to accomplish capital improvements.<br />
Typically, ninety-seven and one half percent <strong>of</strong> the cost <strong>of</strong> these improvements is grant-funded<br />
(95% federal and 2.5% state). The <strong>city</strong>’s match <strong>of</strong> two and one half percent will come from the<br />
voter-approved, half-cent sales transportation tax.<br />
The use <strong>of</strong> FY 20<strong>12</strong> airport capital funding is contingent on the <strong>city</strong> receiving Federal Aviation<br />
Administration grants. The <strong>city</strong> will pursue grant funding for projects related to a security<br />
upgrade, pavement maintenance, removal <strong>of</strong> a blast fence, a land purchase and a capa<strong>city</strong> study.<br />
Project Name: Airport – Tower & Radio Upgrade<br />
Funding Source: FAA & ADOT Grants/Transportation Half-Cent Sales Tax<br />
Fund #: 2<strong>12</strong>0<br />
Project #: 79503<br />
476<br />
Return to CIP TOC
FY <strong>2011</strong> - 2020 Capital Improvement Program<br />
Capital Projects By Fund and Project Number<br />
2<strong>12</strong>0 - Airport Capital Grants Category: Other<br />
Capital Project Expenses<br />
Carryover<br />
FY 20<strong>12</strong>: FY 2013: FY 2014: FY 2015: FY 2016: FYs 17-21:<br />
New Funding<br />
Existing Assets<br />
Improvement <strong>of</strong> Existing Assets<br />
79504 Airport-Security Upgrade 1,462,500<br />
0 0 150,000 1,700,000 0 0<br />
79515 Airport-Pavement Maintenance 0 100,000 150,000 175,000 550,000 0 0<br />
79516 Airport-RSA Remove Blast Fence 292,500 343,481 0 0 0 0 0<br />
Replacement <strong>of</strong> Existing Assets<br />
79511 Airport-Master Plan Update 0<br />
0 0 0 0 300,000 0<br />
Sub-Total - Existing Assets 1,755,000 443,481 150,000 325,000 2,250,000 300,000 0<br />
New Assets<br />
T1460 Runway Land Purchase 0 15,000,000 0 0 0 0 0<br />
T1461 Airport-EA Land Acq. 36 Acres 0 200,000 0 0 0 0 0<br />
T1462 Airport-Capa<strong>city</strong> Study 0 50,000 0 0 0 0 0<br />
T1463 Airport-EA East TWY, NW Ramp 0<br />
0 0 0 250,000 0 0<br />
T1467 Airport-EA RSA Improvements 0<br />
0 0 200,000 0 0 0<br />
T1469 Airport-Eastside Taxiway 0<br />
0 0 0 0 350,000 0<br />
T1470 Airport-EMAS Taxiway Pavement 0<br />
0 0 0 70,000 700,000 0<br />
T1471 Airport-EMAS Design/Constr 0<br />
0 0 0 576,000 7,200,000 0<br />
Sub-Total - New Assets 0 15,250,000 0 200,000 896,000 8,250,000 0<br />
Total Project Expenses: $1,755,000<br />
Total FY 20<strong>12</strong> Funding: $17,448,481<br />
* New Project<br />
$15,693,481 $150,000 $525,000 $3,146,000 $8,550,000 $0<br />
477<br />
Return to CIP TOC
FY 20<strong>12</strong>-2021 Capital Improvement Plan<br />
Capital Project Expenses Detail<br />
2<strong>12</strong>0 - Airport Capital Grants Category: Other<br />
Project: 79504 - Airport-Security Upgrade (I) Funding Source:<br />
Grants/City Match<br />
Project Description:<br />
This is an FAA and ADOT funded project to acquire and install perimeter security equipment.<br />
Capital Costs: FY 20<strong>12</strong> FY 2013 FY 2014 FY 2015 FY 2016 FYs 17-21<br />
Design $0 $0 $145,985 $1,654,502 $0 $0<br />
Engineering Charges $0 $0 $4,015 $45,498 $0 $0<br />
Sub-Total New Funding $0<br />
$0 $150,000 $1,700,000 $0 $0<br />
FY 20<strong>12</strong> Carryover<br />
$1,462,500 $0 $0 $0 $0 $0<br />
TOTAL $1,462,500 $0 $150,000 $1,700,000 $0 $0<br />
Operating Description:<br />
No additional O and M is needed at this time.<br />
Project: 79515 - Airport-Pavement Maintenance (I) Funding Source:<br />
Grants/City Match<br />
Project Description:<br />
Runway and taxiway pavement maintenance is needed when cracks and deterioration occurs on existing asphalt.<br />
Capital Costs: FY 20<strong>12</strong> FY 2013 FY 2014 FY 2015 FY 2016 FYs 17-21<br />
Design $95,877 $0 $0 $0 $0 $0<br />
Construction $0 $142,450 $166,192 $522,317 $0 $0<br />
Engineering Charges $4,<strong>12</strong>3 $6,<strong>12</strong>5 $7,146 $22,460 $0 $0<br />
Arts $0 $1,425 $1,662 $5,223 $0 $0<br />
TOTAL $100,000 $150,000 $175,000 $550,000 $0 $0<br />
Operating Description:<br />
No additional O and M is needed at this time.<br />
Project: 79516 - Airport-RSA Remove Blast Fence (I) Funding Source:<br />
Grants/City Match<br />
Project Description:<br />
The FAA runway safety action group has identified the moving <strong>of</strong> the blast fences in the runway safety area<br />
(RSA) at the end <strong>of</strong> Runway 19 due to a safety h<strong>az</strong>ard.<br />
Capital Costs: FY 20<strong>12</strong> FY 2013 FY 2014 FY 2015 FY 2016 FYs 17-21<br />
Design $48,149 $0 $0 $0 $0 $0<br />
Construction $276,650 $0 $0 $0 $0 $0<br />
Engineering Charges $15,915 $0 $0 $0 $0 $0<br />
Arts $2,767 $0 $0 $0 $0 $0<br />
Sub-Total New Funding $343,481<br />
$0 $0 $0 $0 $0<br />
FY 20<strong>12</strong> Carryover<br />
$292,500 $0 $0 $0 $0 $0<br />
TOTAL $635,981 $0 $0 $0 $0 $0<br />
Operating Description:<br />
No additional O and M is needed for this project.<br />
* New Project<br />
N=New Asset, R=Replacement <strong>of</strong> Existing Asset, I=Improvement <strong>of</strong> Existing Asset<br />
478<br />
Return to CIP TOC
FY 20<strong>12</strong>-2021 Capital Improvement Plan<br />
Capital Project Expenses Detail<br />
2<strong>12</strong>0 - Airport Capital Grants Category: Other<br />
Project: 79511 - Airport-Master Plan Update (R) Funding Source:<br />
Grants/City Match<br />
Project Description:<br />
The Airport Master Plan was updated in 2009 and guides the future development <strong>of</strong> the airport, identifies grant<br />
funding opportunities for capital improvements and forecasts aircraft operations. The FAA recommends updates<br />
to the master plan every 5-10 years.<br />
Capital Costs: FY 20<strong>12</strong> FY 2013 FY 2014 FY 2015 FY 2016 FYs 17-21<br />
Miscellaneous/Other $0 $0 $0 $0 $300,000 $0<br />
TOTAL $0 $0 $0 $0 $300,000 $0<br />
Operating Description:<br />
No additional O and M is needed for this project.<br />
Project: T1460 - Runway Land Purchase (N) Funding Source:<br />
Grants/City Match<br />
Project Description:<br />
Acquire 36 acres <strong>of</strong> land north <strong>of</strong> approach to Runway 19 for runway protection zone for the safety <strong>of</strong> landing<br />
aircraft.<br />
Capital Costs: FY 20<strong>12</strong> FY 2013 FY 2014 FY 2015 FY 2016 FYs 17-21<br />
Land $15,000,000 $0 $0 $0 $0 $0<br />
TOTAL $15,000,000 $0 $0 $0 $0 $0<br />
Operating Description:<br />
No additional O and M is needed at this time.<br />
Project: T1461 - Airport-EA Land Acq. 36 Acres (N) Funding Source:<br />
Grants/City Match<br />
Project Description:<br />
An environmental assessment, survey, and appraisal are required on the acquisition <strong>of</strong> 36 acres <strong>of</strong> land to<br />
protect the runway safety area <strong>of</strong>f the end <strong>of</strong> Runway 19 for landing aircraft.<br />
Capital Costs: FY 20<strong>12</strong> FY 2013 FY 2014 FY 2015 FY 2016 FYs 17-21<br />
Miscellaneous/Other $200,000 $0 $0 $0 $0 $0<br />
TOTAL $200,000 $0 $0 $0 $0 $0<br />
Operating Description:<br />
No additional O and M is needed for this project.<br />
Project: T1462 - Airport-Capa<strong>city</strong> Study (N) Funding Source:<br />
Grants/City Match<br />
Project Description:<br />
The capa<strong>city</strong> study is a joint study between the City <strong>of</strong> Glendale and John F. Long to determine if there is a need<br />
for a second runway.<br />
Capital Costs: FY 20<strong>12</strong> FY 2013 FY 2014 FY 2015 FY 2016 FYs 17-21<br />
Miscellaneous/Other $50,000 $0 $0 $0 $0 $0<br />
TOTAL $50,000 $0 $0 $0 $0 $0<br />
Operating Description:<br />
No additional O and M is needed for this project.<br />
* New Project<br />
N=New Asset, R=Replacement <strong>of</strong> Existing Asset, I=Improvement <strong>of</strong> Existing Asset<br />
479<br />
Return to CIP TOC
FY 20<strong>12</strong>-2021 Capital Improvement Plan<br />
Capital Project Expenses Detail<br />
2<strong>12</strong>0 - Airport Capital Grants Category: Other<br />
Project: T1463 - Airport-EA East TWY, NW Ramp (N) Funding Source:<br />
Grants/City Match<br />
Project Description:<br />
An environmental assessment (EA) is required prior to the construction <strong>of</strong> an eastside taxiway and northwest<br />
(NW) ramp for future aviation development on the eastside <strong>of</strong> the airport property.<br />
Capital Costs: FY 20<strong>12</strong> FY 2013 FY 2014 FY 2015 FY 2016 FYs 17-21<br />
Miscellaneous/Other $0 $0 $0 $250,000 $0 $0<br />
TOTAL $0 $0 $0 $250,000 $0 $0<br />
Operating Description:<br />
No additional O and M is needed for this project.<br />
Project: T1467 - Airport-EA RSA Improvements (N) Funding Source:<br />
Grants/City Match<br />
Project Description:<br />
An environmental assessment (EA) is required prior to making improvements to the runway safety area. The<br />
improvements <strong>of</strong> Engineered Materials Arresting Systems (EMAS) at each end <strong>of</strong> the runway is for overrun <strong>of</strong><br />
aircraft.<br />
Capital Costs: FY 20<strong>12</strong> FY 2013 FY 2014 FY 2015 FY 2016 FYs 17-21<br />
Miscellaneous/Other $0 $0 $200,000 $0 $0 $0<br />
TOTAL $0 $0 $200,000 $0 $0 $0<br />
Operating Description:<br />
No additional O and M is needed at this time.<br />
Project: T1469 - Airport-Eastside Taxiway (N) Funding Source:<br />
Grants/City Match<br />
Project Description:<br />
Pending an environmental assessment design only for an eastside taxiway and ramps for future expansion <strong>of</strong><br />
airport facilities that are needed for future growth <strong>of</strong> forecasted aviation. The taxiway and ramps are for<br />
movement <strong>of</strong> aircraft to hangars and support services.<br />
Capital Costs: FY 20<strong>12</strong> FY 2013 FY 2014 FY 2015 FY 2016 FYs 17-21<br />
Design $0 $0 $0 $0 $333,651 $0<br />
Engineering Charges $0 $0 $0 $0 $16,349 $0<br />
TOTAL $0 $0 $0 $0 $350,000 $0<br />
Operating Description:<br />
No additional O and M is needed at this time.<br />
* New Project<br />
N=New Asset, R=Replacement <strong>of</strong> Existing Asset, I=Improvement <strong>of</strong> Existing Asset<br />
480<br />
Return to CIP TOC
FY 20<strong>12</strong>-2021 Capital Improvement Plan<br />
Capital Project Expenses Detail<br />
2<strong>12</strong>0 - Airport Capital Grants Category: Other<br />
Project: T1470 - Airport-EMAS Taxiway Pavement (N) Funding Source:<br />
Grants/City Match<br />
Project Description:<br />
Design and pave taxiway on Runway 01 for Engineered Materials Arresting Systems (EMAS) product for the<br />
safety <strong>of</strong> aircraft over running the runway end.<br />
Capital Costs: FY 20<strong>12</strong> FY 2013 FY 2014 FY 2015 FY 2016 FYs 17-21<br />
Design $0 $0 $0 $67,114 $0 $0<br />
Construction $0 $0 $0 $0 $664,767 $0<br />
Engineering Charges $0 $0 $0 $2,886 $28,585 $0<br />
Arts $0 $0 $0 $0 $6,648 $0<br />
TOTAL $0 $0 $0 $70,000 $700,000 $0<br />
Operating Description:<br />
No additional O and M is required for this project.<br />
Project: T1471 - Airport-EMAS Design/Constr (N) Funding Source:<br />
Grants/City Match<br />
Project Description:<br />
Design and construct Engineered Materials Arresting Systems (EMAS) at Runway's 01 and 19 in the runway<br />
safety areas to stop aircraft that are in an emergency situation and have run out <strong>of</strong> runway length.<br />
Capital Costs: FY 20<strong>12</strong> FY 2013 FY 2014 FY 2015 FY 2016 FYs 17-21<br />
Design $0 $0 $0 $569,086 $0 $0<br />
Construction $0 $0 $0 $0 $7,043,974 $0<br />
Engineering Charges $0 $0 $0 $6,914 $85,586 $0<br />
Arts $0 $0 $0 $0 $70,440 $0<br />
TOTAL $0 $0 $0 $576,000 $7,200,000 $0<br />
Operating Description:<br />
No additional O and M is needed at this time.<br />
* New Project<br />
N=New Asset, R=Replacement <strong>of</strong> Existing Asset, I=Improvement <strong>of</strong> Existing Asset<br />
481<br />
Return to CIP TOC
20<strong>12</strong>-2021 CAPITAL IMPROVEMENT PLAN<br />
Other Capital Project Funds<br />
OTHER CAPITAL PROJECT FUNDS<br />
Other Federal and State Grants<br />
The majority <strong>of</strong> Glendale’s grants for capital projects come from the federal or state government.<br />
The grants in this category are open and competitive. The CIP grant reserve appropriation<br />
represents a contingency appropriation for unanticipated grant opportunities that may arise<br />
during the fiscal year.<br />
General Fund<br />
General Fund projects that are typically referred to as pay-as-you-go (PAYGO) projects are<br />
funded with General Fund operating dollars. Therefore they are typically balanced against base<br />
<strong>budget</strong> operations, vehicle and technology replacement premiums, supplemental requests and<br />
possible salary increases.<br />
Civic Center<br />
Projects in this category are considered PAYGO projects and are funded with General Fund<br />
operating dollars. A Civic Center 10 Year Restoration project is included in FY 20<strong>12</strong>; this<br />
project will utilize $300,000 that was set-aside per City Council direction in FY 2007. A Civic<br />
Center Maintenance Reserve project has also been added to the capital plan with a <strong>budget</strong> <strong>of</strong><br />
$50,000 <strong>annual</strong>ly for emergency repairs and/or replacement <strong>of</strong> Civic Center specific equipment.<br />
Technology Infrastructure<br />
In FY 2008 a new fund was added to the General Fund PAYGO category. New information<br />
technology projects are included in the last five years <strong>of</strong> the capital plan, as well as funding for<br />
PeopleS<strong>of</strong>t enhancements in FY 2013.<br />
The Strategic Initiatives Group (SIG) submitted projects in this category. SIG, with<br />
representatives from all <strong>city</strong> departments, was initiated to provide a viable, consolidated request<br />
for information technology infrastructure. SIG compiled a list <strong>of</strong> information technology needs<br />
that meet three criteria: (1) direct customer service benefits to citizens; (2) creation <strong>of</strong><br />
efficiencies in operations and cost savings; and (3) technology that is crucial to operations using<br />
the current number <strong>of</strong> employees.<br />
Arts Commission<br />
The Municipal Art Fund promotes the creative use <strong>of</strong> art in public places. One percent <strong>of</strong> the<br />
cost associated with each public construction project is set aside for the purchase and<br />
maintenance <strong>of</strong> public art. The Glendale Arts Commission was formed to select works <strong>of</strong> art to<br />
be commissioned or purchased through the Municipal Arts Fund. This fund has been used to<br />
purchase the recently dedicated Glendale Public Safety Memorial located in the Glendale Civic<br />
Center Pl<strong>az</strong>a and the award-winning brick sculpture, “Tribute to Firefighters,” at Fire Station<br />
157, as well as other art pieces in various locations within the <strong>city</strong>.<br />
482<br />
Return to CIP TOC
FY <strong>2011</strong> - 2020 Capital Improvement Program<br />
Capital Projects By Fund and Project Number<br />
1840 - Other Federal and State Grants Category: Other<br />
Capital Project Expenses<br />
Carryover<br />
FY 20<strong>12</strong>: FY 2013: FY 2014: FY 2015: FY 2016: FYs 17-21:<br />
New Funding<br />
Existing Assets<br />
Improvement <strong>of</strong> Existing Assets<br />
800<strong>12</strong> Bike & Ped/Skunk Creek @BellRd 472,100<br />
0 0 0 0 0 0<br />
Sub-Total - Existing Assets 472,100<br />
0 0 0 0 0 0<br />
New Assets<br />
80013 CIP Grant Reserve 0 2,000,000 2,000,000 2,000,000 2,000,000 2,000,000 10,000,000<br />
80028 43rd Ave/Peoria Ped Rest Area 339,152<br />
0 0 0 0 0 0<br />
Sub-Total - New Assets 339,152 2,000,000 2,000,000 2,000,000 2,000,000 2,000,000 10,000,000<br />
Total Project Expenses: $811,252<br />
Total FY 20<strong>12</strong> Funding: $2,811,252<br />
* New Project<br />
$2,000,000 $2,000,000 $2,000,000 $2,000,000 $2,000,000 $10,000,000<br />
483<br />
Return to CIP TOC
FY 20<strong>12</strong>-2021 Capital Improvement Plan<br />
Capital Project Expenses Detail<br />
1840 - Other Federal and State Grants Category: Other<br />
Project: 800<strong>12</strong> - Bike & Ped/Skunk Creek @BellRd (I) Funding Source:<br />
Grants<br />
Project Description:<br />
This project will widen the existing bridge over Skunk Creek, to provide pedestrian and bicycle access. 95% <strong>of</strong><br />
this project is funded by a Congestion Mitigation Air Quality grant with 5% <strong>city</strong> matching funds ($25,650). The <strong>city</strong><br />
match is <strong>budget</strong>ed in project<br />
Capital Costs: FY 20<strong>12</strong> FY 2013 FY 2014 FY 2015 FY 2016 FYs 17-21<br />
FY 20<strong>12</strong> Carryover<br />
$472,100 $0 $0 $0 $0 $0<br />
TOTAL $472,100 $0 $0 $0 $0 $0<br />
Operating Description:<br />
No additional O and M is needed.<br />
Project: 80013 - CIP Grant Reserve (N) Funding Source:<br />
Grants<br />
Project Description:<br />
This represents reserve appropriation for unanticipated grant opportunities that may arise during the fiscal year.<br />
Capital Costs: FY 20<strong>12</strong> FY 2013 FY 2014 FY 2015 FY 2016 FYs 17-21<br />
Miscellaneous/Other $2,000,000 $2,000,000 $2,000,000 $2,000,000 $2,000,000 $10,000,000<br />
TOTAL $2,000,000 $2,000,000 $2,000,000 $2,000,000 $2,000,000 $10,000,000<br />
Operating Description:<br />
No additional O and M is needed. Project reflects appropriation only.<br />
Project: 80028 - 43rd Ave/Peoria Ped Rest Area (N) Funding Source:<br />
Grants<br />
Project Description:<br />
Construction <strong>of</strong> a bus stop and trail/pedestrian rest area on the northwest corner <strong>of</strong> 43rd Avenue and Peoria<br />
Avenue. The pl<strong>az</strong>a will be used by bus riders as well as hikers, cyclists and equestrian traffic on the historic Sun<br />
Circle Trail system accessing the Thunderbird Paseo Linear Park. The project site is 22,801 sq ft.<br />
Capital Costs: FY 20<strong>12</strong> FY 2013 FY 2014 FY 2015 FY 2016 FYs 17-21<br />
FY 20<strong>12</strong> Carryover<br />
$339,152 $0 $0 $0 $0 $0<br />
TOTAL $339,152 $0 $0 $0 $0 $0<br />
Operating Description:<br />
Supplies/Contracts are $601 for <strong>annual</strong> supplies and a landscape contract for $2,000. Building maintenance is<br />
for six park area pole lights at $150 each for maintenance and electri<strong>city</strong>, $21 each for lamp replacement and<br />
$20 per month for electrical meter and delivery charges. Landscape is for 22,801 sq ft <strong>of</strong> in-house landscape<br />
maintenance and drip irrigation water/repairs at $0.22 per sq ft = $5,016. A supplemental <strong>budget</strong> request will be<br />
submitted once the project is near completion.<br />
Operating Costs: FY 20<strong>12</strong> FY 2013 FY 2014 FY 2015 FY 2016 FYs 17-21<br />
Supplies/Contr $0 $2,679 $2,759 $2,842 $2,927 $16,008<br />
Bldg. Maint. $0 $1,304 $1,343 $1,383 $1,425 $7,792<br />
Landscape $0 $5,166 $5,321 $5,481 $5,646 $30,872<br />
TOTAL $0 $9,149 $9,423 $9,706 $9,998 $54,672<br />
* New Project<br />
N=New Asset, R=Replacement <strong>of</strong> Existing Asset, I=Improvement <strong>of</strong> Existing Asset<br />
484<br />
Return to CIP TOC
FY <strong>2011</strong> - 2020 Capital Improvement Program<br />
Capital Projects By Fund and Project Number<br />
1000 - General Fund Category: Other<br />
Capital Project Expenses<br />
Existing Assets<br />
Carryover<br />
FY 20<strong>12</strong>: FY 2013: FY 2014: FY 2015: FY 2016: FYs 17-21:<br />
New Funding<br />
Improvement <strong>of</strong> Existing Assets<br />
T4620 Resurface Library Parking Lots 0<br />
0 0 0 0 0 396,460<br />
Replacement <strong>of</strong> Existing Assets<br />
81013 Bldg. Maintenance Reserve 50,000 50,000 50,000 50,000 50,000 50,000 250,000<br />
81055 Sales Tax System 479,498<br />
0 0 0 0 0 0<br />
T4735 GIS Enterprise System 0<br />
0 0 0 0 0 415,300<br />
Sub-Total - Existing Assets 529,498 50,000 50,000 50,000 50,000 50,000 1,061,760<br />
New Assets<br />
Property Acquisition 0 0 0 0 0 2,800,000<br />
Repayment to State Aviation 702,859 702,859 0 0 0 0<br />
City Fiber Optic Study 0 0 0 0 0 419,600<br />
Sub-Total - New Assets 0 702,859 702,859 0 0 0 3,219,600<br />
81014 0<br />
81057 0<br />
T4736 0<br />
Total Project Expenses: $529,498<br />
Total FY 20<strong>12</strong> Funding: $1,282,357<br />
* New Project<br />
$752,859 $752,859 $50,000 $50,000 $50,000 $4,281,360<br />
485<br />
Return to CIP TOC
FY 20<strong>12</strong>-2021 Capital Improvement Plan<br />
Capital Project Expenses Detail<br />
1000 - General Fund Category: Other<br />
Project: T4620 - Resurface Library Parking Lots (I) Funding Source:<br />
General Fund<br />
Project Description:<br />
Repave and seal the asphalt parking lot at the Main Library and slurry seal the parking lot at the Foothills Branch<br />
Library. Main Library's parking lot has deteriorated to the point that complete demolition <strong>of</strong> the existing asphalt is<br />
recommended. This consists <strong>of</strong> paving the site with 3 inches <strong>of</strong> new asphalt. A heavy grade slurry seal is<br />
recommended as soon as possible for the Foothills Branch Library in order to preserve the life span <strong>of</strong> the<br />
asphalt, which, with proper maintenance, should reach 20-30 years. (Main Library's parking lot is 23 years old<br />
and is a priority.)<br />
Capital Costs: FY 20<strong>12</strong> FY 2013 FY 2014 FY 2015 FY 2016 FYs 17-21<br />
Miscellaneous/Other $0 $0 $0 $0 $0 $396,460<br />
TOTAL $0 $0 $0 $0 $0 $396,460<br />
Operating Description:<br />
O and M is required for asphalt maintenance. The industry standard for asphalt maintenance is to seal every 2-3<br />
years. Maintenance includes crack sealing and restriping <strong>of</strong> parking lots. In FY 2020, the maintenance cost<br />
would be $22,889 for Main and $29,067 for Foothills. A supplemental <strong>budget</strong> request will be submitted once the<br />
project is near completion.<br />
Operating Costs: FY 20<strong>12</strong> FY 2013 FY 2014 FY 2015 FY 2016 FYs 17-21<br />
Bldg. Maint. $0 $0 $0 $0 $0 $51,956<br />
TOTAL $0 $0 $0 $0 $0 $51,956<br />
Project: 81013 - Bldg. Maintenance Reserve (R) Funding Source:<br />
General Fund<br />
Project Description:<br />
This project is intended to support emergency replacements and repairs <strong>of</strong> building components for <strong>city</strong> owned<br />
buildings.<br />
Capital Costs: FY 20<strong>12</strong> FY 2013 FY 2014 FY 2015 FY 2016 FYs 17-21<br />
Miscellaneous/Other $50,000 $50,000 $50,000 $50,000 $50,000 $250,000<br />
Sub-Total New Funding $50,000 $50,000 $50,000 $50,000 $50,000 $250,000<br />
FY 20<strong>12</strong> Carryover<br />
$50,000 $0 $0 $0 $0 $0<br />
TOTAL $100,000 $50,000 $50,000 $50,000 $50,000 $250,000<br />
Operating Description:<br />
No additional O and M is need for this project.<br />
Project: 81055 - Sales Tax System (R) Funding Source:<br />
General Fund<br />
Project Description:<br />
Purchase <strong>of</strong> a new s<strong>of</strong>tware application system which tracks revenue for the <strong>city</strong>. The system being replaced is<br />
20+ years old and runs on hardware and operating systems which are no longer cost effective to support. This is<br />
the PAYGO portion <strong>of</strong> the project.<br />
Capital Costs: FY 20<strong>12</strong> FY 2013 FY 2014 FY 2015 FY 2016 FYs 17-21<br />
FY 20<strong>12</strong> Carryover<br />
$479,498 $0 $0 $0 $0 $0<br />
TOTAL $479,498 $0 $0 $0 $0 $0<br />
Operating Description:<br />
A s<strong>of</strong>tware maintenance contract will expire after FY 20<strong>12</strong>. O and M is needed to cover the s<strong>of</strong>tware<br />
maintenance starting in FY 2013. The Finance Department will submit a supplemental request in the future for<br />
the additional O and M.<br />
Operating Costs: FY 20<strong>12</strong> FY 2013 FY 2014 FY 2015 FY 2016 FYs 17-21<br />
Equip. Maint. $0 $160,000 $164,800 $169,744 $174,835 $956,072<br />
TOTAL $0 $160,000 $164,800 $169,744 $174,835 $956,072<br />
* New Project<br />
N=New Asset, R=Replacement <strong>of</strong> Existing Asset, I=Improvement <strong>of</strong> Existing Asset<br />
486<br />
Return to CIP TOC
FY 20<strong>12</strong>-2021 Capital Improvement Plan<br />
Capital Project Expenses Detail<br />
1000 - General Fund Category: Other<br />
Project: T4735 - GIS Enterprise System (R) Funding Source:<br />
General Fund<br />
Project Description:<br />
The <strong>city</strong>’s reliance on Geographic Information Systems (GIS) has grown at a faster rate than the current<br />
technology infrastructure can handle. In the last year alone, GIS data storage has tripled in size. COG GIS has<br />
evolved from a decentralized team <strong>of</strong> individuals providing maps, to the creation <strong>of</strong> an enterprise database with<br />
"location-based" information. Due to the need for expanded data storage space and faster processing speeds,<br />
existing equipment located at the EOC has been used to meet increased system demands. This short term<br />
solution manages growth without putting an additional burden on the <strong>city</strong>’s general fund. In FY 2013 it is<br />
expected that the equipment will not meet standard vendor and operational requirements needed to support core<br />
GIS functions within the enterprise system. Without a replacement system, <strong>city</strong> departments could experience<br />
delays in data updates and reduced workflow for field and customer service workers, leading to slower service.<br />
Capital Costs: FY 20<strong>12</strong> FY 2013 FY 2014 FY 2015 FY 2016 FYs 17-21<br />
IT/Phone/Security $0 $0 $0 $0 $0 $415,300<br />
TOTAL $0 $0 $0 $0 $0 $415,300<br />
Operating Description:<br />
Presently, the GIS System is not in the TRF as are other enterprise systems. It is imperative that contributions be<br />
made to the Technology Replacement Fund due to the enterprise nature <strong>of</strong> the GIS system. The GIS System<br />
requires replacement every four to six years to maintain support status. O and M will also cover <strong>annual</strong> licenses.<br />
The additional O and M will be absorbed by the department.<br />
Operating Costs: FY 20<strong>12</strong> FY 2013 FY 2014 FY 2015 FY 2016 FYs 17-21<br />
PC/Vehicle Replacement $0 $0 $0 $0 $0 $472,255<br />
TOTAL $0 $0 $0 $0 $0 $472,255<br />
Project: 81014 - Property Acquisition (N) Funding Source:<br />
General Fund<br />
Project Description:<br />
Funds appropriated for acquisition <strong>of</strong> real property to meet specific council goals.<br />
Capital Costs: FY 20<strong>12</strong> FY 2013 FY 2014 FY 2015 FY 2016 FYs 17-21<br />
Land $0 $0 $0 $0 $0 $2,800,000<br />
TOTAL $0 $0 $0 $0 $0 $2,800,000<br />
Operating Description:<br />
No additional O and M can be identified until the <strong>city</strong> is closer to acquiring the properties.<br />
Project: 81057 - Repayment to State Aviation (N) Funding Source:<br />
General Fund<br />
Project Description:<br />
In 1997, the City <strong>of</strong> Glendale received a total <strong>of</strong> $2,473,714 in grant funds from the State Aviation Fund for the<br />
purchase <strong>of</strong> land adjacent to the Glendale Municipal Airport. Because the land is included in the property being<br />
used by the Spring Training Facility and will not be used for airport specific purposes, the <strong>city</strong> must repay ADOT.<br />
Adjusting those 1997 grant funds to 2007 figures was done by using a Phoenix-Mesa Consumer Price index,<br />
determining a balance <strong>of</strong> $3,131,294 is due for repayment to ADOT. The <strong>city</strong> will pay that principal amount over<br />
a period <strong>of</strong> five years (through FY 2013) with equal bi-<strong>annual</strong> payments <strong>of</strong> $351,429 for a total <strong>of</strong> $702,858<br />
<strong>annual</strong>ly. During that time, the unpaid principal will earn interest at the 5-year U.S. Treasury T-Bill <strong>annual</strong> interest<br />
rate <strong>of</strong> 4.31%, which was effective September 21, 2007. Total repayment amount will be $3,514,291.10.<br />
Capital Costs: FY 20<strong>12</strong> FY 2013 FY 2014 FY 2015 FY 2016 FYs 17-21<br />
Land $702,859 $702,859 $0 $0 $0 $0<br />
TOTAL $702,859 $702,859 $0 $0 $0 $0<br />
Operating Description:<br />
No additional O and M is needed at this time.<br />
* New Project<br />
N=New Asset, R=Replacement <strong>of</strong> Existing Asset, I=Improvement <strong>of</strong> Existing Asset<br />
487<br />
Return to CIP TOC
FY 20<strong>12</strong>-2021 Capital Improvement Plan<br />
Capital Project Expenses Detail<br />
1000 - General Fund Category: Other<br />
Project: T4736 - City Fiber Optic Study (N) Funding Source:<br />
General Fund<br />
Project Description:<br />
The existing <strong>city</strong> owned fiber optic infrastructure is nearing capa<strong>city</strong> and currently does not extend to several <strong>city</strong><br />
facilities. The purpose <strong>of</strong> this study is to review the existing fiber cable and conduit capa<strong>city</strong> and then make<br />
recommendations for future planning. This study will create a road map for Information Technology and<br />
Intelligent Transportation to follow as the <strong>city</strong> continues to expand its voice and data communications. This study<br />
will evaluate the existing infrastructure to determine capa<strong>city</strong> and usage and provide recommendations on<br />
improving current design and usage. This study would also recommend and produce a long term plan to provide<br />
redundancy to critical <strong>city</strong> locations and to connect all <strong>city</strong> buildings to the fiber infrastructure.<br />
Capital Costs: FY 20<strong>12</strong> FY 2013 FY 2014 FY 2015 FY 2016 FYs 17-21<br />
Design $0 $0 $0 $0 $0 $400,000<br />
Engineering Charges $0 $0 $0 $0 $0 $19,600<br />
TOTAL $0 $0 $0 $0 $0 $419,600<br />
Operating Description:<br />
No additional O and M is needed at this time.<br />
* New Project<br />
N=New Asset, R=Replacement <strong>of</strong> Existing Asset, I=Improvement <strong>of</strong> Existing Asset<br />
488<br />
Return to CIP TOC
FY <strong>2011</strong> - 2020 Capital Improvement Program<br />
Capital Projects By Fund and Project Number<br />
1740 - Civic Center Category: Other<br />
Capital Project Expenses<br />
Existing Assets<br />
Carryover<br />
FY 20<strong>12</strong>: FY 2013: FY 2014: FY 2015: FY 2016: FYs 17-21:<br />
New Funding<br />
Improvement <strong>of</strong> Existing Assets<br />
84551 Civic Center Renovation 0<br />
0 0 0 0 0 3,895,734<br />
Replacement <strong>of</strong> Existing Assets<br />
84554 Civic Ctr. Maintenance Reserve 0 50,000 50,000 50,000 50,000 50,000 250,000<br />
T0351 Civic Center 10 Yr Restoration 0 300,000 0 0 0 0 0<br />
Sub-Total - Existing Assets 0 350,000 50,000 50,000 50,000 50,000 4,145,734<br />
Total Project Expenses: $0<br />
Total FY 20<strong>12</strong> Funding: $350,000<br />
* New Project<br />
$350,000 $50,000 $50,000 $50,000 $50,000 $4,145,734<br />
489<br />
Return to CIP TOC
FY 20<strong>12</strong>-2021 Capital Improvement Plan<br />
Capital Project Expenses Detail<br />
1740 - Civic Center Category: Other<br />
Project: 84551 - Civic Center Renovation (I) Funding Source:<br />
General Fund<br />
Project Description:<br />
This enhancement would create another signature feature at the Glendale Civic Center. The east courtyard<br />
would be converted into more meeting room space with sky lighting. This project also involves renovating and<br />
developing the grass (open space), south <strong>of</strong> the civic center, into functional use space that can be <strong>book</strong>ed for<br />
private events. This 5,000 square foot renovation to the Civic Center will enhance amenities, provide more prefunction<br />
space, attract clients and allow the facility to remain competitive within the surrounding marketplace.<br />
Capital Costs: FY 20<strong>12</strong> FY 2013 FY 2014 FY 2015 FY 2016 FYs 17-21<br />
Design $0 $0 $0 $0 $0 $756,000<br />
Construction $0 $0 $0 $0 $0 $2,488,000<br />
IT/Phone/Security $0 $0 $0 $0 $0 $35,000<br />
Engineering Charges $0 $0 $0 $0 $0 $60,014<br />
Arts $0 $0 $0 $0 $0 $24,880<br />
Equipment $0 $0 $0 $0 $0 $130,000<br />
Contingency $0 $0 $0 $0 $0 $341,840<br />
Miscellaneous/Other $0 $0 $0 $0 $0 $60,000<br />
TOTAL $0 $0 $0 $0 $0 $3,895,734<br />
Operating Description:<br />
Additional O and M will be needed starting in FY 2018. Staffing includes one Service Worker III position to help<br />
maintain the facility and provide additional supervision for event set-up as well as audio/visual technical<br />
expertise for the renovated space and one secretary to assist with <strong>of</strong>fice support needs and increased events<br />
and <strong>book</strong>ings. Supplies at $0.75 per sq ft and $3,000 for ongoing supplies/contracts, utilities at $2.80 per sq ft,<br />
electrical at $1,800 <strong>annual</strong>ly, building maintenance at $2.00 per sq ft, equipment maintenance at $0.40 per sq ft<br />
and building water usage at $0.143 per sq ft for 5,000 sq ft <strong>of</strong> expanded Civic Center space. The Civic Center<br />
currently has a company that maintains the landscaping in the areas addressed in this request, so no new<br />
funding is needed for landscaping or refuse. A supplemental <strong>budget</strong> request will be submitted once the project is<br />
near completion.<br />
Operating Costs: FY 20<strong>12</strong> FY 2013 FY 2014 FY 2015 FY 2016 FYs 17-21<br />
Staffing $0 $0 $0 $0 $0 $531,296<br />
Supplies/Contr $0 $0 $0 $0 $0 $33,719<br />
Utilities $0 $0 $0 $0 $0 $69,937<br />
Bldg. Maint. $0 $0 $0 $0 $0 $49,955<br />
Equip. Maint. $0 $0 $0 $0 $0 $9,991<br />
Insurance $0 $0 $0 $0 $0 $6,069<br />
Electrical $0 $0 $0 $0 $0 $8,992<br />
Water $0 $0 $0 $0 $0 $3,572<br />
TOTAL $0 $0 $0 $0 $0 $713,531<br />
Project: 84554 - Civic Ctr. Maintenance Reserve (R) Funding Source:<br />
General Fund<br />
Project Description:<br />
The Civic Center's maintenance reserve is used for the facility's extensive repairs and upgrades, as well as the<br />
replacement <strong>of</strong> furniture, fixtures, and equipment. The reserve will ensure that the Civic Center remains a<br />
competitive and high quality event venue and it is essential to the continued success <strong>of</strong> the facility.<br />
Capital Costs: FY 20<strong>12</strong> FY 2013 FY 2014 FY 2015 FY 2016 FYs 17-21<br />
Miscellaneous/Other $50,000 $50,000 $50,000 $50,000 $50,000 $250,000<br />
TOTAL $50,000 $50,000 $50,000 $50,000 $50,000 $250,000<br />
Operating Description:<br />
No additional O and M is needed.<br />
* New Project<br />
N=New Asset, R=Replacement <strong>of</strong> Existing Asset, I=Improvement <strong>of</strong> Existing Asset<br />
490<br />
Return to CIP TOC
FY 20<strong>12</strong>-2021 Capital Improvement Plan<br />
Capital Project Expenses Detail<br />
1740 - Civic Center Category: Other<br />
Project: T0351 - Civic Center 10 Yr Restoration (R) Funding Source:<br />
General Fund<br />
Project Description:<br />
The Civic Center's restoration fund will be used to replace and upgrade high cost depreciable items that have<br />
been in operation and use at the facility for the past 11 years. This funding is for the replacement <strong>of</strong> crucial items<br />
such as carpet, acoustical air walls in the ballroom, banquet chairs, and audio visual systems. The restoration is<br />
needed to ensure that the Civic Center remains a competitive, desirable, high quality event venue and is<br />
considered essential to the continued success <strong>of</strong> the facility. Recommendation for the planning and funding for<br />
the replacement <strong>of</strong> these high cost items was discussed in a City Council Budget Workshop in 2006.<br />
Capital Costs: FY 20<strong>12</strong> FY 2013 FY 2014 FY 2015 FY 2016 FYs 17-21<br />
Miscellaneous/Other $300,000 $0 $0 $0 $0 $0<br />
TOTAL $300,000 $0 $0 $0 $0 $0<br />
Operating Description:<br />
No additional O and M is needed at this time.<br />
* New Project<br />
N=New Asset, R=Replacement <strong>of</strong> Existing Asset, I=Improvement <strong>of</strong> Existing Asset<br />
491<br />
Return to CIP TOC
FY <strong>2011</strong> - 2020 Capital Improvement Program<br />
Capital Projects By Fund and Project Number<br />
2150 - Technology Infrastructure Category: Other<br />
Capital Project Expenses<br />
Carryover<br />
FY 20<strong>12</strong>: FY 2013: FY 2014: FY 2015: FY 2016: FYs 17-21:<br />
New Funding<br />
Existing Assets<br />
Improvement <strong>of</strong> Existing Assets<br />
T7010 Event Management Center Upgrad 0<br />
0 0 0 0 0 1,325,000<br />
T7071 PeopleS<strong>of</strong>t Phase 2 Enhancement 0<br />
0 1,097,200 0 0 0 0<br />
Replacement <strong>of</strong> Existing Assets<br />
T7030 Project/Permit Tracking System 0<br />
0 0 0 0 0 2,500,000<br />
T7050 Facility Audio/Visual Systems 0<br />
0 0 0 0 0 1,820,000<br />
T7072 Library Technology Upgrades 0<br />
0 0 0 0 0 1,<strong>12</strong>6,254<br />
T7073 *City Phone System Replacement 0<br />
0 0 0 0 0 5,500,000<br />
Sub-Total - Existing Assets 0<br />
0 1,097,200 0 0 0 <strong>12</strong>,271,254<br />
New Assets<br />
T7000 City Fiber Optic Communication 0<br />
0 0 0 0 0 16,220,625<br />
Sub-Total - New Assets 0<br />
0 0 0 0 0 16,220,625<br />
Total Project Expenses: $0<br />
Total FY 20<strong>12</strong> Funding: $0<br />
* New Project<br />
$0 $1,097,200 $0 $0 $0 $28,491,879<br />
492<br />
Return to CIP TOC
FY 20<strong>12</strong>-2021 Capital Improvement Plan<br />
Capital Project Expenses Detail<br />
2150 - Technology Infrastructure Category: Other<br />
Project: T7010 - Event Management Center Upgrad (I) Funding Source:<br />
General Fund<br />
Project Description:<br />
The <strong>city</strong> acquired the Mobile Command Center (MCC) in 2000 and opened the Traffic Management Center<br />
(TMC) in 2004 to improve the <strong>city</strong>’s management <strong>of</strong> incidents, events and day-to-day traffic. Signal system<br />
management s<strong>of</strong>tware along with audio/visual and communications equipment within these two centers needs to<br />
be upgraded to enhance system functionality and coordination between the Police Department, Traffic<br />
Management Center, and Emergency Operations Center.<br />
Capital Costs: FY 20<strong>12</strong> FY 2013 FY 2014 FY 2015 FY 2016 FYs 17-21<br />
IT/Phone/Security $0 $0 $0 $0 $0 $25,000<br />
Equipment $0 $0 $0 $0 $0 $1,300,000<br />
TOTAL $0 $0 $0 $0 $0 $1,325,000<br />
Operating Description:<br />
No additional O and M is needed. This project replaces and upgrades the existing system. O and M <strong>of</strong> this<br />
system is currently funded in the Transportation Department operating <strong>budget</strong>.<br />
Project: T7071 - PeopleS<strong>of</strong>t Phase 2 Enhancement (I) Funding Source:<br />
General Fund<br />
Project Description:<br />
This request is for funding to cover the consulting cost <strong>of</strong> upgrading PeopleS<strong>of</strong>t's Human Capital Management<br />
module. An upgrade <strong>of</strong> the module is required since the current module will no longer be supported by the<br />
s<strong>of</strong>tware vendor. Creating efficient and functional government requires improving the use <strong>of</strong> technology across<br />
and within departments. In order to do this, PeopleS<strong>of</strong>t modules must be kept up to date.<br />
Capital Costs: FY 20<strong>12</strong> FY 2013 FY 2014 FY 2015 FY 2016 FYs 17-21<br />
IT/Phone/Security $0 $997,200 $0 $0 $0 $0<br />
Contingency $0 $100,000 $0 $0 $0 $0<br />
TOTAL $0 $1,097,200 $0 $0 $0 $0<br />
Operating Description:<br />
Annual maintenance for the s<strong>of</strong>tware is already being paid for as well as the PC maintenance so there are no<br />
additional O and M for this project.<br />
* New Project<br />
N=New Asset, R=Replacement <strong>of</strong> Existing Asset, I=Improvement <strong>of</strong> Existing Asset<br />
493<br />
Return to CIP TOC
FY 20<strong>12</strong>-2021 Capital Improvement Plan<br />
Capital Project Expenses Detail<br />
2150 - Technology Infrastructure Category: Other<br />
Project: T7030 - Project/Permit Tracking System (R) Funding Source:<br />
General Fund<br />
Project Description:<br />
The current project/permit system provides automated tracking <strong>of</strong> all construction projects and <strong>city</strong> assets. It is<br />
also used as a computerized maintenance management system for the <strong>city</strong>. The system is used by the Building<br />
Safety, Planning, Transportation, Utilities, Sanitation, Fire, Engineering, Code Compliance and Economic<br />
Development departments. The <strong>city</strong>'s current system is supported by Infor which is not expected to continue<br />
support indefinitely. Funding is requested to replace or upgrade the current system with a web-based system<br />
before the current system becomes obsolete.<br />
Capital Costs: FY 20<strong>12</strong> FY 2013 FY 2014 FY 2015 FY 2016 FYs 17-21<br />
Miscellaneous/Other $0 $0 $0 $0 $0 $2,500,000<br />
TOTAL $0 $0 $0 $0 $0 $2,500,000<br />
Operating Description:<br />
The $137,916 is required for the ongoing service and maintenance agreement associated with the s<strong>of</strong>tware<br />
purchase. Staffing is for a Database Administrator. This FTE would provide much needed ongoing technical<br />
assistance and support to the nine departments using the system. The current system maintenance costs are<br />
$43,000 per year, with increases <strong>of</strong> approx 2% per year. The requirements for the new system are in addition to<br />
this current cost. A supplemental <strong>budget</strong> request will be submitted once the project is near completion.<br />
Operating Costs: FY 20<strong>12</strong> FY 2013 FY 2014 FY 2015 FY 2016 FYs 17-21<br />
Staffing $0 $0 $0 $0 $0 $99,994<br />
Supplies/Contr $0 $0 $0 $0 $0 $137,916<br />
TOTAL $0 $0 $0 $0 $0 $237,910<br />
Project: T7050 - Facility Audio/Visual Systems (R) Funding Source:<br />
General Fund<br />
Project Description:<br />
The replacement <strong>of</strong> <strong>city</strong>wide audio/visual (A/V) equipment that is not currently in the <strong>city</strong>'s Technology<br />
Replacement Fund. Although the serviceable life for a number <strong>of</strong> the identified systems have been extended<br />
beyond their expected life cycle, all systems continue to function properly and will be monitored by staff. The<br />
systems identified for future replacement include: the Sahuaro Ranch ball complex, the Foothills ball complex,<br />
four <strong>city</strong> pools, the amphitheater outdoor lighting systems, Council Chamber lighting system, Audio/Visual<br />
equipment in the City Hall Complex, the Main Library A/V and lighting systems, the Adult Center’s audio, lighting<br />
and security systems, the Foothills Library, and the security camera systems at the Foothills Skate Court and<br />
WARP X-Court.<br />
Capital Costs: FY 20<strong>12</strong> FY 2013 FY 2014 FY 2015 FY 2016 FYs 17-21<br />
Equipment $0 $0 $0 $0 $0 $1,820,000<br />
TOTAL $0 $0 $0 $0 $0 $1,820,000<br />
Operating Description:<br />
Total payments for the six year period to the Technology Replacement Fund. Assumes capital cost will be<br />
equally spread over the six year period and a six-year life cycle for the equipment. $1,820,000/6 = $303,333 *<br />
16.67% = $50,566 paid into replacement fund in year one. This doubles in year two ($101,132) triples in year<br />
three ($151,698), quadruples in year four ($202,264), quintuples in year five ($252,830), sextuples in year six<br />
($303,396). The total for FY's 2017 though 2021 is $758,490. A supplemental <strong>budget</strong> request will be submitted<br />
once the project is near completion.<br />
Operating Costs: FY 20<strong>12</strong> FY 2013 FY 2014 FY 2015 FY 2016 FYs 17-21<br />
PC/Vehicle Replacement $0 $0 $0 $0 $0 $758,490<br />
TOTAL $0 $0 $0 $0 $0 $758,490<br />
* New Project<br />
N=New Asset, R=Replacement <strong>of</strong> Existing Asset, I=Improvement <strong>of</strong> Existing Asset<br />
494<br />
Return to CIP TOC
FY 20<strong>12</strong>-2021 Capital Improvement Plan<br />
Capital Project Expenses Detail<br />
2150 - Technology Infrastructure Category: Other<br />
Project: T7072 - Library Technology Upgrades (R) Funding Source:<br />
General Fund<br />
Project Description:<br />
Replacement <strong>of</strong> the Integrated Library System (ILS) and procurement <strong>of</strong> Radio Frequency Identification (RFID)<br />
technology will ensure that the library's resources can catch up and remain current with library technology. The<br />
ILS is vital to the operation <strong>of</strong> all library services, integrating the holdings catalog, materials purchases,<br />
circulation and patron information. RFID will complement the ILS and consists <strong>of</strong> tagging all materials which are<br />
read by the check-out machines and the security gates. The benefit <strong>of</strong> RFID is that items can be checked out<br />
and checked in all at once, rather than the current "one at a time" system, resulting in improved customer service<br />
and productivity.<br />
Capital Costs: FY 20<strong>12</strong> FY 2013 FY 2014 FY 2015 FY 2016 FYs 17-21<br />
Finance Charges $0 $0 $0 $0 $0 $27,470<br />
Miscellaneous/Other $0 $0 $0 $0 $0 $1,098,784<br />
TOTAL $0 $0 $0 $0 $0 $1,<strong>12</strong>6,254<br />
Operating Description:<br />
Includes <strong>annual</strong> maintenance costs ($63,287), replacement fund costs ($76,890) and RFID tags ($23,065). A<br />
supplemental <strong>budget</strong> request will be submitted once the project is near completion.<br />
Operating Costs: FY 20<strong>12</strong> FY 2013 FY 2014 FY 2015 FY 2016 FYs 17-21<br />
Supplies/Contr $0 $0 $0 $0 $0 $115,325<br />
Equip. Maint. $0 $0 $0 $0 $0 $316,435<br />
PC/Vehicle Replacement $0 $0 $0 $0 $0 $384,450<br />
TOTAL $0 $0 $0 $0 $0 $816,210<br />
Project: T7073* - City Phone System Replacement (R) Funding Source:<br />
General Fund<br />
Project Description:<br />
The current telephone switch will be out <strong>of</strong> production support in 2016, consequently service and parts will no<br />
longer be available. The current vendor Nortel was purchased by Avaya in 2010, the Nortel product we currently<br />
own will be discontinued in 2016. The telephone switch handles all calls coming into the <strong>city</strong> and will have a<br />
direct impact on every department. Because this is a technology project, scope and cost could change<br />
significantly as the actual replacement date approaches. Costs provided at this time are only <strong>budget</strong>ary for<br />
planning purposes.<br />
Capital Costs: FY 20<strong>12</strong> FY 2013 FY 2014 FY 2015 FY 2016 FYs 17-21<br />
IT/Phone/Security $0 $0 $0 $0 $0 $5,500,000<br />
TOTAL $0 $0 $0 $0 $0 $5,500,000<br />
Operating Description:<br />
O and M is currently paid for from the Telephone Services Fund, an estimated $100,000 <strong>annual</strong>ly may be need<br />
for additional O and M costs starting in FY 2017. S<strong>of</strong>tware updates at an estimated cost <strong>of</strong> $300,000 are also<br />
included and may be needed every two to three years. A supplemental will be submitted once the telephone<br />
system has been replaced.<br />
Operating Costs: FY 20<strong>12</strong> FY 2013 FY 2014 FY 2015 FY 2016 FYs 17-21<br />
Equip. Maint. $0 $0 $0 $0 $0 $1,100,000<br />
TOTAL $0 $0 $0 $0 $0 $1,100,000<br />
* New Project<br />
N=New Asset, R=Replacement <strong>of</strong> Existing Asset, I=Improvement <strong>of</strong> Existing Asset<br />
495<br />
Return to CIP TOC
FY 20<strong>12</strong>-2021 Capital Improvement Plan<br />
Capital Project Expenses Detail<br />
2150 - Technology Infrastructure Category: Other<br />
Project: T7000 - City Fiber Optic Communication (N) Funding Source:<br />
General Fund<br />
Project Description:<br />
Installation <strong>of</strong> conduit and fiber optic cable on arterial streets and some minor streets to connect <strong>city</strong> facilities and<br />
signal system to support traffic operations, <strong>city</strong> business and security mesh network. Completing the planned<br />
network will eliminate monthly lease fees, improving network speeds, remote control <strong>of</strong> signals, cameras and<br />
message signs.<br />
Capital Costs: FY 20<strong>12</strong> FY 2013 FY 2014 FY 2015 FY 2016 FYs 17-21<br />
Design $0 $0 $0 $0 $0 $2,000,000<br />
IT/Phone/Security $0 $0 $0 $0 $0 $395,625<br />
Engineering Charges $0 $0 $0 $0 $0 $55,000<br />
Equipment $0 $0 $0 $0 $0 $13,770,000<br />
TOTAL $0 $0 $0 $0 $0 $16,220,625<br />
Operating Description:<br />
O and M costs associated with electri<strong>city</strong> ($4,000) for fiber optic communications equipment as well as the<br />
maintenance ($44,000) for fiber and the fiber connections per year. The costs above are for FY 2019 through FY<br />
2021 in inflated dollars. A supplemental <strong>budget</strong> request will be submitted once the project is near completion.<br />
Operating Costs: FY 20<strong>12</strong> FY 2013 FY 2014 FY 2015 FY 2016 FYs 17-21<br />
Utilities $0 $0 $0 $0 $0 $21,199<br />
Equip. Maint. $0 $0 $0 $0 $0 $233,189<br />
TOTAL $0 $0 $0 $0 $0 $254,388<br />
* New Project<br />
N=New Asset, R=Replacement <strong>of</strong> Existing Asset, I=Improvement <strong>of</strong> Existing Asset<br />
496<br />
Return to CIP TOC
FY <strong>2011</strong> - 2020 Capital Improvement Program<br />
Capital Projects By Fund and Project Number<br />
<strong>12</strong>20 - Arts Commission Category: Other<br />
Capital Project Expenses<br />
Carryover<br />
FY 20<strong>12</strong>: FY 2013: FY 2014: FY 2015: FY 2016: FYs 17-21:<br />
New Funding<br />
New Assets<br />
84650 Arts Commission 0 500,000 500,000 500,000 500,000 500,000 1,750,000<br />
Sub-Total - New Assets 0 500,000 500,000 500,000 500,000 500,000 1,750,000<br />
Total Project Expenses: $0<br />
Total FY 20<strong>12</strong> Funding: $500,000<br />
* New Project<br />
$500,000 $500,000 $500,000 $500,000 $500,000 $1,750,000<br />
497<br />
Return to CIP TOC
FY 20<strong>12</strong>-2021 Capital Improvement Plan<br />
Capital Project Expenses Detail<br />
<strong>12</strong>20 - Arts Commission Category: Other<br />
Project: 84650 - Arts Commission (N) Funding Source:<br />
Capital Plan<br />
Project Description:<br />
City Council Ordinance No. <strong>12</strong>26 created a Municipal Art Fund which provides for the purchase <strong>of</strong> works <strong>of</strong> art<br />
for public places. The Arts Commission selects the art work that will be purchased and/or commissioned.<br />
Capital Costs: FY 20<strong>12</strong> FY 2013 FY 2014 FY 2015 FY 2016 FYs 17-21<br />
Miscellaneous/Other $500,000 $500,000 $500,000 $500,000 $500,000 $1,750,000<br />
TOTAL $500,000 $500,000 $500,000 $500,000 $500,000 $1,750,000<br />
Operating Description:<br />
Maintenance and restoration <strong>of</strong> the public art collection is funded in the operating <strong>budget</strong>.<br />
* New Project<br />
N=New Asset, R=Replacement <strong>of</strong> Existing Asset, I=Improvement <strong>of</strong> Existing Asset<br />
498<br />
Return to CIP TOC
SCHEDULES<br />
FY <strong>2011</strong>-<strong>12</strong><br />
CITY OF GLENDALE, AZ<br />
PRELIMINARY<br />
ANNUAL BUDGET<br />
BOOK
CITY OF GLENDALE, AZ<br />
Schedules<br />
SCHEDULES<br />
The <strong>budget</strong> schedules summarize the City’s financial activities in a comprehensive, numeric<br />
format. They are intended to give the reader a glance at the <strong>city</strong>'s financial situation. Schedule 1<br />
is the most comprehensive schedule, <strong>of</strong>fering a summary <strong>of</strong> all pertinent financial information<br />
for all the City’s funds. The reader can readily determine the starting and ending fund balances,<br />
transfers in and out, revenues and operating, capital and debt service expenditures for each fund.<br />
The remaining schedules provide in-depth detail <strong>of</strong> <strong>budget</strong>ary information which is necessary for<br />
the smooth operation <strong>of</strong> the <strong>city</strong>. All the schedules serve as handy reference materials to City <strong>of</strong><br />
Glendale employees and to the public.<br />
This section includes detailed analyses and reports for the following areas:<br />
• Schedule 1 by Category includes major sources <strong>of</strong> inflows & outflows by category<br />
• Schedule 1 by Fund is a summary <strong>of</strong> the inflows and outflows by fund<br />
• Schedule 2 by Category is a multi-year look at revenues all funds combined<br />
• Schedule 2 by Fund is a multi-year look at revenues by individual fund<br />
• Schedule 3 is a multi-year look at operating expenditures<br />
• Schedule 4 is a summary <strong>of</strong> scheduled inter-fund transfers for the upcoming fiscal year<br />
• Schedule 5 is an analysis <strong>of</strong> the City’s current and proposed property tax levy & rate<br />
• Schedule 6 is a multi-year listing <strong>of</strong> departmental authorized staffing by position<br />
• Schedule 7 - Summary is a multi-year look at the long-term debt service obligations<br />
• Schedule 7 - Detail is a look at each individual long-term debt service obligation<br />
• Schedule 8 is a multi-year look at payment requirements for capital leases<br />
• Schedule 9 is a listing <strong>of</strong> internal services premiums by fund and department<br />
• Schedule 10 is a listing <strong>of</strong> general staff and administrative service charges<br />
• Schedule 11 lists department’s operating capital <strong>budget</strong>s<br />
• Schedule <strong>12</strong> lists any carryover savings <strong>budget</strong>ed by fund and department<br />
499<br />
Return to TOC
Schedule One by CATEGORY<br />
FY 20<strong>12</strong> Fund Balance Analysis<br />
(All Dollars in Thousands)<br />
General<br />
Trust<br />
Special<br />
Revenue<br />
Enterprise<br />
Internal<br />
Service<br />
Capital<br />
Debt<br />
Service<br />
Total<br />
Revenues and Other Sources<br />
Charges for services $35,481 $0 $1,174 $99,907 $0 $0 $1,057 $137,618<br />
Fines and forfeitures $3,771 $0 $0 $0 $0 $0 $0 $3,771<br />
Interest Income $857 $22 $193 $200 $42 $115 $669 $2,097<br />
Intergovernmental $44,913 $0 $69,827 $9,143 $0 $0 $0 $<strong>12</strong>3,883<br />
Licenses and permits $9,339 $0 $0 $82 $0 $678 $0 $10,099<br />
Miscellaneous $9,473 $0 $2,863 $6,324 $53 $0 $0 $18,713<br />
Other financing sources $0 $0 $0 $230 $0 $13,000 $0 $13,230<br />
Self insurance premiums $0 $0 $0 $0 $25,363 $0 $0 $25,363<br />
Taxes revenue $61,447 $0 $37,684 $0 $0 $0 $18,144 $117,275<br />
Transfer In $19,007 $0 $1,019 $307 $0 $7,467 $32,064 $59,864<br />
Total<br />
$184,287 $22 $1<strong>12</strong>,759 $116,194 $25,457 $21,260 $51,934 $511,913<br />
Expenditures<br />
Capital Outlay $2,132 $0 $25,778 $56,776 $0 $59,535 $0 $144,221<br />
Community Environment $84 $0 $<strong>12</strong>,694 $0 $0 $0 $0 $<strong>12</strong>,778<br />
Community Housing $0 $0 $0 $<strong>12</strong>,609 $0 $0 $0 $<strong>12</strong>,609<br />
Community Services $20,140 $0 $25,717 $0 $0 $22 $0 $45,879<br />
Contingency $335 $5,598 $14,259 $7,500 $3,000 $15,877 $0 $46,569<br />
Debt Service $0 $0 $0 $26,965 $0 $0 $58,144 $85,110<br />
General Government $27,148 $0 $0 $0 $0 $9 $0 $27,157<br />
Internal Services $0 $0 $0 $0 $27,593 $0 $0 $27,593<br />
Landfill $0 $0 $0 $7,099 $0 $0 $0 $7,099<br />
Other $22,296 $0 $0 $0 $0 $0 $0 $22,296<br />
Public Safety $76,722 $0 $34,624 $0 $0 $2 $0 $111,347<br />
Public Works $23,780 $0 $177 $0 $0 $5 $0 $23,962<br />
Sanitation $0 $0 $0 $14,581 $0 $0 $0 $14,581<br />
Street Maintenance $791 $0 $8,218 $0 $0 $1 $0 $9,009<br />
Water and Sewer $0 $0 $0 $47,790 $0 $0 $0 $47,790<br />
Transfer Out $40,155 $0 $17,147 $0 $0 $1,209 $1,353 $59,864<br />
Total<br />
Excess (Deficiency) <strong>of</strong><br />
Revenues over Expenses<br />
Beginning Fund Balance<br />
Ending Fund Balance<br />
$213,582 $5,598 $138,613 $173,321 $30,593 $76,659 $59,497 $697,864<br />
($29,295) ($5,576) ($25,854) ($57,<strong>12</strong>7) ($5,136) ($55,400) ($7,563) ($185,951)<br />
$39,533 $5,576 $35,692 $83,411 $8,344 $55,400 $22,651 $250,606<br />
$10,238 $0 $9,837 $26,284 $26,284 $0 $15,087 $64,655<br />
500<br />
Return to TOC
General Fund Group:<br />
Schedule One by FUND<br />
FY 20<strong>12</strong> Fund Balance Analysis<br />
(All Dollars in Thousands)<br />
Beginning Projected Transfers Transfers<br />
Fund Bal. Revenues In Out Operations<br />
1000 General Fund $24,819 $131,174 $0 ($30,920) ($<strong>12</strong>3,525)<br />
1010 National Events $335 $0 $0 $0 $0<br />
1040 General Services $0 $8,934 $0 $0 ($8,934)<br />
1100 Telephone Tl Services $147 $904 $0 $0 ($979)<br />
1<strong>12</strong>0 Vehicle Replacement $6,356 $1,938 $0 $0 ($3,030)<br />
1140 Technology Replacement $4,190 $1,755 $0 $0 ($3,5<strong>12</strong>)<br />
1190 Employee Groups $131 $60 $0 $0 ($84)<br />
<strong>12</strong>20 Arts Commission i $1,386 $97 $0 $0 ($<strong>12</strong>8)<br />
<strong>12</strong>40 Court Fund $344 $351 $0 $0 ($584)<br />
<strong>12</strong>60 Library $234 $157 $0 $0 ($247)<br />
<strong>12</strong>80 Youth Sports Complex $0 $30 $292 $0 ($322)<br />
<strong>12</strong>81 Stadium Event Operations $0 $905 $2,062 $0 ($2,967)<br />
<strong>12</strong>82 Arena Event Operations $0 $5,278 $15,926 $0 ($21,204) 204)<br />
<strong>12</strong>83 CamelbackRanch c EventOps $0 $29 $0 $0 ($29)<br />
1740 Civic i Center $300 $410 $407 $0 ($767)<br />
1770 Zanjero Special Revenue $0 $1,283 $0 ($1,283) $0<br />
1780 Arena Special lR Revenue $0 $8,502 $0 ($7,952) ($550)<br />
1790 Stadium City Sales Tax - AZSTA $488 $1,746 $0 $0 ($1,746)<br />
1870 Marketing Self-Sustaining i $614 $237 $320 $0 ($753)<br />
2530 Public Safety Training Center $161 $1,421 $0 $0 ($1,545)<br />
2538 Glendale Health Center $28 $69 $0 $0 ($54)<br />
Sub-Total General Fund Group: $39,533 $165,280 $19,007 ($40,155) ($170,960)<br />
Special Revenue Fund Group:<br />
1300 HOME Grant $250 $1,538 $0 $0 ($1,788)<br />
1310 Neighborhood Stabilization Pgm $1,218 $900 $0 $0 ($2,118)<br />
1311 N'hood Stabilization ti Pgm III $0 $3,368 368 $0 $0 ($3,368) 368)<br />
1320 Community Dvpmt Block Grant $7 $3,726 $0 $0 ($3,719)<br />
1340 HURF/Streets Fund $<strong>12</strong>,741 $11,416 $0 ($1,353) ($8,218)<br />
1640 Local Transp. Assistance $0 $0 $0 $0 $0<br />
1650 Transportation Grants $0 $6,465 $0 $0 ($769)<br />
1660 Transportation Sales Tax $10,929 $20,043 043 $900 ($15,794) ($11,841)<br />
1700 Police Sales Tax $4,315 $<strong>12</strong>,262 $0 $0 ($14,174)<br />
1720 Fire Sales Tax $770 $6,<strong>12</strong>2 $0 $0 ($6,396)<br />
1760 Airport Operating $0 $466 $61 $0 ($527)<br />
1820 CAP Grant $<strong>12</strong>1 $1,543 $58 $0 ($1,603)<br />
1830 Emergency Shelter Grants $0 $98 $0 $0 ($98)<br />
1840 Other Federal d l and d State t Grants t $187 $21,750 $0 $0 ($18,995)<br />
1842 ARRA Stimulus Grants $0 $2,672 $0 $0 ($2,672)<br />
1860 RICO $4,774 $844 $0 $0 ($3,895)<br />
1880 Parks & Rec Self-Sustaining Sustaining $38 $1,078 $0 $0 ($1,073)<br />
1885 Parks & Rec Designated $342 $1 $0 $0 ($177)<br />
2<strong>12</strong>0 Airport Capital Grants $0 $17,448 $0 $0 $0<br />
Sub-Total Special p Rev Fund Group: p $35,692 $ , $111,740 $ , $1,019 $ , ($17,147) , ) ($81,430)<br />
, )<br />
501<br />
Return to TOC
General Fund Group:, continued<br />
Schedule One by FUND<br />
FY 20<strong>12</strong> Fund Balance Analysis<br />
(All Dollars in Thousands)<br />
Capital Debt Total Ending<br />
Outlay Service Contingency Appropriation p Fund Bal.<br />
1000 General Fund ($1,282) $0 $0 ($<strong>12</strong>4,808) $265<br />
1010 National Events $0 $0 ($335) ($335) $0<br />
1040 General Services $0 $0 $0 ($8,934) $0<br />
1100 Telephone Tl Services $0 $0 $0 ($979) $72<br />
1<strong>12</strong>0 Vehicle Replacement $0 $0 $0 ($3,030) $5,264<br />
1140 Technology Replacement $0 $0 $0 ($3,5<strong>12</strong>) $2,432<br />
1190 Employee Groups $0 $0 $0 ($84) $107<br />
<strong>12</strong>20 Arts Commission i ($500) $0 $0 ($628) $856<br />
<strong>12</strong>40 Court Fund $0 $0 $0 ($584) $111<br />
<strong>12</strong>60 Library $0 $0 $0 ($247) $144<br />
<strong>12</strong>80 Youth Sports Complex $0 $0 $0 ($322) $0<br />
<strong>12</strong>81 Stadium Event Operations $0 $0 $0 ($2,967) $0<br />
<strong>12</strong>82 Arena Event Operations $0 $0 $0 ($21,204) 204) $0<br />
<strong>12</strong>83 CamelbackRanch c EventOps $0 $0 $0 ($29) $0<br />
1740 Civic i Center ($350) $0 $0 ($1,117) 117) $0<br />
1770 Zanjero Special Revenue $0 $0 $0 $0 $0<br />
1780 Arena Special lR Revenue $0 $0 $0 ($550) $0<br />
1790 Stadium City Sales Tax - AZSTA $0 $0 $0 ($1,746) $488<br />
1870 Marketing Self-Sustaining i $0 $0 $0 ($753) $418<br />
2530 Public Safety Training Center $0 $0 $0 ($1,545) $37<br />
2538 Glendale Health Center $0 $0 $0 ($54) $44<br />
Sub-Total General Fund Group: ($2,132) $0 ($335) ($173,427) $10,238<br />
Special Revenue Fund Group:, , continued<br />
1300 HOME Grant $0 $0 $0 ($1,788) $0<br />
1310 Neighborhood Stabilization Pgm $0 $0 $0 ($2,118) $0<br />
1311 N'hood Stabilization ti Pgm III $0 $0 $0 ($3,368) 368) $0<br />
1320 Community Dvpmt Block Grant $0 $0 $0 ($3,719) $13<br />
1340 HURF/Streets Fund $0 $0 ($14,259) ($22,477) $327<br />
1640 Local Transp. Assistance $0 $0 $0 $0 $0<br />
1650 Transportation Grants ($5,518) $0 $0 ($6,287) $178<br />
1660 Transportation Sales Tax $0 $0 $0 ($11,841) $4,238<br />
1700 Police Sales Tax $0 $0 $0 ($14,174) $2,403<br />
1720 Fire Sales Tax $0 $0 $0 ($6,396) $496<br />
1760 Airport Operating $0 $0 $0 ($527) $0<br />
1820 CAP Grant $0 $0 $0 ($1,603) $119<br />
1830 Emergency Shelter Grants $0 $0 $0 ($98) $0<br />
1840 Other Federal d l and d State t Grants t ($2,811) $0 $0 ($21,806) $131<br />
1842 ARRA Stimulus Grants $0 $0 $0 ($2,672) $0<br />
1860 RICO $0 $0 $0 ($3,895) $1,723<br />
1880 Parks & Rec Self-Sustaining Sustaining $0 $0 $0 ($1,073) $43<br />
1885 Parks & Rec Designated $0 $0 $0 ($177) $167<br />
2<strong>12</strong>0 Airport Capital Grants ($17,448) $0 $0 ($17,448) $0<br />
Sub-Total Special p Rev Fund Group: p ($25,778) , ) $0 $ ($14,259) , ) ($<strong>12</strong>1,466) , ) $9,837$ ,<br />
502<br />
Return to TOC
Schedule One by FUND<br />
FY 20<strong>12</strong> Fund Balance Analysis<br />
(All Dollars in Thousands)<br />
Beginning Projected Transfers Transfers<br />
Fund Bal. Revenues In Out Operations<br />
Debt Service Fund Group:<br />
1900 General Obligation Bond Debt $21,116 $18,813 $209 ($1,353) $0<br />
1920 HURF Debt Service $0 $0 $4,706 $0 $0<br />
1930 P.F.C. Debt Service $0 $0 $380 $0 $0<br />
1940 M.P.C. MPC Debt btService $1,534 $1,057 $19,442 $0 $0<br />
1970 Transportation Bond Debt $0 $0 $7,327 $0 $0<br />
SbTtlDbtS Sub-Total Debt Svc Fund dG Group: $22,651 $19,870 $32,064 ($1,353) $0<br />
Capital Fund Group:<br />
1380 DIF- Library Buildings $1,731 $8 $0 $0 $0<br />
1400 DIF- Library Books $0 $0 $0 $0 $0<br />
1420 DIF- Fire Protection Facilities $0 $21 $0 $0 $0<br />
1440 DIF- Police Dept Facilities $1,107 107 $52 $0 $0 $0<br />
1460 DIF- Citywide Parks $194 $36 $0 $0 $0<br />
1480 DIF- Citywide Rec Facility $1,354 $44 $0 ($209) $0<br />
1500 DIF- Libraries $3,221 $69 $0 $0 $0<br />
1520 DIF- Citywide id Open Space $420 $86 $0 $0 $0<br />
1540 DIF- Park Dev Zone 1 $108 $20 $0 $0 $0<br />
1560 DIF- Park Dev Zone 2 $173 $10 $0 $0 $0<br />
1580 DIF- Park Dev Zone 3 $38 $2 $0 $0 $0<br />
1600 DIF- Roadway Improvements $2,575 $284 $0 ($1,000) $0<br />
1620 DIF-General Government $94 $94 $0 $0 $0<br />
1980 Street/Parking Bonds $4,288 $2 $0 $0 ($6)<br />
2000 HURF/Street Bonds $304 $1 $0 $0 ($1)<br />
2040 Public Safety Construction $4,683 $6 $0 $0 ($2)<br />
2060 Parks Construction $348 $2 $0 $0 ($7)<br />
2080 Gov't Facilities Construction $1,132 $1 $0 $0 ($2)<br />
2100 Economic Dev. Construction ti $1,804 $5 $0 $0 ($2)<br />
2130 Cultural Facility Construction $356 $0 $0 $0 $0<br />
2140 Open Space/Trails Construction $556 $0 $0 $0 $0<br />
2160 Library Construction $0 $0 $0 $0 $0<br />
2180 Flood Control Construction $11,877 $33 $0 $0 ($5)<br />
2210 Transportation Construction $19,036 $13,015 $7,467 $0 ($14)<br />
Sub-Total Capital Fund Group: $55,400 $13,793 $7,467 ($1,209) ($39)<br />
Trust Fund Group:<br />
2280 Cemetery Perpetual Care $5,576 $22 $0 $0 $0<br />
Enterprise Fund Group:<br />
2360+ Water W and dS Sewer $56,464 $79,323 $0 $0 ($47,790) 790)<br />
2440 Landfill $20,249 249 $8,253 $0 $0 ($7,099)<br />
2480 Sanitation $5,869 $15,068 $0 $0 ($14,581)<br />
2500 Community Housing Services $828 $13,243 $307 $0 ($<strong>12</strong>,609)<br />
Sub-Total Enterprise Fund Group: $83,411 $115,887 $307 $0 ($82,079)<br />
Internal Service Fund Group:<br />
2540 Risk Management g Self Ins. $4,477 $ , $2,543 $ , $0 $ $0 $ ($3,068)<br />
, )<br />
2560 Worker's Comp Self Ins. $1,284 $1,018 $0 $0 ($1,407)<br />
2580 Benefits Trust $2,584 $21,896 $0 $0 ($23,118)<br />
SbT Sub-Total lInternal lSvc Fund dG Group: $8,344 $25,457 $0 $0 ($27,593)<br />
TOTAL $250,606 $452,049 $59,864 ($59,864) ($362,100)<br />
503<br />
Return to TOC
Schedule One by FUND<br />
FY 20<strong>12</strong> Fund Balance Analysis<br />
(All Dollars in Thousands)<br />
Capital Debt Total Ending<br />
Outlay Service Contingency Appropriation p Fund Bal.<br />
Debt Service Fund Group:, continued<br />
1900 General Obligation Bond Debt $0 ($24,284) $0 ($24,284) $14,501<br />
1920 HURF Debt Service $0 ($4,706) $0 ($4,706) $0<br />
1930 P.F.C. Debt Service $0 ($380) $0 ($380) $0<br />
1940 M.P.C. MPC Debt btService $0 ($21,447) $0 ($21,447) $586<br />
1970 Transportation Bond Debt $0 ($7,327) $0 ($7,327) $0<br />
SbTtlDbtS Sub-Total Debt Svc Fund dG Group: $0 ($58,144) $0 ($58,144) $15,087<br />
Capital Fund Group:, continued<br />
1380 DIF- Library Buildings $0 $0 ($1,739) ($1,739) $0<br />
1400 DIF- Library Books $0 $0 $0 $0 $0<br />
1420 DIF- Fire Protection Facilities $0 $0 ($21) ($21) $0<br />
1440 DIF- Police Dept Facilities $0 $0 ($1,159) 159) ($1,159) 159) $0<br />
1460 DIF- Citywide Parks $0 $0 ($230) ($230) $0<br />
1480 DIF- Citywide Rec Facility $0 $0 ($1,189) 189) ($1,189) 189) $0<br />
1500 DIF- Libraries ($273) $0 ($3,017) ($3,290) $0<br />
1520 DIF- Citywide id Open Space ($215) $0 ($291) ($506) $0<br />
1540 DIF- Park Dev Zone 1 ($40) $0 ($89) ($<strong>12</strong>9) $0<br />
1560 DIF- Park Dev Zone 2 ($139) $0 ($44) ($183) $0<br />
1580 DIF- Park Dev Zone 3 ($32) $0 ($8) ($40) $0<br />
1600 DIF- Roadway Improvements ($132) $0 ($1,728) ($1,860) $0<br />
1620 DIF-General Government $0 $0 ($188) ($188) $0<br />
1980 Street/Parking Bonds ($3,090) $0 ($1,194) ($4,290) $0<br />
2000 HURF/Street Bonds ($197) $0 ($107) ($305) $0<br />
2040 Public Safety Construction ($2,415) $0 ($2,272) ($4,689) $0<br />
2060 Parks Construction ($166) $0 ($176) ($350) $0<br />
2080 Gov't Facilities Construction ($1,131) $0 $0 ($1,133) $0<br />
2100 Economic Dev. Construction ti ($1,746) $0 ($62) ($1,810) $0<br />
2130 Cultural Facility Construction ($105) $0 ($251) ($356) $0<br />
2140 Open Space/Trails Construction $0 $0 ($556) ($556) $0<br />
2160 Library Construction $0 $0 $0 $0 $0<br />
2180 Flood Control Construction ($10,349) $0 ($1,555) ($11,910) $0<br />
2210 Transportation Construction ($39,504) $0 $0 ($39,518) $0<br />
Sub-Total Capital Fund Group: ($59,535) $0 ($15,877) ($75,450) $0<br />
Trust Fund Group:, continued<br />
2280 Cemetery Perpetual Care $0 $0 ($5,598) ($5,598) $0<br />
Enterprise Fund Group:, continued<br />
2360+ Water W and dS Sewer ($53,182) ($26,965) ($5,000) ($132,937) $2,850<br />
2440 Landfill ($1,731) $0 ($2,000) ($10,830) $17,672<br />
2480 Sanitation ($1,864) $0 ($500) ($16,944) $3,993<br />
2500 Community Housing Services $0 $0 $0 ($<strong>12</strong>,609) $1,769<br />
Sub-Total Enterprise Fund Group: ($56,776) ($26,965) ($7,500) ($173,321) $26,284<br />
Internal Service Fund Group:, continued<br />
2540 Risk Management g Self Ins. $0 $ $0 $ ($3,000) , ) ($6,068) , ) $952$<br />
2560 Worker's Comp Self Ins. $0 $0 $0 ($1,407) $894<br />
2580 Benefits Trust $0 $0 $0 ($23,118) $1,362<br />
SbT Sub-Total lInternal lSvc Fund dG Group: $0 $0 ($3,000) ($30,593) $3,208<br />
TOTAL ($144,221) ($85,110) ($46,569) ($638,000) $64,655<br />
504<br />
Return to TOC
Schedule Two by CATEGORY<br />
Summary <strong>of</strong> Revenues<br />
(Includes All Funds)<br />
Description<br />
FY 2009 Actual<br />
FY 2010 Actual FY <strong>2011</strong> Estimate FY 20<strong>12</strong> Budget<br />
City Sales Tax $96,665,004<br />
Grants $18,516,108<br />
Water Revenues $37,846,238<br />
Sewer Revenue $26,384,046<br />
Property Tax $32,892,547<br />
Internal Charges $21,997,477<br />
State Income Tax $36,266,804<br />
Miscellaneous $11,695,296<br />
State Shared Sales Tax $19,320,873<br />
City Contributions $11,431,341<br />
Bond Proceeds<br />
Highway User Revenues $14,538,909<br />
Residential Sanitiation $10,254,367<br />
Staff & Adm Chargebacks $8,547,115<br />
Motor Vehicle In-Lieu $8,807,506<br />
Arena Fees $635,464<br />
Employee Contributions $5,245,169<br />
Court Revenue $3,639,953<br />
Commercial Sanitation Frontload $3,684,277<br />
Retiree Contributions $2,928,023<br />
Tipping Fees $3,316,166<br />
Gas/Electric Franchise Fees $2,747,641<br />
Recreation Revenue $2,623,762<br />
Interest $7,728,635<br />
Fire Department Other Fees $1,763,721<br />
Facility Rental Income $989,507<br />
Recycling Sales $1,593,052<br />
Cable Franchise Fees $1,580,942<br />
Partner Revenue $1,929,564<br />
Building Permits $1,232,972<br />
Security Revenue $998,811<br />
State Forfeitures $1,883,634<br />
Plan Check Fees $888,174<br />
Development Impact Fees $1,497,100<br />
$92,717,<strong>12</strong>6 $91,910,098 $96,156,234<br />
$22,650,788 $34,370,717 $65,324,215<br />
$42,393,9<strong>12</strong> $46,983,270 $46,740,078<br />
$28,662,682 $31,038,331 $31,006,477<br />
$33,311,218 $27,746,286 $20,937,987<br />
$17,972,244 $20,254,261 $19,389,893<br />
$31,292,382 $23,650,000 $19,336,210<br />
$22,050,448 $22,275,085 $18,916,143<br />
$17,786,351 $17,695,800 $17,352,894<br />
$14,273,336 $14,102,505 $14,166,532<br />
$41,659,534 $25,000,000 $13,000,000<br />
$13,774,184 $13,600,000 $11,415,534<br />
$10,299,381 $10,5<strong>12</strong>,000 $10,5<strong>12</strong>,000<br />
$8,404,382 $8,404,357 $9,404,382<br />
$8,<strong>12</strong>9,455 $8,500,000 $7,645,685<br />
$5,414,384 $2,449,894 $6,381,072<br />
$5,102,408 $4,366,620 $4,291,971<br />
$3,819,749 $3,672,850 $3,672,758<br />
$3,561,214 $3,500,000 $3,500,000<br />
$3,269,747 $3,411,159 $3,419,695<br />
$2,758,555 $3,034,610 $3,034,610<br />
$2,717,704 $2,500,000 $2,920,000<br />
$2,508,271 $2,202,025 $2,318,575<br />
$2,8<strong>12</strong>,315 $2,230,709 $2,077,<strong>12</strong>0<br />
$1,998,343 $2,243,719 $1,974,100<br />
$2,373,639 $1,841,447 $1,868,450<br />
$1,915,090 $1,900,000 $1,820,000<br />
$1,468,703 $1,675,000 $1,775,000<br />
$1,872,109 $1,419,989 $1,419,989<br />
$990,838 $1,050,000 $1,050,000<br />
$939,371 $1,103,339 $957,806<br />
$3,618,044 $750,000 $750,000<br />
$598,611 $735,000 $735,000<br />
$1,093,288 $701,794 $677,698<br />
505<br />
Return to TOC
Schedule Two by CATEGORY<br />
Summary <strong>of</strong> Revenues<br />
(Includes All Funds)<br />
Description<br />
FY 2009 Actual<br />
FY 2010 Actual FY <strong>2011</strong> Estimate FY 20<strong>12</strong> Budget<br />
Right-<strong>of</strong>-Way Permits $335,702<br />
Commercial Sanitation Roll<strong>of</strong>f $658,226<br />
Sales Tax Licenses $570,599<br />
City Property Rental $724,194<br />
Water Development Impact Fees $1,233,930<br />
Airport Fees $525,<strong>12</strong>8<br />
Library Fines/Fees $584,439<br />
Fire Dept CD Fees $317,330<br />
Loan Proceeds<br />
Lease Proceeds $<strong>12</strong>,006<br />
Sewer Development Impact Fees $398,283<br />
Liquor Licenses $190,514<br />
Planning/Zoning $337,058<br />
SRP In-Lieu $172,420<br />
Cemetery Revenue $272,909<br />
Business Licenses $92,284<br />
Transit Revenue $130,635<br />
Bus./Pr<strong>of</strong>. Licenses $116,726<br />
Miscellaneous CD Fees $138,360<br />
Engineering Plan Check Revenue $285,371<br />
Health Care Revenue $2,100<br />
Miscellaneous Bin Service $79,652<br />
Camelback Ranch Rev - Fire<br />
Outside City Commercial $184,955<br />
Development Impact Fees $18,348<br />
Equipment Rental $23,814<br />
Traffic Engineering Plan Check $60,8<strong>12</strong><br />
Sanitation Development Impact Fe $3,276<br />
LTAF - Lottery $1,040,568<br />
Federal Forfeitures $94,362<br />
$594,175 $584,487 $622,000<br />
$667,608 $600,000 $600,000<br />
$585,970 $614,911 $590,000<br />
$544,001 $485,459 $521,933<br />
$708,368 $500,000 $500,000<br />
$505,416 $465,486 $465,486<br />
$488,922 $342,700 $342,700<br />
$360,079 $360,361 $306,824<br />
$3,481,777 $250,000 $250,000<br />
$1,526,154 $210,200 $210,200<br />
$231,582 $200,000 $200,000<br />
$169,396 $200,000 $200,000<br />
$186,604 $142,800 $182,400<br />
$199,892 $181,236 $181,236<br />
$163,309 $135,000 $140,000<br />
$78,828 $83,880 $140,000<br />
$<strong>12</strong>9,626 $131,669 $<strong>12</strong>8,000<br />
$108,740 $<strong>12</strong>0,113 $110,000<br />
$<strong>12</strong>3,659 $65,000 $85,000<br />
$<strong>12</strong>2,222 $82,035 $82,000<br />
$56,328 $62,825 $69,388<br />
$105,066 $40,000 $40,000<br />
$28,674 $27,000 $28,852<br />
$17,423 $28,000 $28,000<br />
$18,866 $27,000 $27,000<br />
$24,061 $22,000 $26,400<br />
$29,247 $15,000 $20,000<br />
$3,864 $3,700 $3,700<br />
$599,909<br />
$28,187<br />
Grand Total : $410,674,199<br />
$466,097,759 $442,811,727 $452,049,227<br />
506<br />
Return to TOC
Schedule Two by FUND<br />
Summary <strong>of</strong> Revenues<br />
Fund<br />
Description<br />
FY 2009 Actual<br />
FY 2010 Actual FY <strong>2011</strong> Estimate FY 20<strong>12</strong> Budget<br />
GENERAL FUND GROUP<br />
1000 - General<br />
City Sales Tax $51,613,389<br />
State Income Tax $36,266,804<br />
State Shared Sales Tax $19,320,873<br />
Staff & Adm Chargebacks $8,007,000<br />
Motor Vehicle In-Lieu $8,807,506<br />
Miscellaneous $2,037,178<br />
Court Revenue $3,324,696<br />
Property Tax $3,985,091<br />
Gas/Electric Franchise Fees $2,747,641<br />
Fire Department Other Fees $1,763,721<br />
Cable Franchise Fees $1,580,942<br />
Recreation Revenue $1,501,576<br />
Building Permits $1,232,972<br />
Interest $1,384,130<br />
Plan Check Fees $888,174<br />
Right-<strong>of</strong>-Way Permits $335,702<br />
Sales Tax Licenses $570,599<br />
City Property Rental $630,456<br />
Fire Dept CD Fees $317,330<br />
Lease Proceeds<br />
Liquor Licenses $190,514<br />
Library Fines/Fees $317,100<br />
Planning/Zoning $337,058<br />
Cemetery Revenue $272,909<br />
Business Licenses $92,284<br />
Facility Rental Income $711,878<br />
Bus./Pr<strong>of</strong>. Licenses $116,726<br />
Miscellaneous CD Fees $138,360<br />
Engineering Plan Check Revenue $285,371<br />
SRP In-Lieu $26,288<br />
Traffic Engineering Plan Check $60,8<strong>12</strong><br />
Equipment Rental<br />
Fund Total - General: $148,865,080<br />
1040 - General Services<br />
Internal Charges $9,625,691<br />
Fund Total - General Services: $9,625,691<br />
$50,540,466 $50,500,000 $53,365,000<br />
$31,292,382 $23,650,000 $19,336,210<br />
$17,786,351 $17,695,800 $17,352,894<br />
$7,862,000 $7,862,000 $8,862,000<br />
$8,<strong>12</strong>9,455 $8,500,000 $7,645,685<br />
$2,388,329 $14,723,951 $4,234,550<br />
$3,477,494 $3,356,508 $3,356,508<br />
$4,170,237 $3,724,139 $2,943,561<br />
$2,717,704 $2,500,000 $2,920,000<br />
$1,998,343 $2,243,719 $1,974,100<br />
$1,468,703 $1,675,000 $1,775,000<br />
$1,404,981 $1,271,800 $1,317,600<br />
$990,838 $1,050,000 $1,050,000<br />
$1,224,698 $750,000 $8<strong>12</strong>,926<br />
$598,611 $735,000 $735,000<br />
$593,237 $584,487 $622,000<br />
$585,970 $614,911 $590,000<br />
$460,459 $425,219 $461,693<br />
$360,079 $360,361 $306,824<br />
$325,335 $210,200 $210,200<br />
$169,396 $200,000 $200,000<br />
$251,980 $187,000 $187,000<br />
$186,604 $142,800 $182,400<br />
$163,309 $135,000 $140,000<br />
$78,828 $83,880 $140,000<br />
$107,281 $117,216 $<strong>12</strong>4,792<br />
$108,740 $<strong>12</strong>0,113 $110,000<br />
$<strong>12</strong>3,659 $65,000 $85,000<br />
$<strong>12</strong>2,222 $82,035 $82,000<br />
$28,221 $31,236 $31,236<br />
$29,247 $15,000 $20,000<br />
$25<br />
$139,745,184 $143,6<strong>12</strong>,375 $131,174,179<br />
$7,922,392 $9,086,586 $8,934,049<br />
$7,922,392 $9,086,586 $8,934,049<br />
507<br />
Return to TOC
Schedule Two by FUND<br />
Summary <strong>of</strong> Revenues<br />
Fund<br />
Description<br />
FY 2009 Actual<br />
FY 2010 Actual FY <strong>2011</strong> Estimate FY 20<strong>12</strong> Budget<br />
1100 - Telephone Services<br />
Internal Charges $1,108,794<br />
Fund Total - Telephone Services: $1,108,794<br />
1<strong>12</strong>0 - Vehicle Replacement<br />
Internal Charges $2,789,875<br />
Miscellaneous $290,088<br />
Interest $<strong>12</strong>7,327<br />
Fund Total - Vehicle Replacement: $3,207,290<br />
1140 - PC Replacement<br />
Internal Charges $2,150,917<br />
Miscellaneous $13,339<br />
Interest $86,015<br />
Fund Total - PC Replacement: $2,250,271<br />
1190 - Employee Groups<br />
Miscellaneous $84,614<br />
Fund Total - Employee Groups: $84,614<br />
<strong>12</strong>20 - Arts Commission Fund<br />
Miscellaneous $620,853<br />
Interest $71,691<br />
Fund Total - Arts Commission Fund: $692,544<br />
<strong>12</strong>40 - Court Security/Bonds<br />
Court Revenue $282,707<br />
Miscellaneous $41,993<br />
Interest $7,<strong>12</strong>4<br />
Fund Total - Court Security/Bonds: $331,824<br />
<strong>12</strong>60 - Library<br />
Library Fines/Fees $267,339<br />
Miscellaneous $39<br />
Fund Total - Library: $267,378<br />
<strong>12</strong>80 - Youth Sports Complex<br />
Recreation Revenue $34,963<br />
Fund Total - Youth Sports Complex: $34,963<br />
<strong>12</strong>81 - Stadium Event Operations<br />
Security Revenue $963,829<br />
Miscellaneous<br />
Fund Total - Stadium Event Operatio $963,829<br />
$1,007,113 $990,447 $904,272<br />
$1,007,113 $990,447 $904,272<br />
$2,116,483 $1,996,860 $1,666,562<br />
$389,277 $250,000 $250,000<br />
$39,563 $19,960 $21,416<br />
$2,545,323 $2,266,820 $1,937,978<br />
$1,978,370 $2,014,016 $1,718,550<br />
$46,484 $20,000 $20,000<br />
$25,248 $14,869 $15,954<br />
$2,050,102 $2,048,885 $1,754,504<br />
$75,054 $60,000 $60,000<br />
$75,054 $60,000 $60,000<br />
$214,157 $71,932 $91,187<br />
$17,881 $5,671 $6,084<br />
$232,038 $77,603 $97,271<br />
$340,016 $316,250 $316,250<br />
$37,463 $35,050 $35,050<br />
$2,256 $115 $<strong>12</strong>3<br />
$379,735 $351,415 $351,423<br />
$236,942 $155,700 $155,700<br />
$6,477 $1,219 $1,200<br />
$243,419 $156,919 $156,900<br />
$36,164 $30,000 $30,000<br />
$36,164 $30,000 $30,000<br />
$882,406 $1,054,807 $905,056<br />
$375<br />
$882,781 $1,054,807 $905,056<br />
508<br />
Return to TOC
Schedule Two by FUND<br />
Summary <strong>of</strong> Revenues<br />
Fund<br />
Description<br />
FY 2009 Actual<br />
FY 2010 Actual FY <strong>2011</strong> Estimate FY 20<strong>12</strong> Budget<br />
<strong>12</strong>82 - Arena Event Operations<br />
Miscellaneous<br />
Arena Fees $14,305<br />
Fund Total - Arena Event Operations: $14,305<br />
<strong>12</strong>83 - CamelbackRanch EventOperations<br />
Camelback Ranch Rev - Fire<br />
Fund Total - CamelbackRanch Event<br />
1740 - Civic Center<br />
Facility Rental Income $277,629<br />
Miscellaneous $<strong>12</strong>3,544<br />
Equipment Rental $23,814<br />
Recreation Revenue<br />
Fund Total - Civic Center: $424,987<br />
1770 - Zanjero Special Revenue<br />
City Sales Tax $1,197,609<br />
Fund Total - Zanjero Special Revenue $1,197,609<br />
1780 - Arena Special Revenue<br />
Arena Fees $621,159<br />
City Sales Tax $2,627,860<br />
Facility Rental Income<br />
Miscellaneous $610,389<br />
Fund Total - Arena Special Revenue: $3,859,408<br />
1790 - Stadium City Sales Tax - AZSTA<br />
City Sales Tax $1,485,806<br />
Fund Total - Stadium City Sales Tax - $1,485,806<br />
1870 - Marketing Self Sust<br />
Miscellaneous $379,251<br />
Fund Total - Marketing Self Sust: $379,251<br />
2530 - Training Facility Revenue Fund<br />
Partner Revenue $1,579,413<br />
Miscellaneous<br />
Recreation Revenue $<strong>12</strong>,226<br />
Fund Total - Training Facility Revenu $1,591,639<br />
2538 - Glendale Health Center<br />
Health Care Revenue $2,100<br />
Fund Total - Glendale Health Center: $2,100<br />
$5,000,000<br />
$959,910 $273,648 $277,866<br />
$959,910 $273,648 $5,277,866<br />
$28,674 $27,000 $28,852<br />
$28,674 $27,000 $28,852<br />
$234,000 $275,108 $290,000<br />
$106,541 $53,800 $92,650<br />
$24,036 $22,000 $26,400<br />
$689 $3,500 $1,250<br />
$365,266 $354,408 $410,300<br />
$1,213,365 $1,249,016 $1,282,739<br />
$1,213,365 $1,249,016 $1,282,739<br />
$4,454,474 $2,176,246 $6,103,206<br />
$2,053,856 $2,023,889 $2,078,535<br />
$320,545 $320,545 $320,545<br />
$2,845<br />
$6,831,720 $4,520,680 $8,502,286<br />
$1,520,432 $1,700,000 $1,745,900<br />
$1,520,432 $1,700,000 $1,745,900<br />
$409,328 $269,000 $236,500<br />
$409,328 $269,000 $236,500<br />
$1,609,495 $1,419,989 $1,419,989<br />
$6,657 $847 $847<br />
$1,616,152 $1,420,836 $1,420,836<br />
$56,328 $62,825 $69,388<br />
$56,328 $62,825 $69,388<br />
509<br />
Return to TOC
Schedule Two by FUND<br />
Summary <strong>of</strong> Revenues<br />
Fund<br />
Description<br />
FY 2009 Actual<br />
FY 2010 Actual FY <strong>2011</strong> Estimate FY 20<strong>12</strong> Budget<br />
TOTAL-GENERAL FUND GROUP $176,387,383<br />
$168,<strong>12</strong>0,480 $169,613,270 $165,280,299<br />
SPECIAL REVENUE FUND GROUP<br />
1300 - Home Grant<br />
Grants $409,864<br />
Fund Total - Home Grant: $409,864<br />
1310 - Neighborhood Stabilization Pgm<br />
Grants $8,588<br />
Miscellaneous<br />
Fund Total - Neighborhood Stabilizati $8,588<br />
1311 - N'hood Stabilization Pgm III<br />
Grants<br />
Fund Total - N'hood Stabilization Pg<br />
1320 - C.D.B.G.<br />
Grants $2,303,992<br />
Miscellaneous<br />
Fund Total - C.D.B.G.: $2,303,992<br />
1340 - Highway User Gas Tax<br />
Highway User Revenues $14,538,909<br />
Miscellaneous $79,052<br />
Fund Total - Highway User Gas Tax: $14,617,961<br />
1640 - Local Transp. Assistance<br />
LTAF - Lottery $1,040,568<br />
Fund Total - Local Transp. Assistance $1,040,568<br />
1650 - Transportation Grants<br />
Grants $974,638<br />
Miscellaneous<br />
Fund Total - Transportation Grants: $974,638<br />
1660 - Transportation Sales Tax<br />
City Sales Tax $20,874,856<br />
Grants $566,106<br />
Transit Revenue $130,635<br />
Interest $594,420<br />
Court Revenue $32,550<br />
Miscellaneous $1,0<strong>12</strong>,006<br />
Fund Total - Transportation Sales Ta $23,210,573<br />
$1,111,4<strong>12</strong> $740,375 $1,537,838<br />
$1,111,4<strong>12</strong> $740,375 $1,537,838<br />
$2,237,448 $3,140,344 $613,553<br />
$143,405 $286,810<br />
$2,237,448 $3,283,749 $900,363<br />
$3,368,377<br />
$3,368,377<br />
$2,224,039 $1,803,154 $3,711,668<br />
$30,617 $13,834 $13,834<br />
$2,254,656 $1,816,988 $3,725,502<br />
$13,774,184 $13,600,000 $11,415,534<br />
$1,643<br />
$13,775,827 $13,600,000 $11,415,534<br />
$599,909<br />
$599,909<br />
$1,200,877 $1,647,698 $4,464,547<br />
$2,000,000<br />
$1,200,877 $1,647,698 $6,464,547<br />
$19,488,267 $18,536,453 $19,300,000<br />
$708,238 $454,465 $516,432<br />
$<strong>12</strong>9,626 $131,669 $<strong>12</strong>8,000<br />
$167,644 $91,466 $98,137<br />
$2,239 $92<br />
$482,170 $5<br />
$20,978,184 $19,214,150 $20,042,569<br />
510<br />
Return to TOC
Schedule Two by FUND<br />
Summary <strong>of</strong> Revenues<br />
Fund<br />
Description<br />
FY 2009 Actual<br />
FY 2010 Actual FY <strong>2011</strong> Estimate FY 20<strong>12</strong> Budget<br />
1700 - Police Special Revenue<br />
City Sales Tax $<strong>12</strong>,582,277<br />
Fund Total - Police Special Revenue: $<strong>12</strong>,582,277<br />
1720 - Fire Special Revenue<br />
City Sales Tax $6,283,207<br />
Fund Total - Fire Special Revenue: $6,283,207<br />
1760 - Airport Special Revenue<br />
Airport Fees $525,<strong>12</strong>8<br />
Miscellaneous $1,044<br />
Lease Proceeds $<strong>12</strong>,006<br />
Fund Total - Airport Special Revenue: $538,178<br />
1820 - CAP Grant<br />
Miscellaneous $242,047<br />
Fund Total - CAP Grant: $242,047<br />
1830 - Emergency Shelter Grants<br />
Grants $74,569<br />
Fund Total - Emergency Shelter Gran $74,569<br />
1840 - Grants<br />
Grants $4,304,876<br />
Fund Total - Grants: $4,304,876<br />
1842 - ARRA Stimulus Grants<br />
Grants<br />
Miscellaneous<br />
Fund Total - ARRA Stimulus Grants:<br />
1860 - RICO Funds<br />
State Forfeitures $1,883,634<br />
Interest $86,668<br />
Federal Forfeitures $94,362<br />
Miscellaneous<br />
Fund Total - RICO Funds: $2,064,664<br />
1880 - Parks & Recreation Self Sust<br />
Recreation Revenue $1,026,422<br />
Facility Rental Income<br />
Miscellaneous $469<br />
Fund Total - Parks & Recreation Self $1,026,891<br />
$11,939,794 $11,939,794 $<strong>12</strong>,262,168<br />
$11,939,794 $11,939,794 $<strong>12</strong>,262,168<br />
$5,960,946 $5,960,946 $6,<strong>12</strong>1,892<br />
$5,960,946 $5,960,946 $6,<strong>12</strong>1,892<br />
$505,416 $465,486 $465,486<br />
$8,310 $1,005 $1,005<br />
$11,454<br />
$525,180 $466,491 $466,491<br />
$334,295 $1,825,000 $1,542,675<br />
$334,295 $1,825,000 $1,542,675<br />
$65,203 $98,278 $98,278<br />
$65,203 $98,278 $98,278<br />
$3,894,170 $15,865,252 $21,750,000<br />
$3,894,170 $15,865,252 $21,750,000<br />
$1,174,353 $1,6<strong>12</strong>,989 $2,671,757<br />
$96,972<br />
$1,271,325 $1,6<strong>12</strong>,989 $2,671,757<br />
$3,618,044 $750,000 $750,000<br />
$<strong>12</strong>2,301 $87,670 $94,067<br />
$28,187<br />
$30<br />
$3,768,562 $837,670 $844,067<br />
$1,065,987 $896,<strong>12</strong>5 $969,<strong>12</strong>5<br />
$96,160 $71,900 $76,435<br />
$25,946 $<strong>12</strong>,300 $32,800<br />
$1,188,093 $980,325 $1,078,360<br />
511<br />
Return to TOC
Schedule Two by FUND<br />
Summary <strong>of</strong> Revenues<br />
Fund<br />
Description<br />
FY 2009 Actual<br />
FY 2010 Actual FY <strong>2011</strong> Estimate FY 20<strong>12</strong> Budget<br />
1885 - Parks & Recreation Designated<br />
Recreation Revenue $48,575<br />
Interest $4,056<br />
Fund Total - Parks & Recreation Desi $52,631<br />
2<strong>12</strong>0 - Airport Capital Grants<br />
Grants $448,009<br />
Interest<br />
Fund Total - Airport Capital Grants: $448,009<br />
TOTAL-SPECIAL REVENUE FUND GROUP $70,183,533<br />
$450 $600 $600<br />
$1,052 $547 $587<br />
$1,502 $1,147 $1,187<br />
$355,511 $17,448,481<br />
$2 $1 $0<br />
$355,513 $1 $17,448,481<br />
$71,462,896 $79,890,853 $111,740,086<br />
DEBT SERVICE FUND GROUP<br />
1900 - G.O. Bond Debt Service<br />
Property Tax $28,907,456<br />
Interest<br />
SRP In-Lieu $146,132<br />
Fund Total - G.O. Bond Debt Service: $29,053,588<br />
1940 - M.P.C. Debt Service<br />
Facility Rental Income<br />
Miscellaneous<br />
Interest $16,453<br />
Fund Total - M.P.C. Debt Service: $16,453<br />
TOTAL-DEBT SERVICE FUND GROUP $29,070,041<br />
$29,140,981 $24,022,147 $17,994,426<br />
$354,536 $675,310 $668,632<br />
$171,671 $150,000 $150,000<br />
$29,667,188 $24,847,457 $18,813,058<br />
$1,609,762 $1,056,678 $1,056,678<br />
$88,570<br />
$1<br />
$1,698,333 $1,056,678 $1,056,678<br />
$31,365,521 $25,904,135 $19,869,736<br />
CAPITAL FUND GROUP<br />
<strong>12</strong>70 - G.F. Revenue Oblgs<br />
Interest $24,773<br />
Fund Total - G.F. Revenue Oblgs: $24,773<br />
1380 - DIF-Library Blds<br />
Interest $49,672<br />
Fund Total - DIF-Library Blds: $49,672<br />
1400 - DIF-Library Book<br />
Development Impact Fees $42,840<br />
Interest $2,669<br />
Fund Total - DIF-Library Book: $45,509<br />
$187<br />
$187<br />
$11,170 $7,176 $8,056<br />
$11,170 $7,176 $8,056<br />
5<strong>12</strong><br />
Return to TOC
Schedule Two by FUND<br />
Summary <strong>of</strong> Revenues<br />
Fund<br />
Description<br />
FY 2009 Actual<br />
FY 2010 Actual FY <strong>2011</strong> Estimate FY 20<strong>12</strong> Budget<br />
1420 - DIF-Fire Protection Facilities<br />
Development Impact Fees $110,072<br />
Interest $25,567<br />
Fund Total - DIF-Fire Protection Faci $135,639<br />
1440 - DIF-Police Facilities<br />
Development Impact Fees $<strong>12</strong>8,273<br />
Interest $42,289<br />
Fund Total - DIF-Police Facilities: $170,562<br />
1460 - DIF-Citywide Parks<br />
Development Impact Fees $41,898<br />
Interest $2,429<br />
Fund Total - DIF-Citywide Parks: $44,327<br />
1480 - DIF-Citywide Recreation Fac<br />
Development Impact Fees $44,970<br />
Interest $30,489<br />
Fund Total - DIF-Citywide Recreation $75,459<br />
1500 - DIF-Libraries<br />
Development Impact Fees $23,634<br />
Interest $72,414<br />
Fund Total - DIF-Libraries: $96,048<br />
1520 - DIF-Citywide Open Spaces<br />
Development Impact Fees $102,267<br />
Interest $4,7<strong>12</strong><br />
Fund Total - DIF-Citywide Open Spac $106,979<br />
1540 - DIF-Parks Dev Zone 1<br />
Development Impact Fees $3,<strong>12</strong>3<br />
Interest $3,<strong>12</strong>2<br />
Fund Total - DIF-Parks Dev Zone 1: $6,245<br />
1560 - DIF-Parks Dev Zone 2<br />
Development Impact Fees $2,776<br />
Interest $4,003<br />
Fund Total - DIF-Parks Dev Zone 2: $6,779<br />
1580 - DIF-Parks Dev Zone 3<br />
Development Impact Fees $32,204<br />
Interest $633<br />
Fund Total - DIF-Parks Dev Zone 3: $32,837<br />
$100,735 $45,005 $20,909<br />
$2,981 $485 $0<br />
$103,716 $45,490 $20,909<br />
$92,096 $46,534 $46,534<br />
$10,332 $5,405 $5,708<br />
$102,428 $51,939 $52,242<br />
$25,590 $34,762 $34,762<br />
$9<strong>12</strong> $689 $932<br />
$26,502 $35,451 $35,694<br />
$27,642 $37,310 $37,310<br />
$9,186 $6,036 $6,613<br />
$36,828 $43,346 $43,923<br />
$40,690 $55,146 $55,146<br />
$21,623 $13,385 $14,230<br />
$62,313 $68,531 $69,376<br />
$63,334 $84,903 $84,903<br />
$1,879 $1,455 $1,547<br />
$65,213 $86,358 $86,450<br />
$9,022 $19,779 $19,779<br />
$528 $386 $436<br />
$9,550 $20,165 $20,215<br />
$9,726 $9,485 $9,485<br />
$1,003 $684 $496<br />
$10,729 $10,169 $9,981<br />
$4,858 $1,851 $1,851<br />
$319 $216 $131<br />
$5,177 $2,067 $1,982<br />
513<br />
Return to TOC
Schedule Two by FUND<br />
Summary <strong>of</strong> Revenues<br />
Fund<br />
Description<br />
FY 2009 Actual<br />
FY 2010 Actual FY <strong>2011</strong> Estimate FY 20<strong>12</strong> Budget<br />
1600 - DIF-Roadway Improvements<br />
Development Impact Fees $725,298<br />
Interest $<strong>12</strong>1,621<br />
Fund Total - DIF-Roadway Improvem $846,919<br />
1620 - DIF-General Government<br />
Development Impact Fees $239,745<br />
Interest $27,920<br />
Fund Total - DIF-General Governmen $267,665<br />
1980 - Streets Constr. - 1999 Auth<br />
Interest $182,488<br />
Miscellaneous<br />
Fund Total - Streets Constr. - 1999 Au $182,488<br />
2000 - Hurf Street Bonds<br />
Interest $39,080<br />
Miscellaneous<br />
Fund Total - Hurf Street Bonds: $39,080<br />
2040 - Public Safety Construction<br />
Interest $108,841<br />
Bond Proceeds<br />
Miscellaneous<br />
Fund Total - Public Safety Constructi $108,841<br />
2060 - Parks Construction<br />
Interest $31,989<br />
Bond Proceeds<br />
Miscellaneous<br />
Fund Total - Parks Construction: $31,989<br />
2080 - Gov't Facilities - 1999 Auth<br />
Interest ($654)<br />
Bond Proceeds<br />
Miscellaneous<br />
Fund Total - Gov't Facilities - 1999 Au ($654)<br />
2100 - Economic Dev. Constr-1999 Auth<br />
Interest<br />
Bond Proceeds<br />
Miscellaneous<br />
Fund Total - Economic Dev. Constr-1<br />
$494,038 $272,699 $272,699<br />
$28,991 $14,653 $11,641<br />
$523,029 $287,352 $284,340<br />
$225,557 $94,320 $94,320<br />
($688) $0 $70<br />
$224,869 $94,320 $94,390<br />
$31,851 $5,940 $2,435<br />
$77,898<br />
$109,749 $5,940 $2,435<br />
$4,210 $1,426 $1,038<br />
$105,574<br />
$109,784 $1,426 $1,038<br />
($14,059) $24,683 $6,094<br />
$<strong>12</strong>,302,816<br />
$8,879<br />
$<strong>12</strong>,297,636 $24,683 $6,094<br />
($5,392) $<strong>12</strong>,<strong>12</strong>0 $1,775<br />
$8,967,053<br />
$3,339<br />
$8,965,000 $<strong>12</strong>,<strong>12</strong>0 $1,775<br />
($531) $1,199 $1,100<br />
$4,526,035<br />
$1,716<br />
$4,527,220 $1,199 $1,100<br />
($4,429) $9,471 $5,296<br />
$1,785,408<br />
$13,208<br />
$1,794,187 $9,471 $5,296<br />
514<br />
Return to TOC
Schedule Two by FUND<br />
Summary <strong>of</strong> Revenues<br />
Fund<br />
Description<br />
FY 2009 Actual<br />
FY 2010 Actual FY <strong>2011</strong> Estimate FY 20<strong>12</strong> Budget<br />
2140 - Open Space/Trails Constr-99 Au<br />
Interest ($481)<br />
Fund Total - Open Space/Trails Const ($481)<br />
2180 - Flood Control Construction<br />
Interest $206,881<br />
Bond Proceeds<br />
Miscellaneous $2,392,322<br />
Fund Total - Flood Control Construct $2,599,203<br />
2210 - Transportation Capital Project<br />
Bond Proceeds<br />
Interest $1,344,938<br />
Miscellaneous<br />
Fund Total - Transportation Capital $1,344,938<br />
2536 - Training Facility Capital Proj<br />
Partner Revenue $350,151<br />
Fund Total - Training Facility Capital $350,151<br />
TOTAL-CAPITAL FUND GROUP $6,564,968<br />
$799<br />
$799<br />
$540 $68,707 $32,625<br />
$14,078,222<br />
$7,523,801<br />
$21,602,563 $68,707 $32,625<br />
$13,000,000<br />
$45,203 $10,000 $15,000<br />
$2,065<br />
$47,268 $10,000 $13,015,000<br />
$262,614<br />
$262,614<br />
$50,898,531 $885,910 $13,792,921<br />
TRUST FUND GROUP<br />
2280 - Cemetery Perpetual Care<br />
Interest $<strong>12</strong>1,772<br />
Fund Total - Cemetery Perpetual Car $<strong>12</strong>1,772<br />
TOTAL-TRUST FUND GROUP $<strong>12</strong>1,772<br />
$35,829 $20,707 $22,217<br />
$35,829 $20,707 $22,217<br />
$35,829 $20,707 $22,217<br />
ENTERPRISE FUND GROUP<br />
2360 - Water and Sewer<br />
Water Revenues $37,846,238<br />
Sewer Revenue $26,384,046<br />
Miscellaneous $1,329,371<br />
Water Development Impact Fees $1,233,930<br />
Sewer Development Impact Fees $398,283<br />
Staff & Adm Chargebacks $176,000<br />
City Property Rental $93,738<br />
Interest $1,874,000<br />
Bond Proceeds<br />
Loan Proceeds<br />
$42,393,9<strong>12</strong> $46,983,270 $46,740,078<br />
$28,662,682 $31,038,331 $31,006,477<br />
$4,106,249 $399,737 $623,035<br />
$708,368 $500,000 $500,000<br />
$231,582 $200,000 $200,000<br />
$168,000 $168,000 $168,000<br />
$83,542 $60,240 $60,240<br />
$409,810 $150,000 $25,000<br />
$25,000,000 $0<br />
$3,231,900<br />
515<br />
Return to TOC
Schedule Two by FUND<br />
Summary <strong>of</strong> Revenues<br />
Fund<br />
Description<br />
FY 2009 Actual<br />
FY 2010 Actual FY <strong>2011</strong> Estimate FY 20<strong>12</strong> Budget<br />
Facility Rental Income<br />
Grants<br />
Fund Total - Water and Sewer: $69,335,606<br />
2440 - Landfill<br />
Tipping Fees $3,316,166<br />
Internal Charges $2,305,179<br />
Recycling Sales $1,590,580<br />
Staff & Adm Chargebacks $316,758<br />
Loan Proceeds<br />
Miscellaneous $166,789<br />
Interest $565,481<br />
Development Impact Fees $18,348<br />
Fund Total - Landfill: $8,279,301<br />
2480 - Sanitation<br />
Residential Sanitiation $10,254,367<br />
Commercial Sanitation Frontload $3,684,277<br />
Commercial Sanitation Roll<strong>of</strong>f $658,226<br />
Internal Charges $196,383<br />
Miscellaneous $204,160<br />
Staff & Adm Chargebacks $47,357<br />
Miscellaneous Bin Service $79,652<br />
Interest $94,058<br />
Outside City Commercial $184,955<br />
Sanitation Development Impact Fe $3,276<br />
Lease Proceeds<br />
Recycling Sales $2,472<br />
Fund Total - Sanitation: $15,409,183<br />
2500 - Pub Housing Budget Activities<br />
Grants $9,425,466<br />
Miscellaneous $2,041,863<br />
Fund Total - Pub Housing Budget Act $11,467,329<br />
TOTAL-ENTERPRISE FUND GROUP $104,491,419<br />
$5,891<br />
$500<br />
$80,002,436 $104,499,578 $79,322,830<br />
$2,758,555 $3,034,610 $3,034,610<br />
$2,191,865 $2,502,000 $2,502,000<br />
$1,915,090 $1,900,000 $1,820,000<br />
$327,000 $327,000 $327,000<br />
$249,877 $250,000 $250,000<br />
$<strong>12</strong>2,456 $172,000 $172,000<br />
$157,210 $<strong>12</strong>0,000 $<strong>12</strong>0,000<br />
$18,866 $27,000 $27,000<br />
$7,740,919 $8,332,610 $8,252,610<br />
$10,299,381 $10,5<strong>12</strong>,000 $10,5<strong>12</strong>,000<br />
$3,561,214 $3,500,000 $3,500,000<br />
$667,608 $600,000 $600,000<br />
$158,495 $180,000 $180,000<br />
$216,406 $<strong>12</strong>2,000 $<strong>12</strong>2,000<br />
$47,382 $47,357 $47,382<br />
$105,066 $40,000 $40,000<br />
$<strong>12</strong>,687 $71,362 $35,000<br />
$17,423 $28,000 $28,000<br />
$3,864 $3,700 $3,700<br />
$1,189,365<br />
$16,278,891 $15,104,419 $15,068,082<br />
$9,679,037 $9,008,162 $9,143,284<br />
$4,869,760 $4,100,000 $4,100,000<br />
$14,548,797 $13,108,162 $13,243,284<br />
$118,571,043 $141,044,769 $115,886,806<br />
INTERNAL SERVICE FUND GROUP<br />
2540 - Risk Management Self Insurance<br />
Internal Charges $2,828,000<br />
Security Revenue $17,491<br />
Interest $152,481<br />
$2,488,937 $2,499,892 $2,500,000<br />
$28,483 $24,266 $26,375<br />
$47,020 $15,943 $17,106<br />
516<br />
Return to TOC
Schedule Two by FUND<br />
Summary <strong>of</strong> Revenues<br />
Fund<br />
Description<br />
FY 2009 Actual<br />
FY 2010 Actual FY <strong>2011</strong> Estimate FY 20<strong>12</strong> Budget<br />
Fund Total - Risk Management Self I $2,997,972<br />
2560 - Workers Comp. Self Insurance<br />
Internal Charges $992,638<br />
Security Revenue $17,491<br />
Interest $65,073<br />
Fund Total - Workers Comp. Self Ins $1,075,202<br />
2580 - Benefits Trust Fund<br />
City Contributions $11,431,341<br />
Employee Contributions $5,245,169<br />
Retiree Contributions $2,928,023<br />
Interest $152,491<br />
Miscellaneous $24,885<br />
Internal Charges<br />
Right-<strong>of</strong>-Way Permits<br />
Fund Total - Benefits Trust Fund: $19,781,909<br />
TOTAL-INTERNAL SERVICE FUND GROUP $23,855,083<br />
$2,564,440 $2,540,101 $2,543,481<br />
$984,460 $984,460<br />
$28,482 $24,266 $26,375<br />
$15,537 $6,580 $7,060<br />
$44,019 $1,015,306 $1,017,895<br />
$14,273,336 $14,102,505 $14,166,532<br />
$5,102,408 $4,366,620 $4,291,971<br />
$3,269,747 $3,411,159 $3,419,695<br />
$32,425 $16,392 $17,588<br />
$247,557<br />
$108,589<br />
$938<br />
$23,035,000 $21,896,676 $21,895,786<br />
$25,643,459 $25,452,083 $25,457,162<br />
TOTAL - ALL REVENUE : $410,674,199<br />
$466,097,759 $442,811,727 $452,049,227<br />
517<br />
Return to TOC
Program Name<br />
GENERAL FUND GROUP<br />
1000 - GENERAL<br />
Schedule Three<br />
Operating Budget by Program and Fund<br />
FY 2010<br />
Actual<br />
FY <strong>2011</strong><br />
Budget<br />
FY <strong>2011</strong><br />
Estimate<br />
FY 20<strong>12</strong><br />
Budget<br />
CITY ATTORNEY GROUP<br />
City Attorney<br />
10610 City Attorney $2,321,104 $2,339,684 $2,458,342 $2,353,306<br />
10615 Outside Legal Fees $500,000 $500,000 $500,000<br />
10620 Attorney-Spec Proj Fees/Costs $3,527,908<br />
Dept. Total - City Attorney $5,849,0<strong>12</strong> $2,839,684 $2,958,342 $2,853,306<br />
CITY CLERK GROUP<br />
City Clerk<br />
10210 City Clerk $379,779 $397,551 $397,551 $372,249<br />
10220 Records Management $143,981 $140,727 $140,727 $134,634<br />
10240 Elections $1,499 $137,723 $55,108 $111,556<br />
Dept. Total - City Clerk $525,259 $676,001 $593,386 $618,439<br />
CITY COURT GROUP<br />
City Court<br />
10410 City Court $3,868,393 $3,578,010<br />
$3,578,010 $3,387,792<br />
CITY MANAGER GROUP<br />
Admin Svcs Admin.<br />
1<strong>12</strong>10 Administration Services Admin. $443,943 $435,786<br />
City Manager<br />
10310 City Manager $1,072,710 $959,252<br />
Group Total - CITY MANAGER: $1,516,653 $1,395,038<br />
$349,858 $152,316<br />
$959,252 $895,<strong>12</strong>4<br />
$1,309,110 $1,047,440<br />
COMMUNICATIONS GROUP<br />
Conv./Media/Parking<br />
10890 Convention/Media/Parking $221,114 $316,256 $316,256 $274,515<br />
10891 Media Center Operations $143,026 $149,346 $149,346 $142,988<br />
Dept. Total - Conv./Media/Parking $364,140 $465,602 $465,602 $417,503<br />
Marketing and Comm.<br />
10810 Marketing $1,053,346 $934,636 $987,264 $853,849<br />
10820 Tourism $420,205 $335,747 $283,119 $215,385<br />
10830 Special Events Prod. Support $40,481<br />
$0<br />
$0<br />
14110 City-Wide Special Events $310,474 $304,676 $304,676 $277,840<br />
14115 Audio/Visual $208,8<strong>12</strong> $211,414 $188,922<br />
14<strong>12</strong>0 Cable Communications $716,250 $707,169 $707,169 $666,655<br />
Dept. Total - Marketing and Comm. $2,540,756 $2,491,040 $2,493,642 $2,202,651<br />
Group Total - COMMUNICATIONS: $2,904,896 $2,956,642<br />
$2,959,244 $2,620,154<br />
518<br />
Return to TOC
Schedule Three<br />
Operating Budget by Program and Fund<br />
Program Name<br />
FY 2010<br />
Actual<br />
FY <strong>2011</strong><br />
Budget<br />
FY <strong>2011</strong><br />
Estimate<br />
FY 20<strong>12</strong><br />
Budget<br />
COMPLIANCE&ASSET MGT GROUP<br />
Compliance & Asset Mgt<br />
10710 City Auditor $280,047 $254,348 $254,348 $265,196<br />
11360 Materials Management $603,384 $388,224 $388,224 $163,<strong>12</strong>6<br />
11370 Materials Control Warehouse $358,043 $295,037 $295,037 $279,552<br />
Dept. Total - Compliance & Asset Mgt $1,241,474 $937,609 $937,609 $707,874<br />
DEVELOPMENT SVCS GROUP<br />
Building Safety<br />
15610 Building Safety $2,665,919 $1,980,628 $1,979,628 $1,895,038<br />
15620 Development Services Center $568,993 $444,676 $444,676 $425,102<br />
Dept. Total - Building Safety $3,234,9<strong>12</strong> $2,425,304 $2,424,304 $2,320,140<br />
Code Compliance<br />
14410 Code Compliance $1,468,073 $1,368,354<br />
Community Dev Admin<br />
15510 CD Deputy City Manager $164,257 $195,964<br />
$1,368,354 $1,295,976<br />
$195,964 $186,405<br />
Planning<br />
15910 Planning Administration $350,565 $341,167 $340,167 $323,524<br />
15930 Current Planning $543,780 $5<strong>12</strong>,837 $5<strong>12</strong>,837 $323,844<br />
15940 Long-Range Planning & Research $383,846 $135,149 $135,149 $<strong>12</strong>6,988<br />
Dept. Total - Planning $1,278,191 $989,153 $988,153 $774,356<br />
Group Total - DEVELOPMENT SVCS: $6,145,433 $4,978,775<br />
$4,976,775 $4,576,877<br />
ECONOMIC DEVELOPMENT GROUP<br />
Economic Development<br />
16010 Economic Development $741,568 $630,068 $711,613 $626,736<br />
16025 Business Development $500,000 $3,000,000 $500,000<br />
16040 Downtown Beaut. & Promotion $239,693 $266,453 $266,453 $242,095<br />
Dept. Total - Economic Development $981,261 $1,396,521 $3,978,066 $1,368,831<br />
Rebates & Incentives<br />
16210 Rebates & Incentives $475,555 $320,000 $50,000 $100,000<br />
16230 Redevelopment Land Acquisition $23,000 $85,416 $2,871<br />
Dept. Total - Rebates & Incentives $498,555 $405,416 $52,871 $100,000<br />
Group Total - ECONOMIC DEVELOPMENT: $1,479,816 $1,801,937<br />
$4,030,937 $1,468,831<br />
FAC & FIN MGMT GROUP<br />
Fac & Fin Mgmt<br />
1<strong>12</strong>20 Facilities & Financial Mgmt $221,567<br />
FINANCIAL SVCS GROUP<br />
Finance<br />
11310 Finance Administration $497,667 $394,610<br />
11320 Accounting Services $865,271 $9<strong>12</strong>,836<br />
11330 L.I.D. Administration $9,000<br />
$498,438 $531,275<br />
$9<strong>12</strong>,836 $848,492<br />
$9,000<br />
519<br />
Return to TOC
Program Name<br />
Schedule Three<br />
Operating Budget by Program and Fund<br />
FY 2010<br />
Actual<br />
FY <strong>2011</strong><br />
Budget<br />
FY <strong>2011</strong><br />
Estimate<br />
FY 20<strong>12</strong><br />
Budget<br />
11340 License/Collection $869,194 $805,900 $805,900 $665,368<br />
Dept. Total - Finance $2,232,132 $2,<strong>12</strong>2,346 $2,226,174 $2,045,135<br />
Lease Pmts/OtherFees<br />
11380 Lease Payments $1,717,724 $4,236,574 $4,236,574 $403,075<br />
11390 Merchant Fees $259,910 $160,000 $160,000 $199,687<br />
89800 1000 Advisor Fees $85,568 $<strong>12</strong>9,687 $<strong>12</strong>9,687 $90,000<br />
Dept. Total - Lease Pmts/OtherFees $2,063,202 $4,526,261 $4,526,261 $692,762<br />
Management & Budget<br />
11610 Budget & Research $636,466 $646,768 $646,768 $622,329<br />
11620 Grants Administration $142,038 $65,164 $65,164 $58,653<br />
Dept. Total - Management & Budget $778,504 $711,932 $711,932 $680,982<br />
Group Total - FINANCIAL SVCS: $5,073,838 $7,360,539<br />
$7,464,367 $3,418,879<br />
FIRE SERVICES GROUP<br />
Fire Department<br />
<strong>12</strong>410 Fire Administration $1,796,215 $1,637,270 $1,637,270 $1,605,998<br />
<strong>12</strong>421 Fire Special Operations $25,313 $16,293 $16,293 $16,293<br />
<strong>12</strong>422 Fire Operations $17,937,365 $17,3<strong>12</strong>,530 $17,3<strong>12</strong>,530 $17,785,340<br />
<strong>12</strong>433 Fire Resource Management $2,395,316 $1,937,224 $1,865,224 $2,070,956<br />
<strong>12</strong>434 Fire Training $22,679 $13,656 $13,656 $13,656<br />
<strong>12</strong>436 Fire Medical Services & Health $44,166 $56,983 $56,983 $48,983<br />
<strong>12</strong>441 Fire Marshal's Office $866,913 $824,255 $824,255 $8<strong>12</strong>,173<br />
<strong>12</strong>444 Fire Community Services $10,910 $19,250 $19,250 $15,250<br />
<strong>12</strong>491 Ambulance Services $476,109 $492,393 $492,393 $484,004<br />
<strong>12</strong>492 Air-Med & Logistics Ops (HALO) $745,827 $751,491 $751,491 $736,989<br />
<strong>12</strong>521 PS Training Ctr - Fire $619,583 $577,227 $577,227 $567,227<br />
Dept. Total - Fire Department $24,940,396 $23,638,572 $23,566,572 $24,156,869<br />
HR & RISK MGT GROUP<br />
Human Resources<br />
11010 Risk Management/Safety $569,743 $202,525 $202,525 $<strong>12</strong>1,547<br />
11020 Benefits $157,462 $119,411 $119,411 $144,941<br />
11030 Human Resources Administration $669,751 $631,007 $630,007 $563,541<br />
11040 Employment Services $364,411 $254,417 $254,417 $315,455<br />
11050 Employee Relations $187,638 $176,717 $176,717 $166,386<br />
11060 Compensation $458,703 $459,828 $459,828 $374,781<br />
11070 Organizational Development $317,580 $68,291 $68,291 $259,189<br />
Dept. Total - Human Resources $2,725,288 $1,9<strong>12</strong>,196 $1,911,196 $1,945,840<br />
INTERGOVT. PROGRAMS GROUP<br />
Intergovt. Programs<br />
10910 Intergovernmental Programs $710,731 $721,549<br />
$721,549 $686,721<br />
LEISURE & CULTURAL GROUP<br />
Library & Arts<br />
15220 Library $7,135,861 $6,044,1<strong>12</strong><br />
15230 Arts Maintenance - Admin. $<strong>12</strong>1,832 $31,763<br />
520<br />
Return to TOC<br />
$6,044,1<strong>12</strong> $5,655,581<br />
$31,763 $30,302
Schedule Three<br />
Operating Budget by Program and Fund<br />
Program Name<br />
FY 2010<br />
Actual<br />
FY <strong>2011</strong><br />
Budget<br />
FY <strong>2011</strong><br />
Estimate<br />
FY 20<strong>12</strong><br />
Budget<br />
Dept. Total - Library & Arts $7,257,693 $6,075,875 $6,075,875 $5,685,883<br />
Parks & Recreation<br />
13010 Pool Maintenance $257,481 $196,824 $196,824 $187,553<br />
13020 Park Irrigation $281,613 $252,116 $252,116 $242,779<br />
13030 Parks CIP & Planning $298,995 $180,341 $180,341 $174,510<br />
13040 Parks Maintenance $3,725,971 $3,254,902 $3,326,902 $3,208,114<br />
14610 Parks & Recreation Admin. $243,139 $240,308 $240,308 $139,186<br />
14620 Glendale Community Center $174,166 $136,070 $136,070 $<strong>12</strong>9,873<br />
14630 Recreation Support Services $933,309 $840,636 $838,034 $793,<strong>12</strong>2<br />
14640 Adult Center $373,567 $485,907 $485,907 $484,688<br />
14650 Youth and Teen $418,610 $5<strong>12</strong>,548 $5<strong>12</strong>,548 $530,707<br />
14660 Special Events and Programs $184,745 $94,157 $94,157 $86,276<br />
14670 Sports and Health $316,697 $403,116 $403,116 $392,850<br />
14680 Aquatics $373,503 $221,959 $221,959 $218,251<br />
14690 Audio/Visual $211,025<br />
14700 Marketing - Parks & Rec $175,387 $146,670 $146,670 $139,706<br />
14710 Park Rangers $260,145 $265,687 $265,687 $259,807<br />
14720 Foothills Recreation Center $1,429,426 $1,562,987 $1,562,987 $1,426,274<br />
14740 Copper Canyon HS Youth Dev Prg $942<br />
14760 Historic Sahuaro Ranch $315,483 $242,300 $242,300 $231,<strong>12</strong>6<br />
Dept. Total - Parks & Recreation $9,974,204 $9,036,528 $9,105,926 $8,644,822<br />
Group Total - LEISURE & CULTURAL: $17,231,897 $15,1<strong>12</strong>,403<br />
$15,181,801 $14,330,705<br />
MAYOR & COUNCIL GROUP<br />
Council Office<br />
10110 Council Office $511,669 $445,694 $445,694 $489,998<br />
10<strong>12</strong>0 Cholla District $65,160 $74,685 $59,656 $104,581<br />
10130 Barrel District $72,452 $69,187 $54,162 $99,446<br />
10140 Sahuaro District $76,257 $76,829 $56,923 $99,264<br />
10150 Cactus District $74,501 $94,377 $79,693 $99,213<br />
10160 Yucca District $80,694 $69,352 $55,337 $99,258<br />
10170 Ocotillo District $66,586 $92,131 $75,988 $99,223<br />
Dept. Total - Council Office $947,319 $922,255 $827,453 $1,090,983<br />
Mayor<br />
10010 Office <strong>of</strong> the Mayor $339,466 $334,216<br />
Group Total - MAYOR & COUNCIL: $1,286,785 $1,256,471<br />
N'HOOD & HUMAN SVCS GROUP<br />
Comm. Action Program<br />
14420 CAP Local Match $<strong>12</strong>1,797 $<strong>12</strong>9,280<br />
$334,216 $333,342<br />
$1,161,669 $1,424,325<br />
$<strong>12</strong>9,280 $<strong>12</strong>9,859<br />
Comm. Partnerships<br />
15010 Community Revitalization $403,342 $334,195 $334,195 $507,275<br />
15015 Neighborhood Partnership $494,445 $364,615 $364,615 $455,321<br />
Dept. Total - Comm. Partnerships $897,787 $698,810 $698,810 $962,596<br />
Comm. Services Adm<br />
14510 Comm. Services Admin. $308,017 $190,714<br />
$190,714<br />
521<br />
Return to TOC
Schedule Three<br />
Operating Budget by Program and Fund<br />
Program Name<br />
FY 2010<br />
Actual<br />
FY <strong>2011</strong><br />
Budget<br />
FY <strong>2011</strong><br />
Estimate<br />
FY 20<strong>12</strong><br />
Budget<br />
Neighborhood Imp Gr<br />
15<strong>12</strong>0 Neighborhood Improvement Grant $267,700<br />
Group Total - N'HOOD & HUMAN SVCS: $1,595,301 $1,018,804<br />
NON-DEPARTMENTAL GROUP<br />
Non-Departmental<br />
11801 Fund 1000 Non-Dept $558,487 $1,963,824<br />
$1,018,804 $1,092,455<br />
-$339,641 $765,358<br />
POLICE SERVICES GROUP<br />
Homeland Security<br />
<strong>12</strong>810 Homeland Security Admin. $<strong>12</strong>0,573<br />
<strong>12</strong>820 Emergency Operations Ctr (EOC) $661,429<br />
Dept. Total - Homeland Security $782,002<br />
Police Department<br />
<strong>12</strong>110 Police Legal Services $206,738 $145,530 $26,872 $4,467<br />
<strong>12</strong><strong>12</strong>0 Police Administration $2,800,306 $2,838,805 $2,838,805 $2,377,837<br />
<strong>12</strong>130 Central Patrol Bureau $10,566,204 $10,515,737 $10,515,737 $10,7<strong>12</strong>,033<br />
<strong>12</strong>150 Crime Investigations $8,205,705 $8,267,040 $8,267,040 $8,487,109<br />
<strong>12</strong>160 Police Personnel Management $2,619,168 $2,359,090 $2,359,090 $2,232,275<br />
<strong>12</strong>170 Foothills Patrol Bureau $10,022,820 $9,724,831 $9,724,831 $10,480,476<br />
<strong>12</strong>180 Police Support Services $1,869,290 $1,335,<strong>12</strong>1 $1,335,<strong>12</strong>1 $1,330,181<br />
<strong>12</strong>210 PD - Fiscal Management $1,386,464 $2,568,104 $2,568,104 $2,839,755<br />
<strong>12</strong>215 PD - Tow Administration $103,795 $61,063 $61,063 $44,<strong>12</strong>8<br />
<strong>12</strong>220 PD - Detention $2,064,559 $1,339,259 $1,339,259 $1,097,144<br />
<strong>12</strong>230 PD - Communications $2,483,382 $2,364,899 $2,364,899 $2,255,017<br />
<strong>12</strong>232 PS Training Ctr - Police $619,583 $577,227 $577,227 $577,227<br />
<strong>12</strong>233 PD - Special Operations $4,770,310 $4,241,005 $4,241,005 $4,460,707<br />
<strong>12</strong>235 PD - Emergency Management $798,161 $798,161 $737,610<br />
Dept. Total - Police Department $47,718,324 $47,135,872 $47,017,214 $47,635,966<br />
Group Total - POLICE SERVICES: $48,500,326<br />
PUBLIC WORKS GROUP<br />
Engineering<br />
13710 B<strong>of</strong>A Bank Building $305,358 $256,579 $256,579 $256,579<br />
13715 Promenade at Palmaire $57,781 $56,400 $56,400 $56,400<br />
13720 Engineering Administration $601,494 $553,251 $552,251 $584,296<br />
13730 CIP Administration $607,589 $274,490 $274,490 $229,987<br />
13770 Mapping and Records $181,003 $101,869 $101,869 $96,327<br />
13780 Land Development Division $468,433 $483,917 $483,917 $306,881<br />
13790 Construction Inspection $552,304 $382,291 $382,291 $4<strong>12</strong>,707<br />
13800 Materials Testing $190,789 $181,996 $181,996 $225,901<br />
13820 Utility Inspection $222,986 $142,281 $142,281 $13,622<br />
Dept. Total - Engineering $3,187,737 $2,433,074 $2,432,074 $2,182,700<br />
Field Operations<br />
13410 Field Operations Admin. $1,030,030 $627,170<br />
13420 Cemetery $207,580 $233,250<br />
13430 Manistee Ranch Maintenance $4,908 $5,113<br />
$627,170 $610,971<br />
$233,250 $221,401<br />
$5,113 $5,113<br />
522<br />
Return to TOC
Program Name<br />
Schedule Three<br />
Operating Budget by Program and Fund<br />
FY 2010<br />
Actual<br />
FY <strong>2011</strong><br />
Budget<br />
FY <strong>2011</strong><br />
Estimate<br />
FY 20<strong>12</strong><br />
Budget<br />
13440 Graffiti Removal $236,002 $292,797 $292,797 $234,496<br />
13450 Facilities Management $4,538,627 $3,361,963 $3,361,963 $3,774,973<br />
13460 Custodial Services $1,130,293 $1,043,615 $1,043,615 $890,900<br />
13461 Downtown Parking Garage $80,639 $102,859 $102,859 $82,859<br />
Dept. Total - Field Operations $7,228,079 $5,666,767 $5,666,767 $5,820,713<br />
Public Works Admin.<br />
13310 Public Works Administration $198,962 $198,<strong>12</strong>5<br />
Group Total - PUBLIC WORKS: $10,614,778 $8,297,966<br />
TECH. & INNOVATION GROUP<br />
Info. Technology<br />
11510 Information Technology $3,520,751 $3,048,826<br />
$198,<strong>12</strong>5<br />
$8,296,966 $8,003,413<br />
$3,048,826 $2,757,188<br />
WATER SERVICES GROUP<br />
Env. Resources<br />
<strong>12</strong>910 H<strong>az</strong>Mat Incidence Response $<strong>12</strong>,581 $26,845<br />
$26,845 $26,845<br />
Fund Total - GENERAL: $140,523,662 $130,657,563<br />
$130,419,581 $<strong>12</strong>3,525,277<br />
1010 - NATIONAL EVENTS<br />
TRANSPORTATION SVCS GROUP<br />
Transportation<br />
16365 Transp - Stadium Mgmt Plan $21,320<br />
Fund Total - NATIONAL EVENTS: $21,320<br />
1040 - GENERAL SERVICES<br />
PUBLIC WORKS GROUP<br />
Field Operations<br />
13510 Equipment Management $3,8<strong>12</strong>,363 $3,959,223 $3,993,158 $3,810,623<br />
13520 Fuel Services $2,740,215 $3,303,176 $3,269,241 $3,303,029<br />
13530 Parts Store Operations $1,375,625 $1,818,371 $1,818,371 $1,820,397<br />
Dept. Total - Field Operations $7,928,203 $9,080,770 $9,080,770 $8,934,049<br />
Fund Total - GENERAL SERVICES: $7,928,203 $9,080,770<br />
1100 - TELEPHONE SERVICES<br />
TECH. & INNOVATION GROUP<br />
Info. Technology<br />
11520 Telephones $1,278,946 $977,252<br />
$9,080,770 $8,934,049<br />
$977,252 $979,324<br />
Fund Total - TELEPHONE SERVICES: $1,278,946 $977,252<br />
$977,252 $979,324<br />
523<br />
Return to TOC
Schedule Three<br />
Operating Budget by Program and Fund<br />
Program Name<br />
1<strong>12</strong>0 - VEHICLE REPLACEMENT<br />
FY 2010<br />
Actual<br />
FY <strong>2011</strong><br />
Budget<br />
PUBLIC WORKS GROUP<br />
Field Operations<br />
13610 Equipment Replacement $1,762,518 $3,029,741<br />
FY <strong>2011</strong><br />
Estimate<br />
FY 20<strong>12</strong><br />
Budget<br />
$2,959,741 $3,029,742<br />
Fund Total - VEHICLE REPLACEMENT: $1,762,518 $3,029,741<br />
1140 - PC REPLACEMENT<br />
TECH. & INNOVATION GROUP<br />
Info. Technology<br />
11530 Technology Replacement $1,365,233 $3,510,103<br />
$2,959,741 $3,029,742<br />
$2,208,764 $3,511,584<br />
Fund Total - PC REPLACEMENT: $1,365,233 $3,510,103<br />
$2,208,764 $3,511,584<br />
1190 - EMPLOYEE GROUPS<br />
HR & RISK MGT GROUP<br />
Employee Groups<br />
11110 GEMS $29,091<br />
11<strong>12</strong>0 Diversity Committee $48,957 $54,909 $40,559 $54,000<br />
11130 Glendale Hispanic Network $167<br />
$14,350<br />
11140 Holiday Event $30,000<br />
$30,000<br />
Dept. Total - Employee Groups $78,215 $84,909 $54,909 $84,000<br />
Fund Total - EMPLOYEE GROUPS: $78,215 $84,909<br />
<strong>12</strong>20 - ARTS COMMISSION FUND<br />
LEISURE & CULTURAL GROUP<br />
Library & Arts<br />
15310 Arts Maintenance $40,518 $<strong>12</strong>7,787<br />
$54,909 $84,000<br />
$<strong>12</strong>7,787 $<strong>12</strong>7,787<br />
Fund Total - ARTS COMMISSION FUND: $40,518 $<strong>12</strong>7,787<br />
$<strong>12</strong>7,787 $<strong>12</strong>7,787<br />
<strong>12</strong>40 - COURT SECURITY/BONDS<br />
CITY COURT GROUP<br />
City Court<br />
10510 Court Security $267,285 $393,300 $278,500 $398,469<br />
10520 Court Time Payments $23,659 $<strong>12</strong>7,394 $93,765 $<strong>12</strong>8,391<br />
10530 Fill the Gap $58,840 $57,000 $9,000 $57,000<br />
Dept. Total - City Court $349,784 $577,694 $381,265 $583,860<br />
Fund Total - COURT SECURITY/BONDS: $349,784 $577,694<br />
$381,265 $583,860<br />
524<br />
Return to TOC
Program Name<br />
<strong>12</strong>60 - LIBRARY<br />
Schedule Three<br />
Operating Budget by Program and Fund<br />
FY 2010<br />
Actual<br />
FY <strong>2011</strong><br />
Budget<br />
FY <strong>2011</strong><br />
Estimate<br />
FY 20<strong>12</strong><br />
Budget<br />
LEISURE & CULTURAL GROUP<br />
Library & Arts<br />
15410 Library Book Fund $44,645 $142,223 $142,223 $142,223<br />
15420 Library Special Revenue $<strong>12</strong>8,726 $105,150 $105,150 $105,150<br />
Dept. Total - Library & Arts $173,371 $247,373 $247,373 $247,373<br />
Fund Total - LIBRARY: $173,371 $247,373<br />
$247,373 $247,373<br />
<strong>12</strong>80 - YOUTH SPORTS COMPLEX<br />
ECONOMIC DEVELOPMENT GROUP<br />
Economic Development<br />
16110 YSC - Econ. Dev. $20,898<br />
LEISURE & CULTURAL GROUP<br />
Parks & Recreation<br />
13290 YSC - Parks & Rec $246,571 $262,000<br />
$262,000 $262,000<br />
PUBLIC WORKS GROUP<br />
Field Operations<br />
13470 YSC - Facilities Mgt. $52,485 $65,000<br />
$65,000 $60,000<br />
Fund Total - YOUTH SPORTS COMPLEX: $319,954 $327,000<br />
<strong>12</strong>81 - STADIUM EVENT OPERATIONS<br />
COMMUNICATIONS GROUP<br />
Marketing and Comm.<br />
10840 Mkt'g - Stadium Events $166,668 $106,500<br />
$327,000 $322,000<br />
$106,500 $106,500<br />
FIRE SERVICES GROUP<br />
Fire Department<br />
<strong>12</strong>515 Fire - Fiesta Bowl Event $52,991 $159,942 $138,872 $159,942<br />
<strong>12</strong>520 Stadium - Fire Event Staffing $246,992 $229,886 $229,886 $229,886<br />
Dept. Total - Fire Department $299,983 $389,828 $368,758 $389,828<br />
POLICE SERVICES GROUP<br />
Police Department<br />
<strong>12</strong>231 Stadium - PD Event Staffing $1,501,860 $1,341,354 $1,341,354 $1,343,947<br />
<strong>12</strong>234 PD - Fiesta Bowl Event $268,<strong>12</strong>5 $401,268 $401,268 $401,268<br />
Dept. Total - Police Department $1,769,985 $1,742,622 $1,742,622 $1,745,215<br />
525<br />
Return to TOC
Schedule Three<br />
Operating Budget by Program and Fund<br />
Program Name<br />
FY 2010<br />
Actual<br />
FY <strong>2011</strong><br />
Budget<br />
FY <strong>2011</strong><br />
Estimate<br />
FY 20<strong>12</strong><br />
Budget<br />
TRANSPORTATION SVCS GROUP<br />
Transportation<br />
16840 Stadium - Transportation Ops. $643,436 $645,734 $645,734 $645,734<br />
16845 Transp - Fiesta Bowl Event $78,983 $79,942 $79,942 $79,942<br />
Dept. Total - Transportation $722,419 $725,676 $725,676 $725,676<br />
Fund Total - STADIUM EVENT OPERATIONS: $2,959,055 $2,964,626<br />
<strong>12</strong>82 - ARENA EVENT OPERATIONS<br />
FINANCIAL SVCS GROUP<br />
Finance<br />
11415 Arena Management Fee<br />
$2,943,556 $2,967,219<br />
$20,000,000<br />
FIRE SERVICES GROUP<br />
Fire Department<br />
<strong>12</strong>489 Westgate - Fire Event Staffing $11,659<br />
<strong>12</strong>490 Arena - Fire Event Staffing $152,602 $300,008 $300,008 $301,041<br />
Dept. Total - Fire Department $164,261 $300,008 $300,008 $301,041<br />
POLICE SERVICES GROUP<br />
Police Department<br />
<strong>12</strong>190 Arena-PD Event Staffing $495,334 $836,831<br />
$836,831 $838,135<br />
PUBLIC WORKS GROUP<br />
Field Operations<br />
16740 Arena - ROW Maintenance $35,574 $49,966<br />
$49,966 $49,966<br />
TRANSPORTATION SVCS GROUP<br />
Transportation<br />
16830 Arena - Transportation Ops. $11,370 $15,000<br />
$15,000 $15,000<br />
Fund Total - ARENA EVENT OPERATIONS: $706,539 $1,201,805<br />
<strong>12</strong>83 - CAMELBACKRANCH EVENTOPERATIONS<br />
FIRE SERVICES GROUP<br />
Fire Department<br />
<strong>12</strong>485 CBRanch - Fire Event Staffing $34,604<br />
$1,201,805 $21,204,142<br />
$21,070 $28,852<br />
Fund Total - CAMELBACKRANCH EVENTOPERATION $34,604<br />
$21,070 $28,852<br />
526<br />
Return to TOC
Schedule Three<br />
Operating Budget by Program and Fund<br />
Program Name<br />
1740 - CIVIC CENTER<br />
FY 2010<br />
Actual<br />
FY <strong>2011</strong><br />
Budget<br />
COMMUNICATIONS GROUP<br />
Civic Center<br />
11710 Civic Center $840,701 $748,497<br />
FY <strong>2011</strong><br />
Estimate<br />
FY 20<strong>12</strong><br />
Budget<br />
$748,497 $766,817<br />
Fund Total - CIVIC CENTER: $840,701 $748,497<br />
1780 - ARENA SPECIAL REVENUE<br />
FINANCIAL SVCS GROUP<br />
Finance<br />
11420 Arena Renewal and Replacement $332,000 $550,000<br />
$748,497 $766,817<br />
$550,000 $550,000<br />
Fund Total - ARENA SPECIAL REVENUE: $332,000 $550,000<br />
1790 - STADIUM CITY SALES TAX - AZSTA<br />
FINANCIAL SVCS GROUP<br />
Finance<br />
11400 AZSTA - Stadium Tax Refund $1,627,000 $1,700,000<br />
$550,000 $550,000<br />
$1,700,000 $1,745,900<br />
Fund Total - STADIUM CITY SALES TAX - AZSTA: $1,627,000 $1,700,000<br />
$1,700,000 $1,745,900<br />
1870 - MARKETING SELF SUST<br />
COMMUNICATIONS GROUP<br />
Marketing and Comm.<br />
14301 Audio/Visual - Self Sust. $31,118 $31,118 $0<br />
14310 Tourism - Souvenir Program $2,967 $5,000 $5,000 $5,000<br />
14311 Convention & Visitors Bureau $30,000 $30,000 $30,000<br />
14321 Glitter Spectacular $<strong>12</strong>0,397 $99,000 $99,000 $99,000<br />
14322 Enchanted Evening $81,280 $44,700 $44,700 $75,818<br />
14323 Glitter and Glow $83,263 $95,500 $45,500 $94,000<br />
14324 Chocolate Affaire $110,987 $104,000 $104,000 $104,000<br />
14325 J<strong>az</strong>z Festival $183,231 $158,000 $158,000 $158,000<br />
14326 Glitters Light $152,000 $155,798 $155,798 $155,798<br />
14327 Other Special Events $<strong>12</strong>7,405 $30,000 $30,000 $30,000<br />
14328 Summer Band $1,506<br />
$1,500 $1,500<br />
Dept. Total - Marketing and Comm. $863,036 $753,116 $704,616 $753,116<br />
Fund Total - MARKETING SELF SUST: $863,036 $753,116<br />
2530 - TRAINING FACILITY REVENUE FUND<br />
FIRE SERVICES GROUP<br />
Fire Department<br />
<strong>12</strong>590 PS Training Ops - Fire $739,341 $760,451<br />
$704,616 $753,116<br />
$730,451 $763,314<br />
527<br />
Return to TOC
Schedule Three<br />
Operating Budget by Program and Fund<br />
Program Name<br />
FY 2010<br />
Actual<br />
FY <strong>2011</strong><br />
Budget<br />
FY <strong>2011</strong><br />
Estimate<br />
FY 20<strong>12</strong><br />
Budget<br />
POLICE SERVICES GROUP<br />
Police Department<br />
<strong>12</strong>390 PS Training Ops - Police $309,425 $331,162<br />
$331,162 $326,041<br />
PUBLIC WORKS GROUP<br />
Field Operations<br />
13480 PS Training Ops - Fac. Mgmt. $513,955 $353,664<br />
$353,664 $455,462<br />
Fund Total - TRAINING FACILITY REVENUE FUND: $1,562,721 $1,445,277<br />
2538 - GLENDALE HEALTH CENTER<br />
FIRE SERVICES GROUP<br />
Fire Department<br />
<strong>12</strong>711 Glendale Health Center $32,859 $54,000<br />
$1,415,277 $1,544,817<br />
$54,000 $54,000<br />
Fund Total - GLENDALE HEALTH CENTER: $32,859 $54,000<br />
$54,000 $54,000<br />
TOTAL - GENERAL FUND GROUP $162,800,239<br />
$158,037,513 $156,<strong>12</strong>3,263 $170,959,859<br />
SPECIAL REVENUE FUND GROUP<br />
1300 - HOME GRANT<br />
N'HOOD & HUMAN SVCS GROUP<br />
Comm. Partnerships<br />
30001 HOME Program $1,116,060 $1,660,797<br />
$568,296 $1,787,501<br />
Fund Total - HOME GRANT: $1,116,060 $1,660,797<br />
1310 - NEIGHBORHOOD STABILIZATION PGM<br />
N'HOOD & HUMAN SVCS GROUP<br />
Comm. Partnerships<br />
30900 NSP Programs $2,237,449 $4,184,1<strong>12</strong><br />
$568,296 $1,787,501<br />
$2,066,215 $2,117,897<br />
Fund Total - NEIGHBORHOOD STABILIZATION PGM: $2,237,449 $4,184,1<strong>12</strong><br />
1311 - N'HOOD STABILIZATION PGM III<br />
N'HOOD & HUMAN SVCS GROUP<br />
Comm. Partnerships<br />
30910 NSP III<br />
$2,066,215 $2,117,897<br />
$3,368,377<br />
528<br />
Return to TOC
Schedule Three<br />
Operating Budget by Program and Fund<br />
Program Name<br />
FY 2010<br />
Actual<br />
FY <strong>2011</strong><br />
Budget<br />
FY <strong>2011</strong><br />
Estimate<br />
FY 20<strong>12</strong><br />
Budget<br />
Fund Total - N'HOOD STABILIZATION PGM III:<br />
$3,368,377<br />
1320 - C.D.B.G.<br />
N'HOOD & HUMAN SVCS GROUP<br />
Comm. Partnerships<br />
31001 CDBG Programs $2,254,658 $3,540,617<br />
$1,816,988 $3,718,764<br />
Fund Total - C.D.B.G.: $2,254,658 $3,540,617<br />
$1,816,988 $3,718,764<br />
1340 - HIGHWAY USER GAS TAX<br />
PUBLIC WORKS GROUP<br />
Field Operations<br />
16710 Right-<strong>of</strong>-Way Maintenance $2,294,458 $2,026,279 $2,116,279 $2,084,<strong>12</strong>3<br />
16720 Street Maintenance $2,850,276 $2,687,943 $2,597,943 $2,350,017<br />
16730 Street Cleaning $141,603<br />
$0<br />
$0<br />
Dept. Total - Field Operations $5,286,337 $4,714,222 $4,714,222 $4,434,140<br />
TRANSPORTATION SVCS GROUP<br />
Transportation<br />
16810 Traffic Signals $1,052,189 $903,017 $903,017 $800,256<br />
16820 Signs & Markings $698,602 $707,617 $707,617 $646,465<br />
16910 Transportation Administration $373,594 $373,165 $373,165 $296,918<br />
16920 Street Light Management $1,640,955 $1,093,283 $1,093,283 $1,403,390<br />
16930 Transportation Planning $2,178<br />
16940 Traffic Studies $410,766 $369,166 $369,166 $345,690<br />
16950 Traffic Design and Development $292,293 $301,709 $301,709 $290,717<br />
Dept. Total - Transportation $4,470,577 $3,747,957 $3,747,957 $3,783,436<br />
Fund Total - HIGHWAY USER GAS TAX: $9,756,914 $8,462,179<br />
$8,462,179 $8,217,576<br />
1650 - TRANSPORTATION GRANTS<br />
TRANSPORTATION SVCS GROUP<br />
Transportation<br />
37200 Grant Approp - Transportation<br />
$768,765 $768,765<br />
37206 HSIP Ped Countdown Signals<br />
$55,200<br />
Dept. Total - Transportation $823,965 $768,765<br />
Fund Total - TRANSPORTATION GRANTS:<br />
1660 - TRANSPORTATION SALES TAX<br />
TRANSPORTATION SVCS GROUP<br />
Transportation<br />
16510 Transportation Program Mgmt $2,026,866 $2,298,887<br />
16520 Transportation Education $180,310 $223,934<br />
$823,965 $768,765<br />
$2,297,587 $2,313,072<br />
$223,934 $226,075<br />
529<br />
Return to TOC
Program Name<br />
Schedule Three<br />
Operating Budget by Program and Fund<br />
FY 2010<br />
Actual<br />
FY <strong>2011</strong><br />
Budget<br />
FY <strong>2011</strong><br />
Estimate<br />
FY 20<strong>12</strong><br />
Budget<br />
16525 Transit Management $322,534 $322,741 $322,741 $339,875<br />
16530 Dial-A-Ride $2,390,040 $2,391,<strong>12</strong>9 $2,391,<strong>12</strong>9 $2,449,479<br />
16540 Fixed Route $4,502,347 $5,675,488 $4,875,488 $5,175,488<br />
16550 Demand Management $32,091 $8,105 $42,000 $42,000<br />
16570 Intelligent Transportation Sys $433,478 $590,944 $590,944 $600,342<br />
16580 Traffic Mitigation $90,293 $578,348 $328,348 $580,336<br />
16590 Transportation CIP O&M $91,734 $113,893 $113,893 $113,893<br />
16600 Red Light Enforcement $23,781<br />
Dept. Total - Transportation $10,093,474 $<strong>12</strong>,203,469 $11,186,064 $11,840,560<br />
Fund Total - TRANSPORTATION SALES TAX: $10,093,474 $<strong>12</strong>,203,469<br />
1700 - POLICE SPECIAL REVENUE<br />
POLICE SERVICES GROUP<br />
Police Department<br />
<strong>12</strong>310 Patrol - Special Revenue Fund $9,433,739 $<strong>12</strong>,586,5<strong>12</strong><br />
$11,186,064 $11,840,560<br />
$<strong>12</strong>,586,5<strong>12</strong> $14,173,737<br />
Fund Total - POLICE SPECIAL REVENUE: $9,433,739 $<strong>12</strong>,586,5<strong>12</strong><br />
1720 - FIRE SPECIAL REVENUE<br />
FIRE SERVICES GROUP<br />
Fire Department<br />
<strong>12</strong>610 Fire - Special Revenue Fund $4,850,264 $6,135,642<br />
$<strong>12</strong>,586,5<strong>12</strong> $14,173,737<br />
$7,335,642 $6,395,637<br />
Fund Total - FIRE SPECIAL REVENUE: $4,850,264 $6,135,642<br />
1760 - AIRPORT SPECIAL REVENUE<br />
TRANSPORTATION SVCS GROUP<br />
Airport<br />
16410 Airport Operations $621,749 $538,916<br />
$7,335,642 $6,395,637<br />
$538,916 $527,326<br />
Fund Total - AIRPORT SPECIAL REVENUE: $621,749 $538,916<br />
1820 - CAP GRANT<br />
N'HOOD & HUMAN SVCS GROUP<br />
Comm. Action Program<br />
32040 Community Action Program (CAP) $389,388 $4<strong>12</strong>,557<br />
32050 Case Mgmt-LIHEAP Voucher<br />
32051 CM-LIHEAP Voucher Contigency<br />
32052 Case Mgt-LIHEAP Administration<br />
32053 Case Mgt-LIHEAP A16 Admin<br />
32054 CM-LIHEAP Admin Contingency<br />
32055 Case Mgmt-TANF Voucher<br />
32056 Case Mgmt-TANF Admin<br />
$538,916 $527,326<br />
$4<strong>12</strong>,557 $0<br />
$805,544 $790,705<br />
$90,718 $90,718<br />
$51,568 $51,568<br />
$56,647 $56,647<br />
$5,341 $5,341<br />
$45,000 $45,000<br />
-$<strong>12</strong>,475 $179,549<br />
530<br />
Return to TOC
Program Name<br />
Schedule Three<br />
Operating Budget by Program and Fund<br />
FY 2010<br />
Actual<br />
FY <strong>2011</strong><br />
Budget<br />
FY <strong>2011</strong><br />
Estimate<br />
FY 20<strong>12</strong><br />
Budget<br />
32057 Case Mgmt-NHN Voucher<br />
$3,135 $3,135<br />
32058 Case Mgmt-Qwest Admin<br />
$3,919 $3,919<br />
32060 Community Svcs Block Grant-Adm<br />
$189,494 $265,153<br />
32070 ACAA HEAF Program<br />
$10,136 $10,136<br />
32071 ACAA SW Gas Assistance<br />
$5,000 $5,000<br />
32072 ACAA URRD Program<br />
$36,732 $36,732<br />
32073 ACAA SRP Assistance<br />
$59,441 $59,441<br />
Dept. Total - Comm. Action Program $389,388 $4<strong>12</strong>,557 $1,762,757 $1,603,044<br />
Fund Total - CAP GRANT: $389,388 $4<strong>12</strong>,557<br />
1830 - EMERGENCY SHELTER GRANTS<br />
N'HOOD & HUMAN SVCS GROUP<br />
Comm. Partnerships<br />
31905 Emergency Shelter Grant $65,203 $98,278<br />
$1,762,757 $1,603,044<br />
$98,278 $98,278<br />
Fund Total - EMERGENCY SHELTER GRANTS: $65,203 $98,278<br />
1840 - GRANTS<br />
CITY COURT GROUP<br />
Grants<br />
32136 DV Pilot Project Grant $161,630 $66,606<br />
$98,278 $98,278<br />
$66,606 $68,219<br />
FINANCIAL SVCS GROUP<br />
Grants<br />
32118 Miscellaneous Grants $596,802 $7,274,833<br />
Management & Budget<br />
32010 Grant Match Funds - Mgt & Bdgt $57,271<br />
$0<br />
Group Total - FINANCIAL SVCS: $654,073 $7,274,833<br />
FIRE SERVICES GROUP<br />
Fire Department<br />
34001 Grant Approp - Fire Dept $562,753 $4,500,000<br />
$5,490,730 $8,626,542<br />
$0<br />
$5,490,730 $8,626,542<br />
$4,500,000 $4,500,000<br />
LEISURE & CULTURAL GROUP<br />
Library & Arts<br />
36006 Grant Approp - Library $92,169 $550,000<br />
Parks & Recreation<br />
35004 Grant Approp - Parks & Rec $63,876 $550,000<br />
Group Total - LEISURE & CULTURAL: $156,045 $1,100,000<br />
$550,000 $550,000<br />
$550,000 $550,000<br />
$1,100,000 $1,100,000<br />
531<br />
Return to TOC
Schedule Three<br />
Operating Budget by Program and Fund<br />
Program Name<br />
FY 2010<br />
Actual<br />
FY <strong>2011</strong><br />
Budget<br />
FY <strong>2011</strong><br />
Estimate<br />
FY 20<strong>12</strong><br />
Budget<br />
POLICE SERVICES GROUP<br />
Police Department<br />
33002 Victim Rights - PD $76,201 $102,667 $102,667 $104,752<br />
33018 VOCA $114,309 $117,206 $117,206 $95,482<br />
33021 Grant Approp - Police Dept $2,032,316 $4,500,000 $4,500,000 $4,500,000<br />
Dept. Total - Police Department $2,222,826 $4,719,873 $4,719,873 $4,700,234<br />
Fund Total - GRANTS: $3,757,327 $17,661,3<strong>12</strong><br />
$15,877,209 $18,994,995<br />
1842 - ARRA STIMULUS GRANTS<br />
DEVELOPMENT SVCS GROUP<br />
Grants<br />
37065 Build Safe Engy Prog Enhance $35,000 $2,401 $87,599<br />
37069 WebPortal $55,000<br />
Dept. Total - Grants $90,000 $2,401 $87,599<br />
FINANCIAL SVCS GROUP<br />
Grants<br />
37068 Program Manager $2,813 $234,150<br />
$13,311 $218,026<br />
FIRE SERVICES GROUP<br />
Fire Department<br />
37110 PSSP Fire OT Grant<br />
$75,000<br />
LEISURE & CULTURAL GROUP<br />
Grants<br />
37063 Sports Courts Lighting Retr<strong>of</strong>i $140,000 $65,000 $75,000<br />
37064 Main Library Lighting $431,831 $295,000 $136,831<br />
37070 AzPAC Project AZ ARRA BTOP 1 $0<br />
Dept. Total - Grants $0 $571,831 $360,000 $211,831<br />
N'HOOD & HUMAN SVCS GROUP<br />
Comm. Partnerships<br />
37020 Homeless Prevention HPRP $550,108 $646,272 $364,015<br />
37021 CDBG-R $390,772 $140,000 $147,049 $60,000<br />
Dept. Total - Comm. Partnerships $940,880 $786,272 $511,064 $60,000<br />
POLICE SERVICES GROUP<br />
Grants<br />
37062 Public Safety/Court Lighting $88,000<br />
Police Department<br />
37000 PSSP Police OT Grant<br />
37001 Stop Violence - Women $52,219 $115,978<br />
37002 JAG Recovery Act $740,863<br />
$56,000 $32,000<br />
$75,000<br />
$0 $84,742<br />
$740,863<br />
532<br />
Return to TOC
Schedule Three<br />
Operating Budget by Program and Fund<br />
Program Name<br />
FY 2010<br />
Actual<br />
FY <strong>2011</strong><br />
Budget<br />
FY <strong>2011</strong><br />
Estimate<br />
FY 20<strong>12</strong><br />
Budget<br />
Dept. Total - Police Department $52,219 $856,841<br />
$0 $900,605<br />
$944,841<br />
TRANSPORTATION SVCS GROUP<br />
Grants<br />
37066 Traffic Signal LED Conversion $41,210 $84,000<br />
$56,000 $932,605<br />
$0 $42,790<br />
Transportation<br />
37090 Old Roma Alley ARRA Grant $159,776<br />
$457,656<br />
37091 FTA AZ-96-X002 $74,874<br />
Dept. Total - Transportation $234,650<br />
$457,656<br />
Group Total - TRANSPORTATION SVCS: $275,860 $84,000<br />
$42,790<br />
WATER SERVICES GROUP<br />
Grants<br />
37060 ARWRF Facility UV System Imp $986,000 $180,000 $806,000<br />
37061 Well 43 Variable Drive Retr<strong>of</strong>i $97,500 $22,500 $75,000<br />
37067 Energy Matters Public Educat $731 $172,519 $8,882 $162,906<br />
Dept. Total - Grants $731 $1,256,019 $211,382 $1,043,906<br />
Fund Total - ARRA STIMULUS GRANTS: $1,272,503 $3,967,113<br />
$1,611,814 $2,671,757<br />
1860 - RICO FUNDS<br />
POLICE SERVICES GROUP<br />
Police Department<br />
32020 Federal RICO $26 $225,000 $225,000 $225,000<br />
32030 State RICO $1,208,209 $1,099,389 $1,099,389 $3,670,053<br />
Dept. Total - Police Department $1,208,235 $1,324,389 $1,324,389 $3,895,053<br />
Fund Total - RICO FUNDS: $1,208,235 $1,324,389<br />
$1,324,389 $3,895,053<br />
1880 - PARKS & RECREATION SELF SUST<br />
LEISURE & CULTURAL GROUP<br />
Parks & Recreation<br />
14810 Recreation Self-Sustaining<br />
$15,000<br />
14820 Rec Self Sust-Administration $17,296 $15,000 $15,000 $15,360<br />
14825 Adult Center Self Sustaining $149,973 $135,000 $135,000 $117,000<br />
14830 Rec Self Sust-Foothills Rec $233,355 $272,748 $272,748 $254,893<br />
14840 Sports Self Sustaining $179,865 $249,922 $249,922 $228,364<br />
14850 Youth and Teen Self Sustaining $303,547 $326,735 $326,735 $3<strong>12</strong>,584<br />
14860 Spec Events & Prgm Self Sust $62,077 $73,363 $73,363 $34,999<br />
14870 Rec Self Sust-Audio/Visual $18,806<br />
14890 Aquatic Self Sustaining $81,695 $92,919 $92,919 $90,001<br />
14891 GESD-Reimb Division $0<br />
$0<br />
$0 $0<br />
14892 Glendale Community Center $861 $5,000 $5,000 $5,000<br />
Dept. Total - Parks & Recreation $1,047,475 $1,170,687 $1,170,687 $1,073,201<br />
533<br />
Return to TOC
Schedule Three<br />
Operating Budget by Program and Fund<br />
Program Name<br />
FY 2010<br />
Actual<br />
FY <strong>2011</strong><br />
Budget<br />
FY <strong>2011</strong><br />
Estimate<br />
FY 20<strong>12</strong><br />
Budget<br />
Fund Total - PARKS & RECREATION SELF SUST: $1,047,475 $1,170,687<br />
$1,170,687 $1,073,201<br />
1885 - PARKS & RECREATION DESIGNATED<br />
LEISURE & CULTURAL GROUP<br />
Parks & Recreation<br />
13110 O'Neil Park Maintenance $4,800 $4,800 $4,800<br />
13<strong>12</strong>0 Apollo Pool Repair $7,080 $19,000 $19,000 $19,000<br />
13130 Cardinal Pool Repair $5,161 $19,000 $19,000 $19,000<br />
13140 Cactus Pool Repair $54,802 $20,000 $20,000 $20,000<br />
13150 GCC Pool Repair $116<br />
13160 Ironwood Pool Repair $4,082 $30,200 $30,200 $30,200<br />
13170 Dedicate A Tree $238 $5,000 $5,000 $5,000<br />
13180 Desert Valley Park $1,555 $2,000 $2,000 $2,000<br />
13190 GESD ES Ballfields $7,000 $7,000 $7,000<br />
13210 Desert Mirage Park $7,000 $7,000 $7,000<br />
13220 Desert Gardens Park $2,938 $7,000 $7,000 $7,000<br />
13230 Discovery Park $7,000 $7,000 $7,000<br />
13234 Ironwood HS Light $5,000 $5,000 $5,000<br />
13235 Elsie McCarthy Pk. Maint $19,958 $44,038 $44,038 $44,038<br />
Dept. Total - Parks & Recreation $95,930 $177,038 $177,038 $177,038<br />
Fund Total - PARKS & RECREATION DESIGNATED: $95,930 $177,038<br />
$177,038 $177,038<br />
TOTAL - SPECIAL REVENUE FUND GROUP $48,200,368<br />
$74,<strong>12</strong>3,618 $67,406,949 $81,429,506<br />
CAPITAL FUND GROUP<br />
1980 - STREETS CONSTR. - 1999 AUTH<br />
FINANCIAL SVCS GROUP<br />
Lease Pmts/OtherFees<br />
89802 1980 Advisor Fees $1,599 $6,066<br />
$6,066 $6,066<br />
Fund Total - STREETS CONSTR. - 1999 AUTH: $1,599 $6,066<br />
2000 - HURF STREET BONDS<br />
FINANCIAL SVCS GROUP<br />
Lease Pmts/OtherFees<br />
89807 2000 Advisor Fees $1,030<br />
$6,066 $6,066<br />
$1,030 $1,030<br />
Fund Total - HURF STREET BONDS: $1,030<br />
2040 - PUBLIC SAFETY CONSTRUCTION<br />
FINANCIAL SVCS GROUP<br />
Lease Pmts/OtherFees<br />
89806 2040 Advisor Fees $1,219 $2,000<br />
534<br />
Return to TOC<br />
$1,030 $1,030<br />
$2,000 $2,000
Schedule Three<br />
Operating Budget by Program and Fund<br />
Program Name<br />
FY 2010<br />
Actual<br />
FY <strong>2011</strong><br />
Budget<br />
FY <strong>2011</strong><br />
Estimate<br />
FY 20<strong>12</strong><br />
Budget<br />
Fund Total - PUBLIC SAFETY CONSTRUCTION: $1,219 $2,000<br />
2060 - PARKS CONSTRUCTION<br />
FINANCIAL SVCS GROUP<br />
Lease Pmts/OtherFees<br />
89804 2060 Advisor Fees $430 $6,857<br />
$2,000 $2,000<br />
$6,857 $6,857<br />
Fund Total - PARKS CONSTRUCTION: $430 $6,857<br />
2080 - GOV'T FACILITIES - 1999 AUTH<br />
FINANCIAL SVCS GROUP<br />
Lease Pmts/OtherFees<br />
89814 2080 Advisor Fees $324 $2,000<br />
$6,857 $6,857<br />
$2,000 $2,000<br />
Fund Total - GOV'T FACILITIES - 1999 AUTH: $324 $2,000<br />
2100 - ECONOMIC DEV. CONSTR-1999 AUTH<br />
FINANCIAL SVCS GROUP<br />
Lease Pmts/OtherFees<br />
89815 2100 Advisor Fees $290 $2,000<br />
$2,000 $2,000<br />
$2,000 $2,000<br />
Fund Total - ECONOMIC DEV. CONSTR-1999 AUTH: $290 $2,000<br />
2180 - FLOOD CONTROL CONSTRUCTION<br />
FINANCIAL SVCS GROUP<br />
Lease Pmts/OtherFees<br />
89808 2180 Advisor Fees $4,484 $5,213<br />
$2,000 $2,000<br />
$5,213 $5,213<br />
Fund Total - FLOOD CONTROL CONSTRUCTION: $4,484 $5,213<br />
2210 - TRANSPORTATION CAPITAL PROJECT<br />
FINANCIAL SVCS GROUP<br />
Lease Pmts/OtherFees<br />
89813 2210 Advisor Fees $10,756 $13,568<br />
$5,213 $5,213<br />
$13,568 $13,568<br />
Fund Total - TRANSPORTATION CAPITAL PROJECT: $10,756 $13,568<br />
$13,568 $13,568<br />
TOTAL - CAPITAL FUND GROUP $19,102<br />
$38,734 $38,734 $38,734<br />
535<br />
Return to TOC
Schedule Three<br />
Operating Budget by Program and Fund<br />
Program Name<br />
ENTERPRISE FUND GROUP<br />
2360 - WATER<br />
FY 2010<br />
Actual<br />
FY <strong>2011</strong><br />
Budget<br />
DEVELOPMENT SVCS GROUP<br />
Building Safety<br />
17510 Cross Connection Control $2<strong>12</strong>,090 $220,067<br />
FY <strong>2011</strong><br />
Estimate<br />
FY 20<strong>12</strong><br />
Budget<br />
$261,067 $225,<strong>12</strong>5<br />
FINANCIAL SVCS GROUP<br />
Finance<br />
17020 Customer Service Office $2,318,790 $2,659,473<br />
$2,598,968 $2,963,088<br />
Lease Pmts/OtherFees<br />
89805 2360 Advisor Fees $1,410 $3,289 $3,289 $3,289<br />
89809 2400 Advisor Fees $3,075 $17,222 $4,722 $17,222<br />
89810 2420 Advisor Fees $824 $17,514 $5,014 $17,514<br />
Dept. Total - Lease Pmts/OtherFees $5,309 $38,025 $13,025 $38,025<br />
Group Total - FINANCIAL SVCS: $2,324,099 $2,697,498<br />
NON-DEPARTMENTAL GROUP<br />
Non-Departmental<br />
11809 Fund 2360 Non-Dept<br />
$2,611,993 $3,001,113<br />
$3,463,778<br />
WATER SERVICES GROUP<br />
Env. Resources<br />
17010 Environmental Resources $508,393 $524,231 $517,342 $537,929<br />
17410 Water Conservation $245,596 $320,901 $294,429 $315,811<br />
17420 Water Quality $968,381 $1,162,187 $1,108,775 $1,155,382<br />
Dept. Total - Env. Resources $1,722,370 $2,007,319 $1,920,546 $2,009,<strong>12</strong>2<br />
Utilities<br />
17110 Utilities Administration $8,243,375 $6,343,982<br />
17115 Safety Administration $26,575 $<strong>12</strong>2,107<br />
17<strong>12</strong>0 Information Management $920,288 $1,097,575<br />
17130 Public Service Representatives $232,975 $286,629<br />
17140 System Security $486,631 $667,683<br />
17150 Property Management $94,306 $87,000<br />
17160 Arrowhead Reclamation Plant $1,985,990 $2,176,656<br />
17170 West Area Plant $3,474,060 $3,699,346<br />
17210 Customer Service - Field $954,716 $1,082,739<br />
17220 Irrigation $187,923 $193,583<br />
17230 Raw Water Usage $3,144,952 $3,482,182<br />
17240 Central System Control $1,004,554 $1,415,952<br />
17250 Pyramid Peak Plant $1,780,221 $1,627,555<br />
17260 Cholla Treatment Plant $3,221,671 $3,681,059<br />
17280 Central System Maintenance $369,176 $758,316<br />
17290 Water Distribution $3,105,131 $3,536,368<br />
17300 Meter Maintenance $669,091 $1,348,944<br />
17310 Oasis Water Campus $3,113,823 $4,277,656<br />
17610 Pretreatment Program $475,754 $533,992<br />
536<br />
Return to TOC<br />
$6,301,682 $6,433,504<br />
$107,107 $0<br />
$1,097,575 $1,071,445<br />
$266,629 $221,824<br />
$617,683 $771,316<br />
$87,000 $87,000<br />
$2,046,656 $2,106,685<br />
$3,438,346 $3,560,668<br />
$1,082,739 $1,186,886<br />
$188,583 $195,269<br />
$3,482,182 $3,382,182<br />
$1,165,952 $1,3<strong>12</strong>,765<br />
$1,607,555 $1,7<strong>12</strong>,457<br />
$3,181,059 $3,459,182<br />
$708,316 $706,057<br />
$3,366,368 $3,424,134<br />
$1,113,944 $1,208,990<br />
$3,827,656 $4,104,326<br />
$532,992 $526,731
Program Name<br />
Schedule Three<br />
Operating Budget by Program and Fund<br />
FY 2010<br />
Actual<br />
FY <strong>2011</strong><br />
Budget<br />
FY <strong>2011</strong><br />
Estimate<br />
FY 20<strong>12</strong><br />
Budget<br />
17620 SROG (91st Ave) Plant $2,547,780 $4,500,000 $3,400,000 $3,700,000<br />
17625 99th Avenue Interceptor $309,613<br />
$200,000 $200,000<br />
17630 Wastewater Collection $2,354,389 $3,278,968 $3,044,468 $3,182,901<br />
Dept. Total - Utilities $38,702,994 $44,198,292 $40,864,492 $42,554,322<br />
Group Total - WATER SERVICES: $40,425,364 $46,205,611<br />
Fund Total - WATER: $42,961,553 $49,<strong>12</strong>3,176<br />
$42,785,038 $44,563,444<br />
$49,<strong>12</strong>1,876 $47,789,682<br />
2440 - LANDFILL<br />
PUBLIC WORKS GROUP<br />
Field Operations<br />
17710 Landfill $4,079,685 $2,926,869 $3,<strong>12</strong>1,513 $3,162,699<br />
17720 Gas Management System $139,306 $169,400 $169,400 $169,400<br />
17730 Solid Waste Admin $578,055 $782,455 $787,207 $808,184<br />
17740 Recycling $772,004 $940,620 $904,328 $937,523<br />
17750 MRF Operations $1,800,754 $2,223,685 $1,764,571 $2,021,336<br />
Dept. Total - Field Operations $7,369,804 $7,043,029 $6,747,019 $7,099,142<br />
Fund Total - LANDFILL: $7,369,804 $7,043,029<br />
$6,747,019 $7,099,142<br />
2480 - SANITATION<br />
PUBLIC WORKS GROUP<br />
Field Operations<br />
17810 Sanitation Roll-<strong>of</strong>f $713,495 $939,201 $863,893 $795,098<br />
17820 Sanitation Frontload $3,132,858 $3,493,979 $3,493,979 $3,435,176<br />
17830 Curb Service $6,624,900 $6,960,004 $6,960,004 $7,548,223<br />
17840 Residential-Loose Trash Collec $2,402,881 $2,500,010 $2,551,090 $2,802,234<br />
Dept. Total - Field Operations $<strong>12</strong>,874,134 $13,893,194 $13,868,966 $14,580,731<br />
Fund Total - SANITATION: $<strong>12</strong>,874,134 $13,893,194<br />
2500 - PUB HOUSING BUDGET ACTIVITIES<br />
N'HOOD & HUMAN SVCS GROUP<br />
Comm. Partnerships<br />
17910 Community Housing $1,503,648 $8,487,034<br />
$13,868,966 $14,580,731<br />
$<strong>12</strong>,587,034 $<strong>12</strong>,609,<strong>12</strong>6<br />
Fund Total - PUB HOUSING BUDGET ACTIVITIES: $1,503,648 $8,487,034<br />
$<strong>12</strong>,587,034 $<strong>12</strong>,609,<strong>12</strong>6<br />
TOTAL - ENTERPRISE FUND GROUP $64,709,139<br />
$78,546,433 $82,324,895 $82,078,681<br />
INTERNAL SERVICE FUND GROUP<br />
537<br />
Return to TOC
Schedule Three<br />
Operating Budget by Program and Fund<br />
Program Name<br />
FY 2010<br />
Actual<br />
2540 - RISK MANAGEMENT SELF INSURANCE<br />
FY <strong>2011</strong><br />
Budget<br />
HR & RISK MGT GROUP<br />
Human Resources<br />
18010 Risk Mgmt Trust Fund $2,569,174 $2,844,278<br />
FY <strong>2011</strong><br />
Estimate<br />
FY 20<strong>12</strong><br />
Budget<br />
$2,844,278 $3,068,438<br />
Fund Total - RISK MANAGEMENT SELF INSURANCE: $2,569,174 $2,844,278<br />
2560 - WORKERS COMP. SELF INSURANCE<br />
HR & RISK MGT GROUP<br />
Human Resources<br />
18110 Worker's Compensation $1,249,428 $1,407,000<br />
$2,844,278 $3,068,438<br />
$1,407,000 $1,407,000<br />
Fund Total - WORKERS COMP. SELF INSURANCE: $1,249,428 $1,407,000<br />
2580 - BENEFITS TRUST FUND<br />
HR & RISK MGT GROUP<br />
Human Resources<br />
18210 Benefit Programs $22,954,668 $24,481,185<br />
$1,407,000 $1,407,000<br />
$23,111,564 $23,117,869<br />
Fund Total - BENEFITS TRUST FUND: $22,954,668 $24,481,185<br />
$23,111,564 $23,117,869<br />
TOTAL - INTERNAL SERVICE FUND GROUP $26,773,270<br />
$28,732,463 $27,362,842 $27,593,307<br />
TOTAL - OPERATING BUDGET $302,502,118 $339,478,761 $333,256,683 $362,100,087<br />
538<br />
Return to TOC
* <strong>12</strong>80 - Youth<br />
Sports<br />
Complex<br />
1000 -<br />
General<br />
Fund<br />
1340 -<br />
Highway<br />
Use Rev<br />
Fund<br />
Schedule Four<br />
FY 20<strong>12</strong> Transfers Between Funds<br />
(All Dollars in Thousands)<br />
T R A N S F E R F R O M<br />
1600 - DIF<br />
* 1780 - * 1770 -<br />
1480 - DIF<br />
** 1640 -<br />
1660 -<br />
1900 - G.O.<br />
Roadway<br />
Arena Spec<br />
Zanjero<br />
Citywide<br />
LTAF<br />
Transport.<br />
Bond Debt<br />
Imp's<br />
Rev Spec Rev Rec Facility Total In:<br />
Sports $292 $292<br />
* <strong>12</strong>81 -<br />
Stadium Event<br />
Ops.<br />
Stadium Event $2,062 $2,062<br />
T<br />
R<br />
A<br />
N<br />
S<br />
F<br />
E<br />
R<br />
* <strong>12</strong>82 - Arena<br />
T<br />
Event Ops. $15,926 $15,926<br />
1660 -<br />
R<br />
Transportation t ti<br />
$900 $0 $900<br />
* 1740 - Civic<br />
$407 $407 A<br />
Center * 1760 -<br />
$61 $61 N<br />
Airport Oper. * 1820 - CAP<br />
S<br />
Grants $58 $58<br />
1870 - Mkt'g<br />
$320 $320 F<br />
Self-Sust. Sust 1900 - G.O.<br />
$209 $209 E<br />
Bond $ $ Det<br />
1920 - HURF<br />
$1,353 $1,000 $1,000 $1,353 $4,706 R<br />
Bond Debt<br />
* 1930 - PFC<br />
Debt<br />
$380 $380<br />
Debt<br />
T<br />
O<br />
1940 MPC<br />
* 1940 - MPC $10,207 $7,952 $1,283 $19,442 T<br />
Debt<br />
1970 - Transp.<br />
$7,327 $7,327 O<br />
Debt<br />
* 2210 -<br />
p<br />
Constr.<br />
Transp. $7,467 , $7,467,<br />
2500 - Comm.<br />
Housing<br />
Housing $307 $307<br />
Total Out: $30,920 $1,353 $1,000 $0 $15,794 $7,952 $1,283 $1,353 $209 $59,864<br />
T R A N S F E R F R O M<br />
* Actual transfer amounts will vary based on actual revenues, expenses, grant opportunities, etc.<br />
** LTAF distributions were suspended by the Arizona State Legislature in FY <strong>2011</strong> and again in FY 20<strong>12</strong> in an effort to balance the state's s <strong>budget</strong>.<br />
539<br />
Return to TOC
Schedule Five<br />
Expenditure Limitation and<br />
Summary <strong>of</strong> Tax Levy and Tax Rate Information<br />
Estimated<br />
2010-11 <strong>2011</strong>-<strong>12</strong><br />
Expenditure Limitation Fiscal Year Fiscal Year<br />
Voter Approved Expenditure Limitation $547,475,967 $503,458,845<br />
Estimated Expenditures $676,000,000 $638,000,000<br />
Estimated Amount <strong>of</strong> Exclusions ($227,271,294) ($218,302,009)<br />
Total Estimated Expenditures Subject to Limitation $448,728,706 $419,697,991<br />
1. Maximum Allowable Primary Property Tax Levy<br />
(ARS 42-17051.A) $4,701,477 $4,896,349<br />
2. Amount Received from Primary Property Taxation in<br />
the 2004-05 Fiscal Year in Excess <strong>of</strong> the Sum <strong>of</strong> that<br />
Year's Maximum Allowable Primary Property Tax Levy<br />
(ARS 42-302.C.14) plus Amount <strong>of</strong> Escaped Taxes<br />
Collected (ARS 42-17005)<br />
3. Property Tax Levy Amounts<br />
A. Primary Property Taxes $3,724,139 $2,943,561<br />
B. Secondary Property Taxes $24,022,147 $17,994,426<br />
C. Total Property Tax Levy Amounts $27,746,286 $20,937,987<br />
4. Property Taxes Collected*<br />
A. Primary Property Taxes<br />
1. 2010-11 Levy $3,649,656<br />
2. Prior Years' Levies $74,483<br />
3. Total Primary Property Taxes $3,724,139<br />
B. Secondary Property Taxes<br />
1. 2010-11 Levy $23,541,704<br />
2. Prior Years' Levies $480,443<br />
3. Total Secondary Property Taxes $24,022,147<br />
5. Property Tax Rates<br />
A. City <strong>of</strong> Glendale Tax Rate<br />
1. Primary Property Tax Rate $0.2252/$100 $0.2252/$100<br />
2. Secondary Property Tax Rate $1.3699/$100 $1.3699/$100<br />
Total Glendale Tax Rate $1.5951/$100 $1.5951/$100<br />
B. Special Assessment District Tax Rates<br />
Secondary property tax rates - as <strong>of</strong> the date the proposed <strong>budget</strong><br />
was prepared, Glendale was operating no special assessment<br />
districts for which secondary property taxes are levied.<br />
6. Truth In Taxation Calculation<br />
A. Current Primary Net Assessed Valuation <strong>of</strong> Property<br />
Subject to Taxation in Prior Year $1,280,157,028<br />
B. Current Primary Net Assessed Valuation $1,307,087,287<br />
C. New Property Subject to Taxation $26,930,259<br />
D. Change in Primary Net Assessed Valuation Due to New Property 2.1%<br />
E. Maxmimum Truth in Taxation Tax Levy $3,802,483<br />
F. Amount Over/(Under) Truth in Taxation Tax Levy ($858,922)<br />
* Includes actual property taxes collected as <strong>of</strong> the date the proposed <strong>budget</strong> was prepared plus estimated property<br />
tax collections for the remainder <strong>of</strong> the year.<br />
540<br />
Return to TOC
Schedule Six<br />
Authorized Staffing<br />
Dept Program Name Position Title<br />
Fund FY 2008 FY 2009<br />
FY 2010<br />
FY <strong>2011</strong> FY 20<strong>12</strong><br />
Mayor - 111<br />
10010 Office <strong>of</strong> the Mayor<br />
Asst to the Mayor 1000 1 1 1 1 1<br />
Exec Administrative Asst II 1000 1 1<br />
Mayor 1000 1 1 1 1 1<br />
Mgmt Aide 1000 1 1 1<br />
Sr Mgmt Asst 1000 1 1 1 1 1<br />
Program Total: 4 4 4 4 4<br />
Mayor Total: 4 4 4 4 4<br />
Council Office - 1<strong>12</strong><br />
10110 Council Office<br />
Council Asst 1000 4 4 4 3 4<br />
Council Srvcs Admin 1000 1 1 1 1 1<br />
Exec Administrative Asst 1000 1 1 1 1<br />
Secretary 1000 1 1 1 1<br />
Sr Secretary 1000 2<br />
Program Total: 7 7 7 6 7<br />
10<strong>12</strong>0 Cholla District<br />
Council Member 1000 1<br />
Vice Mayor 1000 1 1 1 1<br />
Program Total: 1 1 1 1 1<br />
10130 Barrel District<br />
Council Member 1000 1 1 1 1 1<br />
10140 Sahuaro District<br />
Council Member 1000 1 1 1 1<br />
Vice Mayor 1000 1<br />
Program Total: 1 1 1 1 1<br />
10150 Cactus District<br />
Council Member 1000 1 1 1 1 1<br />
10160 Yucca District<br />
Council Member 1000 1 1 1 1 1<br />
10170 Ocotillo District<br />
Council Member 1000 1 1 1 1 1<br />
Council Office Total: 13 13 13 <strong>12</strong> 13<br />
City Clerk - <strong>12</strong>1<br />
10210 City Clerk<br />
City Clerk 1000 1 1 1 1 1<br />
Dep City Clerk 1000 1 1 1 1 1<br />
Mgmt Aide 1000 1 1 1 1 1<br />
Secretary 1000 1 1 1<br />
Sr Secretary 1000 1 1<br />
Program Total: 4 4 4 4 4<br />
541<br />
Return to TOC
Schedule Six<br />
Authorized Staffing<br />
Dept Program Name Position Title<br />
Fund FY 2008 FY 2009<br />
FY 2010<br />
FY <strong>2011</strong> FY 20<strong>12</strong><br />
City Clerk - <strong>12</strong>1<br />
10220 Records Management<br />
Records Mgmt Asst 1000 1 1 1 1 1<br />
Records Supv 1000 1 1 1 1 1<br />
Program Total: 2 2 2 2 2<br />
City Clerk Total: 6 6 6 6 6<br />
City Manager - 131<br />
10310 City Manager<br />
Asst City Mgr 1000 1 1 1 1 1<br />
City Manager 1000 1 1 1 1 1<br />
City Mgr Relations Dir 1000 1 1 1<br />
Exec Administrative Asst 1000 2 3 3 2 2<br />
Mgmt Asst 1000 1 1<br />
Mgmt Asst II 1000 1 1<br />
Mgmt Asst to the City Mgr 1000 1 1 1 1 1<br />
Special Projects Admin 1000 1<br />
Sr Mgmt Asst 1000 1 1 1 1 1<br />
Program Total: 8 9 9 7 7<br />
City Manager Total: 8 9 9 7 7<br />
City Auditor - 132<br />
10710 City Auditor<br />
Asst City Auditor 1000 1 1 1 1 1<br />
City Auditor 1000 1 1 1 1 1<br />
Internal Auditor 1000 1 2 2<br />
Mgmt Asst 1000 1<br />
Sr Secretary 1000 0.5 0.5 0.5<br />
Program Total: 4 4.5 4.5 2 2.5<br />
City Auditor Total: 4 4.5 4.5 2 2.5<br />
Intergovt. Programs - 133<br />
10910 Intergovernmental Programs<br />
Dep Intergov Programs Dir 1000 1 1 1<br />
Intergov Programs Admin 1000 2 2<br />
Intergov Programs Dir 1000 1 1 1 1 1<br />
Legislative Coordinator 1000 1 1 1<br />
Mgmt Aide 1000 1<br />
Mgmt Asst 1000 1 1 1 1<br />
Program Total: 4 4 4 4 4<br />
Intergovt. Programs Total: 4 4 4 4 4<br />
Env. Resources - 135<br />
17010 Environmental Resources<br />
Environmental Program Mgr 2360 3 3 3 3 3<br />
Environmental Resource Dir 2360 1 1 1 1 1<br />
Sr Secretary 2360 1 1 1 1 1<br />
Program Total: 5 5 5 5 5<br />
542<br />
Return to TOC
Schedule Six<br />
Authorized Staffing<br />
Dept Program Name Position Title<br />
Fund FY 2008 FY 2009<br />
FY 2010<br />
FY <strong>2011</strong> FY 20<strong>12</strong><br />
Env. Resources - 135<br />
17410 Water Conservation<br />
Environmental Program Mgr 2400 1 1 1 1 1<br />
Water Conservation Spec 2400 1 1 1 1 1<br />
Program Total: 2 2 2 2 2<br />
17420 Water Quality<br />
Chemist 2360 5 5 5 5 5<br />
Laboratory Tech 2360 3 3 3 3 3<br />
Water Quality Data Coord 2360 1 1 1 1 1<br />
Water Quality Lab Mgr 2360 1 1 1 1 1<br />
Program Total: 10 10 10 10 10<br />
Env. Resources Total: 17 17 17 17 17<br />
City Court - 141<br />
10410 City Court<br />
Account Spec II 1000 1 1 1 1 1<br />
City Judge 1000 2 2 2 2 2<br />
Coll Rep 1000 1 1 1 1 1<br />
Court Accounting Supv 1000 1 1 1 1 1<br />
Court Admin 1000 1 1 1 1 1<br />
Court Clerk I 1000 4 3 3 3 3<br />
Court Clerk II 1000 26 27 25 23.2 23.2<br />
Court Clerk III 1000 3 3 3 2 2<br />
Court Hearing Officer 1000 1 1 1 1 1<br />
Court Interpreter 1000 2 2 2 1.75 1.75<br />
Court Supv 1000 1 1 1<br />
Dep Court Admin 1000 2 2 2 1 1<br />
Judicial Asst 1000 1 1 1 1 1<br />
Police Officer 1000 2 2 2 2<br />
Presiding City Judge 1000 1 1 1 1 1<br />
Sr Secretary 1000 1 1 1 0.8 0.8<br />
Program Total: 50 50 48 42.75 40.75<br />
10510 Court Security<br />
Police Officer <strong>12</strong>40 1 1 1 1 1<br />
10520 Court Time Payments<br />
Court Clerk II <strong>12</strong>40 1 1<br />
City Court Total: 51 51 49 44.75 42.75<br />
543<br />
Return to TOC
Schedule Six<br />
Authorized Staffing<br />
Dept Program Name Position Title<br />
Fund FY 2008 FY 2009<br />
FY 2010<br />
FY <strong>2011</strong> FY 20<strong>12</strong><br />
City Attorney - 151<br />
10610 City Attorney<br />
Asst City Attorney 1000 3 3 3 3 2<br />
Asst City Prosecutor 1000 7 8 9 7 7<br />
City Attorney 1000 1 1 1 1 1<br />
City Prosecutor 1000 1 2 1 1 1<br />
Dep City Attorney 1000 2 2 2 2 3<br />
Exec Legal Asst 1000 1 1 1 1 1<br />
Legal Asst 1000 2 2 2 2 2<br />
Mgmt Asst to the City Attorney 1000 1 1 1 1 1<br />
Public Safety Staff Attorney 1000 1<br />
Secretary 1000 2 2 2 2 2<br />
Sr Asst City Prosecutor 1000 1<br />
Sr Secretary 1000 5 5 5 5 5<br />
Victim Assistance Caseworker 1000 1 1 1 1 1<br />
Program Total: 27 28 28 26 27<br />
City Attorney Total: 27 28 28 26 27<br />
Marketing and Comm. - 154<br />
10810 Marketing<br />
Asst Dep City Mgr 1000 1 1<br />
Comm Dir 1000 1<br />
Creative Designer 1000 2 2 2 2 1<br />
Creative Services Mgr 1000 1 1 1 1 1<br />
Customer Assistance Rep 1000 1<br />
Dep Comm Dir 1000 1 1 1 1 1<br />
Economic Development Admin 1000 1 1<br />
Exec Comm Dir 1000 1 1<br />
Marketing & Comm Coord 1000 1 1 1 1 1<br />
Marketing & Comm Mgr 1000 1 1 1 1 1<br />
Mgmt Asst 1000 1 1 1 1<br />
Sr Marketing & Comm Mgr 1000 1 1 2<br />
Sr Secretary 1000 1 1 1 1<br />
Web Content Program Mgr 1000 2 2 2 2 2<br />
Program Total: <strong>12</strong> 13 14 10 10<br />
10820 Tourism<br />
Customer Assistance Rep 1000 0.5 0.5 0.5 0.5 0.5<br />
CVB Mgr 1000 1<br />
Dep Comm Dir 1000 1 1 1 1<br />
Tourism Coordinator 1000 1 1 1 1 1<br />
Tourism Manager 1000 1 1 1 1<br />
Program Total: 3.5 3.5 3.5 3.5 2.5<br />
14110 City-Wide Special Events<br />
Special Events Coord 1000 1 1 1 1 0.75<br />
Special Events Division Mgr 1000 1 1 1 1 1<br />
Special Events Program Manager 1000 2 2 2 2 2<br />
Program Total: 4 4 4 4 3.75<br />
544<br />
Return to TOC
Schedule Six<br />
Authorized Staffing<br />
Dept Program Name Position Title<br />
Fund FY 2008 FY 2009<br />
FY 2010<br />
FY <strong>2011</strong> FY 20<strong>12</strong><br />
Marketing and Comm. - 154<br />
14115 Audio/Visual<br />
Audio/Visual Coordinator 1000 1 1<br />
Audio/Visual Network Spec 1000 1 1<br />
Program Total: 2 2<br />
14<strong>12</strong>0 Cable Communications<br />
Cable Media Administrator 1000 1 1 1 1 1<br />
Media Production Spec 1000 4 4<br />
Television Exec Prod/Anchor 1000 1 1 1 1 1<br />
Television Producer/Host 1000 1 1 1 1 1<br />
Video Production Coord 1000 4 4 4<br />
Program Total: 7 7 7 7 7<br />
Marketing and Comm. Total: 26.5 27.5 28.5 26.5 25.25<br />
Conv./Media/Parking - 155<br />
10890 Convention/Media/Parking<br />
Chief Broadcast Engineer 1000 1<br />
10891 Media Center Operations<br />
Chief Broadcast Engineer 1000 1 1 1 1<br />
Conv./Media/Parking Total: 1 1 1 1 1<br />
Comm. Action Program - 171<br />
32040 Community Action Program (CAP)<br />
Community Action Program Admin 1820 1 1 1 1<br />
Community Eligibility Rep 1820 1.5 1.5 2.5 2.5<br />
Community Eligibility Spec 1820 2 2 1 1<br />
Customer Assistance Rep 1820 1 1 1 1<br />
Mgmt Aide 1820 1 1 1 1<br />
Office Asst 1820 0.5 0.5 0.5 0.5<br />
Program Total: 7 7 7 7<br />
32056 Case Mgmt-TANF Admin<br />
Community Eligibility Rep 1820 2.5<br />
Community Eligibility Spec 1820 1<br />
Program Total: 3.5<br />
32060 Community Svcs Block Grant-Adm<br />
Community Action Program Admin 1820 1<br />
Customer Assistance Rep 1820 1<br />
Mgmt Aide 1820 1<br />
Office Asst 1820 0.5<br />
Program Total: 3.5<br />
Comm. Action Program Total: 7 7 7 7 7<br />
545<br />
Return to TOC
Schedule Six<br />
Authorized Staffing<br />
Dept Program Name Position Title<br />
Fund FY 2008 FY 2009<br />
FY 2010<br />
FY <strong>2011</strong> FY 20<strong>12</strong><br />
Human Resources - 191<br />
11010 Risk Management/Safety<br />
Employee Safety Specialist 1000 1 1 1<br />
Loss Control Supervisor 1000 1 1 1 1<br />
Occupational Health Nurse 1000 1 1<br />
Risk Mgr 1000 1 1 1 1<br />
Risk Mgmt Claims Analyst 1000 1 1 1<br />
Worker's Comp Claims Analyst 1000 1 1 1 1<br />
Program Total: 5 6 6 2 1<br />
11020 Benefits<br />
Employee Benefits Rep 1000 1.75 2 1.75 0.25<br />
HR Generalist 1000 1 1<br />
Occupational Health Nurse 1000 1<br />
Sr Customer Assistance Rep 1000 1<br />
Sr HR Analyst 1000 1 1 1<br />
Program Total: 3.75 3 2.75 1.25 2<br />
11030 Human Resources Administration<br />
Asst HR Dir 1000 1 1 1 1 1<br />
Dep HR Dir 1000 1<br />
HR & Risk Mgmt Dir 1000 1 1 1 1 1<br />
HR Coord 1000 1<br />
HR Generalist 1000 1<br />
HR Program Coord 1000 0.75<br />
HR Tech 1000 0.75<br />
HR Technology Analyst 1000 1<br />
Mgmt Asst 1000 1 1 1 1 1<br />
Sr HR Analyst 1000 2 2 2<br />
Sr HR Technology Analyst 1000 1 1 1<br />
Program Total: 7.5 6 6 5 5<br />
11040 Employment Services<br />
HR Admin 1000 1<br />
HR Analyst 1000 2 2 2<br />
HR Coord 1000 1<br />
HR Generalist 1000 1 2<br />
HR Program Coord 1000 0.75 1 1<br />
HR Program Mgr 1000 1 1 1 1<br />
HR Spec 1000 1<br />
HR Tech 1000 0.75<br />
Sr HR Analyst 1000 1<br />
Program Total: 5.75 3.75 4 3 4<br />
11050 Employee Relations<br />
HR Admin 1000 1<br />
HR Analyst 1000 1 1<br />
HR Generalist 1000 1 1<br />
HR Program Mgr 1000 1 1 1 1<br />
HR Tech 1000 0.75 0.75<br />
Sr HR Analyst 1000 1<br />
Program Total: 2 2.75 2.75 2 2<br />
546<br />
Return to TOC
Schedule Six<br />
Authorized Staffing<br />
Dept Program Name Position Title<br />
Fund FY 2008 FY 2009<br />
FY 2010<br />
FY <strong>2011</strong> FY 20<strong>12</strong><br />
Human Resources - 191<br />
11060 Compensation<br />
Dep HR Dir 1000 1 1 1 1 1<br />
HR Admin 1000 1<br />
HR Analyst 1000 1<br />
HR Coord 1000 1<br />
HR Program Mgr 1000 1 1 1 1<br />
HR Tech 1000 2.5 2.5 3 1<br />
Mgmt Asst 1000 1 1 1<br />
Sr Customer Assistance Rep 1000 0.75<br />
Sr HR Tech 1000 1<br />
Program Total: 4 5.5 5.5 6 4.75<br />
11070 Organizational Development<br />
Dep HR Dir 1000 1 1 1 1<br />
Employee Devel Coord 1000 1<br />
HR Generalist 1000 1 1<br />
HR Program Mgr 1000 1<br />
Sr HR Analyst 1000 1 2 1<br />
Program Total: 2 3 3 1 3<br />
18010 Risk Mgmt Trust Fund<br />
Occ Health & Wellness Nurse 2540 0.75<br />
Risk & Safety Analyst 2540 3<br />
Risk Mgmt Claims Analyst 2540 1<br />
Program Total: 1 3.75<br />
Human Resources Total: 30 30 30 21.25 25.5<br />
Fac & Fin Mgmt - 210<br />
1<strong>12</strong>20 Facilities & Financial Mgmt<br />
Dep City Mgr 1000 1 1<br />
Sr Mgmt Asst 1000 1 1<br />
Program Total: 2 2<br />
Fac & Fin Mgmt Total:<br />
2 2<br />
Admin Svcs Admin. - 220<br />
1<strong>12</strong>10 Administration Services Admin.<br />
Dep City Mgr 1000 1 1 1 1<br />
Exec Administrative Asst 1000 1 1 1 1<br />
Exec Administrative Asst II 1000 1 1 1 1<br />
Sr Mgmt Asst 1000 1 1 1 1<br />
Program Total: 2 4 4 4 2<br />
Admin Svcs Admin. Total: 2 4 4 4 2<br />
547<br />
Return to TOC
Schedule Six<br />
Authorized Staffing<br />
Dept Program Name Position Title<br />
Fund FY 2008 FY 2009<br />
FY 2010<br />
FY <strong>2011</strong> FY 20<strong>12</strong><br />
Finance - 221<br />
11310 Finance Administration<br />
Account Spec 1000 1<br />
Dep Finance Dir 1000 2 2 2 1<br />
Finance Dir 1000 1<br />
Finance Dir/CFO 1000 1 1 1<br />
Financial Administrative Coord 1000 1 1<br />
Mgmt Asst 1000 1 1 1 1<br />
Office Support Supv 1000 1 1 1<br />
Revenue Admin 1000 1<br />
Secretary 1000 2 2 2 2<br />
Sr Secretary 1000 1 1 1 1<br />
Program Total: 7 9 8 4 6<br />
11320 Accounting Services<br />
Account Spec 1000 4 3 4 3 2<br />
Account Spec II 1000 2 2 2<br />
Accountant I 1000 5 5 5 4 4<br />
Accountant II 1000 5 5 5 4 4<br />
Accounting Mgr 1000 2 2 2 2 2<br />
Office Support Supv 1000 1 1<br />
Payroll & Accts Payable Supv 1000 1 1 1 1 1<br />
Payroll Spec 1000 2 2<br />
Secretary 1000 1<br />
Program Total: 21 19 19 16 15<br />
11340 License/Collection<br />
Account Spec 1000 0.5<br />
Billing & Compliance Spec 1000 1<br />
Coll Rep 1000 1 1 1 1 1<br />
Reg Licensing & Compl Analyst 1000 2 3 2 2<br />
Sr Applications Analyst 1000 1 1 1 1 1<br />
Sr Billing & Compliance Spec 1000 2 2 2 0.5<br />
Tax & License Mgr 1000 1 1 1 1 1<br />
Tax Auditor 1000 3 3 3 3 2<br />
Program Total: 9.5 10 11 8.5 7<br />
11350 Regulatory & Communication<br />
Regulatory Licensing Analyst 1000 1<br />
548<br />
Return to TOC
Schedule Six<br />
Authorized Staffing<br />
Dept Program Name Position Title<br />
Fund FY 2008 FY 2009<br />
FY 2010<br />
FY <strong>2011</strong> FY 20<strong>12</strong><br />
Finance - 221<br />
17020 Customer Service Office<br />
Account Spec 2360 1 1 1 1 1<br />
Account Spec II 2360 4 4 4 4 4<br />
Billing & Compliance Spec 2360 7 7 7 7 9<br />
Billing Supv 2360 1 1 1 1 1<br />
Business Equip Tech 2360 2 2 2 2 2<br />
Cashier 2360 6 6 6 6 6<br />
Coll Rep 2360 3 3 3 3 2<br />
Customer Relations Supv 2360 1 1 1 1<br />
Duplicating Coord 2360 1 1 1 1<br />
Office Asst 2360 1 1<br />
Reg Licensing & Compl Analyst 2360 1<br />
Revenue Recovery Supv 2360 1 1 1 1 1<br />
Secretary 2360 1 1<br />
Sr Account Spec 2360 5 5 5 5 4<br />
Sr Billing & Compliance Spec 2360 2<br />
Sr Customer Assistance Rep 2360 2.5 2.5 2.5 2.5 2.5<br />
Program Total: 35.5 35.5 35.5 35.5 35.5<br />
Finance Total: 74 73.5 73.5 64 63.5<br />
Info. Technology - 231<br />
11510 Information Technology<br />
Applications Analyst 1000 1 1 1 1 1<br />
Assoc Sys Admin 1000 1 1 1 1 1<br />
Chief Info Technology Officer 1000 1 1 1 1 1<br />
Computer Ops Supv 1000 4<br />
Database Admin 1000 1 1 1 1 2<br />
Dep Chief Info Tech Officer 1000 1 1 1 1 1<br />
Help Desk Support Spec 1000 2 3 3 2 3<br />
Help Desk Supv 1000 1 1 1 1 1<br />
Info Technology Mgr 1000 4 4 1 4 4<br />
Info Technology Project Mgr 1000 1<br />
Mgmt Aide 1000 1 1 1<br />
Network Engineer 1000 1 1 1 1 1<br />
Sr Applications Analyst 1000 1 1 1 1 1<br />
Sr GIS Analyst 1000 1 1 1 1 1<br />
Sr Network Engineer 1000 1 1 1 1 1<br />
Sr Sys Admin 1000 1 1 1 1<br />
Sys Admin 1000 4 3 3 3 3<br />
Sys Analyst 1000 7 6 6 5 3<br />
Program Total: 28 29 29 25 25<br />
11520 Telephones<br />
Voice Comms Admin 1100 1 1 1 1 1<br />
11530 Technology Replacement<br />
Mgmt Aide 1140 1 1 1 1 1<br />
Info. Technology Total: 30 31 31 27 27<br />
549<br />
Return to TOC
Schedule Six<br />
Authorized Staffing<br />
Dept Program Name Position Title<br />
Fund FY 2008 FY 2009<br />
FY 2010<br />
FY <strong>2011</strong> FY 20<strong>12</strong><br />
Management & Budget - 241<br />
11360 Purchasing<br />
Contract Analyst 1000 3 3 3 3 2<br />
Contract Spec 1000 1 1 1<br />
Materials Mgr 1000 1 1 1 1<br />
Program Total: 5 5 5 4 2<br />
11370 Warehouse<br />
Materials Control Asst 1000 1 1 1<br />
Materials Control Spec 1000 2.75 2.75 2.75 2.75 2.75<br />
Materials Logistics Mgr 1000 1 1 1 1 1<br />
Secretary 1000 1 1 1 1 1<br />
Program Total: 5.75 5.75 5.75 4.75 4.75<br />
11610 Budget & Research<br />
Asst Budget Dir 1000 1 1 1 1 1<br />
Budget Analyst 1000 2 2 2 1 1<br />
Budget Coord 1000 1 1<br />
Budget Dir 1000 1 1 1 1 1<br />
Sr Budget Analyst 1000 2 2 2 2 2<br />
Program Total: 6 6 6 6 6<br />
11620 Grants Administration<br />
Grants Admin 1000 1 1 1<br />
Secretary 1000 0.5 0.5 0.5<br />
Sr Mgmt Asst 1000 1 1<br />
Program Total: 1.5 1.5 1.5 1 1<br />
Management & Budget Total: 18.25 18.25 18.25 15.75 13.75<br />
Police Department - 3<strong>12</strong><br />
<strong>12</strong>110 Police Legal Services<br />
Police Officer 1000 3 2 1<br />
Police Sergeant 1000 1<br />
Public Safety Staff Attorney 1000 1 1 1 1<br />
Program Total: 4 4 2 1<br />
<strong>12</strong><strong>12</strong>0 Police Administration<br />
Asst Police Chief 1000 2 2 2 2<br />
Asst Police Dir 1000 1 1 1<br />
Mgmt Aide 1000 1 1<br />
Mgmt Asst 1000 2 2 3 3 3<br />
Police Chief 1000 1 1 1 1 1<br />
Police Crime/Stats Analyst 1000 3 3<br />
Police Lieutenant 1000 1 1 1 1<br />
Police Officer 1000 1 3 3 2 4<br />
Police Plan & Research Analyst 1000 1 1 1 1 1<br />
Police Sergeant 1000 2 4 5 5 4<br />
Police Support Srvcs Supv 1000 2<br />
Police Tech Srvcs Mgr 1000 2 2 1<br />
Sr Secretary 1000 1 1 4 3 3<br />
Victim Assistance Caseworker 1000 1<br />
Program Total: 11 22 26 19 21<br />
550<br />
Return to TOC
Schedule Six<br />
Authorized Staffing<br />
Dept Program Name Position Title<br />
Fund FY 2008 FY 2009<br />
FY 2010<br />
FY <strong>2011</strong> FY 20<strong>12</strong><br />
Police Department - 3<strong>12</strong><br />
<strong>12</strong>130 Central Patrol Bureau<br />
Mgmt Asst 1000 1<br />
Police Aide 1000 1<br />
Police Commander 1000 1 1 1 1 1<br />
Police Community Srvcs Officer 1000 1<br />
Police Crime Prevention Spec 1000 3 3 3 3<br />
Police Lieutenant 1000 4 3 5 5 5<br />
Police Officer 1000 108 105.5 96 101 94<br />
Police Records Tech 1000 1<br />
Police Sergeant 1000 14 14 <strong>12</strong> 13 15<br />
Police Volunteer Coord 1000 1 1<br />
Secretary 1000 1 1 1<br />
Program Total: 134 <strong>12</strong>8.5 <strong>12</strong>0 <strong>12</strong>0 118<br />
<strong>12</strong>150 Crime Investigations<br />
Asst Police Chief 1000 2<br />
Mgmt Aide 1000 5 3 3 3 2<br />
Police Commander 1000 1 1 1 1 1<br />
Police Crime/Stats Analyst 1000 3 1 1<br />
Police Crisis Srvcs Coord 1000 1<br />
Police Identification Supv 1000 1 1 1<br />
Police Identification Tech 1000 5 5 6 5 5<br />
Police Lieutenant 1000 4 3 3 3 3<br />
Police Officer 1000 48 56 58 57 60<br />
Police Officer (Assignment) 1000 1 1<br />
Police Sergeant 1000 7 7 9 9 9<br />
Police Tech Srvcs Bureau Admin 1000 1<br />
Sr Secretary 1000 1 1 1 1 1<br />
Victim Assistance Caseworker 1000 2 3 3 2 2<br />
Program Total: 81 80 85 83 85<br />
<strong>12</strong>160 Police Personnel Management<br />
Police Commander 1000 1 1 1 1 1<br />
Police Crisis Srvcs Coord 1000 1 1<br />
Police Hiring Coord 1000 3 3<br />
Police Lieutenant 1000 1<br />
Police Officer 1000 9 6 <strong>12</strong> 14 14<br />
Police Officer (Assignment) 1000 1 1<br />
Police Sergeant 1000 2 3 5 5 4<br />
Police Tech Srvcs Mgr 1000 1 1<br />
Police Volunteer Coord 1000 1 1 1<br />
Secur Officer 1000 4 4 4 3 3<br />
Secur Srvcs Coord 1000 1 1 1 1 1<br />
Program Total: 19 21 29 25 24<br />
551<br />
Return to TOC
Schedule Six<br />
Authorized Staffing<br />
Dept Program Name Position Title<br />
Fund FY 2008 FY 2009<br />
FY 2010<br />
FY <strong>2011</strong> FY 20<strong>12</strong><br />
Police Department - 3<strong>12</strong><br />
<strong>12</strong>170 Foothills Patrol Bureau<br />
Police Commander 1000 1 1 1 1 1<br />
Police Community Srvcs Officer 1000 1<br />
Police Crime Prevention Spec 1000 3 3 3 3<br />
Police Crime/Stats Analyst 1000 1 1<br />
Police Lieutenant 1000 5 5 4 4 4<br />
Police Officer 1000 90 84.5 95 92 92<br />
Police Sergeant 1000 13 <strong>12</strong> <strong>12</strong> 11 <strong>12</strong><br />
Secretary 1000 1 1 1 1 1<br />
Program Total: 113 106.5 116 110 115<br />
<strong>12</strong>180 Police Support Services<br />
Customer Assistance Rep 1000 1<br />
Police Comm Spec 1000 8.25 1<br />
Police Comm Supv 1000 1<br />
Police Community Srvcs Officer 1000 8 9 8 5<br />
Police Detention Officer 1000 1<br />
Police Hiring Coord 1000 1<br />
Police Identification Supv 1000 1 1<br />
Police Identification Tech 1000 1 1<br />
Police Officer 1000 10 4<br />
Police Polygraph Examiner 1000 1<br />
Police Property/Evid Custodian 1000 3 3 3 3 3<br />
Police Records Tech 1000 15.5 15.5 14.5 <strong>12</strong>.5 11.5<br />
Police Sergeant 1000 1 1<br />
Police Support Srvcs Supv 1000 2 2 2 1 1<br />
Police Tech Srvcs Bureau Admin 1000 1 1<br />
Police Tech Srvcs Mgr 1000 1 1 1 1 1<br />
Property Room Supv 1000 1 1 1 1 1<br />
Public Safety Tech Srvcs Admin 1000 1 1<br />
Sr Secretary 1000 3 3<br />
Srvc Worker III (Fleet) 1000 1 1 1 1<br />
Sys Analyst 1000 1<br />
Program Total: 61.75 44.5 31.5 19.5 24.5<br />
<strong>12</strong>190 Arena-PD Event Staffing<br />
Public Safety Events Scheduler 1000 1<br />
Public Safety Events Scheduler <strong>12</strong>82 1 1 1 1<br />
Program Total: 1 1 1 1 1<br />
<strong>12</strong>215 PD - Tow Administration<br />
Mgmt Aide 1000 1 1 1 1<br />
<strong>12</strong>220 PD - Detention<br />
Police Detention Officer 1000 8 9 9 6 6<br />
Police Support Srvcs Supv 1000 3 3 3 3 2<br />
Police Tech Srvcs Mgr 1000 1 1 1 1 1<br />
Program Total: <strong>12</strong> 13 13 10 9<br />
552<br />
Return to TOC
Schedule Six<br />
Authorized Staffing<br />
Dept Program Name Position Title<br />
Fund FY 2008 FY 2009<br />
FY 2010<br />
FY <strong>2011</strong> FY 20<strong>12</strong><br />
Police Department - 3<strong>12</strong><br />
<strong>12</strong>230 PD - Communications<br />
Comm Sys Tech 1000 1 1 1<br />
Police Comm Spec 1000 23.25 26.5 27.5 24.5 23.5<br />
Police Comm Supv 1000 4 5 5 5 4<br />
Police Comm Sys Spec 1000 1 1 1 1 1<br />
Police Comm Sys Tech 1000 1 1<br />
Police Ops Mgr 1000 1 1 1 1 1<br />
Program Total: 30.25 34.5 35.5 32.5 30.5<br />
<strong>12</strong>231 Stadium - PD Event Staffing<br />
Mgmt Aide 1000 1<br />
Public Safety Events Scheduler 1000 1<br />
Mgmt Aide <strong>12</strong>81 1 1 1 1<br />
Public Safety Events Scheduler <strong>12</strong>81 1 1 1 1<br />
Program Total: 2 2 2 2 2<br />
<strong>12</strong>233 PD - Special Operations<br />
Mgmt Aide 1000 1<br />
Police Aide 1000 3 4 4<br />
Police Commander 1000 1 1 1 1 1<br />
Police Lieutenant 1000 2 4 3 3 3<br />
Police Officer 1000 24 27 25 24 26<br />
Police Officer (Assignment) 1000 1 1 1 1 1<br />
Police Sergeant 1000 9 10 9 9 8<br />
Police Support Srvcs Supv 1000 1 1 1<br />
Program Total: 42 48 44 38 39<br />
<strong>12</strong>235 PD - Emergency Management<br />
Asst Homeland Security Dir 1000 1<br />
Building Maintenance Worker 1000 1 1<br />
Emergency Mgmt Admin 1000 1<br />
Emergency Srvcs Coord 1000 1 1<br />
Homeland Security Dir 1000 1<br />
Mgmt Aide 1000 1 1<br />
Police Ops Mgr 1000 1<br />
Sys Admin 1000 1 1<br />
Program Total: 6 6<br />
553<br />
Return to TOC
Schedule Six<br />
Authorized Staffing<br />
Dept Program Name Position Title<br />
Fund FY 2008 FY 2009<br />
FY 2010<br />
FY <strong>2011</strong> FY 20<strong>12</strong><br />
Police Department - 3<strong>12</strong><br />
<strong>12</strong>310 Patrol - Special Revenue Fund<br />
Computer Ops Supv 1700 1<br />
Database Admin 1700 1 1 1<br />
Info Technology Mgr 1700 1 1<br />
Info Technology Project Mgr 1700 1<br />
Legal Asst 1700 1 1 1<br />
Mgmt Aide 1700 6 4 4 5<br />
Mgmt Asst 1700 2<br />
Police Aide 1700 3 1 1 1<br />
Police Comm Spec 1700 4 10 10 10 9<br />
Police Detention Officer 1700 6 9 9 9 8<br />
Police Hiring Coord 1700 1 1 1<br />
Police Lieutenant 1700 1 1 1 1<br />
Police Officer 1700 32 75 75 74 74<br />
Police Officer Trainee 1700 1 1<br />
Police Records Tech 1700 3 3 3 3<br />
Police Sergeant 1700 4 4 4 4<br />
Police Support Srvcs Supv 1700 1 1 1 2<br />
Police Tech Srvcs Mgr 1700 1 1 1<br />
Programs Admin 1700 1 1<br />
Secretary 1700 1 1 1<br />
Secur Officer 1700 1 2 2 1<br />
Sr HR Analyst 1700 1 1<br />
Sys Analyst 1700 1<br />
Victim Assistance Caseworker 1700 1 1 1 1<br />
Program Total: 42 118 118 118 118<br />
<strong>12</strong>390 PS Training Ops - Police<br />
Police Lieutenant 2530 1 1 1 1 1<br />
Secur Officer 2530 1 1 1 1 1<br />
Program Total: 2 2 2 2 2<br />
32030 State RICO<br />
Secretary 1860 0.5 0.5 0.5 0.5 0.5<br />
33002 Victim Rights - PD<br />
Victim Assistance Caseworker 1840 1 1 1<br />
33018 VOCA 2003-113<br />
Victim Assistance Caseworker 1840 2 2 1 1 1<br />
Police Department Total: 557.5 628.5 628.5 590.5 598.5<br />
554<br />
Return to TOC
Schedule Six<br />
Authorized Staffing<br />
Dept Program Name Position Title<br />
Fund FY 2008 FY 2009<br />
FY 2010<br />
FY <strong>2011</strong> FY 20<strong>12</strong><br />
Fire Department - 331<br />
<strong>12</strong>410 Fire Administration<br />
Asst Fire Chief 1000 2 3 2 2<br />
Dep Fire Chief (40 hrs) 1000 3 2 2<br />
Dept Accting & Budget Mgr 1000 1<br />
Fire Battalion Chief (40 Hrs) 1000 1 2<br />
Fire Budget & Project Mgr 1000 1 1<br />
Fire Captain (40 Hrs) 1000 1<br />
Fire Captain (52 Hrs) 1000 1 1 1<br />
Fire Chief 1000 1 1 1 1 1<br />
Fire Comm Outreach Coord 1000 2 1 2<br />
Fire Finance/Budget Coord 1000 1 2 1 1 1<br />
Fire Mgmt Analyst 1000 1 1<br />
Mgmt Aide 1000 1 2 1 1 1<br />
Mgmt Asst 1000 1 2 2 2<br />
Programs Admin 1000 1 1<br />
Secretary 1000 0.5 0.5<br />
Sr HR Analyst 1000 1 1<br />
Sr Secretary 1000 0.5<br />
Program Total: 4.5 13.5 17.5 13 14<br />
<strong>12</strong>415 Fire Admin Services<br />
Fire Finance/Budget Coord 1000 1<br />
Mgmt Aide 1000 1<br />
Program Total: 2<br />
<strong>12</strong>420 Fire Life Safety Services Adm.<br />
Asst Fire Chief 1000 2<br />
Fire Battalion Chief (40 Hrs) 1000 1 1<br />
Program Total: 3 1<br />
<strong>12</strong>421 Fire Special Operations<br />
Sr HR Analyst 1000 1<br />
<strong>12</strong>422 Fire Operations<br />
Dep Fire Chief (52 hrs) 1000 3 3 3<br />
Fire Battalion Chief (40 Hrs) 1000 1 3 4 1<br />
Fire Battalion Chief (52 Hrs) 1000 4 5 5 5 4<br />
Fire Captain (40 Hrs) 1000 2 8 1<br />
Fire Captain (52 Hrs) 1000 49 49 49 44 51<br />
Fire Comm Outreach Coord 1000 1 1 1 1<br />
Fire Crisis Response Vol Coord 1000 1 1 1 1 1<br />
Fire Engineer (40 Hrs) 1000 3 1<br />
Fire Engineer (52 Hrs) 1000 43 44 46 43 46<br />
Fire Fighter (40 Hrs) 1000 4 4<br />
Fire Fighter (52 Hrs) 1000 94 83 84 75 74<br />
Programs Admin 1000 1 1<br />
Program Total: 192 186 195 188 188<br />
555<br />
Return to TOC
Schedule Six<br />
Authorized Staffing<br />
Dept Program Name Position Title<br />
Fund FY 2008 FY 2009<br />
FY 2010<br />
FY <strong>2011</strong> FY 20<strong>12</strong><br />
Fire Department - 331<br />
<strong>12</strong>433 Fire Resource Management<br />
Dep Fire Chief (40 hrs) 1000 1<br />
Fire Battalion Chief (40 Hrs) 1000 1 2 1<br />
Fire Battalion Chief (52 Hrs) 1000 1<br />
Fire Captain (40 Hrs) 1000 1 1 1<br />
Fire Engineer (52 Hrs) 1000 1<br />
Mgmt Asst 1000 1<br />
Programs Admin 1000 1 1<br />
Public Safety Tech Srvcs Admin 1000 1 1<br />
Srvc Worker I 1000 1 1 1<br />
Srvc Worker II 1000 1 1 1 2 2<br />
Sys Analyst 1000 1 1 1 1<br />
Program Total: 7 7 6 4 5<br />
<strong>12</strong>434 Fire Training<br />
Fire Battalion Chief (40 Hrs) 1000 1<br />
Fire Battalion Chief (52 Hrs) 1000 1 1<br />
Fire Captain (40 Hrs) 1000 2 2<br />
Program Total: 4 3<br />
<strong>12</strong>436 Fire Medical Services & Health<br />
Fire Battalion Chief (40 Hrs) 1000 2<br />
Fire Battalion Chief (52 Hrs) 1000 2<br />
Fire Captain (52 Hrs) 1000 1<br />
Fire Engineer (52 Hrs) 1000 1<br />
Program Total: 3 3<br />
<strong>12</strong>437 Fire Assessment & Planning<br />
Fire Budget & Project Mgr 1000 1<br />
<strong>12</strong>441 Fire Marshal's Office<br />
Asst Fire Marshal 1000 1 2 2 1 1<br />
Fire Battalion Chief (40 Hrs) 1000 1 1 1<br />
Fire Captain (52 Hrs) 1000 1<br />
Fire Insp I 1000 2 2 2 3 2<br />
Fire Insp II 1000 4 4 4 3 5<br />
Fire Marshal 1000 1 1 1<br />
Fire Protection Engineer I 1000 1 1<br />
Mgmt Aide 1000 1 1 1 1<br />
Plans Examiner 1000 1 1 1 1 1<br />
Program Total: <strong>12</strong> <strong>12</strong> <strong>12</strong> 10 10<br />
<strong>12</strong>444 Fire Community Services<br />
Fire Battalion Chief (40 Hrs) 1000 1 2<br />
Fire Comm Outreach Coord 1000 3 2<br />
Fire Fighter (52 Hrs) 1000 1<br />
Program Total: 4 5<br />
<strong>12</strong>490 Arena - Fire Event Staffing<br />
Secretary 1000 1<br />
Secretary <strong>12</strong>82 1 1 1 1<br />
Program Total: 1 1 1 1 1<br />
556<br />
Return to TOC
Schedule Six<br />
Authorized Staffing<br />
Dept Program Name Position Title<br />
Fund FY 2008 FY 2009<br />
FY 2010<br />
FY <strong>2011</strong> FY 20<strong>12</strong><br />
Fire Department - 331<br />
<strong>12</strong>491 Ambulance Services<br />
Fire Captain (40 Hrs) 1000 1 1 1<br />
Fire Captain (52 Hrs) 1000 1 1<br />
Secretary 1000 1 1<br />
Sr Secretary 1000 1 1 1<br />
Program Total: 2 2 2 2 2<br />
<strong>12</strong>590 PS Training Ops - Fire<br />
Dep Fire Chief (40 hrs) 2530 1 1 1<br />
Fire Battalion Chief (40 Hrs) 2530 1 1<br />
Fire Captain (40 Hrs) 2530 1 1 1 1 1<br />
Mgmt Aide 2530 1 1 1 1 1<br />
Mgmt Asst 2530 1 1 1 1 1<br />
Secretary 2530 1 1 1 1 1<br />
Srvc Worker II 2530 1 1 1 1 1<br />
Program Total: 6 6 6 6 6<br />
<strong>12</strong>610 Fire - Special Revenue Fund<br />
Applications Analyst 1720 1<br />
Comm Sys Tech 1720 1<br />
Customer Assistance Rep 1720 1 1 1 1<br />
Emergency Srvcs Coord 1720 1 1<br />
Fire Battalion Chief (40 Hrs) 1720 2 2 1<br />
Fire Battalion Chief (52 Hrs) 1720 1 2<br />
Fire Captain (40 Hrs) 1720 6 5 1 1<br />
Fire Captain (52 Hrs) 1720 1 1 5 5<br />
Fire Crisis Response Vol Coord 1720 3 3 2 2<br />
Fire Dept Staff Counselor 1720 1 1 1 1<br />
Fire EMS Coordinator 1720 1 1 1<br />
Fire Engineer (52 Hrs) 1720 4 4 4 4 4<br />
Fire Fighter (40 Hrs) 1720 3 1<br />
Fire Fighter (52 Hrs) 1720 17 23 23 26 27<br />
Fire Insp I 1720 1<br />
Fire Insp II 1720 1 1 1<br />
Fire Protection Engineer II 1720 1 1<br />
Mgmt Aide 1720 2 2 2 2<br />
Secretary 1720 1 1<br />
Shop Maint Coord 1720 1 1 1 1<br />
Srvc Worker III 1720 2 1 1 1<br />
Program Total: 21 50 50 51 51<br />
Fire Department Total: 263.5 289.5 289.5 275 277<br />
Fire Department - 333<br />
<strong>12</strong>492 Air-Med & Logistics Ops (HALO)<br />
Fire Fighter (52 Hrs) 1000 3 3 3 3<br />
Mgmt Aide 1000 1 1 1 1<br />
Program Total: 4 4 4 4<br />
Fire Department Total: 4 4 4 4<br />
557<br />
Return to TOC
Schedule Six<br />
Authorized Staffing<br />
Dept Program Name Position Title<br />
Fund FY 2008 FY 2009<br />
FY 2010<br />
FY <strong>2011</strong> FY 20<strong>12</strong><br />
Homeland Security - 341<br />
<strong>12</strong>810 Homeland Security Admin.<br />
Homeland Security Dir 1000 1 1 1<br />
<strong>12</strong>820 Emergency Operations Ctr (EOC)<br />
Asst Homeland Security Dir 1000 1 1 1<br />
Building Maintenance Worker 1000 1 1 1<br />
Emergency Srvcs Coord 1000 2<br />
Mgmt Aide 1000 1 1 1<br />
Operations & Training Officer 1000 1 1<br />
Sys Admin 1000 1 1 1<br />
Sys Analyst 1000 1 1<br />
Program Total: 6 6 6<br />
Homeland Security Total:<br />
7 7 7<br />
Comm. Services Adm - 411<br />
14510 Comm. Services Admin.<br />
Dep City Mgr 1000 1 1 1 1<br />
Sr Mgmt Asst 1000 1 1 1<br />
Program Total: 2 2 2 1<br />
Comm. Services Adm Total:<br />
2 2 2 1<br />
Parks & Recreation - 421<br />
13010 Pool Maintenance<br />
Srvc Worker III (Parks) 1000 3 3 3 2 2<br />
13020 Park Irrigation<br />
Crewleader (Parks) 1000 1 1 1<br />
Srvc Worker II (Parks) 1000 1 1 1 1 1<br />
Srvc Worker III (Parks) 1000 2 2 2 2 2<br />
Program Total: 4 4 4 3 3<br />
13030 Parks CIP & Planning<br />
Dep Parks & Rec Dir 1000 1 1 1<br />
Parks & Rec Projects Coord 1000 2 2 2 2 2<br />
Program Total: 3 3 3 2 2<br />
13040 Parks Maintenance<br />
Crewleader (Parks) 1000 3 3 3 2 2<br />
Dep Parks & Rec Dir 1000 1 1 1 1 1<br />
Landscape Gard/Horticulturist 1000 1 1 1 1 1<br />
Park Mgr 1000 2 2 2<br />
Playground Equip Srvc Worker 1000 2 2 2 2 2<br />
Secretary 1000 1 1 1 1 1<br />
Sr Heavy Equip Srvc Worker 1000 1 1 1 1 1<br />
Srvc Worker I (Parks) 1000 4 4<br />
Srvc Worker II (Parks) 1000 9 9 13 10 8<br />
Srvc Worker III (Parks) 1000 4 4 3 5 4<br />
Program Total: 28 28 27 23 20<br />
558<br />
Return to TOC
Schedule Six<br />
Authorized Staffing<br />
Dept Program Name Position Title<br />
Fund FY 2008 FY 2009<br />
FY 2010<br />
FY <strong>2011</strong> FY 20<strong>12</strong><br />
Parks & Recreation - 421<br />
14610 Parks & Recreation Admin.<br />
Parks & Rec Dir 1000 1 1 1 1 1<br />
Sr Mgmt Asst 1000 1 1 1 1<br />
Program Total: 2 2 2 2 1<br />
14620 Glendale Community Center<br />
Rec Programmer 1000 1 1 1 1 1<br />
Sr Rec Coord 1000 2 2 2 1 1<br />
Program Total: 3 3 3 2 2<br />
14630 Recreation Support Services<br />
Mgmt Asst 1000 1 1 1 1 1<br />
Rec Accounts Coord 1000 1 1 1 1 1<br />
Secretary 1000 3 3 3 3 3<br />
Sr Secretary 1000 1 1 1 1 1<br />
Srvc Worker II (Parks) 1000 1 1 1<br />
Support Srvc Supv 1000 1 1 1<br />
Program Total: 8 8 8 6 6<br />
14640 Adult Center<br />
Rec Coord 1000 2 2 2 2 2<br />
Rec Mgr 1000 1 1 1 1 1<br />
Secretary 1000 2 2 2 2 2<br />
Srvc Worker I (Parks) 1000 1<br />
Srvc Worker II (Parks) 1000 1 1 2 2<br />
Support Srvc Supv 1000 1 1<br />
Program Total: 6 6 6 8 8<br />
14650 Youth and Teen<br />
Rec Coord 1000 1 1<br />
Rec Mgr 1000 1 1 1 1 1<br />
Rec Programmer 1000 4.5 4.5 5.25 4.5 3.75<br />
Sr Rec Coord 1000 1 1 2 1 2<br />
Program Total: 7.5 7.5 8.25 6.5 6.75<br />
14660 Special Events and Programs<br />
Rec Coord 1000 1 1 1<br />
Rec Mgr 1000 1 1 1 1 1<br />
Program Total: 2 2 2 1 1<br />
14670 Sports and Health<br />
Dep Parks & Rec Dir 1000 1 1 1 1 1<br />
Park Mgr 1000 1 1<br />
Rec Coord 1000 3 3 3 1 1<br />
Rec Mgr 1000 1 1 1 1 1<br />
Srvc Worker II (Parks) 1000 1 1<br />
Program Total: 5 5 5 5 5<br />
14680 Aquatics<br />
Sr Rec Coord 1000 1 1 1 1 1<br />
559<br />
Return to TOC
Schedule Six<br />
Authorized Staffing<br />
Dept Program Name Position Title<br />
Fund FY 2008 FY 2009<br />
FY 2010<br />
FY <strong>2011</strong> FY 20<strong>12</strong><br />
Parks & Recreation - 421<br />
14690 Audio/Visual<br />
Audio/Visual Coordinator 1000 1 1 1<br />
Audio/Visual Network Spec 1000 1 1 1<br />
Program Total: 2 2 2<br />
14700 Marketing - Parks & Rec<br />
Mgmt Asst 1000 1 1 1 1 1<br />
Rec Programmer 1000 0.75 0.75<br />
Program Total: 1 1 1 1.75 1.75<br />
14710 Park Rangers<br />
Park Mgr 1000 1 1 1<br />
Park Ranger 1000 3 3 3 3 3<br />
Srvc Worker III (Parks) 1000 1<br />
Program Total: 4 4 5 3 3<br />
14740 Copper Canyon HS Youth Dev Prg<br />
Rec Programmer 1000 0.75 0.75<br />
14760 Historic Sahuaro Ranch<br />
Rec Coord 1000 1 1 1<br />
Rec Programmer 1000 1 1<br />
Sr Rec Coord 1000 2 2 2 2 2<br />
Program Total: 3 3 3 3 3<br />
14830 Rec Self Sust-Foothills Rec<br />
Rec Coord 1880 1 1<br />
14840 Sports Self Sustaining<br />
Rec Coord 1880 1 1<br />
14850 Youth and Teen Self Sustaining<br />
Rec Programmer 1880 5 5 5 5 5<br />
35008 Youth Football Hub Grant<br />
Rec Coord 1840 1 1<br />
Parks & Recreation Total: 89.25 89.25 88.25 76.25 72.5<br />
Parks & Recreation - 422<br />
14720 Foothills Recreation Center<br />
Building Maintenance Worker 1000 1 1 1 1 1<br />
Office Support Supv 1000 1 1 1 1 1<br />
Rec Mgr 1000 1 1 1 1 1<br />
Rec Programmer 1000 3 3 3 2 2.75<br />
Secretary 1000 1 1 1<br />
Sr Rec Coord 1000 2 2 2 2 1<br />
Srvc Worker II (Parks) 1000 1 1 1 1 1<br />
Program Total: 10 10 10 8 7.75<br />
Parks & Recreation Total: 10 10 10 8 7.75<br />
560<br />
Return to TOC
Schedule Six<br />
Authorized Staffing<br />
Dept Program Name Position Title<br />
Fund FY 2008 FY 2009<br />
FY 2010<br />
FY <strong>2011</strong> FY 20<strong>12</strong><br />
Civic Center - 431<br />
11710 Civic Center<br />
Civic Center Event Coord 1740 3 3 3 3 3<br />
Civic Center Mgr 1740 1 1 1<br />
Civic Center Ops Coord 1740 1 1 1 1 1<br />
Mgmt Aide 1740 1<br />
Secretary 1740 1 1 1 1<br />
Srvc Worker III (Bldg Maint) 1740 1 1 1 1 1<br />
Program Total: 7 7 7 6 6<br />
Civic Center Total: 7 7 7 6 6<br />
Comm. Partnerships - 441<br />
15010 Community Revitalization<br />
Dep City Mgr 1000 1<br />
Revitalization Admin 1000 1 1 1 1 1<br />
Revitalization Grants Supv 1000 1 1 1 1 1<br />
Program Total: 2 2 2 2 3<br />
15015 Neighborhood Partnership<br />
Mgmt Aide 1000 0.5 0.5 0.5<br />
Neighborhood Partnership Admin 1000 1 1 1 1 1<br />
Neighborhood Srvcs Coord 1000 3 3 3 2 3<br />
Sr Secretary 1000 1 1 1 1 1<br />
Program Total: 5 5.5 5.5 4 5.5<br />
15025 Mega Events - N'Hood/Volunteer<br />
Rec Programmer 1000 0.5<br />
17910 Community Housing<br />
Account Spec II 2500 1 1 1 1 1<br />
Accountant I 2500 1 1 1 1<br />
Bldg Maint Leader 2500 1 1<br />
Bldg Maint Supv 2500 1 1 1 1 1<br />
Building Maintenance Worker 2500 3 3 3 2 2<br />
Community Partnerships Dir 2500 1 1 1 1 1<br />
Housing Assistance Rep 2500 9 10 10 10 10<br />
Housing Srvcs Admin 2500 1 1 1 1 1<br />
Housing Supv 2500 1 1 1 1 1<br />
Mgmt Asst 2500 1 1 1<br />
Secretary 2500 3 2 2 2 2<br />
Sr Mgmt Asst 2500 1 1 2 1 1<br />
Sr Secretary 2500 1 1 1 1 1<br />
Srvc Worker I (Bldg Maint) 2500 1 1 1 1 1<br />
Program Total: 25 25 25 24 24<br />
561<br />
Return to TOC
Schedule Six<br />
Authorized Staffing<br />
Dept Program Name Position Title<br />
Fund FY 2008 FY 2009<br />
FY 2010<br />
FY <strong>2011</strong> FY 20<strong>12</strong><br />
Comm. Partnerships - 441<br />
31001 CDBG Programs<br />
Account Spec II 1320 1 1 1 1 1<br />
Mgmt Asst 1320 0.75 0.75 0.75 0.75 0.75<br />
Revitalization Coord 1320 4 4 4 4 4<br />
Revitalization Supv 1320 1 1 1 1 1<br />
Secretary 1320 1 1 1 1 1<br />
Sr Secretary 1320 1 1 1 1 1<br />
Program Total: 8.75 8.75 8.75 8.75 8.75<br />
Comm. Partnerships Total: 41.25 41.25 41.25 38.75 41.25<br />
Library & Arts - 452<br />
15220 Library<br />
Account Spec 1000 2 2 2 2 2<br />
Computer Ops Supv 1000 1 1<br />
Courier 1000 1 1 1 1 1<br />
Creative Designer 1000 1<br />
Librarian I 1000 3.5 2.5 1.5 3.5<br />
Librarian II 1000 21.25 21.25 22.25 16.25 18.75<br />
Librarian III 1000 6 6 6 3 3<br />
Librarian IV 1000 4 4 4 4 4<br />
Library Asst I 1000 3 3 3 4 4<br />
Library Asst II 1000 3 3 3 1.63 1.63<br />
Library Asst III 1000 13.75 13.75 13.75 13.25 13.25<br />
Library Circulation Clerk 1000 11.26 11.26 11.26<br />
Library Dir 1000 1 1 1 1 1<br />
Library Graphics Coord 1000 1 1 1 1<br />
Library Mgr 1000 5 6 6 5 4<br />
Library Ops Supv 1000 5 5 4 4 4<br />
Library Technology Coord 1000 2 2 1<br />
Library Technology Supv 1000 1 1 1 1 1<br />
Mgmt Asst 1000 1 1 1 1 1<br />
PC Support Specialist II 1000 3 3 3 2 2<br />
Public Service Asst 1000 2.63 6.5<br />
Secretary 1000 1 1<br />
Program Total: 86.76 86.76 86.76 69.26 70.13<br />
15230 Arts Maintenance - Admin.<br />
Arts & Cultural Admin 1000 1 1 1<br />
Library & Arts Total: 87.76 87.76 87.76 69.26 70.13<br />
Grants - 470<br />
32<strong>12</strong>3 Domestic Violence Grant<br />
Mgmt Asst 1840 1<br />
32136 DV Pilot Project Grant<br />
Mgmt Asst 1840 1 1 1 1<br />
Grants Total: 1 1 1 1 1<br />
562<br />
Return to TOC
Schedule Six<br />
Authorized Staffing<br />
Dept Program Name Position Title<br />
Fund FY 2008 FY 2009<br />
FY 2010<br />
FY <strong>2011</strong> FY 20<strong>12</strong><br />
Community Dev Admin - 511<br />
15510 CD Deputy City Manager<br />
Dep City Mgr 1000 1 1 1 1 1<br />
Exec Administrative Asst 1000 1<br />
Exec Administrative Asst II 1000 1<br />
Sr Mgmt Asst 1000 1<br />
Program Total: 4 1 1 1 1<br />
Community Dev Admin Total: 4 1 1 1 1<br />
Building Safety - 521<br />
15610 Building Safety<br />
Asst Bldg Safety Dir 1000 1 1 1 1 1<br />
Asst Dep City Mgr 1000 1 1<br />
Bldg Insp 1000 4 4 4 4 3<br />
Bldg Insp Spec 1000 8 7 7 4 4<br />
Bldg Safety Dir 1000 1 1 1<br />
Plans Examiner 1000 3 3 3 2 2<br />
Secretary 1000 1 1 1 1 1<br />
Sr Bldg Insp 1000 4 5 5 4 5<br />
Sr Mgmt Asst 1000 1 1 1 1 1<br />
Sr Plans Examiner 1000 1 1 1 1 1<br />
Sr Secretary 1000 1 1 1 1 1<br />
Structural Plans Examiner 1000 1 1 1 1 1<br />
Program Total: 26 26 26 21 21<br />
15620 Development Services Center<br />
Bldg Safety Mgr 1000 1 1 1 1 1<br />
Customer Assistance Rep 1000 2 2 2<br />
Development Plans Tech 1000 2 2 2 2 2<br />
Development Srvcs Rep 1000 4 2 2 1 2<br />
Development Srvcs Supv 1000 1 1 1<br />
Sr Development Srvcs Rep 1000 2 2 2 1<br />
Program Total: 10 10 10 6 6<br />
15630 Westgate-Bldg Safety Rvw/Insp.<br />
Bldg Insp Spec 1000 11 9<br />
Development Plans Tech 1000 2 1<br />
Plans Examiner 1000 1 1<br />
Sr Bldg Insp 1000 1 1<br />
Program Total: 15 <strong>12</strong><br />
17510 Cross Connection Control<br />
Bldg Insp 2400 1 1 1 1 1<br />
Secretary 2400 0.75 0.75 0.75 0.75 0.75<br />
Sr Bldg Insp 2400 1 1 1 1 1<br />
Program Total: 2.75 2.75 2.75 2.75 2.75<br />
Building Safety Total: 53.75 50.75 38.75 29.75 29.75<br />
563<br />
Return to TOC
Schedule Six<br />
Authorized Staffing<br />
Dept Program Name Position Title<br />
Fund FY 2008 FY 2009<br />
FY 2010<br />
FY <strong>2011</strong> FY 20<strong>12</strong><br />
Planning - 531<br />
15910 Planning Administration<br />
Planning Dir 1000 1 1 1 1 1<br />
Sr Mgmt Asst 1000 1 1 1<br />
Sr Secretary 1000 3 3 3 2 2<br />
Program Total: 5 5 5 3 3<br />
15920 Zoning Admin & Tech. Assist.<br />
Assoc Planner 1000 2<br />
Planner 1000 1<br />
Sr Planner 1000 1<br />
Zoning Admin 1000 1<br />
Program Total: 5<br />
15930 Current Planning<br />
Assoc Planner 1000 1 1<br />
Dep Planning Dir 1000 1 1 1<br />
Landscape Architect 1000 1<br />
Planner 1000 3 2 2 2 1<br />
Principal Planner 1000 1 2 2 2 1<br />
Sr Planner 1000 2 4 4 2 2<br />
Program Total: 8 10 10 6 4<br />
15940 Long-Range Planning & Research<br />
Dep Planning Dir 1000 1 1 1<br />
Planner 1000 1 1<br />
Planning Tech 1000 1 1 1 1 1<br />
Sr Planner 1000 1 1 1 1 1<br />
Program Total: 3 4 4 2 2<br />
Planning Total: 21 19 19 11 9<br />
Economic Development - 540<br />
16010 Economic Development<br />
Economic Development Admin 1000 3 4 4 3 3<br />
Economic Development Dir 1000 1 1 1 1 1<br />
Mgmt Asst 1000 1 1 1<br />
Sr Marketing & Comm Mgr 1000 1 1<br />
Sr Mgmt Asst 1000 1 1<br />
Program Total: 6 7 6 5 5<br />
16040 Downtown Beaut. & Promotion<br />
Secur Officer 1000 2 2 2 2 2<br />
Srvc Worker II 1000 2 2 2 2 2<br />
Program Total: 4 4 4 4 4<br />
Economic Development Total: 10 11 10 9 9<br />
564<br />
Return to TOC
Schedule Six<br />
Authorized Staffing<br />
Dept Program Name Position Title<br />
Fund FY 2008 FY 2009<br />
FY 2010<br />
FY <strong>2011</strong> FY 20<strong>12</strong><br />
Code Compliance - 550<br />
14410 Code Compliance<br />
Asst Code Compliance Dir 1000 1 1 1 1 1<br />
Code Compliance Dir 1000 1 1 1 1 1<br />
Code Compliance Supv 1000 2 2 2 2 2<br />
Code Insp I 1000 7 6 4 2 3<br />
Code Insp II 1000 4 5 3 7 6<br />
Code Insp III 1000 2 2 6 2 2<br />
Mgmt Asst 1000 1 1 1 1 1<br />
Secretary 1000 2.5 2.5 2.5 2 2<br />
Sr Secretary 1000 1 1 1 1 1<br />
Program Total: 21.5 21.5 21.5 19 19<br />
Code Compliance Total: 21.5 21.5 21.5 19 19<br />
Public Works Admin. - 611<br />
13310 Public Works Administration<br />
Dep City Mgr 1000 1 1 1 1<br />
Public Works Admin. Total:<br />
1 1 1 1<br />
Field Operations - 620<br />
13410 Field Operations Admin.<br />
Account Spec II 1000 1 1 1<br />
Dep Field Ops Dir 1000 1 1 1 1 1<br />
Dispatcher/Router 1000 2 2 2<br />
Field Ops Admin Supv 1000 1 1 1<br />
Field Ops Dir 1000 1 1 1 1 1<br />
Sr Mgmt Asst 1000 1 1 1<br />
Sr Secretary 1000 1 1 1<br />
Program Total: 8 8 8 2 2<br />
13420 Cemetery<br />
Crewleader (Parks) 1000 1 1 1 1 1<br />
Srvc Worker II (Parks) 1000 1<br />
Srvc Worker III (Parks) 1000 1 1 1 1<br />
Program Total: 2 2 2 2 2<br />
13440 Graffiti Removal<br />
Srvc Worker II 1000 1 1 1 1<br />
Srvc Worker II (Airport) 1000 1 1 1 1 1<br />
Srvc Worker II (Streets) 1000 2 2 2 1 1<br />
Program Total: 3 4 4 3 3<br />
13450 Facilities Management<br />
Bldg Maint Leader 1000 2 2 2 2 1<br />
Bldg Maint Supv 1000 2 2 2 1 2<br />
Building Maintenance Worker 1000 16 16 16 14 13<br />
Facilities Mgmt Supt 1000 1 1 1<br />
Program Total: 21 21 21 17 16<br />
565<br />
Return to TOC
Schedule Six<br />
Authorized Staffing<br />
Dept Program Name Position Title<br />
Fund FY 2008 FY 2009<br />
FY 2010<br />
FY <strong>2011</strong> FY 20<strong>12</strong><br />
Field Operations - 620<br />
13460 Custodial Services<br />
Custodial Supv 1000 2 1 1 1 1<br />
Custodian 1000 14 15 15 13 10<br />
Custodian Lead 1000 4 4 4 4 4<br />
Program Total: 20 20 20 18 15<br />
13480 PS Training Ops - Fac. Mgmt.<br />
Building Maintenance Worker 2530 1 1 1 1<br />
Custodian 2530 3 3 3 2 3<br />
Program Total: 4 4 4 2 4<br />
13510 Equipment Management<br />
Buyer I 1040 1 1 1 1 1<br />
Equip Mechanic I 1040 2 5 5 4 3<br />
Equip Mechanic II 1040 10 10 9 9 9<br />
Equip Mechanic Spec 1040 16 17 16 15 14<br />
Equip Mgmt Supt 1040 1 1 1 1 1<br />
Fleet Sys Coord 1040 1 1 1<br />
Fleet Tire Spec 1040 2<br />
Paint & Body Spec 1040 1<br />
Shop Maint Coord 1040 2 2 2 2 2<br />
Shop Supv 1040 2 2 2 2 2<br />
Srvc Worker I 1040 1 1 1<br />
Srvc Writer 1040 1 1 1<br />
Welder\Fabricator 1040 2 1 1 1<br />
Program Total: 41 41 40 36 33<br />
13530 Parts Store Operations<br />
Buyer II 1040 1 1 1 1 1<br />
16710 Right-<strong>of</strong>-Way Maintenance<br />
Crewleader (Streets) 1340 2 2 2 2 2<br />
Engineering Insp II 1340 1 1 1 1<br />
PC Oper 1340 1 1 1<br />
Service Worker III (Streets) 1340 8 8 8 7 7<br />
Srvc Worker II (Streets) 1340 4 4 3 3 3<br />
Streets Supv 1340 1 1 1 1<br />
Program Total: 17 17 16 13 13<br />
16720 Street Maintenance<br />
Crewleader (Streets) 1340 7 7 7 5 5<br />
Engineering Insp II 1340 1 1 2 2 2<br />
Heavy Equip Oper 1340 1 1 1 1 1<br />
Mgmt Asst 1340 1 1 1 1<br />
PC Oper 1340 1<br />
Service Worker III (Streets) 1340 8 9 6 5 6<br />
Srvc Worker II (Streets) 1340 18 17 14 11 9<br />
Streets Supt 1340 1 1 1 1 1<br />
Streets Supv 1340 3 3 3 2 2<br />
Program Total: 40 40 35 28 27<br />
566<br />
Return to TOC
Schedule Six<br />
Authorized Staffing<br />
Dept Program Name Position Title<br />
Fund FY 2008 FY 2009<br />
FY 2010<br />
FY <strong>2011</strong> FY 20<strong>12</strong><br />
Field Operations - 620<br />
16730 Street Cleaning<br />
Equipment Operator (Streets) 1340 4 4 2<br />
Service Worker III (Streets) 1340 1 1 1<br />
Program Total: 5 5 3<br />
17710 Landfill<br />
Crewleader (Landfill) 2440 1 1 1 1 1<br />
Landfill Insp 2440 1 1 1 1 1<br />
Landfill Oper 2440 5 5 5 5 5<br />
Landfill Supv 2440 1 1 1 1 1<br />
Mgmt Asst 2440 1 1 1 1<br />
PC Oper 2440 1<br />
Sr Equip Mechanic Special 2440 1 1 1 1 1<br />
Srvc Worker I 2440 1 1 1 2 2<br />
Srvc Worker I (Landfill) 2440 2 2 2 1 1<br />
Srvc Worker II (Landfill) 2440 2 2 2 2 2<br />
Weigh Scale Oper 2440 4 4 4 4 4<br />
Program Total: 19 19 19 19 19<br />
17730 Solid Waste Admin<br />
Account Spec II 2440 3 1 1 2 2<br />
Dep Field Ops Dir 2440 1 1 1 1 1<br />
Field Ops Admin Supv 2440 1 1<br />
Landfill Supt 2440 1 1 1 1 1<br />
Sanitation Supt 2440 1 1 1 1 1<br />
Sr Budget Analyst 2440 1 1 1 1 1<br />
Sr Secretary 2440 1 1<br />
Program Total: 7 5 5 8 8<br />
17740 Recycling<br />
Recycling Coord 2440 1 1 1 1 1<br />
Sanitation Insp 2440 4 4 4 4 4<br />
Sr Sanitation Insp 2440 1 1 1 1 1<br />
Program Total: 6 6 6 6 6<br />
17750 MRF Operations<br />
Account Spec II 2440 1 1 1 1 1<br />
Crewleader (Sanitation) 2440 1 1 1 1 1<br />
Engineering Insp II 2440 1<br />
Equip Mechanic I 2440 1 1 1 1 1<br />
Equip Mechanic II 2440 1 1 1 1 1<br />
Sanitation Supv 2440 1 1 1 1<br />
Srvc Worker I 2440 1 1 1 1 2<br />
Srvc Worker I (Sanitation) 2440 3 3 1 1<br />
Srvc Worker II 2440 2 2 2 2 2<br />
Srvc Worker II (Landfill) 2440 2 2 2<br />
Program Total: 11 11 11 11 11<br />
17810 Sanitation Roll-<strong>of</strong>f<br />
Account Spec II 2480 1 1 1 1<br />
Equip Operator (Sanitation) 2480 4 4 4 3 2<br />
Program Total: 4 5 5 4 3<br />
567<br />
Return to TOC
Schedule Six<br />
Authorized Staffing<br />
Dept Program Name Position Title<br />
Fund FY 2008 FY 2009<br />
FY 2010<br />
FY <strong>2011</strong> FY 20<strong>12</strong><br />
Field Operations - 620<br />
17820 Sanitation Frontload<br />
Account Spec II 2480 1 1 1 1<br />
Commercial Sanitation Insp 2480 1 1 1 1 1<br />
Crewleader (Sanitation) 2480 1 1 1 1 1<br />
Equip Operator (Sanitation) 2480 9 9 9 9 9<br />
Mgmt Asst 2480 1<br />
Sr Mgmt Asst 2480 1 1 1 1<br />
Srvc Worker III (Sanitation) 2480 1 2 2 2 2<br />
Program Total: 13 15 15 15 15<br />
17830 Curb Service<br />
Crewleader (Sanitation) 2480 2 2 2 2 2<br />
Custodian 2480 1<br />
Equip Mechanic I 2480 1 2 2 2 2<br />
Equip Operator 2480 2 2 2 2 2<br />
Equip Operator (Sanitation) 2480 32 31 31 31 30<br />
Sanitation Supv 2480 1 1 1 1 1<br />
Srvc Worker II (Sanitation) 2480 2 2 2 2 2<br />
Program Total: 40 40 40 40 40<br />
17840 Residential-Loose Trash Collec<br />
Building Maintenance Worker 2480 1<br />
Crewleader (Sanitation) 2480 1 1 1 1 1<br />
Equip Operator (Sanitation) 2480 15 15 15 15 14<br />
Equipment Operator (Streets) 2480 2 2 2<br />
Sanitation Insp 2480 1 1 1 1 1<br />
Sanitation Supv 2480 1 1 1 1 1<br />
Service Worker III (Streets) 2480 1 1<br />
Program Total: 18 18 20 21 21<br />
Field Operations Total: 280 282 275 246 239<br />
Engineering - 631<br />
13720 Engineering Administration<br />
City Engineer 1000 1 1 1 1 1<br />
Engineering Project Coord 1000 1<br />
Engineering Project Mgr 1000 1 1 1<br />
Mgmt Aide 1000 1<br />
Mgmt Asst 1000 1 1 1 1 1<br />
Property Agent 1000 1<br />
Property Mgr 1000 1 1 1<br />
Sr Secretary 1000 2 2 2 1 1<br />
Program Total: 4 5 7 5 6<br />
568<br />
Return to TOC
Schedule Six<br />
Authorized Staffing<br />
Dept Program Name Position Title<br />
Fund FY 2008 FY 2009<br />
FY 2010<br />
FY <strong>2011</strong> FY 20<strong>12</strong><br />
Engineering - 631<br />
13730 CIP Administration<br />
Assoc Civil Engineer 1000 1 1 1<br />
Asst City Engineer 1000 1 1 1 1 1<br />
Engineering Insp II 1000 1<br />
Engineering Project Mgr 1000 2 2 2 2<br />
Engineering Tech II 1000 1 1<br />
Landscape Architect 1000 1 1 1<br />
Mgmt Aide 1000 1 1 1<br />
Mgmt Asst 1000 1 1 1<br />
Principal Engineer 1000 2 2 2<br />
Programs Admin 1000 1 1 1 1<br />
Sr Civil Engineer 1000 4 5 3 2 2<br />
Sr Engineering Tech 1000 1 1<br />
Sr Mgmt Asst 1000 1<br />
Program Total: 9 15 15 9 9<br />
13740 CIP Design<br />
Engineering & Design Supv 1000 1<br />
Engineering Tech II 1000 1<br />
Sr Engineering Tech 1000 2<br />
Program Total: 4<br />
13750 CIP Construction<br />
Engineering Project Mgr 1000 2<br />
Sr Civil Engineer 1000 1<br />
Program Total: 3<br />
13760 Real Estate Services<br />
Property Agent 1000 2 1<br />
Property Mgr 1000 1 1<br />
Program Total: 3 2<br />
13770 Mapping and Records<br />
Engineering Tech II 1000 2 1 1<br />
Sr Engineering Tech 1000 1 1 1 1 1<br />
Program Total: 3 2 2 1 1<br />
13780 Land Development Division<br />
Asst City Engineer 1000 1 1 1 1 1<br />
Mgmt Aide 1000 1 1 1 1<br />
Sr Civil Engineer 1000 3 3 3 3 2<br />
Program Total: 5 5 5 5 3<br />
13790 Construction Inspection<br />
Construction Engineering Supv 1000 1 1<br />
Engineering Insp II 1000 3 3 3 1 2<br />
Engineering Project Mgr 1000 1 1 1<br />
Sr Engineering Insp 1000 3 3 3 2 2<br />
Program Total: 7 7 7 4 5<br />
569<br />
Return to TOC
Schedule Six<br />
Authorized Staffing<br />
Dept Program Name Position Title<br />
Fund FY 2008 FY 2009<br />
FY 2010<br />
FY <strong>2011</strong> FY 20<strong>12</strong><br />
Engineering - 631<br />
13800 Materials Testing<br />
Materials Tech 1000 2 2 2 1 2<br />
Sr Materials Tech 1000 1 1 1 1 1<br />
Program Total: 3 3 3 2 3<br />
13820 Utility Inspection<br />
Engineering Insp II 1000 2 2 2 2<br />
Engineering Utility Coord 1000 1 1 1<br />
Program Total: 3 3 3 2<br />
16310 Transportation Engineering Pgm<br />
Principal Engineer 1660 1<br />
Sr Civil Engineer 1660 1 1<br />
Program Total: 1 1 1<br />
Engineering Total: 45 43 43 28 27<br />
Transportation - 632<br />
16510 Transportation Program Mgmt<br />
Dep Trans Dir 1660 1 1 1 1 1<br />
Planning Mgr 1660 1 1<br />
Secretary 1660 1 1 1 1<br />
Sr Secretary 1660 1<br />
Trans Dir 1660 1 1<br />
Trans Planner 1660 1 1 1 1 1<br />
Program Total: 3 3 3 5 5<br />
16520 Transportation Education<br />
Sr. Trans Analyst 1660 1 1 1<br />
Trans Coord 1660 1 1<br />
Program Total: 1 1 1 1 1<br />
16525 Transit Management<br />
Mgmt Aide 1660 1 1<br />
Sr Secretary 1660 1<br />
Trans Planner 1660 1<br />
Transit Administrator 1660 1 1 1 1<br />
Transit Mgr 1660 2 2 2 2<br />
Program Total: 4 4 4 4<br />
570<br />
Return to TOC
Schedule Six<br />
Authorized Staffing<br />
Dept Program Name Position Title<br />
Fund FY 2008 FY 2009<br />
FY 2010<br />
FY <strong>2011</strong> FY 20<strong>12</strong><br />
Transportation - 632<br />
16530 Dial-A-Ride<br />
Dispatcher/Router 1660 6.5 6.5 5.5 5.5 5.5<br />
Lead Transit Oper 1660 6 7 8<br />
Lead Transit Rep 1660 8 8<br />
Programs Admin 1660 1 1<br />
Secretary 1660 1 1 1 1<br />
Sr Mgmt Asst 1660 1 1 1<br />
Sr Secretary 1660 1<br />
Transit Administrator 1660 1<br />
Transit Coord 1660 2 2 2 1 2<br />
Transit Mgr 1660 2<br />
Transit Oper 1660 17.75 16.75 16.75 16.75 16.75<br />
Transit Supv 1660 1 1 1 1 1<br />
Program Total: 39.25 35.25 35.25 34.25 34.25<br />
16570 Intelligent Transportation Sys<br />
Intelligent Trans Sys Analyst 1660 1 1 1 1 1<br />
Intelligent Trans Sys Mgr 1660 1 1 1 1 1<br />
Intelligent Trans Sys Tech 1660 1 1 1 1 1<br />
Principal Engineer 1660 1 1 1<br />
Principal Traffic Engineer 1660 1 1<br />
Traffic Signal Tech II 1660 1 1 1<br />
Program Total: 5 5 5 4 4<br />
16580 Traffic Mitigation<br />
Traffic Engineer I 1660 1 1 1 1 1<br />
16810 Traffic Signals<br />
Traffic Ops Electronic Tech 1340 1 1 1 1 1<br />
Traffic Ops Supt 1340 1 1 1<br />
Traffic Signal Supv 1340 1 1 1 1 1<br />
Traffic Signal Tech I 1340 2 2 2 1 1<br />
Traffic Signal Tech II 1340 3 3 3 2 2<br />
Traffic Signal Tech III 1340 2 2 2 2 2<br />
Program Total: 10 10 10 7 7<br />
16820 Signs & Markings<br />
Crewleader (Streets) 1340 2 2 2 1 1<br />
Service Worker III (Streets) 1340 1 1 1 1 1<br />
Sign Fabricator 1340 1 1 1<br />
Srvc Worker II (Streets) 1340 5 5 5 5 5<br />
Traffic Signs & Markings Supv 1340 1 1 1 1 1<br />
Program Total: 10 10 10 8 8<br />
571<br />
Return to TOC
Schedule Six<br />
Authorized Staffing<br />
Dept Program Name Position Title<br />
Fund FY 2008 FY 2009<br />
FY 2010<br />
FY <strong>2011</strong> FY 20<strong>12</strong><br />
Transportation - 632<br />
16910 Transportation Administration<br />
Intelligent Trans Sys Tech 1340 1 1 1 1 1<br />
Mgmt Aide 1340 1 1<br />
Mgmt Asst 1340 1<br />
Secretary 1340 1 1<br />
Sr Mgmt Asst 1340 1 1 1 1 1<br />
Sr Secretary 1340 1 1 1 1<br />
Trans Dir 1340 1 1 1<br />
Program Total: 5 5 5 4 3<br />
16920 Street Light Management<br />
Traffic Engineer II 1340 1 1<br />
Traffic Engineering Spec 1340 1 1 1<br />
Traffic Lighting Mgr 1340 1<br />
Program Total: 2 2 2<br />
16930 Transportation Planning<br />
Trans Planner 1340 1 1 1<br />
16940 Traffic Studies<br />
Principal Engineer 1340 1 1 1<br />
Principal Traffic Engineer 1340 1 1<br />
Traffic Education Program Mgr 1340 1 1 1 1 1<br />
Traffic Engineering Tech 1340 1 2 2 2 2<br />
Trans Planning Mgr 1340 1 1 1<br />
Program Total: 4 5 5 4 4<br />
16950 Traffic Design and Development<br />
Dep Trans Dir 1340 1 1 1 1 1<br />
Sr Traffic Engineering Spec 1340 1 1 1 1 1<br />
Traffic Engineering Spec 1340 1 1 1 1<br />
Traffic Engineering Tech 1340 1<br />
Program Total: 3 3 3 3 3<br />
Transportation Total: 84.25 85.25 85.25 75.25 74.25<br />
Airport - 633<br />
16410 Airport Operations<br />
Airport Administrator 1760 1 1 1 1 1<br />
Crewleader (Airport) 1760 1 1 1 1 1<br />
Sr Secretary 1760 1 1 1 1 1<br />
Srvc Worker II (Airport) 1760 2 2 2 2 2<br />
Program Total: 5 5 5 5 5<br />
Airport Total: 5 5 5 5 5<br />
572<br />
Return to TOC
Schedule Six<br />
Authorized Staffing<br />
Dept Program Name Position Title<br />
Fund FY 2008 FY 2009<br />
FY 2010<br />
FY <strong>2011</strong> FY 20<strong>12</strong><br />
Utilities - 641<br />
17110 Utilities Administration<br />
Account Spec 2360 1 1 1 1 1<br />
Dep Utilities Dir 2360 2 2 2 2<br />
Dept Accting & Budget Mgr 2360 1 1 1 1 1<br />
Mgmt Aide 2360 1 1 1 1<br />
Secretary 2360 2 1 1 1 1<br />
Sr Civil Engineer 2360 1 1 1 1 1<br />
Sr Mgmt Asst 2360 1 1 1 1 1<br />
Sr Secretary 2360 1 1 1 1 1<br />
Utilities Dir 2360 1 1 1 1 1<br />
Program Total: 8 10 10 10 10<br />
17115 Safety Administration<br />
Security Systems Tech 2360 1<br />
Sr Mgmt Asst 2360 1 1<br />
Util Safety Spec 2360 1<br />
Program Total: 1 1 1 1<br />
17<strong>12</strong>0 Information Management<br />
GIS Coord 2360 1 1 1 1 1<br />
Sys Admin 2360 1 1 1 1 1<br />
Utilities Network Engineer 2360 2 2 2 2 2<br />
Utilities Technology Mgr 2360 1 1 1 1 1<br />
Utility Data Coord 2360 1 1 1 1 1<br />
Program Total: 6 6 6 6 6<br />
17130 Public Service Representatives<br />
Public Srvc Rep 2360 4 4 4 4 3<br />
17140 System Security<br />
Secur Officer 2360 5 5 5 5 6<br />
Security Systems Tech 2360 1<br />
Sr Mgmt Asst 2360 1 1 1<br />
Util Safety Spec 2360 1<br />
Util Safety/Security Coor 2360 2 1 1 1 1<br />
Utilities Secur Supt 2360 1 1 1 1 1<br />
Program Total: 8 8 8 8 10<br />
17160 Arrowhead Reclamation Plant<br />
Plant Maint Mechanic II 2360 2 2 2 2 2<br />
Sr Plant Instrument Tech 2360 1 1 1 1 1<br />
Sr Water Reclam Facility Oper 2360 2 2 2 1 1<br />
Water Reclam Facility Oper I 2360 1 1<br />
Water Reclam Facility Oper II 2360 7 7 7 7 7<br />
Water Reclam Facility Supv 2360 1 1 1 1 1<br />
Program Total: 13 13 13 13 13<br />
573<br />
Return to TOC
Schedule Six<br />
Authorized Staffing<br />
Dept Program Name Position Title<br />
Fund FY 2008 FY 2009<br />
FY 2010<br />
FY <strong>2011</strong> FY 20<strong>12</strong><br />
Utilities - 641<br />
17170 West Area Plant<br />
PC Oper 2360 1<br />
Plant Instrument Tech II 2360 1 1 1 1 1<br />
Sr Plant Instrument Tech 2360 1 1 1 1 1<br />
Sr Plant Maint Mechanic 2360 1 1 1 1 1<br />
Sr Water Reclam Facility Oper 2360 1 1 1 1 1<br />
Utility Ops Supt 2360 1 1 1 1<br />
Water Reclam Facility Oper I 2360 2<br />
Water Reclam Facility Oper II 2360 8 8 8 6 7<br />
Water Reclam Facility Supv 2360 1 1 1 1 1<br />
Water Reclam Supt 2360 1<br />
Program Total: 14 14 14 14 14<br />
17210 Customer Service - Field<br />
Lead Water Srvc Rep 2400 1 1 1 1 2<br />
Sr Applications Analyst 2400 1<br />
Utilities Supv 2400 1 1 1 1 1<br />
Utility Ops Supt 2400 1 1 1 1 1<br />
Water Srvc Rep 2400 <strong>12</strong> <strong>12</strong> <strong>12</strong> <strong>12</strong> 11<br />
Program Total: 15 15 15 15 16<br />
17220 Irrigation<br />
Crewleader (Water) 2400 1 1 1 1 1<br />
17240 Central System Control<br />
HR Generalist 2400 1 1<br />
HR Program Mgr 2400 1<br />
Sr HR Analyst 2400 1<br />
Sr Water Plant Oper 2400 1 1 1 1 1<br />
Util Safety/Security Coor 2400 1<br />
Utility Ops Supt 2400 1 1 1 1<br />
Water Control Room Oper 2400 5 5 5 5 5<br />
Water Plant Operator II 2400 1<br />
Water Plant Ops Supv 2400 1 1 1 1 1<br />
Water Treatment Supt 2400 1<br />
Program Total: 10 9 9 9 9<br />
17250 Pyramid Peak Plant<br />
Sr Plant Instrument Tech 2400 1 1 1 1 1<br />
Sr Plant Maint Mechanic 2400 1 1 1 1 1<br />
Sr Water Plant Oper 2400 1 1 1 1 1<br />
Water Plant Operator II 2400 6 7 7 7 8<br />
Program Total: 9 10 10 10 11<br />
17260 Cholla Treatment Plant<br />
Plant Instrument Tech II 2400 1 1<br />
Plant Maint Mechanic II 2400 1 1 1 1 1<br />
Sr Plant Instrument Tech 2400 1 1 1<br />
Sr Water Plant Oper 2400 1 2 2 2 2<br />
Water Plant Operator II 2400 6 5 5 5 4<br />
Program Total: 9 9 9 9 8<br />
574<br />
Return to TOC
Schedule Six<br />
Authorized Staffing<br />
Dept Program Name Position Title<br />
Fund FY 2008 FY 2009<br />
FY 2010<br />
FY <strong>2011</strong> FY 20<strong>12</strong><br />
Utilities - 641<br />
17280 Central System Maintenance<br />
Plant Instrument Tech II 2400 2 2 2 2 2<br />
Sr Plant Instrument Tech 2400 1 1 1 1 1<br />
Sr Plant Maint Mechanic 2400 1 1 1 1 1<br />
Srvc Worker II (Water) 2400 1 1 1 1 1<br />
Water Plant Ops Supv 2400 1 1 1 1 1<br />
Program Total: 6 6 6 6 6<br />
17290 Water Distribution<br />
Lead Water Srvc Rep 2400 1 1 1 1<br />
Public Srvc Rep 2400 1<br />
Secretary 2400 1<br />
Sr Utility Sys Tech 2400 2 2 2 2 2<br />
Utilities Supv 2400 2 2 2 2 2<br />
Utility Sys Tech I 2400 16 16 16 16 <strong>12</strong><br />
Utility Sys Tech II 2400 9 9 9 9 11<br />
Program Total: 30 30 30 30 29<br />
17300 Meter Maintenance<br />
Sr Utility Sys Tech 2400 1 1 1 1 1<br />
Utilities Supv 2400 1 1 1 1 1<br />
Utility Locator 2400 4 4 4 4 4<br />
Utility Sys Tech I 2400 3 3 3 3 3<br />
Utility Sys Tech II 2400 2 2 2 2 2<br />
Program Total: 11 11 11 11 11<br />
17310 Oasis Water Campus<br />
Building Maintenance Worker 2400 1 1 1 1 1<br />
Custodian 2400 1 1 1 1 1<br />
Plant Instrument Tech II 2400 1 1 1 1 1<br />
Public Srvc Rep 2400 1 1 1 1 1<br />
Sr Plant Instrument Tech 2400 1 1 1 1 1<br />
Sr Plant Maint Mechanic 2400 1 1 1 1 1<br />
Sr Water Plant Oper 2400 1 1 1 1 1<br />
Srvc Worker II (Water) 2400 1 1 1 1 1<br />
Water Plant Operator II 2400 6 5 5 5 5<br />
Water Plant Ops Supv 2400 1 2 2 2 2<br />
Program Total: 15 15 15 15 15<br />
17610 Pretreatment Program<br />
Pretreatment Insp 2420 2 2 2 2 2<br />
Pretreatment Officer 2420 1 1 1<br />
Pretreatment Program Mgr 2420 1 1<br />
Sr Pretreatment Insp 2420 3 3 3 3 3<br />
Program Total: 6 6 6 6 6<br />
575<br />
Return to TOC
Schedule Six<br />
Authorized Staffing<br />
Dept Program Name Position Title<br />
Fund FY 2008 FY 2009<br />
FY 2010<br />
FY <strong>2011</strong> FY 20<strong>12</strong><br />
Utilities - 641<br />
17630 Wastewater Collection<br />
Dep Utilities Dir 2420 2<br />
PC Oper 2420 1 1 1 1 1<br />
Sr Utility Sys Tech 2420 2 1 1 1 1<br />
Srvc Worker I 2420 1<br />
Utilities Supv 2420 1 1 1 1 1<br />
Utility Ops Supt 2420 1 1 1 1<br />
Utility Sys Tech I 2420 9 10 9 9 8<br />
Utility Sys Tech II 2420 5 5 6 6 6<br />
Program Total: 20 19 19 19 19<br />
Utilities Total: 186 187 187 187 187<br />
Grand Total 2,100.51 2,204.51 2,182.51 1,971.01 1,966.38<br />
576<br />
Return to TOC
Schedule Seven - SUMMARY<br />
Long Term Debt Service<br />
FY <strong>2011</strong>-<strong>12</strong><br />
Bond Description Date <strong>of</strong> Issue Principal Interest Other Fees Total<br />
Excise Tax Funded Debt (Fund 1940)<br />
MPC Bonds - Series 2003A - Arena Tax Exempt 6/1/2003 1,390,000 2,077,981 5,000 3,472,981<br />
MPC Bonds - Series 2003B - Arena Taxable 6/1/2003 390,000 5,268,735 5,000 5,663,735<br />
MPC Bonds - Series 2004A - Refund Imp Dist 5/1/2004 1,665,000 264,750 5,000 1,934,750<br />
MPC Bonds - Series 2006A - GRPSTC/Zanjero 6/1/2006 1,315,000 1,431,525 5,000 2,751,525<br />
MPC Bonds - Series 2008A - H/Conv/Media (Tax Exempt) 6/1/2008 - 1,462,256 5,000 1,467,256<br />
MPC Bonds - Series 2008B - H/Conv/Media (Taxable) 6/1/2008 470,000 3,076,071 5,000 3,551,071<br />
MPC Bonds - Series 2008C - H/Conv/Media (Taxable) 6/1/2008 1,730,000 270,416 5,000 2,005,416<br />
AMFP Series 14 - Arena 6/28/2002 - 259,763 - 259,763<br />
AMFP Refunding Series 16 - Arena 7/31/2003 - 340,750 - 340,750<br />
Sub-Total Excise Tax Funded Debt 6,960,000 14,452,246 35,000 21,447,246<br />
Property Tax Funded Debt (Fund 1900)<br />
General Obligation Bonds - Series 2003 (1 <strong>of</strong> 2) 4/1/2003 3,360,000 397,600 5,000 3,762,600<br />
General Obligation Bonds - Series 2004 6/1/2004 2,350,000 970,494 5,000 3,325,494<br />
General Obligation Bonds - Series 2005 6/1/2005 1,250,000 203,413 5,000 1,458,413<br />
General Obligation Bonds - Series 2006A 6/1/2006 1,785,000 971,531 5,000 2,761,531<br />
General Obligation Bonds - Series 2006B 6/1/2006 1,715,000 372,000 5,000 2,092,000<br />
General Obligation Bonds - Series 2007 6/26/2007 3,520,000 2,190,588 5,000 5,715,588<br />
General Obligation Bonds - Series 2009B <strong>12</strong>/22/2009 1,280,000 1,910,378 5,000 3,195,378<br />
General Obligation Bonds - Series 2010 11/30/2010 - 1,667,600 5,000 1,672,600<br />
General Obligation Bond Arbitrage (1) - - 300,000 300,000<br />
Sub-Total Property Tax Funded Debt 15,260,000 8,683,603 340,000 24,283,603<br />
Water & Sewer Revenue Funded Debt (Fund 2380)<br />
General Obligation Bonds - Series 2003 (2 <strong>of</strong> 2) 4/1/2003 925,000 325,550 2,000 1,252,550<br />
Subordinate Lien W&S Rev Bonds - Series 2003 <strong>12</strong>/1/2003 2,725,000 3,843,000 5,000 6,573,000<br />
Subordinate Lien W&S Rev Bonds - Series 2006 2/7/2006 3,590,000 3,577,831 5,000 7,172,831<br />
Subordinate Lien W&S Rev Bonds - Series 2007 6/15/2007 1,775,000 1,960,188 5,000 3,740,188<br />
Subordinate Lien W&S Rev Bonds - Series 2008 2/1/2008 2,455,000 2,604,038 5,000 5,064,038<br />
W&S Revenue Obligations, Series 2010 11/30/2010 - 1,638,858 5,000 1,643,858<br />
WIFA 2010 3/17/2010 256,757 191,564 - 448,321<br />
WIFA 2001 1/1/2001 856,067 164,609 50,000 1,070,676<br />
Sub-Total Water & Sewer Revenue Funded Debt <strong>12</strong>,582,823 14,305,637 77,000 26,965,461<br />
Street/HURF Revenue Funded Debt (Fund 1920)<br />
HURF Revenue Bonds - Refunding Series 2004 6/1/2004 2,435,000 290,913 5,000 2,730,913<br />
HURF Revenue Bonds - Series 2006 4/11/2006 1,605,000 365,425 5,000 1,975,425<br />
Sub-Total Street Revenue Funded Debt 4,040,000 656,338 10,000 4,706,338<br />
Western Loop 101 Public Facilites Corp (Fund 1930)<br />
3rd Lien Excise Tax Revenue Bonds - Tax exempt 2008A 10/1/2008 - 380,000 - 380,000<br />
3rd Lien Excise Tax Revenue Bonds - Tax exempt 2008B 10/1/2008 - - - -<br />
3rd Lien Excise Tax Revenue Bonds - Tax exempt 2008C 10/1/2008 - - - -<br />
Sub-Total Street Revenue Funded Debt - 380,000 - 380,000<br />
Transp. Sales Tax Rev Funded Debt (Fund 1970)<br />
Transportation Sales Tax Obligations Bond 10/16/2007 2,890,000 4,436,881 - 7,326,881<br />
Sub-Total Trans S/Tax Bond Debt Service 2,890,000 4,436,881 - 7,326,881<br />
Total Debt Service Payments (All Funds) 41,732,823 42,914,705 462,000 85,109,528<br />
(1) note, arbitrage is subject to change each<br />
year based on calc's performed by consultants.<br />
577<br />
Return to TOC
Schedule Seven - SUMMARY<br />
Long Term Debt Service<br />
Bond Description<br />
Date <strong>of</strong> Issue<br />
FY 20<strong>12</strong>-13<br />
Principal Interest Other Fees Total<br />
Excise Tax Funded Debt (Fund 1940)<br />
MPC Bonds - Series 2003A - Arena Tax Exempt 6/1/2003<br />
MPC Bonds - Series 2003B - Arena Taxable 6/1/2003<br />
MPC Bonds - Series 2004A - Refund Imp Dist 5/1/2004<br />
MPC Bonds - Series 2006A - GRPSTC/Zanjero 6/1/2006<br />
MPC Bonds - Series 2008A - H/Conv/Media (Tax Exempt) 6/1/2008<br />
MPC Bonds - Series 2008B - H/Conv/Media (Taxable) 6/1/2008<br />
MPC Bonds - Series 2008C - H/Conv/Media (Taxable) 6/1/2008<br />
AMFP Series 14 - Arena 6/28/2002<br />
AMFP Refunding Series 16 - Arena 7/31/2003<br />
Sub-Total Excise Tax Funded Debt<br />
1,375,000 2,034,544 5,000 3,414,544<br />
480,000 5,252,745 5,000 5,737,745<br />
1,765,000 181,500 5,000 1,951,500<br />
1,380,000 1,365,775 5,000 2,750,775<br />
- 1,462,256 5,000 1,467,256<br />
740,000 3,050,475 5,000 3,795,475<br />
1,570,000 190,905 5,000 1,765,905<br />
- 259,763 - 259,763<br />
- 340,750 - 340,750<br />
7,310,000 14,138,7<strong>12</strong> 35,000 21,483,7<strong>12</strong><br />
Property Tax Funded Debt (Fund 1900)<br />
General Obligation Bonds - Series 2003 (1 <strong>of</strong> 2) 4/1/2003<br />
General Obligation Bonds - Series 2004 6/1/2004<br />
General Obligation Bonds - Series 2005 6/1/2005<br />
General Obligation Bonds - Series 2006A 6/1/2006<br />
General Obligation Bonds - Series 2006B 6/1/2006<br />
General Obligation Bonds - Series 2007 6/26/2007<br />
General Obligation Bonds - Series 2009B <strong>12</strong>/22/2009<br />
General Obligation Bonds - Series 2010 11/30/2010<br />
General Obligation Bond Arbitrage (1)<br />
Sub-Total Property Tax Funded Debt<br />
Water & Sewer Revenue Funded Debt (Fund 2380)<br />
General Obligation Bonds - Series 2003 (2 <strong>of</strong> 2) 4/1/2003<br />
Subordinate Lien W&S Rev Bonds - Series 2003 <strong>12</strong>/1/2003<br />
Subordinate Lien W&S Rev Bonds - Series 2006 2/7/2006<br />
Subordinate Lien W&S Rev Bonds - Series 2007 6/15/2007<br />
Subordinate Lien W&S Rev Bonds - Series 2008 2/1/2008<br />
W&S Revenue Obligations, Series 2010 11/30/2010<br />
WIFA 2010 3/17/2010<br />
WIFA 2001 1/1/2001<br />
Sub-Total Water & Sewer Revenue Funded Debt<br />
Street/HURF Revenue Funded Debt (Fund 1920)<br />
HURF Revenue Bonds - Refunding Series 2004 6/1/2004<br />
HURF Revenue Bonds - Series 2006 4/11/2006<br />
Sub-Total Street Revenue Funded Debt<br />
Western Loop 101 Public Facilites Corp (Fund 1930)<br />
3rd Lien Excise Tax Revenue Bonds - Tax exempt 2008A 10/1/2008<br />
3rd Lien Excise Tax Revenue Bonds - Tax exempt 2008B 10/1/2008<br />
3rd Lien Excise Tax Revenue Bonds - Tax exempt 2008C 10/1/2008<br />
Sub-Total Street Revenue Funded Debt<br />
Transp. Sales Tax Rev Funded Debt (Fund 1970)<br />
Transportation Sales Tax Obligations Bond 10/16/2007<br />
Sub-Total Trans S/Tax Bond Debt Service<br />
Total Debt Service Payments (All Funds)<br />
3,530,000 263,200 5,000 3,798,200<br />
2,440,000 876,494 5,000 3,321,494<br />
1,295,000 158,100 5,000 1,458,100<br />
1,850,000 882,281 5,000 2,737,281<br />
1,810,000 286,250 5,000 2,101,250<br />
3,660,000 2,040,988 5,000 5,705,988<br />
1,295,000 1,881,578 - 3,176,578<br />
- 1,667,600 5,000 1,672,600<br />
- - 300,000 300,000<br />
15,880,000 8,056,490 335,000 24,271,490<br />
970,000 288,550 2,000 1,260,550<br />
2,830,000 3,734,000 5,000 6,569,000<br />
3,745,000 3,434,231 5,000 7,184,231<br />
1,840,000 1,884,750 5,000 3,729,750<br />
2,540,000 2,518,113 5,000 5,063,113<br />
- 1,638,858 5,000 1,643,858<br />
264,832 183,489 - 448,321<br />
888,460 145,057 50,000 1,083,517<br />
13,078,292 13,827,047 77,000 26,982,339<br />
2,525,000 202,644 5,000 2,732,644<br />
1,670,000 301,225 5,000 1,976,225<br />
4,195,000 503,869 10,000 4,708,869<br />
- 8,913,913 5,000 8,918,913<br />
- 3,077,875 5,000 3,082,875<br />
- 1,018,875 5,000 1,023,875<br />
- 13,010,663 15,000 13,025,663<br />
3,005,000 4,321,281 - 7,326,281<br />
3,005,000 4,321,281 - 7,326,281<br />
43,468,292 53,858,062 472,000 97,798,354<br />
(1) note, arbitrage is subject to change each<br />
year based on calc's performed by consultants.<br />
578<br />
Return to TOC
Schedule Seven - SUMMARY<br />
Long Term Debt Service<br />
Bond Description<br />
Date <strong>of</strong> Issue<br />
FY 2013-14<br />
Principal Interest Other Fees Total<br />
Excise Tax Funded Debt (Fund 1940)<br />
MPC Bonds - Series 2003A - Arena Tax Exempt 6/1/2003<br />
MPC Bonds - Series 2003B - Arena Taxable 6/1/2003<br />
MPC Bonds - Series 2004A - Refund Imp Dist 5/1/2004<br />
MPC Bonds - Series 2006A - GRPSTC/Zanjero 6/1/2006<br />
MPC Bonds - Series 2008A - H/Conv/Media (Tax Exempt) 6/1/2008<br />
MPC Bonds - Series 2008B - H/Conv/Media (Taxable) 6/1/2008<br />
MPC Bonds - Series 2008C - H/Conv/Media (Taxable) 6/1/2008<br />
AMFP Series 14 - Arena 6/28/2002<br />
AMFP Refunding Series 16 - Arena 7/31/2003<br />
Sub-Total Excise Tax Funded Debt<br />
1,395,000 1,991,575 5,000 3,391,575<br />
575,000 5,232,441 5,000 5,8<strong>12</strong>,441<br />
1,865,000 93,250 5,000 1,963,250<br />
1,450,000 1,296,775 5,000 2,751,775<br />
- 1,462,256 5,000 1,467,256<br />
1,030,000 3,010,174 5,000 4,045,174<br />
1,350,000 115,922 5,000 1,470,922<br />
- 259,763 - 259,763<br />
- 340,750 - 340,750<br />
7,665,000 13,802,906 35,000 21,502,906<br />
Property Tax Funded Debt (Fund 1900)<br />
General Obligation Bonds - Series 2003 (1 <strong>of</strong> 2) 4/1/2003<br />
General Obligation Bonds - Series 2004 6/1/2004<br />
General Obligation Bonds - Series 2005 6/1/2005<br />
General Obligation Bonds - Series 2006A 6/1/2006<br />
General Obligation Bonds - Series 2006B 6/1/2006<br />
General Obligation Bonds - Series 2007 6/26/2007<br />
General Obligation Bonds - Series 2009B <strong>12</strong>/22/2009<br />
General Obligation Bonds - Series 2010 11/30/2010<br />
General Obligation Bond Arbitrage (1)<br />
Sub-Total Property Tax Funded Debt<br />
Water & Sewer Revenue Funded Debt (Fund 2380)<br />
General Obligation Bonds - Series 2003 (2 <strong>of</strong> 2) 4/1/2003<br />
Subordinate Lien W&S Rev Bonds - Series 2003 <strong>12</strong>/1/2003<br />
Subordinate Lien W&S Rev Bonds - Series 2006 2/7/2006<br />
Subordinate Lien W&S Rev Bonds - Series 2007 6/15/2007<br />
Subordinate Lien W&S Rev Bonds - Series 2008 2/1/2008<br />
W&S Revenue Obligations, Series 2010 11/30/2010<br />
WIFA 2010 3/17/2010<br />
WIFA 2001 1/1/2001<br />
Sub-Total Water & Sewer Revenue Funded Debt<br />
Street/HURF Revenue Funded Debt (Fund 1920)<br />
HURF Revenue Bonds - Refunding Series 2004 6/1/2004<br />
HURF Revenue Bonds - Series 2006 4/11/2006<br />
Sub-Total Street Revenue Funded Debt<br />
Western Loop 101 Public Facilites Corp (Fund 1930)<br />
3rd Lien Excise Tax Revenue Bonds - Tax exempt 2008A 10/1/2008<br />
3rd Lien Excise Tax Revenue Bonds - Tax exempt 2008B 10/1/2008<br />
3rd Lien Excise Tax Revenue Bonds - Tax exempt 2008C 10/1/2008<br />
Sub-Total Street Revenue Funded Debt<br />
Transp. Sales Tax Rev Funded Debt (Fund 1970)<br />
Transportation Sales Tax Obligations Bond 10/16/2007<br />
Sub-Total Trans S/Tax Bond Debt Service<br />
Total Debt Service Payments (All Funds)<br />
- 86,700 5,000 91,700<br />
2,550,000 778,894 5,000 3,333,894<br />
1,345,000 107,919 5,000 1,457,919<br />
1,925,000 808,281 5,000 2,738,281<br />
1,905,000 195,750 5,000 2,105,750<br />
3,805,000 1,885,438 5,000 5,695,438<br />
1,315,000 1,849,203 5,000 3,169,203<br />
2,475,000 1,667,600 5,000 4,147,600<br />
- - 300,000 300,000<br />
15,320,000 7,379,784 340,000 23,039,784<br />
1,020,000 240,050 2,000 1,262,050<br />
2,975,000 3,592,500 5,000 6,572,500<br />
3,925,000 3,237,619 5,000 7,167,619<br />
1,930,000 1,806,550 5,000 3,741,550<br />
2,630,000 2,429,213 5,000 5,064,213<br />
- 1,638,858 5,000 1,643,858<br />
273,161 175,160 5,000 453,321<br />
922,080 <strong>12</strong>4,764 50,000 1,096,844<br />
13,675,240 13,244,713 82,000 27,001,954<br />
2,620,000 104,800 5,000 2,729,800<br />
1,735,000 226,075 5,000 1,966,075<br />
4,355,000 330,875 10,000 4,695,875<br />
- 8,913,913 5,000 8,918,913<br />
- 3,077,875 5,000 3,082,875<br />
2,940,000 1,018,875 5,000 3,963,875<br />
2,940,000 13,010,663 15,000 15,965,663<br />
3,<strong>12</strong>5,000 4,201,081 - 7,326,081<br />
3,<strong>12</strong>5,000 4,201,081 - 7,326,081<br />
47,080,240 51,970,022 482,000 99,532,262<br />
(1) note, arbitrage is subject to change each<br />
year based on calc's performed by consultants.<br />
579<br />
Return to TOC
Schedule Seven - SUMMARY<br />
Long Term Debt Service<br />
Bond Description<br />
Date <strong>of</strong> Issue<br />
FY 2014-15<br />
Principal Interest Other Fees Total<br />
Excise Tax Funded Debt (Fund 1940)<br />
MPC Bonds - Series 2003A - Arena Tax Exempt 6/1/2003<br />
MPC Bonds - Series 2003B - Arena Taxable 6/1/2003<br />
MPC Bonds - Series 2004A - Refund Imp Dist 5/1/2004<br />
MPC Bonds - Series 2006A - GRPSTC/Zanjero 6/1/2006<br />
MPC Bonds - Series 2008A - H/Conv/Media (Tax Exempt) 6/1/2008<br />
MPC Bonds - Series 2008B - H/Conv/Media (Taxable) 6/1/2008<br />
MPC Bonds - Series 2008C - H/Conv/Media (Taxable) 6/1/2008<br />
AMFP Series 14 - Arena 6/28/2002<br />
AMFP Refunding Series 16 - Arena 7/31/2003<br />
Sub-Total Excise Tax Funded Debt<br />
1,410,000 1,935,775 5,000 3,350,775<br />
700,000 5,202,081 5,000 5,907,081<br />
- - - -<br />
1,520,000 1,224,275 5,000 2,749,275<br />
240,000 1,462,256 5,000 1,707,256<br />
1,345,000 2,954,081 5,000 4,304,081<br />
1,000,000 50,190 5,000 1,055,190<br />
- 259,763 - 259,763<br />
- 340,750 - 340,750<br />
6,215,000 13,429,170 30,000 19,674,170<br />
Property Tax Funded Debt (Fund 1900)<br />
General Obligation Bonds - Series 2003 (1 <strong>of</strong> 2) 4/1/2003<br />
General Obligation Bonds - Series 2004 6/1/2004<br />
General Obligation Bonds - Series 2005 6/1/2005<br />
General Obligation Bonds - Series 2006A 6/1/2006<br />
General Obligation Bonds - Series 2006B 6/1/2006<br />
General Obligation Bonds - Series 2007 6/26/2007<br />
General Obligation Bonds - Series 2009B <strong>12</strong>/22/2009<br />
General Obligation Bonds - Series 2010 11/30/2010<br />
General Obligation Bond Arbitrage (1)<br />
Sub-Total Property Tax Funded Debt<br />
Water & Sewer Revenue Funded Debt (Fund 2380)<br />
General Obligation Bonds - Series 2003 (2 <strong>of</strong> 2) 4/1/2003<br />
Subordinate Lien W&S Rev Bonds - Series 2003 <strong>12</strong>/1/2003<br />
Subordinate Lien W&S Rev Bonds - Series 2006 2/7/2006<br />
Subordinate Lien W&S Rev Bonds - Series 2007 6/15/2007<br />
Subordinate Lien W&S Rev Bonds - Series 2008 2/1/2008<br />
W&S Revenue Obligations, Series 2010 11/30/2010<br />
WIFA 2010 3/17/2010<br />
WIFA 2001 1/1/2001<br />
Sub-Total Water & Sewer Revenue Funded Debt<br />
Street/HURF Revenue Funded Debt (Fund 1920)<br />
HURF Revenue Bonds - Refunding Series 2004 6/1/2004<br />
HURF Revenue Bonds - Series 2006 4/11/2006<br />
Sub-Total Street Revenue Funded Debt<br />
Western Loop 101 Public Facilites Corp (Fund 1930)<br />
3rd Lien Excise Tax Revenue Bonds - Tax exempt 2008A 10/1/2008<br />
3rd Lien Excise Tax Revenue Bonds - Tax exempt 2008B 10/1/2008<br />
3rd Lien Excise Tax Revenue Bonds - Tax exempt 2008C 10/1/2008<br />
Sub-Total Street Revenue Funded Debt<br />
Transp. Sales Tax Rev Funded Debt (Fund 1970)<br />
Transportation Sales Tax Obligations Bond 10/16/2007<br />
Sub-Total Trans S/Tax Bond Debt Service<br />
Total Debt Service Payments (All Funds)<br />
- 86,700 5,000 91,700<br />
2,665,000 670,519 5,000 3,340,519<br />
1,395,000 55,800 5,000 1,455,800<br />
2,000,000 7<strong>12</strong>,031 5,000 2,717,031<br />
2,010,000 100,500 5,000 2,115,500<br />
3,960,000 1,723,725 5,000 5,688,725<br />
1,335,000 1,809,753 5,000 3,149,753<br />
5,645,000 1,568,600 5,000 7,218,600<br />
- - 300,000 300,000<br />
19,010,000 6,727,628 340,000 26,077,628<br />
1,060,000 189,050 2,000 1,251,050<br />
3,<strong>12</strong>0,000 3,443,750 5,000 6,568,750<br />
4,140,000 3,031,556 5,000 7,176,556<br />
2,010,000 1,722,113 5,000 3,737,113<br />
2,730,000 2,330,588 5,000 5,065,588<br />
- 1,638,858 5,000 1,643,858<br />
281,752 166,569 5,000 453,321<br />
956,971 103,704 50,000 1,110,675<br />
14,298,723 <strong>12</strong>,626,187 82,000 27,006,910<br />
- - 5,000 5,000<br />
1,805,000 148,000 5,000 1,958,000<br />
1,805,000 148,000 10,000 1,963,000<br />
- 8,913,913 5,000 8,918,913<br />
- 3,077,875 5,000 3,082,875<br />
4,975,000 798,375 5,000 5,778,375<br />
4,975,000 <strong>12</strong>,790,163 15,000 17,780,163<br />
3,250,000 4,076,081 - 7,326,081<br />
3,250,000 4,076,081 - 7,326,081<br />
49,553,723 49,797,229 477,000 99,827,951<br />
(1) note, arbitrage is subject to change each<br />
year based on calc's performed by consultants.<br />
580<br />
Return to TOC
Schedule Seven - SUMMARY<br />
Long Term Debt Service<br />
Bond Description<br />
Date <strong>of</strong> Issue<br />
FY 2016 - Beyond<br />
Principal Interest Other Fees Total<br />
Excise Tax Funded Debt (Fund 1940)<br />
MPC Bonds - Series 2003A - Arena Tax Exempt 6/1/2003<br />
MPC Bonds - Series 2003B - Arena Taxable 6/1/2003<br />
MPC Bonds - Series 2004A - Refund Imp Dist 5/1/2004<br />
MPC Bonds - Series 2006A - GRPSTC/Zanjero 6/1/2006<br />
MPC Bonds - Series 2008A - H/Conv/Media (Tax Exempt) 6/1/2008<br />
MPC Bonds - Series 2008B - H/Conv/Media (Taxable) 6/1/2008<br />
MPC Bonds - Series 2008C - H/Conv/Media (Taxable) 6/1/2008<br />
AMFP Series 14 - Arena 6/28/2002<br />
AMFP Refunding Series 16 - Arena 7/31/2003<br />
Sub-Total Excise Tax Funded Debt<br />
38,830,000 18,906,538 5,000 57,741,538<br />
93,920,000 58,021,053 5,000 151,946,053<br />
- - - -<br />
22,705,000 7,506,025 5,000 30,216,025<br />
31,980,000 14,595,050 5,000 46,580,050<br />
47,490,000 33,834,646 5,000 81,329,646<br />
- - 5,000 5,000<br />
5,055,000 4,301,156 5,000 9,361,156<br />
7,250,000 6,303,875 5,000 13,558,875<br />
247,230,000 143,468,343 40,000 390,738,343<br />
Property Tax Funded Debt (Fund 1900)<br />
General Obligation Bonds - Series 2003 (1 <strong>of</strong> 2) 4/1/2003<br />
General Obligation Bonds - Series 2004 6/1/2004<br />
General Obligation Bonds - Series 2005 6/1/2005<br />
General Obligation Bonds - Series 2006A 6/1/2006<br />
General Obligation Bonds - Series 2006B 6/1/2006<br />
General Obligation Bonds - Series 2007 6/26/2007<br />
General Obligation Bonds - Series 2009B <strong>12</strong>/22/2009<br />
General Obligation Bonds - Series 2010 11/30/2010<br />
General Obligation Bond Arbitrage (1)<br />
Sub-Total Property Tax Funded Debt<br />
Water & Sewer Revenue Funded Debt (Fund 2380)<br />
General Obligation Bonds - Series 2003 (2 <strong>of</strong> 2) 4/1/2003<br />
Subordinate Lien W&S Rev Bonds - Series 2003 <strong>12</strong>/1/2003<br />
Subordinate Lien W&S Rev Bonds - Series 2006 2/7/2006<br />
Subordinate Lien W&S Rev Bonds - Series 2007 6/15/2007<br />
Subordinate Lien W&S Rev Bonds - Series 2008 2/1/2008<br />
W&S Revenue Obligations, Series 2010 11/30/2010<br />
WIFA 2010 3/17/2010<br />
WIFA 2001 1/1/2001<br />
Sub-Total Water & Sewer Revenue Funded Debt<br />
Street/HURF Revenue Funded Debt (Fund 1920)<br />
HURF Revenue Bonds - Refunding Series 2004 6/1/2004<br />
HURF Revenue Bonds - Series 2006 4/11/2006<br />
Sub-Total Street Revenue Funded Debt<br />
Western Loop 101 Public Facilites Corp (Fund 1930)<br />
3rd Lien Excise Tax Revenue Bonds - Tax exempt 2008A 10/1/2008<br />
3rd Lien Excise Tax Revenue Bonds - Tax exempt 2008B 10/1/2008<br />
3rd Lien Excise Tax Revenue Bonds - Tax exempt 2008C 10/1/2008<br />
Sub-Total Street Revenue Funded Debt<br />
Transp. Sales Tax Rev Funded Debt (Fund 1970)<br />
Transportation Sales Tax Obligations Bond 10/16/2007<br />
Sub-Total Trans S/Tax Bond Debt Service<br />
Total Debt Service Payments (All Funds)<br />
4,335,000 260,100 5,000 4,600,100<br />
11,950,000 1,441,988 5,000 13,396,988<br />
- - 5,000 5,000<br />
13,985,000 2,292,163 5,000 16,282,163<br />
- - 5,000 5,000<br />
33,195,000 6,563,825 5,000 39,763,825<br />
35,155,000 16,150,478 5,000 51,310,478<br />
30,180,000 4,869,100 35,000 35,084,100<br />
- - 300,000 300,000<br />
<strong>12</strong>8,800,000 31,577,653 370,000 160,747,653<br />
3,435,000 240,900 2,000 3,677,900<br />
65,755,000 26,381,500 5,000 92,141,500<br />
61,145,000 17,719,044 5,000 78,869,044<br />
33,295,000 11,496,413 5,000 44,796,413<br />
48,200,000 17,576,625 5,000 65,781,625<br />
25,685,000 22,243,278 50,000 47,978,278<br />
5,014,572 1,261,921 50,000 6,326,492<br />
3,583,488 187,816 50,000 3,821,304<br />
246,113,060 97,107,495 172,000 343,392,555<br />
- - - -<br />
1,895,000 75,800 5,000 1,975,800<br />
1,895,000 75,800 5,000 1,975,800<br />
137,495,000 145,584,588 5,000 283,084,588<br />
48,670,000 50,841,263 5,000 99,516,263<br />
5,670,000 457,500 5,000 6,132,500<br />
191,835,000 196,883,350 15,000 388,733,350<br />
84,765,000 39,810,444 - <strong>12</strong>4,575,444<br />
84,765,000 39,810,444 - <strong>12</strong>4,575,444<br />
900,638,060 508,923,084 602,000 1,410,163,144<br />
(1) note, arbitrage is subject to change each<br />
year based on calc's performed by consultants.<br />
581<br />
Return to TOC
Schedule Seven - SUMMARY<br />
Long Term Debt Service<br />
Bond Description<br />
Date <strong>of</strong> Issue<br />
Grand Totals<br />
Principal Interest Other Fees Total<br />
Excise Tax Funded Debt (Fund 1940)<br />
MPC Bonds - Series 2003A - Arena Tax Exempt 6/1/2003<br />
MPC Bonds - Series 2003B - Arena Taxable 6/1/2003<br />
MPC Bonds - Series 2004A - Refund Imp Dist 5/1/2004<br />
MPC Bonds - Series 2006A - GRPSTC/Zanjero 6/1/2006<br />
MPC Bonds - Series 2008A - H/Conv/Media (Tax Exempt) 6/1/2008<br />
MPC Bonds - Series 2008B - H/Conv/Media (Taxable) 6/1/2008<br />
MPC Bonds - Series 2008C - H/Conv/Media (Taxable) 6/1/2008<br />
AMFP Series 14 - Arena 6/28/2002<br />
AMFP Refunding Series 16 - Arena 7/31/2003<br />
Sub-Total Excise Tax Funded Debt<br />
44,400,000 26,946,413 25,000 71,371,413<br />
96,065,000 78,977,055 25,000 175,067,055<br />
5,295,000 539,500 15,000 5,849,500<br />
28,370,000 <strong>12</strong>,824,375 25,000 41,219,375<br />
32,220,000 20,444,075 25,000 52,689,075<br />
51,075,000 45,925,446 25,000 97,025,446<br />
5,650,000 627,432 25,000 6,302,432<br />
5,055,000 5,340,206 5,000 10,400,206<br />
7,250,000 7,666,875 5,000 14,921,875<br />
275,380,000 199,291,377 175,000 474,846,377<br />
Property Tax Funded Debt (Fund 1900)<br />
General Obligation Bonds - Series 2003 (1 <strong>of</strong> 2) 4/1/2003<br />
General Obligation Bonds - Series 2004 6/1/2004<br />
General Obligation Bonds - Series 2005 6/1/2005<br />
General Obligation Bonds - Series 2006A 6/1/2006<br />
General Obligation Bonds - Series 2006B 6/1/2006<br />
General Obligation Bonds - Series 2007 6/26/2007<br />
General Obligation Bonds - Series 2009B <strong>12</strong>/22/2009<br />
General Obligation Bonds - Series 2010 11/30/2010<br />
General Obligation Bond Arbitrage (1)<br />
Sub-Total Property Tax Funded Debt<br />
Water & Sewer Revenue Funded Debt (Fund 2380)<br />
General Obligation Bonds - Series 2003 (2 <strong>of</strong> 2) 4/1/2003<br />
Subordinate Lien W&S Rev Bonds - Series 2003 <strong>12</strong>/1/2003<br />
Subordinate Lien W&S Rev Bonds - Series 2006 2/7/2006<br />
Subordinate Lien W&S Rev Bonds - Series 2007 6/15/2007<br />
Subordinate Lien W&S Rev Bonds - Series 2008 2/1/2008<br />
W&S Revenue Obligations, Series 2010 11/30/2010<br />
WIFA 2010 3/17/2010<br />
WIFA 2001 1/1/2001<br />
Sub-Total Water & Sewer Revenue Funded Debt<br />
Street/HURF Revenue Funded Debt (Fund 1920)<br />
HURF Revenue Bonds - Refunding Series 2004 6/1/2004<br />
HURF Revenue Bonds - Series 2006 4/11/2006<br />
Sub-Total Street Revenue Funded Debt<br />
Western Loop 101 Public Facilites Corp (Fund 1930)<br />
3rd Lien Excise Tax Revenue Bonds - Tax exempt 2008A 10/1/2008<br />
3rd Lien Excise Tax Revenue Bonds - Tax exempt 2008B 10/1/2008<br />
3rd Lien Excise Tax Revenue Bonds - Tax exempt 2008C 10/1/2008<br />
Sub-Total Street Revenue Funded Debt<br />
Transp. Sales Tax Rev Funded Debt (Fund 1970)<br />
Transportation Sales Tax Obligations Bond 10/16/2007<br />
Sub-Total Trans S/Tax Bond Debt Service<br />
Total Debt Service Payments (All Funds)<br />
11,225,000 1,094,300 25,000 <strong>12</strong>,344,300<br />
21,955,000 4,738,388 25,000 26,718,388<br />
5,285,000 525,231 25,000 5,835,231<br />
21,545,000 5,666,288 25,000 27,236,288<br />
7,440,000 954,500 25,000 8,419,500<br />
48,140,000 14,404,563 25,000 62,569,563<br />
40,380,000 23,601,388 25,000 64,001,388<br />
38,300,000 11,440,500 25,000 49,795,500<br />
- - 1,500,000 1,500,000<br />
194,270,000 62,425,156 1,700,000 258,420,156<br />
7,410,000 1,284,100 10,000 8,704,100<br />
77,405,000 40,994,750 25,000 118,424,750<br />
76,545,000 31,000,281 25,000 107,570,281<br />
40,850,000 18,870,013 25,000 59,745,013<br />
58,555,000 27,458,575 25,000 86,038,575<br />
25,685,000 28,798,708 70,000 54,553,708<br />
6,091,072 1,978,704 60,000 8,<strong>12</strong>9,776<br />
7,207,066 725,950 250,000 8,183,016<br />
299,748,138 151,111,080 490,000 451,349,219<br />
7,580,000 598,356 20,000 8,198,356<br />
8,710,000 1,116,525 25,000 9,851,525<br />
16,290,000 1,714,881 45,000 18,049,881<br />
137,495,000 172,706,325 20,000 310,221,325<br />
48,670,000 60,074,888 20,000 108,764,888<br />
13,585,000 3,293,625 20,000 16,898,625<br />
199,750,000 236,074,837 60,000 435,884,837<br />
97,035,000 56,845,769 - 153,880,769<br />
97,035,000 56,845,769 - 153,880,769<br />
1,082,473,138 707,463,101 2,470,000 1,792,431,239<br />
(1) note, arbitrage is subject to change each<br />
year based on calc's performed by consultants.<br />
582<br />
Return to TOC
Schedule Seven – DETAIL<br />
Long-Term Debt Service<br />
$49,940,000<br />
City <strong>of</strong> Glendale, Arizona<br />
Municipal Property Corporation<br />
Excise Tax Revenue Bonds, Series 2003A – Arena Tax Exempt<br />
Date: June 1, 2003, maturing in 2033.<br />
Rating:<br />
Moody’s “Aaa”<br />
Standard and Poor’s “AAA”<br />
Interest: Semi‐<strong>annual</strong> each January and July, commencing July 1, 2003.<br />
Interest accrues at rates ranging from 2.500% to 5.000%<br />
Purpose:<br />
The Series 2003A (taxable) bonds were issued to pay for the cost <strong>of</strong><br />
constructing, equipping and furnishing the arena complex and related facilities,<br />
including parking and other public infrastructure.<br />
Debt Service:<br />
Fiscal Year Principal Interest Total<br />
Prior Years 5,540,000 13,165,287 18,705,287<br />
20<strong>12</strong> 1,390,000 2,077,981 3,467,981<br />
2013 1,375,000 2,034,544 3,409,544<br />
2014 1,395,000 1,991,575 3,386,575<br />
2015 1,410,000 1,935,775 3,345,775<br />
2016‐2020 10,650,000 8,364,875 19,014,875<br />
2021 ‐2025 9,430,000 5,770,413 15,200,413<br />
2026‐2030 9,870,000 3,853,000 13,723,000<br />
2031‐2033 8,880,000 918,250 9,798,250<br />
Total 49,940,000 40,111,700 90,051,700<br />
583<br />
Return to TOC
Schedule Seven – DETAIL<br />
Long-Term Debt Service<br />
$97,040,000<br />
City <strong>of</strong> Glendale, Arizona<br />
Municipal Property Corporation<br />
Excise Tax Revenue Bonds, Series 2003B – Arena Taxable<br />
Date: June 1, 2003, maturing in 2033.<br />
Rating:<br />
Moody’s “Aaa”<br />
Standard and Poor’s “AAA”<br />
Interest: Semi‐<strong>annual</strong> each January and July, commencing July 1, 2003.<br />
Interest accrues at rates ranging from 2.380% to 5.580%<br />
Purpose:<br />
The Series 2003B (tax‐exempt) bonds were issued to pay for the cost <strong>of</strong><br />
constructing, equipping and furnishing the arena complex and related facilities,<br />
including parking and other public infrastructure.<br />
Debt Service:<br />
Fiscal Year Principal Interest Total<br />
Prior Years 975,000 31,762,922 32,737,922<br />
20<strong>12</strong> 390,000 5,268,735 5,658,735<br />
2013 480,000 5,252,745 5,732,745<br />
2014 575,000 5,232,441 5,807,441<br />
2015 700,000 5,202,081 5,902,081<br />
2016‐2020 <strong>12</strong>,530,000 24,788,349 37,318,349<br />
2021‐2025 25,750,000 16,772,820 42,522,820<br />
2026‐2030 37,605,000 14,8<strong>12</strong>,110 52,417,110<br />
2031‐2033 18,035,000 1,647,774 19,682,774<br />
Total 97,040,000 110,739,977 207,779,977<br />
584<br />
Return to TOC
Schedule Seven – DETAIL<br />
Long-Term Debt Service<br />
$10,880,000<br />
City <strong>of</strong> Glendale, Arizona<br />
Municipal Property Corporation<br />
Excise Tax Revenue Bonds, Series 2004A – Refund Imp Dist<br />
Date: May 1, 2004, maturing in 2014.<br />
Rating:<br />
Moody’s “Aaa”<br />
Standard and Poor’s “AAA”<br />
Interest: Semi‐<strong>annual</strong> each January and July, commencing January 1, 2005.<br />
Interest accrues at rates ranging from 2.000% to 5.000%<br />
Purpose:<br />
The Series 2004A bonds were issued to pay for the refunding <strong>of</strong> the City <strong>of</strong><br />
Glendale Special Improvement District No. 57 Bonds and the City <strong>of</strong> Glendale<br />
Special Improvement District No. 59 Bonds.<br />
Debt Service:<br />
Fiscal Year Principal Interest Total<br />
Prior Years 5,585,000 2,319,850 7,904,850<br />
20<strong>12</strong> 1,665,000 264,750 1,929,750<br />
2013 1,765,000 181,500 1,946,500<br />
2014 1,865,000 93,250 1,958,250<br />
Total 10,880,000 2,859,350 13,739,350<br />
585<br />
Return to TOC
Schedule Seven – DETAIL<br />
Long-Term Debt Service<br />
$33,250,000<br />
City <strong>of</strong> Glendale, Arizona<br />
Municipal Property Corporation<br />
Excise Tax Revenue Bonds, Series 2006A – GRPSTC/Zanjero<br />
Date: June, 1, 2006, maturing in 2026.<br />
Interest: Semi‐<strong>annual</strong> each January and July, commencing January 1, 2007.<br />
Interest accrues at rates ranging from 4.000% to 5.000%<br />
Rating:<br />
Purpose:<br />
Moody’s “Aaa”<br />
Standard and Poor’s “AAA”<br />
The Series 2006A bonds were issued to pay for a portion <strong>of</strong> the cost <strong>of</strong><br />
developing, constructing and equipping a public safety training facility and<br />
constructing infrastructure improvement within the City <strong>of</strong> Glendale.<br />
Debt Service:<br />
Fiscal Year Principal Interest Total<br />
Prior Years 4,880,000 5,891,782 10,771,782<br />
20<strong>12</strong> 1,315,000 1,431,525 2,746,525<br />
2013 1,380,000 1,365,775 2,745,775<br />
2014 1,450,000 1,296,775 2,746,775<br />
2015 1,520,000 1,224,275 2,744,275<br />
2016‐2020 8,830,000 4,900,875 13,730,875<br />
2021‐2025 11,270,000 2,461,875 13,731,875<br />
2026 2,605,000 143,275 2,748,275<br />
Total 33,250,000 18,716,157 51,966,157<br />
586<br />
Return to TOC
Schedule Seven – DETAIL<br />
Long-Term Debt Service<br />
$32,315,000<br />
City <strong>of</strong> Glendale, Arizona<br />
Municipal Property Corporation<br />
Excise Tax Revenue Bonds, Series 2008A – H/Conv/Media (Tax‐Exempt)<br />
Date: June 1, 2008, maturing in 2032.<br />
Interest: Semi‐<strong>annual</strong> each January and July, commencing January 1, 2009.<br />
Interest accrues at rates ranging from 3.000% to 5.000%<br />
Rating:<br />
Purpose:<br />
Moody’s “Aaa”<br />
Standard and Poor’s “AAA”<br />
The Series 2008A (tax‐exempt) bonds were issued to refund and redeem the<br />
Corporation’s outstanding Subordinate Excise Tax Revenue Bonds, Series<br />
2006B. The Series 2006B bonds were used to design, acquire, construct and<br />
equip conference center and related media and parking garage facilities for the<br />
City (Conference Center Project).<br />
Debt Service:<br />
Fiscal Year Principal Interest Total<br />
Prior Years 95,000 3,662,765 3,757,765<br />
20<strong>12</strong> ‐ 1,462,256 1,462,256<br />
2013 ‐ 1,462,256 1,462,256<br />
2014 ‐ 1,462,256 1,462,256<br />
2015 240,000 1,462,256<br />
2016‐2020 7,340,000 6,700,280 14,040,280<br />
2021‐2025 9,015,000 5,029,522 14,044,522<br />
2026‐2030 11,410,000 2,603,580 14,013,580<br />
2031‐2032 4,215,000 261,676 4,476,676<br />
Total 32,315,000 24,106,847 54,719,591<br />
587<br />
Return to TOC
Schedule Seven – DETAIL<br />
Long-Term Debt Service<br />
$52,780,000<br />
City <strong>of</strong> Glendale, Arizona<br />
Municipal Property Corporation<br />
Excise Tax Revenue Bonds, Series 2008B – H/Conv/Media (Taxable)<br />
Date: June 1, 2008, maturing in 2033.<br />
Interest: Semi‐<strong>annual</strong> each January and July, commencing January 1, 2009.<br />
Interest accrues at rates ranging from 5.446% to 6.157%<br />
Rating:<br />
Purpose:<br />
Moody’s “Aaa”<br />
Standard and Poor’s “AAA”<br />
The Series 2008B (taxable) bonds were issued to refund and redeem the<br />
Corporation’s outstanding Subordinate Excise Tax Revenue Bonds, Series 2006B.<br />
The Series 2006B bonds were used to design, acquire, construct and equip<br />
conference center and related media and parking garage facilities for the City<br />
(Conference Center Project).<br />
Debt Service:<br />
Fiscal Year Principal Interest Total<br />
Prior Years 1,705,000 7,763,020 9,468,020<br />
20<strong>12</strong> 470,000 3,076,071 3,546,071<br />
2013 740,000 3,050,475 3,790,475<br />
2014 1,030,000 3,010,174 4,040,174<br />
2015 1,345,000 2,954,081 4,299,081<br />
2016‐2020 7,905,000 13,577,360 21,482,360<br />
2021‐2025 10,550,000 10,938,972 21,488,972<br />
2026‐2030 14,225,000 7,291,426 21,516,426<br />
2031‐2033 14,810,000 2,026,886 16,836,886<br />
Total 52,780,000 53,688,465 106,468,465<br />
588<br />
Return to TOC
Schedule Seven – DETAIL<br />
Long-Term Debt Service<br />
$9,140,000<br />
City <strong>of</strong> Glendale, Arizona<br />
Municipal Property Corporation<br />
Excise Tax Revenue Bonds, Series 2008C – H/Conv/Media (Taxable)<br />
Date: June 1, 2008, maturing in 2015.<br />
Interest: Semi‐<strong>annual</strong> each January and July, commencing January 1, 2009.<br />
Interest accrues at rates ranging from 3.958% to 5.019%<br />
Rating:<br />
Purpose:<br />
Moody’s “Aaa”<br />
Standard and Poor’s “AAA”<br />
The Series 2008C (taxable) bonds were issued to refund and redeem the<br />
Corporation’s outstanding Subordinate Excise Tax Revenue Bonds, Series<br />
2006C. The Series 2006C bonds were used to design, acquire, construct and<br />
equip conference center and related media and parking garage facilities for the<br />
City (Conference Center Project).<br />
Debt Service:<br />
Fiscal Year Principal Interest Total<br />
Prior Years 3,490,000 764,538 4,254,538<br />
20<strong>12</strong> 1,730,000 270,416 2,000,416<br />
2013 1,570,000 190,905 1,760,905<br />
2014 1,350,000 115,922 1,465,922<br />
2015 1,000,000 50,190 1,050,190<br />
Total 9,140,000 1,391,971 10,531,971<br />
589<br />
Return to TOC
Schedule Seven – DETAIL<br />
Long-Term Debt Service<br />
$5,055,000<br />
City <strong>of</strong> Glendale, Arizona<br />
Municipal Property Corporation<br />
Refunding Certificate <strong>of</strong> Participation – AMFP Series 14 ‐ Arena<br />
Date: June 28, 2002, maturing in 2033.<br />
Interest: Semi‐<strong>annual</strong> each February and August, commencing February 1, 2003.<br />
Interest accrues at rates ranging from 5.000% to 5.375%<br />
Purpose:<br />
The refunding certificate <strong>of</strong> participations were issued to refund and retire<br />
prior years outstanding Refunding Certificate <strong>of</strong> Participations and to pay a<br />
portion <strong>of</strong> the costs <strong>of</strong> constructing, equipping, furnishing and otherwise<br />
providing for an approximately 17,500‐seat multipurpose arena facility and<br />
related infrastructure.<br />
Debt Service:<br />
Fiscal Year Principal Interest Total<br />
Prior years ‐ 1,558,576 1,558,576<br />
20<strong>12</strong> ‐ 259,763 259,763<br />
2013 ‐ 259,763 259,763<br />
2014 ‐ 259,763 259,763<br />
2015 ‐ 259,763 259,763<br />
2016‐2020 ‐ 1,298,813 1,298,813<br />
2021‐2025 910,000 1,298,813 2,208,813<br />
2026‐2030 960,000 1,274,356 2,234,356<br />
2031‐2033 3,185,000 429,175 3,614,175<br />
Total 5,055,000 6,898,782 11,953,782<br />
590<br />
Return to TOC
Schedule Seven – DETAIL<br />
Long-Term Debt Service<br />
$7,250,000<br />
City <strong>of</strong> Glendale, Arizona<br />
Municipal Property Corporation<br />
Refunding Certificate <strong>of</strong> Participation – AMFP Refunding Series 16 ‐ Arena<br />
Date: July 31, 2003, maturing in 2033.<br />
Interest: Semi‐<strong>annual</strong> each February and August, commencing February 1, 2004.<br />
Interest accrues at rate <strong>of</strong> 4.7000%<br />
Purpose:<br />
The refunding certificates <strong>of</strong> participations were issued to refund and retire<br />
prior years outstanding Refunding Certificate <strong>of</strong> Participations.<br />
Debt Service:<br />
Fiscal Year Principal Interest Total<br />
Prior years ‐ 2,044,500 2,044,500<br />
20<strong>12</strong> ‐ 340,750 340,750<br />
2013 ‐ 340,750 340,750<br />
2014 ‐ 340,750 340,750<br />
2015 ‐ 340,750 340,750<br />
2016‐2020 ‐ 1,703,750 1,703,750<br />
2021‐2025 ‐ 1,703,750 1,703,750<br />
2026‐2030 ‐ 1,703,750 1,703,750<br />
2031‐2033 7,250,000 1,192,625 8,442,625<br />
Total 7,250,000 9,711,375 16,961,375<br />
591<br />
Return to TOC
Schedule Seven – DETAIL<br />
Long-Term Debt Service<br />
$66,400,000 (Original Issuance)<br />
City <strong>of</strong> Glendale, Arizona<br />
General Obligation Bonds, Series 2003<br />
Date: April 1, 2003, maturing in 2018.<br />
Interest: Semi‐<strong>annual</strong> each January and July, commencing July 1, 2003.<br />
Interest accrues at rates ranging from 1.500% to 5.000%<br />
Rating:<br />
Purpose:<br />
Moody’s “Aa2”<br />
Standard and Poor’s “AA”<br />
The bond proceeds were used to pay for the costs <strong>of</strong> acquisition,<br />
improvement and equipment <strong>of</strong> a variety <strong>of</strong> projects relating to government<br />
facility, maintenance facilities, public safety, streets/parking, flood control,<br />
open space/trails, parks and recreation and water and sewer. $13,875,000 is<br />
related to water and sewer fund and is included in the debt service amount<br />
listed. In November 2010, the General Obligation Refunding Bonds Series<br />
2010 was issued for the purpose <strong>of</strong> refunding a portion <strong>of</strong> the 2014‐2017<br />
maturities <strong>of</strong> the City <strong>of</strong> Glendale G.O. Bonds Series 2003.<br />
Debt Service:<br />
Fiscal Year Principal Interest Total<br />
Prior years 55,175,000 22,371,485 77,546,485<br />
20<strong>12</strong> 3,360,000 397,600 3,757,600<br />
2013 3,530,000 263,200 3,793,200<br />
2014 ‐ 86,700 86,700<br />
2015 ‐ 86,700 86,700<br />
2016‐2018 4,335,000 260,100 4,595,100<br />
Total 66,400,000 23,465,785 89,865,785<br />
592<br />
Return to TOC
Schedule Seven – DETAIL<br />
Long-Term Debt Service<br />
$36,645,000<br />
City <strong>of</strong> Glendale, Arizona<br />
General Obligation Bonds, Series 2004<br />
Date: June 1, 2004, maturing in 2019.<br />
Interest: Semi‐<strong>annual</strong> each January and July, commencing January 1, 2005.<br />
Interest accrues at rates ranging from 3.000% to 5.000%<br />
Rating:<br />
Purpose:<br />
Moody’s “Aa2”<br />
Standard and Poor’s “AA”<br />
The bond proceeds were used to pay for the costs <strong>of</strong> acquisition,<br />
improvement and equipment <strong>of</strong> a variety <strong>of</strong> projects relating to government<br />
facility, maintenance facilities, public safety, streets/parking, flood control,<br />
open space/trails, parks and recreation.<br />
Debt Service:<br />
Fiscal Year Principal Interest Total<br />
Prior years 14,690,000 8,927,306 23,617,306<br />
20<strong>12</strong> 2,350,000 970,494 3,320,494<br />
2013 2,440,000 876,494 3,316,494<br />
2014 2,550,000 778,894 3,328,894<br />
2015 2,665,000 670,519 3,335,519<br />
2016‐2019 11,950,000 1,441,988 13,391,988<br />
Total 36,645,000 13,665,694 50,310,694<br />
593<br />
Return to TOC
Schedule Seven – DETAIL<br />
Long-Term Debt Service<br />
$11,960,000<br />
City <strong>of</strong> Glendale, Arizona<br />
General Obligation Bonds, Series 2005<br />
Date: June 1, 2005, maturing in 2015.<br />
Interest: Semi‐<strong>annual</strong> each January and July, commencing January 1, 2006.<br />
Interest accrues at rates ranging from 3.500% to 4.000%<br />
Rating:<br />
Purpose:<br />
Moody’s “Aa2”<br />
Standard and Poor’s “AA”<br />
The bond proceeds were used to pay for the costs <strong>of</strong> acquisition,<br />
improvement and equipment <strong>of</strong> a variety <strong>of</strong> projects relating to<br />
cultural/historic projects, economic development and public safety.<br />
Debt Service:<br />
Fiscal Year Principal Interest Total<br />
Prior years 6,675,000 2,115,281 8,790,281<br />
20<strong>12</strong> 1,250,000 203,413 1,453,413<br />
2013 1,295,000 158,100 1,453,100<br />
2014 1,345,000 107,919 1,452,919<br />
2015 1,395,000 55,799 1,450,799<br />
Total 11,960,000 2,640,511 14,600,511<br />
594<br />
Return to TOC
Schedule Seven – DETAIL<br />
Long-Term Debt Service<br />
$29,365,000<br />
City <strong>of</strong> Glendale, Arizona<br />
General Obligation Bonds, Series 2006A<br />
Date: June 1, 2006, maturing in 2021.<br />
Interest: Semi‐<strong>annual</strong> each January and July, commencing January 1, 2007.<br />
Interest accrues at rates ranging from 4.000% to 5.000%<br />
Rating:<br />
Purpose:<br />
Moody’s “Aa2”<br />
Standard and Poor’s “AA”<br />
The bond proceeds were used to pay for the costs <strong>of</strong> acquisition,<br />
improvement and equipment <strong>of</strong> a variety <strong>of</strong> projects relating to<br />
streets/parking, parks, public safety and flood control.<br />
Debt Service:<br />
Fiscal Year Principal Interest Total<br />
Prior years 7,820,000 6,044,943 13,864,943<br />
20<strong>12</strong> 1,785,000 971,531 2,756,531<br />
2013 1,850,000 882,281 2,732,281<br />
2014 1,925,000 808,281 2,733,281<br />
2015 2,000,000 7<strong>12</strong>,031 2,7<strong>12</strong>,031<br />
2016‐2020 11,370,000 2,171,219 13,541,219<br />
2021 2,615,000 <strong>12</strong>0,945 2,735,945<br />
Total 29,365,000 11,711,232 41,076,232<br />
595<br />
Return to TOC
Schedule Seven – DETAIL<br />
Long-Term Debt Service<br />
$9,065,000<br />
City <strong>of</strong> Glendale, Arizona<br />
General Obligation Bonds, Series 2006B<br />
Date: June 1, 2006, maturing in 2015.<br />
Interest: Semi‐<strong>annual</strong> each January and July, commencing January 1, 2007.<br />
Interest accrues at rate <strong>of</strong> 5.000%<br />
Rating:<br />
Purpose:<br />
Moody’s “Aa2”<br />
Standard and Poor’s “AA”<br />
The bond proceeds were used to advance refund the <strong>2011</strong>‐2015 maturities <strong>of</strong><br />
the City <strong>of</strong> Glendale General Obligation Bonds Series June 2000.<br />
Debt Service:<br />
Fiscal Year Principal Interest Total<br />
Prior years 1,625,000 2,340,533 3,965,533<br />
20<strong>12</strong> 1,715,000 372,000 2,087,000<br />
2013 1,810,000 286,250 2,096,250<br />
2014 1,905,000 195,747 2,100,747<br />
2015 2,010,000 100,500 2,110,500<br />
Total 9,065,000 3,295,030 <strong>12</strong>,360,030<br />
596<br />
Return to TOC
Schedule Seven – DETAIL<br />
Long-Term Debt Service<br />
$61,000,000<br />
City <strong>of</strong> Glendale, Arizona<br />
General Obligation Bonds, Series 2007<br />
Date: June 26, 2007, maturing in 2022.<br />
Interest: Semi‐<strong>annual</strong> each January and July, commencing January 1, 2008.<br />
Interest accrues at rates ranging from 4.000% to 5.000%<br />
Rating:<br />
Purpose:<br />
Moody’s “Aa2”<br />
Standard and Poor’s “AA”<br />
The bond proceeds were used to pay for the costs <strong>of</strong> acquisition,<br />
improvement and equipment <strong>of</strong> a variety <strong>of</strong> projects relating to<br />
streets/parking, public safety, flood control and government facilities.<br />
Debt Service:<br />
Fiscal Year Principal Interest Total<br />
Prior years <strong>12</strong>,860,000 10,019,489 22,879,489<br />
20<strong>12</strong> 3,520,000 2,190,588 5,710,588<br />
2013 3,660,000 2,040,988 5,700,988<br />
2014 3,805,000 1,885,438 5,690,438<br />
2015 3,960,000 1,723,725 5,683,725<br />
2016‐2020 22,550,000 5,813,575 28,363,575<br />
2021‐2022 10,645,000 750,250 11,395,250<br />
Total 61,000,000 24,424,052 85,424,052<br />
597<br />
Return to TOC
Schedule Seven – DETAIL<br />
Long-Term Debt Service<br />
$41,650,000<br />
City <strong>of</strong> Glendale, Arizona<br />
General Obligation Bonds, Series 2009B<br />
(Taxable Direct‐Pay Build America Bond)<br />
Date: Dec 8, 2009, maturing in 2028.<br />
Interest: Semi‐<strong>annual</strong> each January and July, commencing July 1, 2010.<br />
Interest accrues at rates ranging from 1.500% to 5.625%<br />
Rating:<br />
Purpose:<br />
Moody’s “Aa2”<br />
Standard and Poor’s “AA”<br />
The bond proceeds were used to pay for the costs <strong>of</strong> acquisition, improvement<br />
and equipment <strong>of</strong> a variety <strong>of</strong> projects relating to economic development,<br />
government facilities, public safety, flood control, and parks & recreation.<br />
Debt Service:<br />
Fiscal Year Principal Interest Total<br />
Prior years 1,270,000 2,942,377 4,2<strong>12</strong>,377<br />
20<strong>12</strong> 1,280,000 1,910,378 3,190,378<br />
2013 1,295,000 1,881,578 3,176,578<br />
2014 1,315,000 1,849,202 3,164,202<br />
2015 1,335,000 1,809,752 3,144,752<br />
2016‐2020 9,885,000 8,057,094 17,942,094<br />
2021‐2025 11,515,000 5,684,420 17,199,420<br />
2026‐2030 13,755,000 2,408,968 16,163,968<br />
Total 41,650,000 26,543,769 68,193,769<br />
598<br />
Return to TOC
Schedule Seven – DETAIL<br />
Long-Term Debt Service<br />
$38,300,000<br />
City <strong>of</strong> Glendale, Arizona<br />
General Obligation Refunding Bonds, Series 2010<br />
Date: Nov 30, 2010, maturing in 2022.<br />
Interest: Semi‐<strong>annual</strong> each January and July, commencing July 1, <strong>2011</strong>.<br />
Interest accrues at rates ranging from 2.000% to 5.000%<br />
Rating:<br />
Purpose:<br />
Moody’s “Aa1”<br />
Standard and Poor’s “AA”<br />
The bond proceeds were used to advance refund the 20<strong>12</strong>‐2022maturities <strong>of</strong> the<br />
City <strong>of</strong> Glendale General Obligation Refunding Bonds Series 2002 and the 2014‐<br />
2017 maturities <strong>of</strong> General Obligation Bonds Series 2003. The proceeds were also<br />
used to pay for the issuance costs <strong>of</strong> the refunding project.<br />
Debt Service:<br />
Fiscal Year Principal Interest Total<br />
Prior years ‐ 977,399 977,399<br />
20<strong>12</strong> ‐ 1,667,600 1,667,600<br />
2013 ‐ 1,667,600 1,667,600<br />
2014 2,475,000 1,667,600 4,142,600<br />
2015 5,645,000 1,568,600 7,213,600<br />
2016‐2020 23,600,000 4,439,000 28,039,000<br />
2021‐2022 6,580,000 430,100 7,010,100<br />
Total 38,300,000 <strong>12</strong>,417,899 50,717,899<br />
599<br />
Return to TOC
Schedule Seven – DETAIL<br />
Long-Term Debt Service<br />
$80,000,000<br />
City <strong>of</strong> Glendale, Arizona<br />
Subordinate Lien Water & Sewer Revenue Obligations, Series 2003<br />
Date: December 1, 2003, maturing in 2028.<br />
Interest: Semi‐<strong>annual</strong> each January and July, commencing July 1, 2004.<br />
Interest accrues at rate <strong>of</strong> 5.000%<br />
Rating:<br />
Purpose:<br />
Moody’s “Aaa”<br />
Standard and Poor’s “AAA”<br />
The proceeds <strong>of</strong> the obligations were used to pay for the expansion <strong>of</strong> the<br />
existing West Area Water Reclamation Facility, payments for the City’s share<br />
<strong>of</strong> upgrades to and expansion <strong>of</strong> the 91 st Avenue Regional Wastewater<br />
Treatment Plant, replacement and rehabilitation <strong>of</strong> water lines throughout<br />
the system, a water resource master plan and water treatment plant design,<br />
design and construction <strong>of</strong> facilities at the Cholla Water Treatment Plant to<br />
meet solids handling regulations and land purchase for a water plant.<br />
Debt Service:<br />
Fiscal Year Principal Interest Total<br />
Prior years 2,595,000 23,836,500 26,431,500<br />
20<strong>12</strong> 2,725,000 3,843,000 6,568,000<br />
2013 2,830,000 3,734,000 6,564,000<br />
2014 2,975,000 3,592,500 6,567,500<br />
2015 3,<strong>12</strong>0,000 3,443,750 6,563,750<br />
2016‐2020 18,<strong>12</strong>0,000 14,714,750 32,834,750<br />
2021‐2025 26,680,000 9,537,000 36,217,000<br />
2026‐2028 20,955,000 2,<strong>12</strong>9,750 23,084,750<br />
Total 80,000,000 64,831,250 144,831,250<br />
600<br />
Return to TOC
Schedule Seven – DETAIL<br />
Long-Term Debt Service<br />
$80,000,000<br />
City <strong>of</strong> Glendale, Arizona<br />
Subordinate Lien Water & Sewer Revenue Obligations, Series 2006<br />
Date: February 7, 2006, maturing in 2026.<br />
Interest: Semi‐<strong>annual</strong> each January and July, commencing July 1, 2006.<br />
Interest accrues at rates ranging from 4.000% to 5.250%<br />
Rating:<br />
Purpose:<br />
Moody’s “Aaa”<br />
Standard and Poor’s “AAA”<br />
The proceeds <strong>of</strong> the obligations were used to pay for the City’s share <strong>of</strong><br />
upgrades to, and expansion <strong>of</strong>, the 91 st Avenue Regional Wastewater<br />
Treatment Plant, replacement and rehabilitation <strong>of</strong> water lines throughout<br />
the system, water resource master plan and water treatment plant design,<br />
design and construction <strong>of</strong> facilities at the Cholla Water Treatment Plant to<br />
meet solids handling regulations and construction <strong>of</strong> a water treatment plant.<br />
Debt Service:<br />
Fiscal Year Principal Interest Total<br />
Prior years 3,455,000 19,849,800 23,304,800<br />
20<strong>12</strong> 3,590,000 3,577,831 7,167,831<br />
2013 3,745,000 3,434,231 7,179,231<br />
2014 3,925,000 3,237,619 7,162,619<br />
2015 4,140,000 3,031,556 7,171,556<br />
2016‐2020 24,060,000 11,782,531 35,842,531<br />
2021‐2025 30,220,000 5,627,588 35,847,588<br />
2026 6,865,000 308,925 7,173,925<br />
Total 80,000,000 50,850,081 130,850,081<br />
601<br />
Return to TOC
Schedule Seven – DETAIL<br />
Long-Term Debt Service<br />
$44,500,000<br />
City <strong>of</strong> Glendale, Arizona<br />
Subordinate Lien Water & Sewer Revenue Obligations, Series 2007<br />
Date: June 15, 2007, maturing in 2027.<br />
Interest: Semi‐<strong>annual</strong> each January and July, commencing January 1, 2008.<br />
Interest accrues at rates ranging from 4.250% to 5.000%<br />
Rating:<br />
Purpose:<br />
Moody’s “Aaa”<br />
Standard and Poor’s “AAA”<br />
The proceeds <strong>of</strong> the obligations were used to pay for the City’s share <strong>of</strong><br />
upgrades to, and expansion <strong>of</strong>, the 91 st Avenue Regional Wastewater<br />
Treatment Plant, replacement and rehabilitation <strong>of</strong> water lines throughout<br />
the system, water resource master plan and water treatment plant design,<br />
design and construction <strong>of</strong> upgrades at the Cholla Water Treatment Plant to<br />
meet federal regulations, construction <strong>of</strong> water treatment plants and<br />
associated transmission lines and design and construction <strong>of</strong> upgrades at the<br />
wastewater treatment plants to meet federal regulations.<br />
Debt Service:<br />
Fiscal Year Principal Interest Total<br />
Prior years 3,650,000 8,321,554 11,971,554<br />
20<strong>12</strong> 1,775,000 1,960,188 3,735,188<br />
2013 1,840,000 1,884,750 3,724,750<br />
2014 1,930,000 1,806,550 3,736,550<br />
2015 2,010,000 1,722,113 3,732,113<br />
2016‐2020 11,620,000 7,043,615 18,663,615<br />
2021‐2025 14,710,000 3,952,813 18,662,813<br />
2026‐2027 6,965,000 499,975 7,464,975<br />
Total 44,500,000 27,191,557 71,691,557<br />
602<br />
Return to TOC
Schedule Seven – DETAIL<br />
Long-Term Debt Service<br />
$65,500,000<br />
City <strong>of</strong> Glendale, Arizona<br />
Subordinate Lien Water & Sewer Revenue Obligations, Series 2008<br />
Date: February 1, 2008, maturing in 2028.<br />
Interest: Semi‐<strong>annual</strong> each January and July, commencing July 1, 2008.<br />
Interest accrues at rates ranging from 3.000% to 5.000%<br />
Rating:<br />
Purpose:<br />
Moody’s “Aaa”<br />
Standard and Poor’s “AAA”<br />
The proceeds <strong>of</strong> the obligations were used to pay for the City’s share <strong>of</strong><br />
upgrades to, and expansion <strong>of</strong>, the 91 st Avenue Regional Wastewater<br />
Treatment Plant, replacement and rehabilitation <strong>of</strong> water lines throughout<br />
the system, water resource master plan and water treatment plant design,<br />
design and construction <strong>of</strong> upgrades at the Cholla Water Treatment Plant to<br />
meet federal regulations, construction <strong>of</strong> water treatment plants and<br />
associated transmission lines and design and construction <strong>of</strong> upgrades at the<br />
wastewater treatment plants to meet federal regulations.<br />
Debt Service:<br />
Fiscal Year Principal Interest Total<br />
Prior years 6,945,000 8,233,014 15,178,014<br />
20<strong>12</strong> 2,455,000 2,604,038 5,059,038<br />
2013 2,540,000 2,518,113 5,058,113<br />
2014 2,630,000 2,429,213 5,059,213<br />
2015 2,730,000 2,330,588 5,060,588<br />
2016‐2020 19,535,000 9,921,350 29,456,350<br />
2021‐2025 14,885,000 6,254,775 21,139,775<br />
2026‐2028 13,780,000 1,400,500 15,180,500<br />
Total 65,500,000 35,691,589 101,191,589<br />
603<br />
Return to TOC
Schedule Seven – DETAIL<br />
Long-Term Debt Service<br />
$25,685,000<br />
City <strong>of</strong> Glendale, Arizona<br />
Subordinate Lien Water and Sewer Revenue Obligations<br />
Series 2010A (Taxable Direct Pay Build America Bonds)<br />
Date: November 30, <strong>2011</strong>, maturing in 2030.<br />
Interest: Semi‐<strong>annual</strong> each January and July, commencing July 1, <strong>2011</strong>.<br />
Interest accrues at rates ranging from 6.200% to 6.550%<br />
Rating:<br />
Purpose:<br />
Moody’s “Aa3”<br />
Standard and Poor’s “AA+”<br />
The proceeds <strong>of</strong> the obligations were used for various improvement and extensions <strong>of</strong><br />
the system which are contained in the City’s water and sewer Capital Improvement<br />
Plan, including, without limitation, (a) payments for the City’s share <strong>of</strong> upgrades to and<br />
the expansion <strong>of</strong> the 91 st Avenue Regional Wastewater Treatment Plan, (b)<br />
replacement and rehabilitation <strong>of</strong> water lines throughout the System, (c) various water<br />
treatment plant improvements and construction <strong>of</strong> associated transmissions lines and<br />
(d) design and construction <strong>of</strong> upgrades at the wastewater treatment plants to meet<br />
federal regulations.<br />
Debt Service:<br />
Fiscal Year Principal Interest Total<br />
Prior years ‐ 960,553 960,553<br />
20<strong>12</strong> ‐ 1,638,858 1,638,858<br />
2013 ‐ 1,638,858 1,638,858<br />
2014 ‐ 1,638,558 1,638,558<br />
2015 ‐ 1,638,858 1,638,858<br />
2016‐2020 ‐ 8,194,288 8,194,288<br />
2021‐2025 ‐ 8,194,288 8,194,288<br />
2026‐2030 25,685,000 5,855,003 31,540,003<br />
Total 25,685,000 29,759,260 55,444,260<br />
604<br />
Return to TOC
Schedule Seven – DETAIL<br />
Long-Term Debt Service<br />
$14,543,766<br />
City <strong>of</strong> Glendale, Arizona<br />
Water and Sewer Revenue Bonds Series 2001 (WIFA Loan)<br />
(Water Infrastructure Funding Authority)<br />
Date: Closing date January 2001. Maturing in 2019<br />
Interest: Semi‐<strong>annual</strong> each January and July, commencing January 1, 2005.<br />
Interest accrues at rate <strong>of</strong> 3.784%<br />
Purpose:<br />
The proceeds from this obligation were used to pay for Cholla Water Treatment Plant<br />
expansion.<br />
Debt Service:<br />
Fiscal Year Principal Interest Total<br />
Prior years 4,640,898 3,140,097 7,780,996<br />
20<strong>12</strong> 856,067 164,609 1,020,676<br />
2013 888,460 145,057 1,033,517<br />
2014 922,080 <strong>12</strong>4,764 1,046,844<br />
2015 956,971 103,704 1,060,675<br />
2016‐2019 3,583,488 187,816 3,771,304<br />
Total 11,847,964 3,866,048 15,714,0<strong>12</strong><br />
605<br />
Return to TOC
Schedule Seven – DETAIL<br />
Long-Term Debt Service<br />
$6,340,000<br />
City <strong>of</strong> Glendale, Arizona<br />
Water and Sewer Revenue Bonds Series 2010 (WIFA Loan)<br />
(Water Infrastructure Funding Authority)<br />
Date: Closing date March 19, 2010. Maturing in 2029<br />
Interest: Semi‐<strong>annual</strong> each January and July, commencing July 1, 2010.<br />
Interest accrues at rate <strong>of</strong> 3.145%<br />
Purpose:<br />
The proceeds will be used for planning and design <strong>of</strong> the 2 nd phase <strong>of</strong> ground<br />
water treatment at the Oasis facility.<br />
Debt Service:<br />
Fiscal Year Principal Interest Total<br />
Prior years 248,928 255,889 504,817<br />
20<strong>12</strong> 256,757 191,564 448,321<br />
2013 264,832 183,490 448,322<br />
2014 273,161 175,160 448,321<br />
2015 281,752 166,570 448,322<br />
2016‐2020 1,547,381 694,224 2,241,605<br />
2021‐2025 1,806,501 435,106 2,241,607<br />
2026‐2029 1,660,688 132,592 1,793,280<br />
Total 6,340,000 2,234,595 8,574,595<br />
606<br />
Return to TOC
Schedule Seven – DETAIL<br />
Long-Term Debt Service<br />
$14,655,000<br />
City <strong>of</strong> Glendale, Arizona<br />
Street and Highway User Revenue and Refunding Bonds, Series 2004<br />
Date: June 1, 2004, maturing in 2014.<br />
Interest: Semi‐<strong>annual</strong> each January and July, commencing January 1, 2005.<br />
Interest accrues at rates ranging from 2.500% to 4.000%<br />
Rating:<br />
Purpose:<br />
Moody’s “Aaa”<br />
Standard and Poor’s “AAA”<br />
The bonds were used to finance the improvement, construction,<br />
reconstruction, acquisition <strong>of</strong> right‐<strong>of</strong>‐way or maintenance <strong>of</strong> streets and<br />
highways <strong>of</strong> the City including certain traffic control devices and to refund<br />
portions <strong>of</strong> the City’s outstanding highway revenue bonds.<br />
Debt Service:<br />
Fiscal Year Principal Interest Total<br />
Prior years 7,075,000 3,011,109 10,086,109<br />
20<strong>12</strong> 2,435,000 290,913 2,725,913<br />
2013 2,525,000 202,644 2,727,644<br />
2014 2,620,000 104,800 2,724,800<br />
Total 14,655,000 3,609,465 18,264,465<br />
607<br />
Return to TOC
Schedule Seven – DETAIL<br />
Long-Term Debt Service<br />
$15,745,000<br />
City <strong>of</strong> Glendale, Arizona<br />
Street and Highway User Revenue Bonds, Series 2006<br />
Date: April 11, 2006, maturing in 2016.<br />
Interest: Semi‐<strong>annual</strong> each January and July, commencing January 1, 2007.<br />
Interest accrues at rates ranging from 4.000% to 5.000%<br />
Rating:<br />
Purpose:<br />
Moody’s “Aaa”<br />
Standard and Poor’s “AAA”<br />
The bonds were issued to finance the improvement, construction, acquisition<br />
<strong>of</strong> right‐<strong>of</strong>‐way or maintenance <strong>of</strong> streets and highways <strong>of</strong> the City including<br />
a bridge and noise walls.<br />
Debt Service:<br />
Fiscal Year Principal Interest Total<br />
Prior years 7,035,000 2,851,719 9,886,719<br />
20<strong>12</strong> 1,605,000 365,425 1,970,425<br />
2013 1,670,000 301,225 1,971,225<br />
2014 1,735,000 226,075 1,961,075<br />
2015 1,805,000 148,000 1,953,000<br />
2016 1,895,000 75,800 1,970,800<br />
Total 15,745,000 3,968,244 19,713,244<br />
608<br />
Return to TOC
Schedule Seven – DETAIL<br />
Long-Term Debt Service<br />
$137,495,000<br />
City <strong>of</strong> Glendale, Arizona<br />
Western Loop 101<br />
Public Facilities Corp, Series 2008A<br />
Date: October 1, 2008, maturing in 2038.<br />
Interest: Semi‐<strong>annual</strong> each January and July, commencing July 1, 2009.<br />
Interest accrues at rates ranging from 6.000% to 7.000%<br />
Rating:<br />
Purpose:<br />
Moody’s “A2”<br />
Standard and Poor’s “AA”<br />
Most <strong>of</strong> the proceeds were deposited to the acquisition and construction<br />
project related to the design and construction <strong>of</strong> a new Major League Baseball<br />
spring training stadium and related facilities. The remaining proceeds were<br />
used toward capitalized interest on 2008 bond issuance and issuance costs.<br />
Debt Service:<br />
Prior years ‐ 32,329,108 32,329,108<br />
20<strong>12</strong> ‐ 380,000 380,000<br />
2013 ‐ 8,913,913 8,913,913<br />
2014 ‐ 8,913,913 8,913,913<br />
2015 ‐ 8,913,913 8,913,913<br />
2016‐2020 9,980,000 43,732,265 53,7<strong>12</strong>,265<br />
2021‐2025 14,710,000 39,847,315 54,557,315<br />
2026‐2030 26,695,000 33,845,065 60,540,065<br />
2031‐2035 43,350,000 22,707,140 66,057,140<br />
2036‐2038 42,760,000 5,452,813 48,2<strong>12</strong>,813<br />
Total 137,495,000 205,035,445 342,530,445<br />
609<br />
Return to TOC
Schedule Seven – DETAIL<br />
Long-Term Debt Service<br />
$48,670,000<br />
City <strong>of</strong> Glendale, Arizona<br />
Western Loop 101<br />
Public Facilities Corp, Series 2008B<br />
Date: October 1, 2008, maturing in 2038.<br />
Interest: Semi‐<strong>annual</strong> each January and July, commencing July 1, 2009.<br />
Interest accrues at rates ranging from 5.000% to 7.000%<br />
Rating:<br />
Purpose:<br />
Moody’s “A2”<br />
Standard and Poor’s “AA”<br />
Most <strong>of</strong> the proceeds were deposited to the acquisition and construction<br />
project related to the design and construction <strong>of</strong> a new Major League Baseball<br />
spring training stadium and related facilities. The remaining proceeds were<br />
used toward capitalized interest on 2008 bond issuance and issuance costs.<br />
Debt Service:<br />
Fiscal Year Principal Interest Total<br />
Prior years ‐ 11,294,091 11,294,091<br />
20<strong>12</strong> ‐ ‐ ‐<br />
2013 ‐ 3,077,875 3,077,875<br />
2014 ‐ 3,077,875 3,077,875<br />
2015 3,077,875 3,077,875<br />
2016‐2020 2,555,000 15,131,826 17,686,826<br />
2021‐2025 5,130,000 13,839,415 18,969,415<br />
2026‐2030 8,265,000 11,897,551 20,162,551<br />
2031‐2035 13,110,000 8,041,225 21,151,225<br />
2036‐2039 19,610,000 1,931,251 21,541,251<br />
Total 48,670,000 71,368,984 <strong>12</strong>0,038,984<br />
610<br />
Return to TOC
Schedule Seven – DETAIL<br />
Long-Term Debt Service<br />
$13,585,000<br />
City <strong>of</strong> Glendale, Arizona<br />
Western Loop 101<br />
Public Facilities Corp, Series 2008C<br />
Date: October 1, 2008, maturing in 2017.<br />
Interest: Semi‐<strong>annual</strong> each January and July, commencing July 1, 2009.<br />
Interest accrues at rates <strong>of</strong> 7.500%<br />
Rating:<br />
Purpose:<br />
Moody’s “A2”<br />
Standard and Poor’s “AA”<br />
Most <strong>of</strong> the proceeds were deposited into a revenue stabilization fund to be<br />
used toward interest payments <strong>of</strong> Series A and B. The remainder was used<br />
toward the design and construction <strong>of</strong> a new Major League Baseball spring<br />
training stadium and related facilities, and for capitalized interest on 2008<br />
bond issuance costs.<br />
Debt Service:<br />
Fiscal Year Principal Interest Total<br />
Prior years ‐ 3,738,705 3,738,705<br />
20<strong>12</strong> ‐ ‐ ‐<br />
2013 ‐ 1,018,875 1,018,875<br />
2014 2,940,000 1,018,875 3,958,875<br />
2015 4,975,000 798,375 5,773,375<br />
2016‐2017 5,670,000 457,500 6,<strong>12</strong>7,500<br />
Total 13,585,000 7,032,330 20,617,330<br />
611<br />
Return to TOC
Schedule Seven – DETAIL<br />
Long-Term Debt Service<br />
$109,110,000<br />
City <strong>of</strong> Glendale, Arizona<br />
Transportation Excise Tax Revenue Obligations, Series 2007<br />
Date: October 16, 2007, maturing in 2032.<br />
Rating:<br />
Moody’s: “Aaa”<br />
Standard and Poor’s : “AAA”<br />
Interest: Semi<strong>annual</strong> each January and July, commencing July 1, 2008.<br />
Interest accrues at rates ranging from 4.000% to 5.000%<br />
Purpose:<br />
The proceeds were used to construct transportation projects including design,<br />
construction and right‐<strong>of</strong>‐way acquisitions. Most <strong>of</strong> the funding was used to<br />
construct street projects such as roadway widening and intersections<br />
improvements. Funding was also used to construct transit stops, bicycle<br />
connections, park and ride lots and airport projects.<br />
Debt Service:<br />
Fiscal Year Principal Interest Total<br />
Prior years <strong>12</strong>,075,000 17,240,297 29,315,297<br />
20<strong>12</strong> 2,890,000 4,436,882 7,326,882<br />
2013 3,005,000 4,321,281 7,326,281<br />
2014 3,<strong>12</strong>5,000 4,201,082 7,326,082<br />
2015 3,250,000 4,076,082 7,326,082<br />
2016‐2020 18,645,000 17,992,310 36,637,310<br />
2021‐2025 23,095,000 13,546,442 36,641,442<br />
2026‐2030 22,885,000 6,432,554 29,317,554<br />
2031‐2032 20,140,000 1,839,150 21,979,150<br />
Total 109,110,000 74,086,080 183,196,080<br />
6<strong>12</strong><br />
Return to TOC
Schedule Eight<br />
Scheduled Lease Payments<br />
Lease Desc. & Account <strong>2011</strong>-<strong>12</strong> 20<strong>12</strong>-13 2013-14 2014-15 2015-16<br />
Northern Crossing *<br />
1000-11380-560400 1,611,111 1,611,111 - - -<br />
1000-11380-560600 205,417 68,472 - - -<br />
Savings from Lease Restructuring ** (1,784,332) - - - -<br />
Total 32,196 1,679,583 - - -<br />
Fire Trucks & Equipment - '07 Lease<br />
1000-11380-560400 66,303 68,826 71,445 48,286 50,<strong>12</strong>3<br />
1000-11380-560600 10,879 8,356 5,736 3,259 1,422<br />
Savings from Lease Restructuring ** (66,303)<br />
Total 10,879 77,181 77,181 51,545 51,545<br />
Hickman - '03 B<strong>of</strong>A Lease *<br />
1000-11380-560400 4,800,000 - - - -<br />
1000-11380-560600 360,000 - - - -<br />
Savings from Lease Restructuring ** (4,800,000)<br />
Total 360,000 - - - -<br />
Interfund borrowing - Landfill Fund<br />
1000-11380-560400 - 2,029,375 2,070,337 2,1<strong>12</strong>,<strong>12</strong>5 -<br />
1000-11380-560600 - 105,701 64,737 22,951 -<br />
Total - 2,135,076 2,135,074 2,135,076 -<br />
Parks & Rec Copier - De Lage Landen Public Finance LLC<br />
1000-14700-560400 5,727 6,546 1,778 - -<br />
1000-14700-560600 1,545 726 40 - -<br />
Total 7,272 7,272 1,818 - -<br />
1000 - General Fund Total: 410,347 3,899,1<strong>12</strong> 2,214,073 2,186,621 51,545<br />
Library Copier - '09 Kansas State Bank<br />
<strong>12</strong>60-15410-560400 5,158 5,607 - - -<br />
<strong>12</strong>60-15410-560600 938 488 - - -<br />
Total 6,095 6,095 - - -<br />
<strong>12</strong>60 - Library Fund Total: 6,095 6,095 - - -<br />
Frontload Truck - '07 Lease<br />
2480-17820-560400 46,146 - - -<br />
2480-17820-560600 1,309 - - -<br />
Total 47,455 - - - -<br />
Three (3) Frontloaders - '09 Lease (Interfund Borrowing)<br />
2480-17820-560400 148,156 150,939 153,775<br />
2480-17820-560600 7,779 4,996 2,160<br />
Total 155,935 155,935 155,935 - -<br />
613<br />
Return to TOC
Schedule Eight<br />
Scheduled Lease Payments<br />
Lease Desc. & Account <strong>2011</strong>-<strong>12</strong> 20<strong>12</strong>-13 2013-14 2014-15 2015-16<br />
Two (2) Sideloader Refuse Trucks - '07 Lease<br />
2480-17830-560400 87,988 - - - -<br />
2480-17830-560600 2,496 - - - -<br />
Total 90,484 - - - -<br />
Sideloader -'09 Lease (Interfund Borrowing)<br />
2480-17830-560400 42,610 43,410 44,226 - -<br />
2480-17830-560600 2,237 1,437 621 - -<br />
Total 44,847 44,847 44,847 - -<br />
Tractor - '07 Lease<br />
2480-17840-560400 16,702 - - - -<br />
2480-17840-560600 474 - - - -<br />
Total 17,176 - - - -<br />
Rearloader - '09 Lease (Interfund Borrowing)<br />
2480-17840-560400 46,646 47,522 48,415 - -<br />
2480-17840-560600 2,449 1,573 680 - -<br />
Total 49,095 49,095 49,095 - -<br />
2480 - Sanitation Fund Total: 404,992 249,877 249,877 - -<br />
Grand Total: 821,434 4,155,085 2,463,950 2,186,621 51,545<br />
* Variable Rate Lease<br />
** Savings expected to be recognized in FY20<strong>12</strong> from restructuring these leases. New debt service<br />
schedules for Northern Crossing and Fire Truck and Equipment are not yet available.<br />
614<br />
Return to TOC
Name Dept / Program Name Insurance<br />
Workers'<br />
Compensation<br />
Schedule Nine<br />
Internal Service Premiums<br />
Note: The following amounts provide for departmental participation in the <strong>city</strong>'s self insurance fund, workers' compensation fund, vehicle and<br />
technology replacement programs and telephone fund. The rates are approved by the Budget Office based on computer models established for<br />
each fund. Monthly amounts should be charged against departmental operating <strong>budget</strong>s by the Finance Department during the fiscal year.<br />
Fund<br />
Vehicle<br />
Replacement<br />
Technology<br />
Replacement<br />
Telephone<br />
1000 - General<br />
Marketing and Comm.<br />
Audio/Visual $1,067 $70 $1,538 $31,003<br />
PD - Emergency Management $415<br />
Mayor<br />
Office <strong>of</strong> the Mayor $1,922 $72 $1,433 $2,821<br />
Council Office<br />
Cactus District $1,461<br />
Cholla District $1,310<br />
Council Office $5,563 $3,760 $5,542 $3,065<br />
Ocotillo District $1,637<br />
Sahuaro District $1,473<br />
Yucca District $818<br />
City Clerk<br />
City Clerk $2,084 $451 $2,564 $3,203<br />
Elections $350<br />
Records Management $894 $49 $2,747<br />
City Manager<br />
City Manager $4,317 $<strong>12</strong>6 $2,892 $2,543<br />
Compliance & Asset Mgt<br />
City Auditor $1,183 $17 $1,265 $862<br />
Intergovt. Programs<br />
Intergovernmental Programs $2,908 $72 $1,553 $1,171<br />
City Court<br />
City Court $20,562 $1,560 $1,449 $6,592 $16,138<br />
City Attorney<br />
City Attorney $20,264 $544 $9,778 $7,818<br />
Marketing and Comm.<br />
Cable Communications $3,676 $172 $2,930 $42,272<br />
City-Wide Special Events $2,873 $81 $1,832 $1,020<br />
Marketing $6,181 $181 $4,418 $4,280<br />
Tourism $1,792 $652 $1,415 $4,898<br />
Conv./Media/Parking<br />
Convention/Media/Parking $805 $<strong>12</strong>8,964<br />
Media Center Operations $648 $3<strong>12</strong> $14,005<br />
Comm. Action Program<br />
CAP Local Match $329 $3,151 $16,480<br />
Human Resources<br />
Benefits $639 $23 $175<br />
Compensation $2,778 $108 $216<br />
Employee Relations $986 $292<br />
Employment Services $1,451 $631<br />
615<br />
Return to TOC
Name Dept / Program Name Insurance<br />
Workers'<br />
Compensation<br />
Schedule Nine<br />
Internal Service Premiums<br />
Note: The following amounts provide for departmental participation in the <strong>city</strong>'s self insurance fund, workers' compensation fund, vehicle and<br />
technology replacement programs and telephone fund. The rates are approved by the Budget Office based on computer models established for<br />
each fund. Monthly amounts should be charged against departmental operating <strong>budget</strong>s by the Finance Department during the fiscal year.<br />
Fund<br />
Vehicle<br />
Replacement<br />
Technology<br />
Replacement<br />
Telephone<br />
Human Resources<br />
Human Resources Administration $2,946 $328 $9,751 $8,830<br />
Organizational Development $442 $18 $216<br />
Risk Management/Safety $1,051 $284 $1,606 $888<br />
Admin Svcs Admin.<br />
Administration Services Admin. $2,953 $81 $1,230 $2,645<br />
Finance<br />
Accounting Services $6,611 $421<br />
Finance Administration $2,076 $1,947 $8,838 $6,080<br />
License/Collection $4,329 $1,210 $992 $7,338 $3,146<br />
Materials Control Warehouse $2,438 $3,251 $2,906 $1,752 $2,089<br />
Materials Management $2,060 $72 $2,<strong>12</strong>0 $1,171<br />
Info. Technology<br />
Information Technology $14,458 $2,526 $2,348 $479,369 $11,619<br />
Management & Budget<br />
Budget & Research $3,254 $108 $2,820 $1,385<br />
Grants Administration $434 $18 $432 $170<br />
Police Department<br />
PD - Fiscal Management $892,8<strong>12</strong> $304,177 $424,<strong>12</strong>1 $151,0<strong>12</strong> $158,028<br />
Fire Department<br />
Air-Med & Logistics Ops (HALO) $1,486<br />
Ambulance Services $455<br />
Fire Administration $189,035 $3,019<br />
Fire Marshal's Office $2,882<br />
Fire Medical Services & Health $247<br />
Fire Operations $152,233<br />
Fire Resource Management $3,547 $56,511 $30,358 $94,269<br />
Parks & Recreation<br />
Adult Center $7,193 $3,986<br />
Aquatics $1,950 $432<br />
Foothills Recreation Center $6,170 $5,041 $8,754 $9,605<br />
Glendale Community Center $887 $690<br />
Historic Sahuaro Ranch $1,421 $761 $240 $<strong>12</strong>,055<br />
Marketing - Parks & Rec $199<br />
Park Irrigation $9,853 $994<br />
Park Rangers $1,737 $1,851 $672<br />
Parks & Recreation Admin. $36 $648<br />
Parks CIP & Planning $1,138 $53 $1,322<br />
Parks Maintenance $18,237 $6,909 $18,388 $1,596<br />
Pool Maintenance $1,684 $702<br />
Recreation Support Services $47,700 $299 $19,965 $13,758 $38,492<br />
Special Events and Programs $364 $216<br />
616<br />
Return to TOC
Name Dept / Program Name Insurance<br />
Workers'<br />
Compensation<br />
Schedule Nine<br />
Internal Service Premiums<br />
Note: The following amounts provide for departmental participation in the <strong>city</strong>'s self insurance fund, workers' compensation fund, vehicle and<br />
technology replacement programs and telephone fund. The rates are approved by the Budget Office based on computer models established for<br />
each fund. Monthly amounts should be charged against departmental operating <strong>budget</strong>s by the Finance Department during the fiscal year.<br />
Fund<br />
Vehicle<br />
Replacement<br />
Technology<br />
Replacement<br />
Telephone<br />
Parks & Recreation<br />
Sports and Health $1,006<br />
Youth and Teen $2,910 $3,771<br />
Comm. Partnerships<br />
Community Revitalization $2,139 $69 $1,296 $4,394 $3,240<br />
Neighborhood Partnership $2,000 $81 $556 $2,394 $2,410<br />
Library & Arts<br />
Arts Maintenance - Admin. $81 $230<br />
Library $40,901 $5,910 $1,732 $71,287 $46,1<strong>12</strong><br />
Community Dev Admin<br />
CD Deputy City Manager $767 $18 $290 $170<br />
Building Safety<br />
Building Safety $<strong>12</strong>,573 $4,540 $10,209 $10,977 $6,552<br />
Development Services Center $2,740 $111 $4,152 $7,7<strong>12</strong><br />
Planning<br />
Current Planning $2,913 $108 $1,728 $862<br />
Long-Range Planning & Research $880 $36 $923 $170<br />
Planning Administration $1,672 $54 $4,047 $1,662<br />
Economic Development<br />
Downtown Beaut. & Promotion $1,750 $1,249 $1,260 $456<br />
Economic Development $2,943 $90 $3,606 $1,694<br />
Code Compliance<br />
Code Compliance $9,700 $957 $8,885 $6,266 $4,607<br />
Field Operations<br />
Cemetery $1,130 $570 $2,321 $3,299<br />
Custodial Services $7,804 $14,072 $8,369 $1,536<br />
Downtown Parking Garage $262<br />
Facilities Management $33,493 $18,869 $20,603 $1,370 $23,669<br />
Field Operations Admin. $2,132 $36 $2,371 $22,107<br />
Graffiti Removal $2,317 $1,190 $3,408<br />
Engineering<br />
CIP Administration $9<strong>12</strong> $3,422 $6,948<br />
Construction Inspection $3,071 $3,707 $633<br />
Engineering Administration $25,665 $90 $3,389 $7,049<br />
Land Development Division $90 $5,293<br />
Mapping and Records $18 $3,001<br />
Materials Testing $1,481 $1,931 $765 $4,130<br />
Utility Inspection $1,481 $2,048 $255<br />
Total General $1,449,973 $574,386 $602,501 $1,1<strong>12</strong>,331 $573,803<br />
617<br />
Return to TOC
Name Dept / Program Name Insurance<br />
Workers'<br />
Compensation<br />
Schedule Nine<br />
Internal Service Premiums<br />
Note: The following amounts provide for departmental participation in the <strong>city</strong>'s self insurance fund, workers' compensation fund, vehicle and<br />
technology replacement programs and telephone fund. The rates are approved by the Budget Office based on computer models established for<br />
each fund. Monthly amounts should be charged against departmental operating <strong>budget</strong>s by the Finance Department during the fiscal year.<br />
Fund<br />
Vehicle<br />
Replacement<br />
Technology<br />
Replacement<br />
Telephone<br />
1040 - General Services<br />
Field Operations<br />
Equipment Management $35,362 $20,563 $20,722 $5,530 $7,209<br />
Fuel Services $585<br />
Parts Store Operations $18<br />
Total General Services $35,362 $20,581 $21,307 $5,530 $7,209<br />
1100 - Telephone Services<br />
Info. Technology<br />
Telephones $1,<strong>12</strong>6 $18<br />
Total Telephone Services $1,<strong>12</strong>6<br />
$18<br />
1140 - PC Replacement<br />
Info. Technology<br />
Technology Replacement $18 $189<br />
Total PC Replacement $18 $189<br />
<strong>12</strong>20 - Arts Commission Fund<br />
Library & Arts<br />
Arts Maintenance $1,605<br />
Total Arts Commission Fund $1,605<br />
<strong>12</strong>81 - Stadium Event Operations<br />
Marketing and Comm.<br />
Mkt'g - Stadium Events $14,885<br />
Police Department<br />
PD - Fiesta Bowl Event $1,021 $403<br />
Stadium - PD Event Staffing $3,949 $6,554<br />
Fire Department<br />
Fire - Fiesta Bowl Event $407<br />
Stadium - Fire Event Staffing $585<br />
Transportation<br />
Stadium - Transportation Ops. $5,046<br />
Transp - Fiesta Bowl Event $625<br />
Total Stadium Event Operations $26,518 $6,957<br />
<strong>12</strong>82 - Arena Event Operations<br />
Police Department<br />
Arena-PD Event Staffing $2,398 $18<br />
618<br />
Return to TOC
Name Dept / Program Name Insurance<br />
Workers'<br />
Compensation<br />
Schedule Nine<br />
Internal Service Premiums<br />
Note: The following amounts provide for departmental participation in the <strong>city</strong>'s self insurance fund, workers' compensation fund, vehicle and<br />
technology replacement programs and telephone fund. The rates are approved by the Budget Office based on computer models established for<br />
each fund. Monthly amounts should be charged against departmental operating <strong>budget</strong>s by the Finance Department during the fiscal year.<br />
Fund<br />
Fire Department<br />
Arena - Fire Event Staffing $1,031 $18<br />
Field Operations<br />
Arena - ROW Maintenance $390<br />
Transportation<br />
Arena - Transportation Ops. $117<br />
Total Arena Event Operations $3,936<br />
$36<br />
Vehicle<br />
Replacement<br />
Technology<br />
Replacement<br />
Telephone<br />
1340 - Highway User Gas Tax<br />
Field Operations<br />
Right-<strong>of</strong>-Way Maintenance $50,473 $21,318 $25,2<strong>12</strong> $432<br />
Street Maintenance $55,494 $28,485 $88,198 $7,996<br />
Transportation<br />
Signs & Markings $14,468 $7,920 $21,642 $681<br />
Street Light Management $8,759 $540<br />
Traffic Design and Development $5,595 $1,499 $1,406<br />
Traffic Signals $56,133 $11,273 $16,280 $1,394<br />
Traffic Studies $7,202 $72 $2,142 $1,333<br />
Transportation Administration $84,921 $856 $6,700 $6,2<strong>12</strong><br />
Total Highway User Gas Tax $283,045 $71,423 $155,420 $18,536 $6,2<strong>12</strong><br />
1660 - Transportation Sales Tax<br />
Transportation<br />
Dial-A-Ride $75,619 $16,989 $6,295 $18,731<br />
Fixed Route $599<br />
Intelligent Transportation Sys $795 $19,809 $17,872 $4,232<br />
Traffic Mitigation $18<br />
Transit Management $72<br />
Transportation Education $284 $3,970 $3,770<br />
Transportation Program Mgmt $235 $1,603<br />
Total Transportation Sales Tax $75,619 $18,992 $23,779 $29,540 $22,963<br />
1700 - Police Special Revenue<br />
Police Department<br />
Patrol - Special Revenue Fund $76,044 $106,030 $46,<strong>12</strong>7 $37,691<br />
Total Police Special Revenue $76,044 $106,030 $46,<strong>12</strong>7 $37,691<br />
1720 - Fire Special Revenue<br />
Fire Department<br />
Fire - Special Revenue Fund $41,071 $14,<strong>12</strong>7 $9,487 $26,186<br />
619<br />
Return to TOC
Name Dept / Program Name Insurance<br />
Workers'<br />
Compensation<br />
Schedule Nine<br />
Internal Service Premiums<br />
Note: The following amounts provide for departmental participation in the <strong>city</strong>'s self insurance fund, workers' compensation fund, vehicle and<br />
technology replacement programs and telephone fund. The rates are approved by the Budget Office based on computer models established for<br />
each fund. Monthly amounts should be charged against departmental operating <strong>budget</strong>s by the Finance Department during the fiscal year.<br />
Fund<br />
Vehicle<br />
Replacement<br />
Technology<br />
Replacement<br />
Telephone<br />
Total Fire Special Revenue $41,071 $14,<strong>12</strong>7 $9,487 $26,186<br />
1740 - Civic Center<br />
Civic Center<br />
Civic Center $3,513 $1,013 $1,350 $6,148 $<strong>12</strong>,422<br />
Total Civic Center $3,513 $1,013 $1,350 $6,148 $<strong>12</strong>,422<br />
1760 - Airport Special Revenue<br />
Airport<br />
Airport Operations $33,820 $229 $2,072 $2,097 $15,954<br />
Total Airport Special Revenue $33,820 $229 $2,072 $2,097 $15,954<br />
1860 - RICO Funds<br />
Police Department<br />
State RICO $141,622<br />
Total RICO Funds $141,622<br />
1880 - Parks & Recreation Self Sust<br />
Parks & Recreation<br />
Adult Center Self Sustaining $334<br />
Rec Self Sust-Foothills Rec $333 $540<br />
Spec Events & Prgm Self Sust $113<br />
Sports Self Sustaining $264<br />
Youth and Teen Self Sustaining $2,<strong>12</strong>4<br />
Total Parks & Recreation Self S $3,168 $540<br />
2360 - Water and Sewer<br />
Env. Resources<br />
Environmental Resources $90 $3,750 $958<br />
Water Quality $2,857 $8,617 $1,034<br />
Finance<br />
Customer Service Office $3,982 $50,157 $27,131<br />
Utilities<br />
Arrowhead Reclamation Plant $4,096 $10,185 $1,210<br />
Information Management $322 $7,592 $267,934<br />
Public Service Representatives $1,097 $<strong>12</strong>,310<br />
System Security $1,633 $10,290 $540<br />
Utilities Administration $326,148 $187 $8,455 $105,375<br />
West Area Plant $3,164 $14,802 $13,626<br />
Total Water and Sewer $326,148 $17,428 $72,251 $337,217 $134,498<br />
620<br />
Return to TOC
Name Dept / Program Name Insurance<br />
Workers'<br />
Compensation<br />
Schedule Nine<br />
Internal Service Premiums<br />
Note: The following amounts provide for departmental participation in the <strong>city</strong>'s self insurance fund, workers' compensation fund, vehicle and<br />
technology replacement programs and telephone fund. The rates are approved by the Budget Office based on computer models established for<br />
each fund. Monthly amounts should be charged against departmental operating <strong>budget</strong>s by the Finance Department during the fiscal year.<br />
Fund<br />
Vehicle<br />
Replacement<br />
Technology<br />
Replacement<br />
Telephone<br />
2400 - Water<br />
Env. Resources<br />
Water Conservation $2,290 $1,638 $2,602 $581<br />
Building Safety<br />
Cross Connection Control $664 $3,337 $1,140 $581<br />
Utilities<br />
Central System Control $2,406 $5,593<br />
Central System Maintenance $1,321 $13,342<br />
Cholla Treatment Plant $3,703 $3,801 $540<br />
Customer Service - Field $11,908 $25,945<br />
Irrigation $261 $2,661<br />
Meter Maintenance $3,381 $21,508<br />
Oasis Water Campus $3,557 $15,889 $4,320<br />
Pyramid Peak Plant $8,105 $6,883<br />
Water Distribution $16,947 $187,024<br />
Total Water $54,543 $287,621 $8,602 $1,162<br />
2420 - Sewer<br />
Utilities<br />
Pretreatment Program $1,564 $15,<strong>12</strong>8<br />
Wastewater Collection $6,965 $168,020 $540<br />
Total Sewer $8,529 $183,148 $540<br />
2440 - Landfill<br />
Field Operations<br />
Landfill $45,729 $10,402 $9,890 $5,308<br />
MRF Operations $4,713 $3,844 $3,483<br />
Recycling $3,760 $2,160 $755<br />
Solid Waste Admin $1,340 $2,883 $581<br />
Total Landfill $45,729 $20,215 $18,777 $10,<strong>12</strong>7<br />
2480 - Sanitation<br />
Field Operations<br />
Curb Service $71,714 $25,026 $1,620 $581<br />
Residential-Loose Trash Collec $28,953 $13,878 $1,620<br />
Sanitation Frontload $32,473 $23,205 $6,045 $1,882<br />
Sanitation Roll-<strong>of</strong>f $8,748 $2,982<br />
Total Sanitation $141,888 $65,091 $9,285 $2,463<br />
621<br />
Return to TOC
Name Dept / Program Name Insurance<br />
Workers'<br />
Compensation<br />
Schedule Nine<br />
Internal Service Premiums<br />
Note: The following amounts provide for departmental participation in the <strong>city</strong>'s self insurance fund, workers' compensation fund, vehicle and<br />
technology replacement programs and telephone fund. The rates are approved by the Budget Office based on computer models established for<br />
each fund. Monthly amounts should be charged against departmental operating <strong>budget</strong>s by the Finance Department during the fiscal year.<br />
Fund<br />
Vehicle<br />
Replacement<br />
Technology<br />
Replacement<br />
2500 - Pub Housing Budget Activities<br />
Comm. Partnerships<br />
Community Housing $58,267 $2,<strong>12</strong>8 $15,601 $<strong>12</strong>,133<br />
Total Pub Housing Budget Activ $58,267 $2,<strong>12</strong>8 $15,601 $<strong>12</strong>,133<br />
Telephone<br />
2530 - Training Facility Revenue Fund<br />
Police Department<br />
PS Training Ops - Police $1,470 $653 $31,563 $11,501 $17,213<br />
Fire Department<br />
PS Training Ops - Fire $<strong>12</strong>,749 $1,295 $3,652 $82,823 $33,985<br />
Field Operations<br />
PS Training Ops - Fac. Mgmt. $759 $624 $4,518<br />
Total Training Facility Revenue $14,978 $2,572 $39,733 $94,324 $51,198<br />
2538 - Glendale Health Center<br />
Fire Department<br />
Glendale Health Center $78 $5,731 $2,195<br />
Total Glendale Health Center $78<br />
$5,731 $2,195<br />
2540 - Risk Management Self Insurance<br />
Human Resources<br />
Risk Mgmt Trust Fund $18<br />
Total Risk Management Self Ins $18<br />
FY 20<strong>12</strong> Total Internal<br />
Service Premiums:<br />
$2,500,000<br />
$984,460 $1,666,562 $1,718,550 $904,272<br />
622<br />
Return to TOC
Schedule Ten<br />
General Staff and Administrative Service Charges<br />
Note: The following schedule identifies the general staff and administrative charges which are direct expenses <strong>of</strong> the enterprise and certain<br />
special revenue funds but incurred in other funds. The charges are established by the Budget Office based on the indirect cost allocation model<br />
which utilizes various generally accepted allocation methods. Annual amounts should be charged against departmental operating <strong>budget</strong>s by the<br />
Finance Department at the beginning <strong>of</strong> each fiscal year. Charges for Customer Service are paid to the Water/Sewer Fund and charges for Solid<br />
Waste Adminstration are paid to the Landfill Fund.<br />
Fund<br />
Name<br />
Dept Program Name<br />
General Fund<br />
Indirect<br />
Customer Service<br />
Solid Waste<br />
Administration<br />
Sanitation F/L<br />
1660 - Transportation Sales Tax<br />
Transportation Program Mgmt $1,017,000<br />
$1,017,000<br />
2360 - Water and Sewer<br />
Utilities Administration $4,394,000 $47,382<br />
$4,394,000 $47,382<br />
2440 - Landfill<br />
Gas Management System $6,000<br />
Landfill $404,000 $25,000<br />
MRF Operations $357,000<br />
Recycling $<strong>12</strong>5,000<br />
Solid Waste Admin $87,000 $3,000<br />
$979,000 $28,000<br />
2480 - Sanitation<br />
Curb Service $1,445,000 $27,000 $216,000<br />
Residential-Loose Trash Collec $529,000 $78,000<br />
Sanitation Frontload $362,000 $27,000 $108,000<br />
Sanitation Roll-<strong>of</strong>f $136,000 $29,000<br />
$2,472,000 $54,000 $431,000<br />
FY 20<strong>12</strong> Total General<br />
Staff / Admin Charges:<br />
$8,862,000<br />
$82,000 $431,000 $47,382<br />
623<br />
Return to TOC
Schedule Eleven<br />
Operating Capital List<br />
Fund Dept / Program Name Status Item Description FY 20<strong>12</strong> Budget<br />
1000 - General<br />
Fire Department<br />
Fire Resource Management (<strong>12</strong>433)<br />
Base<br />
Equipment (Refurbish Pumper)<br />
$98,050<br />
GENERAL TOTAL ..................................................................................<br />
1<strong>12</strong>0 - Vehicle Replacement<br />
Field Operations<br />
Equipment Replacement (13610)<br />
Base<br />
Base<br />
Base<br />
Base<br />
Base<br />
Base<br />
Base<br />
Base<br />
Base<br />
Police Dept. - 57 Vehicles<br />
Field Operations - 7 Vehicles<br />
Utilities - 4 Vehicles<br />
Unscheduled Repl's - Approp.<br />
Fire Department - 2 Vehicles<br />
Transportation - 2 Vehicles<br />
Parks & Rec - 3 Vehicles<br />
MC Warehouse - 1 Vehicle<br />
Engineering - 1 Vehicle<br />
Equipment Replacement<br />
VEHICLE REPLACEMENT TOTAL ...................................................<br />
1140 - PC Replacement<br />
Info. Technology<br />
Technology Replacement (11530)<br />
Base<br />
Base<br />
Base<br />
Base<br />
Mobile Data Terminals<br />
Servers<br />
Phone Systems<br />
Multiplexer Costs<br />
Technology Replacement<br />
PC REPLACEMENT TOTAL .................................................................<br />
1720 - Fire Special Revenue<br />
Fire Department<br />
Fire - Special Revenue Fund (<strong>12</strong>610)<br />
Base<br />
Equipment (Refurbish Pumper)<br />
$98,050<br />
$1,643,788<br />
$287,418<br />
$274,497<br />
$274,227<br />
$181,<strong>12</strong>9<br />
$119,720<br />
$104,841<br />
$39,456<br />
$29,666<br />
$2,954,742<br />
$2,954,742<br />
$346,977<br />
$310,905<br />
$134,929<br />
$10,876<br />
$803,687<br />
$803,687<br />
$24,5<strong>12</strong><br />
FIRE SPECIAL REVENUE TOTAL .....................................................<br />
$24,5<strong>12</strong><br />
624<br />
Return to TOC
Schedule Eleven<br />
Operating Capital List<br />
Fund Dept / Program Name Status Item Description FY 20<strong>12</strong> Budget<br />
1842 - ARRA Stimulus Grants<br />
Police Department<br />
Stop Violence - Women (37001)<br />
Carryover<br />
Equipment<br />
$2,074<br />
ARRA STIMULUS GRANTS TOTAL ...................................................<br />
$2,074<br />
1860 - RICO Funds<br />
Police Department<br />
Federal RICO (32020)<br />
Base<br />
Equipment<br />
$100,000<br />
State RICO (32030)<br />
Base<br />
Base<br />
Equipment<br />
Improve Other Than Bldgs<br />
State RICO<br />
$232,7<strong>12</strong><br />
$95,000<br />
$327,7<strong>12</strong><br />
RICO FUNDS TOTAL .............................................................................<br />
2360 - Water and Sewer<br />
Utilities<br />
Arrowhead Reclamation Plant (17160)<br />
Base<br />
Equipment<br />
$427,7<strong>12</strong><br />
$9,000<br />
Water Distribution (17290)<br />
Base<br />
Equipment<br />
$14,687<br />
WATER AND SEWER TOTAL ..............................................................<br />
2500 - Pub Housing Budget Activities<br />
Comm. Partnerships<br />
Community Housing (17910)<br />
Base<br />
Misc Cap Projects<br />
$23,687<br />
$224,<strong>12</strong>6<br />
PUB HOUSING BUDGET ACTIVITIES TOTAL ...............................<br />
Grand Total:<br />
$224,<strong>12</strong>6<br />
$4,558,590<br />
625<br />
Return to TOC
Schedule Twelve<br />
Operating Carryover Savings Budgets<br />
Fund Dept / Program / Item Description FY 20<strong>12</strong> Budget<br />
1000 - General<br />
Council Office<br />
Barrel District (10130)<br />
Small Capital Projects<br />
$15,000<br />
Cactus District (10150)<br />
Small Capital Projects<br />
$15,000<br />
Cholla District (10<strong>12</strong>0)<br />
Small Capital Projects<br />
$15,000<br />
Ocotillo District (10170)<br />
Small Capital Projects<br />
$15,000<br />
Sahuaro District (10140)<br />
Small Capital Projects<br />
$15,000<br />
Yucca District (10160)<br />
Small Capital Projects<br />
$15,000<br />
City Clerk<br />
Elections (10240)<br />
County Election Services<br />
$82,615<br />
Non-Departmental<br />
Fund 1000 Non-Dept (11801)<br />
Un<strong>budget</strong>ed Carryover Reserve<br />
$100,000<br />
GENERAL TOTAL ..............................................................................................<br />
$272,615<br />
1300 - Home Grant<br />
Comm. Partnerships<br />
HOME Program (30001)<br />
Habitat For Humanity<br />
Housing Rehabilitation<br />
Newtown CDC Newtown Community<br />
HOME Program<br />
HOME GRANT TOTAL .....................................................................................<br />
$624,524<br />
$249,735<br />
$218,242<br />
$1,092,501<br />
$1,092,501<br />
626<br />
Return to TOC
Schedule Twelve<br />
Operating Carryover Savings Budgets<br />
Fund Dept / Program / Item Description FY 20<strong>12</strong> Budget<br />
1310 - Neighborhood Stabilization Pgm<br />
Comm. Partnerships<br />
NSP Programs (30900)<br />
Pr<strong>of</strong>essional & Contractual<br />
Salary<br />
Allocated Retirement Expense<br />
Social Security - City Share<br />
ER-Medicare Exp<br />
NSP Programs<br />
NEIGHBORHOOD STABILIZATION PGM TOTAL ....................................<br />
$1,941,647<br />
$150,000<br />
$14,775<br />
$9,300<br />
$2,175<br />
$2,117,897<br />
$2,117,897<br />
1311 - N'hood Stabilization Pgm III<br />
Comm. Partnerships<br />
NSP III (30910)<br />
Pr<strong>of</strong>essional & Contractual<br />
Pay Reimb-Salary<br />
NSP III<br />
N'HOOD STABILIZATION PGM III TOTAL ................................................<br />
$300,000<br />
$50,000<br />
$350,000<br />
$350,000<br />
1320 - C.D.B.G.<br />
Comm. Partnerships<br />
CDBG Programs (31001)<br />
Housing Rehab. Sub.<br />
Public Facilities Improvement<br />
Housing Projects<br />
Rehab Slum/Blight<br />
Public Facilities Slum/Blight<br />
Code Compliance/Neigh.Preserv<br />
Administration<br />
Housing Rehab. (Clean & Lien)<br />
Unprogrammed Funds<br />
Lead Base Paint H<strong>az</strong>ard Reduct<br />
CDBG Programs<br />
C.D.B.G. TOTAL ..................................................................................................<br />
$589,133<br />
$334,391<br />
$239,409<br />
$178,238<br />
$65,260<br />
$50,454<br />
$36,576<br />
$30,055<br />
$3,789<br />
$3,276<br />
$1,530,581<br />
$1,530,581<br />
1660 - Transportation Sales Tax<br />
Transportation<br />
Traffic Mitigation (16580)<br />
Intersection/Ped Safety Imp<br />
$250,000<br />
TRANSPORTATION SALES TAX TOTAL ....................................................<br />
$250,000<br />
627<br />
Return to TOC
Schedule Twelve<br />
Operating Carryover Savings Budgets<br />
Fund Dept / Program / Item Description FY 20<strong>12</strong> Budget<br />
1842 - ARRA Stimulus Grants<br />
Comm. Partnerships<br />
CDBG-R (37021)<br />
CDBG-R Visual Improvement<br />
$60,000<br />
JAG Recovery Act (37002)<br />
Pr<strong>of</strong>essional and Contractual<br />
$740,863<br />
PSSP Fire OT Grant (37110)<br />
Overtime<br />
Fire Retirement Exp<br />
ER-Medicare Exp<br />
PSSP Fire OT Grant<br />
PSSP Police OT Grant (37000)<br />
Overtime<br />
Police Retirement Exp<br />
Social Security - City Share<br />
ER-Medicare Exp<br />
PSSP Police OT Grant<br />
Stop Violence - Women (37001)<br />
Pr<strong>of</strong>essional and Contractual<br />
Equipment<br />
Stop Violence - Women<br />
$62,443<br />
$11,652<br />
$905<br />
$75,000<br />
$58,185<br />
$<strong>12</strong>,364<br />
$3,607<br />
$844<br />
$75,000<br />
$82,668<br />
$2,074<br />
$84,742<br />
628<br />
Return to TOC
Schedule Twelve<br />
Operating Carryover Savings Budgets<br />
Fund Dept / Program / Item Description FY 20<strong>12</strong> Budget<br />
Grants<br />
ARWRF Facility UV System Imp (37060)<br />
Pr<strong>of</strong>essional and Contractual<br />
$806,000<br />
Build Safe Engy Prog Enhance (37065)<br />
Pr<strong>of</strong>essional and Contractual<br />
$87,599<br />
Energy Matters Public Educat (37067)<br />
Line Supplies<br />
Temporary Pay<br />
Pr<strong>of</strong>essional And Contractual<br />
Social Security - City Share<br />
ER-Medicare Exp<br />
Energy Matters Public Educat<br />
Main Library Lighting (37064)<br />
Pr<strong>of</strong>essional and Contractual<br />
$<strong>12</strong>0,858<br />
$27,030<br />
$<strong>12</strong>,950<br />
$1,676<br />
$392<br />
$162,906<br />
$136,831<br />
Program Manager (37068)<br />
Authorized Salaries<br />
Allocated Retirement Expense<br />
Social Security - City Share<br />
ER-Medicare Exp<br />
Program Manager<br />
Public Safety/Court Lighting (37062)<br />
Pr<strong>of</strong>essional and Contractual<br />
$184,144<br />
$19,795<br />
$11,417<br />
$2,670<br />
$218,026<br />
$32,000<br />
Sports Courts Lighting Retr<strong>of</strong>i (37063)<br />
Pr<strong>of</strong>essional and Contractual<br />
$75,000<br />
Traffic Signal LED Conversion (37066)<br />
Equipment Less $5,000/Unit<br />
$42,790<br />
Well 43 Variable Drive Retr<strong>of</strong>i (37061)<br />
Pr<strong>of</strong>essional and Contractual<br />
$75,000<br />
ARRA STIMULUS GRANTS TOTAL ..............................................................<br />
$2,671,757<br />
629<br />
Return to TOC
Schedule Twelve<br />
Operating Carryover Savings Budgets<br />
Fund Dept / Program / Item Description FY 20<strong>12</strong> Budget<br />
2530 - Training Facility Revenue Fund<br />
Fire Department<br />
PS Training Ops - Fire (<strong>12</strong>590)<br />
Dept Cont. / Emergency Repairs<br />
$30,000<br />
TRAINING FACILITY REVENUE FUND TOTAL .......................................<br />
Grand Total:<br />
$30,000<br />
$8,315,351<br />
630<br />
Return to TOC
APPENDIX<br />
FY <strong>2011</strong>-<strong>12</strong><br />
CITY OF GLENDALE, AZ<br />
PRELIMINARY<br />
ANNUAL BUDGET<br />
BOOK
APPENDIX<br />
Miscellaneous Statistics<br />
MISCELLANEOUS STATISTICS FROM<br />
2005-09 est. AMERICAN COMMUNITY SURVEY<br />
POPULATION DISTRIBUTION:<br />
Age # %<br />
5 years & Under 22,284 8.93%<br />
5 to 9 years 19,450 7.80%<br />
10 to 14 years 19,<strong>12</strong>1 7.67%<br />
15 to 19 years 19,197 7.70%<br />
20 to 24 years 18,518 7.42%<br />
25 to 34 years 38,324 15.36%<br />
35 to 44 years 35,105 14.07%<br />
45 to 54 years 32,620 13.08%<br />
55 to 59 years 13,964 5.60%<br />
60 to 64 years 10,400 4.17%<br />
65 to 74 years 10,113 4.05%<br />
75 to 84 years 7,058 2.83%<br />
85 years & over 3,301 1.32%<br />
Total 249,455 -<br />
Median age: 31.9<br />
Sex # %<br />
Male <strong>12</strong>4,641 49.97%<br />
Female <strong>12</strong>4,814 50.03%<br />
SCHOOL ENROLLMENT:<br />
Enrolled<br />
Population 3 yrs & older # %<br />
Enrolled in school 71,910 -<br />
Nursery school, preschool 3,521 4.90%<br />
Kindergarten 4,066 5.65%<br />
Elementary school (grades 1-8) 30,565 42.50%<br />
High school (grades 9-<strong>12</strong>) 16,371 22.77%<br />
College or graduate school 17,387 24.18%<br />
EDUCATIONAL ATTAINMENT<br />
Attained<br />
Education # %<br />
Population 25 years and over 130,413 -<br />
Less than High School graduate 21,643 16.6%<br />
High school graduate (or equivalent) 34,927 26.8%<br />
Some college, or Associate's degree 46,721 35.8%<br />
Bachelor's degree or higher 27,<strong>12</strong>2 20.8%<br />
Percent w/ bachelor's degree or higher: 27,<strong>12</strong>2 20.8%<br />
Percent <strong>of</strong> high school graduates w/<br />
some college or an associate's degree: 81,648 62.6%<br />
Percent <strong>of</strong> all other: 21,643 16.6%<br />
INCOME AND BENEFITS<br />
(2009 INFLATION-ADJUSTED $'s):<br />
Households in Range<br />
Income # %<br />
Total Households 80,943<br />
Less than $10,000 5,272 6.51%<br />
$10,000 to $14,999 3,860 4.77%<br />
$15,000 to $24,999 8,342 10.31%<br />
$25,000 to $34,999 8,918 11.02%<br />
$35,000 to $49,999 <strong>12</strong>,056 14.89%<br />
$50,000 to $74,999 16,862 20.83%<br />
$75,000 to $99,999 10,374 <strong>12</strong>.82%<br />
$100,000 to $149,999 10,337 <strong>12</strong>.77%<br />
$150,000 to $199,999 2,956 3.65%<br />
$200,000 or more 1,966 2.43%<br />
OCCUPATION DISTRIBUTION:<br />
Employed<br />
Occupation # %<br />
Employed (Age 16 & over) 114,587 -<br />
Management/Pr<strong>of</strong>essional 33,895 29.58%<br />
Service 18,791 16.40%<br />
Sales and <strong>of</strong>fice 32,583 28.44%<br />
Farming/fishing/forestry 209 0.18%<br />
Construction/maintenance 15,714 13.71%<br />
Prod./transport/Material Moving 13,395 11.69%<br />
Median household income: $52,447<br />
Mean household income: $65,769<br />
631<br />
Return to TOC
APPENDIX<br />
Miscellaneous Statistics<br />
MISCELLANEOUS STATISTICS FROM<br />
2005-09 est. AMERICAN COMMUNITY SURVEY<br />
The following two pages show the information from the previous page in chart form.<br />
45,000<br />
40,000<br />
35,000<br />
30,000<br />
25,000<br />
20,000<br />
15,000<br />
10,000<br />
5,000<br />
0<br />
2009 Population Distribution<br />
Age in Years<br />
2009 School Enrollment<br />
40,000<br />
30,000<br />
30,565<br />
20,000<br />
16,371 17,387<br />
10,000<br />
3,521 4,066<br />
0<br />
Nursery<br />
school,<br />
preschool<br />
Kindergarten<br />
Elementary<br />
school (grades<br />
1‐8)<br />
High school<br />
(grades 9‐<strong>12</strong>)<br />
College or<br />
graduate<br />
school<br />
632<br />
Return to TOC
APPENDIX<br />
Miscellaneous Statistics<br />
MISCELLANEOUS STATISTICS FROM<br />
2005-09 est. AMERICAN COMMUNITY SURVEY<br />
20,000<br />
2009 Income and Benefits<br />
16,862<br />
16,000<br />
<strong>12</strong>,000<br />
8,000<br />
4,000<br />
5,272<br />
3,860<br />
8,342 8,918<br />
<strong>12</strong>,056<br />
10,374 10,337<br />
2,956<br />
1,966<br />
0<br />
in Thousands<br />
140,000<br />
<strong>12</strong>0,000<br />
100,000<br />
80,000<br />
130,413<br />
2009 Educational Attainment<br />
Population 25 years and over<br />
Less than High School<br />
graduate<br />
High school graduate (or<br />
equivalent)<br />
60,000<br />
40,000<br />
20,000<br />
21,643<br />
34,927<br />
46,721<br />
27,<strong>12</strong>2<br />
Some college, or Associate's<br />
degree<br />
Bachelor's degree or higher<br />
0<br />
633<br />
Return to TOC
APPENDIX<br />
Miscellaneous Statistics<br />
CITY STATISTICS<br />
Year Founded: Date <strong>of</strong> Incorporation:<br />
1892 June 18, 1910<br />
Form <strong>of</strong> Government:<br />
Council/City Manager<br />
County:<br />
Elevation:<br />
Maricopa<br />
1,152 Ft.<br />
Top Five Glendale Employers:<br />
U.S. Air Force-Luke (Military/Civil) 6,000<br />
Banner Health System 2,866<br />
Wal-Mart (FT & PT) 2,025<br />
Glendale Union High School District 2,008<br />
City <strong>of</strong> Glendale 1,966<br />
Annexed Area in Sq. Miles:<br />
Year<br />
Total<br />
1910 1<br />
1910-1969 15<br />
1970-1979 39<br />
1980-1989 49<br />
1990-1999 54<br />
2000-2001 54<br />
2002 54<br />
2003 54<br />
2004 56<br />
2005 57<br />
2006 58<br />
2007 58<br />
2008 58<br />
2009 58<br />
2010 59<br />
<strong>2011</strong> 59<br />
Population:<br />
1970 36,228<br />
1980 97,172<br />
1985 (Special Census) <strong>12</strong>2,392<br />
1990 (Census) 148,134<br />
1995* (Special Census) 182,615<br />
2000 (Census) 218,8<strong>12</strong><br />
2010 (Census) 226,721<br />
<strong>2011</strong> (Estimate) 229,468<br />
* All population numbers 1995 and after<br />
include the population <strong>of</strong> Luke AFB.<br />
City Authorized Staffing as <strong>of</strong> July 1, <strong>2011</strong>:<br />
Full-Time &Part-Time, Permanent 1,966.38<br />
Elections:<br />
Number <strong>of</strong> votes cast:<br />
August 2010 Primary Elec. (8/10) 14,526 (3<br />
districts)<br />
November 2010 General Elec. (11/10) 14,052<br />
(2 District run<strong>of</strong>f elec.)<br />
Percentage <strong>of</strong> registered voters voting in:<br />
August 2010 Primary Elec. (08/10) 28.63%<br />
November 2010 General Elec. (11/10) 47.67%<br />
Building Permits:<br />
Value <strong>of</strong><br />
Fiscal Year Number Buildings<br />
1999 8,561 $333,138,095<br />
2000 7,925 $292,105,521<br />
2001 6,944 $287,722,622<br />
2002 5,439 $219,539,420<br />
2003 6,299 $327,352,955<br />
2004 4,819 $359,027,305<br />
2005 6,980 $546,094,645<br />
2006 6,844 $445,703,739<br />
2007 6,185 $582,249,673<br />
2008 6,883 $452,658,952<br />
2009 5,289 $324,754,646<br />
2010 5,184 $158,860,414<br />
<strong>2011</strong>* 4,104 $80,918,265<br />
*Through March <strong>of</strong> <strong>2011</strong>.<br />
Fire Protection (for CY 2010):<br />
Number <strong>of</strong> Stations 9<br />
90% <strong>of</strong> the time Units arrived<br />
On-scene<br />
5:43 Min<br />
Number <strong>of</strong> Calls<br />
EMS 34,960<br />
Fire 5,253<br />
Miscellaneous 2,409<br />
Special Operations 809<br />
Total Calls 43,431<br />
Fire FTE’s (FY <strong>2011</strong>)<br />
281 (240 sworn)<br />
Police Protection (for CY 2010):<br />
Number <strong>of</strong> Stations 3<br />
Calls Processed* 452,237<br />
Vehicular Patrol Units** 116<br />
Number <strong>of</strong> Reserves 16<br />
*Includes incoming, outgoing and 911 calls<br />
**Marked by lights/sirens & uniformed patrol<br />
<strong>of</strong>ficers<br />
Police FTE’s (FY <strong>2011</strong>)<br />
553.5 (407 sworn)<br />
634<br />
Return to TOC
APPENDIX<br />
Miscellaneous Statistics<br />
City Court Offenses Processed (for FY <strong>2011</strong>):<br />
DUI 2,114<br />
Serious Traffic 441<br />
Other Criminal Traffic 6,348<br />
Civil Traffic 28,498<br />
Non-Traffic Misdemeanor 7,789<br />
Total Citations Issued 45,190<br />
Protective Orders 2,643<br />
Parks and Recreation (as <strong>of</strong> April <strong>2011</strong>):<br />
Number <strong>of</strong> Neighborhood Parks 55<br />
Community Parks 9<br />
Sports Complexes 4<br />
Total Park Acreage 2,188.5<br />
Playgrounds 97<br />
Ramadas 144<br />
Tennis Courts 38<br />
Racquetball Courts 49<br />
Basketball Courts 55<br />
Volleyball Courts 44<br />
Soccer/Football Fields 55<br />
S<strong>of</strong>tball Fields 54<br />
Swimming Pools 2<br />
Splash Pads 2<br />
Dog Parks 3<br />
Skate Parks 2<br />
Reservable Ramadas 45<br />
Area Lights 1,491<br />
Park Benches 542<br />
Drinking Fountains 139<br />
Barbeques 252<br />
Picnic Tables 716<br />
Miles <strong>of</strong> Trails 41<br />
Linear Feet <strong>of</strong> Multiuse Walkways 92,892<br />
Transportation (as <strong>of</strong> May <strong>2011</strong>):<br />
Miles <strong>of</strong> Streets Maintained<br />
Arterial 103<br />
Secondary (1/2 Mile Streets) 64<br />
Collector (1/4 Miles Streets) 151<br />
Local 464<br />
Alleys 20<br />
Unpaved 0.0<br />
Total 802<br />
Water Utilities (for CY 2010):<br />
Number <strong>of</strong> Active Customers* 59,435<br />
Miles <strong>of</strong> System (lines) 997<br />
Annual Consumption 13,460 M Gal<br />
Avg. gallons/user/month 18.37 K Gal<br />
Avg. gallons/user/year 220.4 K Gal<br />
Available Storage Capa<strong>city</strong> 67 M Gal<br />
Avg. Treatment Plan Capacities<br />
Cholla<br />
30.0 MGD<br />
Pyramid Peak<br />
48.0 MGD<br />
Oasis<br />
<strong>12</strong>.5 MGD<br />
Avg. Daily Water Produced 53.6 M Gal<br />
Wastewater Utilities (for CY 2010):<br />
Number <strong>of</strong> Active Customers 56,000<br />
Miles <strong>of</strong> Collection Lines 710<br />
Treatment Plant Capacities<br />
WAWRF<br />
11.5 MGD<br />
Arrowhead<br />
4.5 MGD<br />
SROG<br />
13.2 MGD<br />
Annual Wastewater Treated 6.9 B Gal<br />
Sanitation (FY through May <strong>2011</strong>):<br />
Number <strong>of</strong> Customers 52,500<br />
Landfill & MRF (FY through March <strong>2011</strong>):<br />
Number <strong>of</strong> Customer Transactions <strong>12</strong>0,409<br />
Tonnage Processed<br />
Residential 135,269<br />
Commercial 56,471<br />
Recycle 11,290<br />
Total 203.030<br />
Sources: Various City <strong>of</strong> Glendale Department<br />
Records<br />
U.S. Census<br />
635<br />
Return to TOC
APPENDIX<br />
Acronyms<br />
ACRONYMS<br />
ACDC<br />
ADA<br />
ADOT<br />
AFB<br />
ARRA<br />
AMFP<br />
AV<br />
AWRF<br />
AZSTA<br />
B<strong>of</strong>A<br />
CAFR<br />
CAP<br />
CD<br />
CDBG<br />
CFD<br />
CIP<br />
CPI<br />
CPI-U<br />
CY<br />
DIF<br />
DMP<br />
EMS<br />
EOC<br />
EECBG<br />
FAA<br />
FBO<br />
FT<br />
FTA<br />
FTE<br />
FY<br />
GAAP<br />
GCC<br />
GEMS<br />
GF<br />
A<br />
Arizona Canal Diversion Channel<br />
Americans with Disabilities Act<br />
Arizona Department <strong>of</strong> Transportation<br />
Air Force Base<br />
American Recovery and Reinvestment Act<br />
Arizona Municipal Financing Program<br />
Assessed Valuation<br />
Arrowhead Water Reclamation Facility<br />
Arizona Sports and Tourism Authority<br />
B<br />
Bank <strong>of</strong> America<br />
C<br />
Comprehensive Annual Financial Report<br />
Community Action Program<br />
Community Development<br />
Community Development Block Grant<br />
Community Facilities Districts<br />
Capital Improvement Plan<br />
Consumer Price Index<br />
Consumer Price Index for Urban Users<br />
Calendar Year<br />
D<br />
Development Impact Fees<br />
Debt Management Plan<br />
E<br />
Emergency Medical Services<br />
Emergency Operations Center<br />
Energy Efficiency and Conservation Block Grant<br />
F<br />
Federal Aviation Administration<br />
Fixed Base Operator<br />
Full Time<br />
Federal Transit Administration<br />
Full Time Equivalent<br />
Fiscal Year<br />
G<br />
Generally Accepted Accounting Principles<br />
Glendale Community College<br />
Glendale’s Exceptional Municipal Staff<br />
General Fund<br />
636<br />
Return to TOC
APPENDIX<br />
Acronyms<br />
GFOA<br />
GIS<br />
G.O.<br />
GO<br />
HALO<br />
HR<br />
HUD<br />
HURF<br />
IGA<br />
IGP<br />
IT<br />
LID<br />
LTAF<br />
MGD<br />
MOU<br />
MPC<br />
MRF<br />
NHL<br />
O and M<br />
OCP<br />
OSHA<br />
PAYGO<br />
PC<br />
RICO<br />
SROG<br />
SRP<br />
VOCA<br />
WAWRF<br />
WIFA<br />
WRF<br />
WTP<br />
Government Finance Officers Association<br />
Geographic Information System<br />
General Obligation<br />
Glendale Onboard<br />
H<br />
Helicopter Air-medical and Logistical Operations<br />
Human Resources<br />
Department <strong>of</strong> Housing and Urban Development<br />
Highway User Revenue Fund<br />
I<br />
Intergovernmental Agreement<br />
Intergovernmental Programs Department<br />
Information Technology<br />
L<br />
Local Improvement Districts<br />
Local Transportation Assistance Fund<br />
M<br />
Million Gallons per Day<br />
Memorandum <strong>of</strong> Understanding<br />
Municipal Property Corporation<br />
Material Recovery Facility<br />
N<br />
National Hockey League<br />
O<br />
Operational and Maintenance<br />
Organizational Cooperative Process<br />
Occupational Safety and Health Administration<br />
P<br />
Pay-As-You-Go Capital<br />
Personal Computer<br />
R<br />
Racketeer Influenced and Corrupt Organizations<br />
S<br />
Sub-Regional Operating Group<br />
Salt River Project<br />
V<br />
Victims <strong>of</strong> Crime Act<br />
W<br />
Western Area Water Reclamation Facility<br />
Water Infrastructure Finance Authority<br />
Water Reclamation Facility<br />
Water Treatment Plant<br />
637<br />
Return to TOC
APPENDIX<br />
Glossary<br />
GLENDALE BUDGET DOCUMENT GLOSSARY<br />
The City <strong>of</strong> Glendale designed the Annual Budget to <strong>of</strong>fer citizens and staff an understandable<br />
and meaningful <strong>budget</strong> document. This glossary provides assistance to those unfamiliar with<br />
<strong>budget</strong>ing terms and specific terms related to the Glendale financial planning process.<br />
A<br />
ACCRUAL BASIS OF ACCOUNTING:<br />
The most commonly used accounting<br />
method, which reports income when earned<br />
and expenses when incurred, as opposed to<br />
cash basis accounting, which reports income<br />
when received and expenses when paid.<br />
ADOPTION: A formal action taken by the<br />
City Council which sets the spending limits<br />
for the fiscal year.<br />
APPROPRIATION: An authorization<br />
made by the City Council which permits the<br />
<strong>city</strong> to incur obligations and expend<br />
resources.<br />
ASSESSED VALUATION: A valuation<br />
placed upon real estate or other property by<br />
the county assessor and the state as a basis<br />
for levying taxes.<br />
B<br />
BALANCED BUDGET: Arizona law<br />
(Title 42 Arizona Revised Statutes) requires<br />
the City Council to <strong>annual</strong>ly adopt a<br />
balanced <strong>budget</strong> by purpose <strong>of</strong> public<br />
expense. The <strong>city</strong> charter also requires an<br />
<strong>annual</strong> balanced <strong>budget</strong>. The charter<br />
specifically states that “the total amounts in<br />
the <strong>budget</strong> proposed for expenditure shall<br />
not exceed the total amounts proposed for<br />
expenditure in the published estimates.<br />
BASE BUDGET: Ongoing expenses for<br />
personnel, contractual services, and the<br />
replacement <strong>of</strong> supplies and equipment to<br />
maintain service levels for each program as<br />
authorized by the City Council.<br />
BOND: A municipality will issue this debt<br />
instrument and agree to repay the face<br />
amount <strong>of</strong> the bond on the designated<br />
maturity date. Bonds are primarily used to<br />
finance capital projects.<br />
General Obligation (GO) Bond: This<br />
type <strong>of</strong> bond is secured by the full faith,<br />
credit, and taxing power <strong>of</strong> the<br />
municipality.<br />
Revenue Bond: This type <strong>of</strong> bond is<br />
secured by the revenues from a specific<br />
source such as gas taxes or water<br />
revenues.<br />
C<br />
CAPITAL BUDGET: The appropriation<br />
<strong>of</strong> bonds or operating revenue for<br />
improvements to <strong>city</strong> facilities which may<br />
include buildings, streets, water/sewer lines<br />
and parks.<br />
CAPITAL IMPROVEMENT PROJECT:<br />
Non-routine capital expenditures that<br />
generally cost more than $50,000 resulting<br />
in the purchase <strong>of</strong> equipment, construction,<br />
renovation or acquisition <strong>of</strong> land,<br />
infrastructure and/or buildings with an<br />
expected useful life <strong>of</strong> at least five years.<br />
Capital improvement projects are designed<br />
to prevent the deterioration <strong>of</strong> the <strong>city</strong>'s<br />
existing infrastructure, and respond to and<br />
anticipate the future growth <strong>of</strong> the <strong>city</strong>.<br />
638<br />
Return to TOC
APPENDIX<br />
Glossary<br />
CARRYOVER: Year-end savings that can<br />
be carried forward to cover any one-time<br />
expenses such as supplies, equipment, or<br />
special contracts.<br />
D<br />
DEBT RATIO: Total debt divided by total<br />
assets. Used by finance and <strong>budget</strong> staff to<br />
assess fiscal health, internal controls, etc.<br />
DEBT SERVICE: Principal and interest<br />
payments on outstanding bonds.<br />
DEPRECIATION: The decline in the<br />
value <strong>of</strong> an asset due to general wear and<br />
tear or obsolescence.<br />
DEVELOPMENT IMPACT FEE: Fees<br />
requiring new development to cover the<br />
increased cost to the <strong>city</strong> <strong>of</strong> providing new<br />
infrastructure when they construct new<br />
residential and commercial developments.<br />
E<br />
ENCUMBRANCE: The formal accounting<br />
recognition <strong>of</strong> commitments to expend<br />
resources in the future.<br />
ENTERPRISE FUND: Funds that are<br />
accounted for in a manner similar to a<br />
private business. Enterprise funds are<br />
intended to be self-sufficient with all costs<br />
supported primarily by user fees. The <strong>city</strong><br />
maintains three enterprise funds:<br />
water/sewer, landfill and sanitation.<br />
EXPENDITURE: Represents a decrease in<br />
fund resources.<br />
EXPENDITURE LIMITATION: An<br />
amendment to the Arizona State<br />
Constitution which limits <strong>annual</strong><br />
expenditures <strong>of</strong> all municipalities. The<br />
Economic Estimates Commission uses<br />
actual payments <strong>of</strong> local revenues for FY<br />
1980 as the base limit and adjusts <strong>annual</strong>ly<br />
for population growth and inflation. All<br />
municipalities have the option <strong>of</strong> Home Rule<br />
that requires voters to approve a four-year<br />
expenditure limit based on revenues<br />
received. Glendale citizens have approved<br />
the Home Rule Option since the inception <strong>of</strong><br />
the expenditure limitation.<br />
F<br />
FISCAL YEAR (FY): The period<br />
designated by the <strong>city</strong> for the beginning and<br />
ending <strong>of</strong> financial transactions. The fiscal<br />
year for the City <strong>of</strong> Glendale begins July 1<br />
and ends June 30.<br />
FULL-TIME EQUIVALENT (FTE): A<br />
position converted to the decimal equivalent<br />
<strong>of</strong> a full-time position based on 2,080 hours<br />
per year. For example, a part-time typist<br />
working for 20 hours per week would be<br />
equivalent to a 0.5 FTE (20 hours times 52<br />
weeks divided by 2,080 hours).<br />
FUND: A fiscal and accounting entity with<br />
a self-balancing set <strong>of</strong> accounts recording<br />
cash and other financial resources.<br />
FUND BALANCE: A balance or carry<br />
over that occurs when actual revenues<br />
exceed <strong>budget</strong>ed revenues and/or when<br />
actual expenditures are less than <strong>budget</strong>ed<br />
expenditures.<br />
G<br />
GENERAL FUND: Primary operating<br />
fund <strong>of</strong> the <strong>city</strong>. It exists to account for the<br />
resources devoted to finance the services<br />
traditionally associated with local<br />
government. Included in these services are<br />
police and fire protection, street and right <strong>of</strong><br />
way maintenance, parks and recreation,<br />
planning and economic development,<br />
general administration <strong>of</strong> the <strong>city</strong>, and any<br />
639<br />
Return to TOC
APPENDIX<br />
Glossary<br />
other activity for which a special fund has<br />
not been created.<br />
GOAL: A general and timeless statement<br />
created with a purpose based on the needs <strong>of</strong><br />
the community.<br />
GROUP: Administrative groups that<br />
consist <strong>of</strong> a number <strong>of</strong> departments and<br />
divisions that provide services. These<br />
groups include Administrative Services,<br />
Community Development, Public Works<br />
and Public Safety.<br />
I<br />
INFRASTRUCTURE: Facilities that<br />
support the continuance and growth <strong>of</strong> a<br />
community. Examples include roads, water<br />
lines, sewers, public buildings, parks and<br />
airports.<br />
L<br />
LOCAL IMPROVEMENT DISTRICT<br />
(LID): LID’s are legally designated<br />
geographic areas in which a majority <strong>of</strong> the<br />
affected property owners agree to pay for<br />
one or more capital improvements through a<br />
special assessment.<br />
O<br />
OBJECTIVE: A measurable output that an<br />
organization strives to achieve within a<br />
designated time frame. The achievement <strong>of</strong><br />
the objective advances an organization<br />
toward a corresponding goal.<br />
OPERATING AND MAINENANCE<br />
(O & M) COSTS: The day-to-day<br />
operating and maintenance costs <strong>of</strong> a<br />
municipality. These costs include<br />
personnel, gas, electric utility bills,<br />
telephone expense, reproduction costs,<br />
postage and vehicle maintenance.<br />
OPERATING BUDGET: The day-to-day<br />
costs <strong>of</strong> delivering <strong>city</strong> services.<br />
P<br />
PAY-AS-YOU-GO (PAYGO) CAPITAL<br />
PROJECTS: Capital projects funded by<br />
General Fund operating revenues.<br />
PERFORMANCE MEASURES:<br />
Measurement <strong>of</strong> service performance<br />
indicators that reflect the amount <strong>of</strong> money<br />
spent on services and the resulting outcomes<br />
at a specific level <strong>of</strong> services provided.<br />
PERMANENT BASE ADJUSTMENT:<br />
An adjustment to the expenditure limitation<br />
base established by the Economics Estimate<br />
Commission (see expenditure limitation)<br />
which requires voter approval. The Glendale<br />
voters approved a permanent base adjust in<br />
the spring <strong>of</strong> 2000 which became effective<br />
with the FY 2003 <strong>budget</strong> year.<br />
PRODUCTIVITY: A measurement <strong>of</strong> the<br />
increase/decrease <strong>of</strong> <strong>city</strong> services output<br />
compared to the per unit input cost invested.<br />
PROGRAM: A group <strong>of</strong> related activities<br />
performed by one or more organizational<br />
units for the purpose <strong>of</strong> accomplishing a <strong>city</strong><br />
responsibility.<br />
PROPERTY TAX: The total property tax<br />
levied by a municipality. Arizona’s<br />
municipal property tax system is divided<br />
into a primary and secondary tax rate.<br />
Primary Tax: Arizona statute limits<br />
the primary property tax levy amount<br />
and municipalities may use this tax for<br />
any purpose.<br />
Secondary Rate: Arizona statute does<br />
not limit the secondary tax levy amount<br />
and municipalities may only use this<br />
640<br />
Return to TOC
APPENDIX<br />
Glossary<br />
levy to retire the principal and interest<br />
or redemption charges on bond debt.<br />
R<br />
RESOURCES: Total amounts available for<br />
appropriation including estimated revenues,<br />
fund transfers and beginning fund balances.<br />
REVENUE: Financial resources received<br />
from taxes, user charges and other levels <strong>of</strong><br />
government.<br />
Actual vs. Budgeted: Difference<br />
between the amount projected<br />
(<strong>budget</strong>ed) in revenues or expenditures<br />
at the beginning <strong>of</strong> the fiscal year and<br />
the actual receipts or expenses which<br />
are incurred by the end <strong>of</strong> the fiscal<br />
year.<br />
S<br />
SALARY SAVINGS TRANSFER: A<br />
transfer <strong>of</strong> savings from salary & benefit<br />
accounts to non-salary, operational accounts<br />
like <strong>of</strong>fice supplies, equipment maintenance,<br />
etc. Normal employee turnover, retirements<br />
and terminations can create salary savings<br />
situations.<br />
SECONDARY PROPERTY TAX: A tax<br />
levy restricted to the payment <strong>of</strong> principal<br />
and interest on general obligation bonds.<br />
SERVICE LEASE: A leesor maintains and<br />
services an asset under a service lease.<br />
SPECIAL REVENUE FUND: A fund that<br />
accounts for receipts from revenue sources<br />
that have been earmarked for specific<br />
activities and related expenditures.<br />
SUPPLEMENTAL BUDGET<br />
ALLOWANCE: This allowance provides<br />
additional personnel, equipment and related<br />
expenses which enhance the service level <strong>of</strong><br />
a program. Supplemental increases are<br />
directed at attaining council goals or<br />
meeting increased service needs.<br />
T<br />
TAX LEVY: The total amount <strong>of</strong> the<br />
general property taxes collected for purposes<br />
specified in the Tax Levy Ordinance.<br />
TAX RATE: The amount <strong>of</strong> tax levied for<br />
each $100 <strong>of</strong> assessed valuation.<br />
TRANSFER: Movement <strong>of</strong> resources<br />
between two funds. Example: An interfund<br />
transfer would include the transfer <strong>of</strong><br />
operating resources from the General Fund<br />
to an Enterprise Fund.<br />
U<br />
USER CHARGES: The payment <strong>of</strong> a fee<br />
in direct receipt <strong>of</strong> a public service by the<br />
party who benefits from the service.<br />
W<br />
WORKLOAD INDICATORS: Statistical<br />
information that indicates the demands for<br />
services within a given department or<br />
division. Workload indicators are a type <strong>of</strong><br />
performance measure utilized by<br />
departments or divisions to assess its level<br />
<strong>of</strong> service.<br />
STATE-SHARED REVENUE: Includes<br />
the <strong>city</strong>’s portion <strong>of</strong> state sales tax revenues,<br />
state income tax receipts and Motor Vehicle<br />
In-Lieu taxes.<br />
641<br />
Return to TOC
APPENDIX<br />
Frequently Asked Questions<br />
FREQUENTLY ASKED QUESTIONS<br />
The City <strong>of</strong> Glendale designed the Annual Budget to <strong>of</strong>fer citizens and staff an understandable<br />
and meaningful <strong>budget</strong> document. This guide will provide assistance to those unfamiliar with<br />
Glendale's <strong>budget</strong>ing and financial planning processes.<br />
What is a “Fiscal Year (FY)” and when does it begin and end? The City <strong>of</strong> Glendale and<br />
State <strong>of</strong> Arizona follow a Fiscal Year (FY) that starts July 1 and ends June 30. A Fiscal Year is<br />
the period designated by the <strong>city</strong> for the beginning and ending <strong>of</strong> financial transactions or a<br />
<strong>budget</strong> cycle. The “20<strong>12</strong> Annual Budget” or “Fiscal Year <strong>2011</strong>-<strong>12</strong> (FY 20<strong>12</strong>)” refers to the<br />
period that begins July 1, <strong>2011</strong> and concludes on June 30, 20<strong>12</strong>.<br />
What does it mean to, “adopt the <strong>budget</strong>?” Budget adoption is a formal action taken by the<br />
City Council that sets the <strong>city</strong>’s priorities and spending limits for the upcoming fiscal year. The<br />
FY 20<strong>12</strong> <strong>budget</strong> will be formally adopted by the City Council at a public meeting in June <strong>2011</strong>,<br />
though <strong>city</strong> staff has been preparing the <strong>budget</strong> for months in advance.<br />
How do I get involved or learn about the <strong>budget</strong> before it’s adopted? At any time <strong>of</strong> the year<br />
citizens can view the <strong>city</strong>’s <strong>budget</strong> online, in <strong>city</strong> libraries or at City Hall. Residents can discuss<br />
it with neighbors, <strong>city</strong> staff or Council Members. In addition, the City Council has several<br />
special Budget Workshops every March and/or April that citizens can attend, watch on KGLN<br />
cable channel 11 or borrow on videotape from Glendale’s libraries.<br />
What is meant by “<strong>budget</strong> appropriation?” Budget appropriation refers to authorizations<br />
made by the City Council that permit the <strong>city</strong> to incur obligations and expend resources. When<br />
the City Council appropriates funds, they are saying the community should, for example, spend<br />
its money on public safety, or make investments that improve the quality <strong>of</strong> life in Glendale.<br />
The <strong>city</strong> cannot spend money unless it is appropriated, and this ensures the public’s money is<br />
spent according to the public’s needs as expressed by the democratically elected City Council.<br />
What are municipal bonds? A municipality, such as the City <strong>of</strong> Glendale, will sell (issue)<br />
bonds primarily to finance capital projects. This is similar to a family taking out a mortgage in<br />
order to finance a house. Just like a family, the <strong>city</strong> has basic necessities (infrastructure) like<br />
roads and <strong>of</strong>fice buildings, but usually does not have cash available for such major purchases.<br />
Municipal bonds are like loans that help make large, important purchases affordable. Bonds also<br />
effectively spread out the costs <strong>of</strong> major projects across their useful life, so all those citizens who<br />
utilize them can help pay for them.<br />
What is the difference between the capital <strong>budget</strong> and the operating <strong>budget</strong>? The capital<br />
<strong>budget</strong>, or Capital Improvement Plan, is an appropriation <strong>of</strong> bonds or operating revenue for<br />
improvements to <strong>city</strong> facilities that may include buildings, parks, streets and water/sewer lines.<br />
The operating <strong>budget</strong> covers the costs <strong>of</strong> the <strong>city</strong>’s day-to-day operations, such as employee<br />
salaries, supplies and contracts.<br />
What is carryover? Carryover refers to year-end savings that can be carried forward into the<br />
next fiscal year to cover any one-time expenses such as supplies, equipment or special contracts<br />
642<br />
Return to TOC
APPENDIX<br />
Frequently Asked Questions<br />
that were <strong>budget</strong>ed for but not purchased (or paid for) in the previous fiscal year. For example, if<br />
a piece <strong>of</strong> equipment was ordered in June (the last month in a fiscal year) but not received until<br />
July (the start <strong>of</strong> the next fiscal year), then the “savings” from the previous <strong>budget</strong> year could be<br />
used to purchase the equipment in the next <strong>budget</strong> year using carryover appropriation.<br />
What is a debt ratio? The debt ratio is total debt divided by total assets. This is one<br />
measurement <strong>of</strong> fiscal health. If the <strong>city</strong>, or a family, owes substantially more money than the<br />
value <strong>of</strong> the things it owns or its ability to generate revenue, a dangerous financial situation<br />
exists. The lower the debt ratio, the better interest rates the <strong>city</strong> can receive when it wants to sell<br />
more bonds to finance additional capital improvements for Glendale.<br />
What is debt service? A family’s debt service is the payments they make on loans, such as a<br />
mortgage and credit cards. Principal and interest payments on outstanding bonds are referred to<br />
as debt service. Just like a family cannot skip on mortgage or credit card payments, the <strong>city</strong> must<br />
always keep up on its debt service, so this will always be a part <strong>of</strong> the <strong>city</strong>’s <strong>budget</strong>.<br />
What is an encumbrance? An encumbrance refers to the formal accounting recognition <strong>of</strong><br />
commitments to expend resources in the future. For example, when a purchase order is issued<br />
for equipment, that funding is encumbered until delivery. Once the equipment is received, the<br />
invoice is paid and the encumbrance becomes an expense.<br />
What is an expenditure? Expenditures represent a decrease in fund resources or, stated simply,<br />
a recorded expense.<br />
What is an expenditure limitation or permanent base adjustment? Arizona municipalities<br />
can only spend funds up to a level specified by the State or local voters via Home Rule (see<br />
Glendale’s City Charter at http://www.municode.com/resources/gateway.asp?pid=13944&sid=3).<br />
This is meant to ensure local government <strong>budget</strong>s are balanced. Glendale’s voters approved<br />
Home Rule that required voters to approve a four-year expenditure limit based on actual<br />
revenues the <strong>city</strong> has received. However, in the spring <strong>of</strong> 2000, Glendale voters approved a<br />
permanent base adjustment, eliminating the need for further expenditure limitation elections.<br />
What is a full-time equivalent position (FTE)? An FTE (1.0 FTE) refers to one or more<br />
employees working 40 hours per week, or 2,080 hours per year. For example, a part-time<br />
employee working 20 hours per week would be considered a 0.5 FTE. Two part-time employees<br />
each working 20 hours per week would be considered 1.0 FTE.<br />
What is the definition <strong>of</strong> a <strong>budget</strong> fund? Glendale currently has 100 <strong>budget</strong> funds to help keep<br />
track <strong>of</strong> and focus resources. These include the General Fund, Transportation Fund, Sanitation<br />
Fund and Water/Sewer Fund, to name just a few. A family might use several funds, too, in order<br />
to help manage their finances and determine how close they are to reaching certain goals. For<br />
instance, a family might have a children’s college fund, a retirement fund, vacation fund and<br />
household expenses fund (such as an IRA, savings and checking account). A <strong>budget</strong> fund, then,<br />
is a fiscal and accounting entity with a self-balancing set <strong>of</strong> accounts recording cash and other<br />
financial resources. Glendale uses separate funds in order to correctly and legally track revenues<br />
and expenditures associated with that particular fund to aid with various financial reporting<br />
requirements.<br />
643<br />
Return to TOC
APPENDIX<br />
Frequently Asked Questions<br />
What is a fund balance? Fund balance refers to the remainder or carryover that occurs when<br />
actual revenues exceed <strong>budget</strong>ed revenues and/or when actual expenditures are less than<br />
<strong>budget</strong>ed expenditures at the end <strong>of</strong> the fiscal year (June 30). If the <strong>city</strong> <strong>budget</strong>s (plans to spend)<br />
$15.0 million on roads next year, but only spends $14.0 million, the leftover $1.0 million would<br />
essentially become fund balance.<br />
What does the word "group" in Glendale's <strong>budget</strong> mean? Every department belongs to an<br />
administrative group led by an Executive Director, Department Director, City Manager or<br />
Assistant City Manager. These groups include Appointed & Elected Officials, Budget &<br />
Financial Services, City Manager, Communications, Compliance & Asset Management,<br />
Development Services, Economic Development, Human Resources & Risk Management,<br />
Intergovernmental Programs, Leisure and Cultural Services, Neighborhood & Human Services,<br />
Public Safety, Public Works, Technology & Innovation, Transportation Services and Water<br />
Services.<br />
What are infrastructure and capital improvements? Infrastructure and capital improvements<br />
refer to facilities that need to be in place in order to support the basic needs <strong>of</strong> residents and<br />
businesses in the community. Examples include roads, water lines, sewers, public buildings,<br />
parks and airports.<br />
What are strategic priorities and benchmarks? Why does Glendale use them?<br />
Strategic Priorities, developed by the City Council, are statements <strong>of</strong> community values that<br />
direct the <strong>city</strong>'s operations and help demonstrate progress towards a shared vision. City staff<br />
uses these priorities to assist in program development, creating <strong>annual</strong> <strong>budget</strong> requests and<br />
building department business plans.<br />
Benchmarks are established for each activity listed in business plans and represent a desired level<br />
<strong>of</strong> performance that demonstrates the efficient use <strong>of</strong> <strong>city</strong> resources to do the most good. City<br />
staff measures actual performance throughout the year, makes comparisons to established<br />
benchmarks, determines the causes for deviation and evaluates alternative courses <strong>of</strong> action.<br />
What exactly is a “program” in the <strong>city</strong> <strong>budget</strong>? A program is a group <strong>of</strong> related activities<br />
performed by one or more organizational units for the purpose <strong>of</strong> accomplishing a <strong>city</strong><br />
responsibility. For example, one program in the Field Operations Department is Street Cleaning.<br />
Based on staff’s assessment <strong>of</strong> costs and needs, the desires <strong>of</strong> citizens and the priorities <strong>of</strong> the<br />
City Council, the Field Operations Department is <strong>budget</strong>ed a set amount <strong>of</strong> money to accomplish<br />
street cleaning.<br />
What is “assessed valuation” and how does it relate to my taxes and the <strong>city</strong>’s <strong>budget</strong>? Each<br />
year the Maricopa County Assessor’s Office determines the value <strong>of</strong> all property within the<br />
county, including <strong>city</strong> buildings and individual homes. These assessment values are then used as<br />
a basis for levying property taxes. The City <strong>of</strong> Glendale charges $1.5951 in property tax per<br />
$100 <strong>of</strong> assessed valuation ($0.2252 primary rate and $1.3699 secondary rate).<br />
How much does the <strong>city</strong> receive from my property tax bill and how is it used? Primary<br />
Property tax revenue represents 3% <strong>of</strong> the <strong>city</strong>’s General Fund revenue, which is estimated at<br />
$2.9 million in this year’s <strong>budget</strong>. Secondary Property Tax, used to pay <strong>of</strong>f General Obligation<br />
644<br />
Return to TOC
APPENDIX<br />
Frequently Asked Questions<br />
bonds, will generate approximately $17.9 million in FY <strong>2011</strong>. The City <strong>of</strong> Glendale is one <strong>of</strong><br />
several entities that receive a portion <strong>of</strong> the property taxes residents pay, with school districts<br />
typically receiving the majority. Each year the Glendale City Council levies the property tax one<br />
week after final <strong>budget</strong> adoption.<br />
Primary Tax: Arizona law limits the primary property tax levy amount and<br />
municipalities may use revenue from this tax for any lawful purpose. Glendale’s FY<br />
<strong>2011</strong> primary property tax rate <strong>of</strong> $0.2252 per $100 <strong>of</strong> assessed valuation is used for<br />
General Fund operations.<br />
Secondary Tax: Arizona does not limit the secondary tax levy amount and municipalities<br />
may only use this levy to retire the principal and interest or redemption charges on bond<br />
debt. Glendale’s FY <strong>2011</strong> secondary tax rate <strong>of</strong> $1.3699 per $100 <strong>of</strong> assessed valuation is<br />
used to pay debt service on General Obligation bonds.<br />
Where does the <strong>city</strong>’s revenue come from? Glendale's revenue comes from a variety <strong>of</strong><br />
sources, including sales tax, property tax, user charges and other levels <strong>of</strong> government.<br />
What is state-shared revenue? The state <strong>of</strong> Arizona shares a portion <strong>of</strong> its tax revenues (from<br />
sales, income and motor vehicle in-lieu taxes) with Arizona cities and towns. This funding is<br />
divided among the cities and towns using population formulas supplied by state law. These<br />
state-shared revenues comprise a large portion <strong>of</strong> most <strong>city</strong> and town <strong>budget</strong>s, including 31.1%<br />
<strong>of</strong> Glendale's General Fund (Fund 1000).<br />
State-shared revenue enables local governments to continue providing basic services, such as<br />
police and fire protection, without burdening the residents with additional local taxes. Since<br />
cities and towns are not equally wealthy, state shared revenue is <strong>of</strong> great assistance, especially to<br />
cities with lesser wealth or greater service needs. Because state-shared revenue distribution is a<br />
specified percentage <strong>of</strong> state revenue collections, as state revenue declines, <strong>city</strong> revenue declines.<br />
Consequently, in difficult economic times, cities 'feel the pinch' just as the State does.<br />
What is a <strong>budget</strong> transfer? A <strong>budget</strong> transfer moves <strong>budget</strong> appropriation between programs<br />
or funds. Transfers within funds may be done on the City Manager's authority; the City Manager<br />
is appointed by the City Council to act as the <strong>city</strong>’s chief executive <strong>of</strong>ficer. Transfers between<br />
funds require City Council approval.<br />
What are user charges? User charges are fees paid in direct receipt <strong>of</strong> a public service by the<br />
party who benefits from the service. Fees paid for recreation classes or leagues that citizens elect<br />
to sign up for and participate are examples <strong>of</strong> user charges.<br />
City <strong>of</strong> Glendale<br />
Management and Budget Department<br />
6829 North 58 th Drive, Suite 200<br />
Glendale, Arizona 85301<br />
Phone: (623) 930-2264<br />
Fax: (623) 915-2694<br />
Email: aweathersby@<strong>glendale</strong><strong>az</strong>.com<br />
645<br />
Return to TOC