Lab 1 Calibration of a Thermistor
Lab 1 Calibration of a Thermistor
Lab 1 Calibration of a Thermistor

Create successful ePaper yourself
Turn your PDF publications into a flip-book with our unique Google optimized e-Paper software.
Pre- <strong>Lab</strong> for <strong>Calibration</strong><br />
<strong>of</strong> a <strong>Thermistor</strong><br />
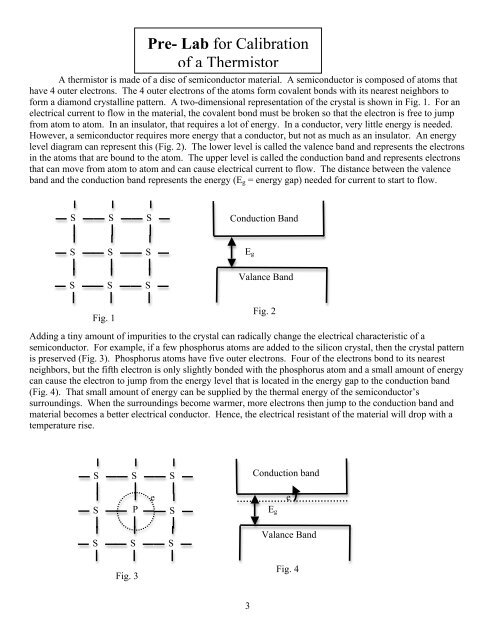
A thermistor is made <strong>of</strong> a disc <strong>of</strong> semiconductor material. A semiconductor is composed <strong>of</strong> atoms that<br />
have 4 outer electrons. The 4 outer electrons <strong>of</strong> the atoms form covalent bonds with its nearest neighbors to<br />
form a diamond crystalline pattern. A two-dimensional representation <strong>of</strong> the crystal is shown in Fig. 1. For an<br />
electrical current to flow in the material, the covalent bond must be broken so that the electron is free to jump<br />
from atom to atom. In an insulator, that requires a lot <strong>of</strong> energy. In a conductor, very little energy is needed.<br />
However, a semiconductor requires more energy that a conductor, but not as much as an insulator. An energy<br />
level diagram can represent this (Fig. 2). The lower level is called the valence band and represents the electrons<br />
in the atoms that are bound to the atom. The upper level is called the conduction band and represents electrons<br />
that can move from atom to atom and can cause electrical current to flow. The distance between the valence<br />
band and the conduction band represents the energy (E g = energy gap) needed for current to start to flow.<br />
S<br />
i<br />
S<br />
i<br />
S<br />
i<br />
Conduction Band<br />
S<br />
i<br />
S<br />
i<br />
S<br />
i<br />
E g<br />
S<br />
i<br />
S<br />
i<br />
S<br />
i<br />
Valance Band<br />
Fig. 1<br />
Fig. 2<br />
Adding a tiny amount <strong>of</strong> impurities to the crystal can radically change the electrical characteristic <strong>of</strong> a<br />
semiconductor. For example, if a few phosphorus atoms are added to the silicon crystal, then the crystal pattern<br />
is preserved (Fig. 3). Phosphorus atoms have five outer electrons. Four <strong>of</strong> the electrons bond to its nearest<br />
neighbors, but the fifth electron is only slightly bonded with the phosphorus atom and a small amount <strong>of</strong> energy<br />
can cause the electron to jump from the energy level that is located in the energy gap to the conduction band<br />
(Fig. 4). That small amount <strong>of</strong> energy can be supplied by the thermal energy <strong>of</strong> the semiconductor’s<br />
surroundings. When the surroundings become warmer, more electrons then jump to the conduction band and<br />
material becomes a better electrical conductor. Hence, the electrical resistant <strong>of</strong> the material will drop with a<br />
temperature rise.<br />
S<br />
i<br />
S<br />
i<br />
S<br />
i<br />
P<br />
e<br />
S<br />
i<br />
S<br />
i<br />
Conduction band<br />
E g<br />
e<br />
S<br />
i<br />
S<br />
i<br />
S<br />
i<br />
Valance Band<br />
Fig. 3<br />
Fig. 4<br />
3
The relationship between resistance and temperature for a thermistor is given by the Steinhart-Hart equation:<br />
1<br />
= A + Bln(R) + Cln(R)3<br />
T<br />
where T is measured in Kelvin and R is the resistance in ohms. The coefficients A, B, and C are the Steinhart-<br />
Hart coefficients and vary depending on the thermistor.<br />
€<br />
If A = 8.267 x 10 -4 K -1 , B = 2.089 x 10 -4 K -1 , and C= 8.033 x 10 -8 K -1 , write an Excel spread sheet to complete<br />
the following table.<br />
Save the program on your computer for lab.<br />
R(Ω) ln(R) 1/T<br />
(in K -1 )<br />
T<br />
(in K)<br />
T<br />
(In C o )<br />
T<br />
(in F o )<br />
269,080 12.503 0.003595 278.1 4.96 40.9<br />
207,850<br />
126,740<br />
100,000<br />
51,048<br />
27,475<br />
16,689<br />
10,110<br />
7,707<br />
5569<br />
4
<strong>Calibration</strong> <strong>of</strong> a <strong>Thermistor</strong><br />
Object: <strong>Thermistor</strong>s are temperature-sensitive resistive devices used in a wide range <strong>of</strong> temperature<br />
measurement applications. In this experiment you will calibrate a thermistor over a temperature range <strong>of</strong><br />
0°C to 100°C and use this data to determine the coefficients <strong>of</strong> an equation relating resistance to<br />
temperature.<br />
Apparatus:<br />
1. <strong>Thermistor</strong> probe<br />
2. Digital Multimeter<br />
3. Beaker<br />
4. Ice<br />
5. Hot Plate<br />
6. Thermometer<br />
Procedure:<br />
1. Assemble the apparatus as demonstrated by your instructor. Beginning with ice water in the container,<br />
take an initial reading as close to 0°C as possible. Stir the water before the reading to maintain the<br />
thermistor and thermometer at the same steady temperature.<br />
2. Once a good initial reading has been taken, remove the ice and begin heating the bath. Approximately<br />
every 5 C° remove the heat and take a resistance/ temperature reading, again being certain to stir the<br />
bath. Continue taking readings up to near 100°C.<br />
3. When you are finished collecting data, turn <strong>of</strong>f the hot plate and allow the water to cool while you<br />
analyze the data. As the water cools, record 4 readings <strong>of</strong> temperature and resistance. These data points<br />
will be used to check the curve fit <strong>of</strong> the data.<br />
4. Plot the data as a scatter graph on the computer with resistance on the<br />
x-axis and temperature along the y-axis.<br />
5. Plot the data with inverse Kelvin temperature on the y-axis and the natural log <strong>of</strong> the resistance on the x-<br />
axis Draw a straight line through your data points. Use the curve-fitting option in the graphing program<br />
to make a cubic fit to your data. The formula displayed will have the approximate values <strong>of</strong> A, B, C and<br />
D for the equation below. Use these values to check your answers in the next step.<br />
6. The manufacture <strong>of</strong> the thermister claims the empirical equation is given by the following equation.<br />
1<br />
= A + Bln(R) + Cln(R)3<br />
T<br />
where temperature T is in degrees Kelvin and ln(R) is the natural log <strong>of</strong> the<br />
resistance, R. How well the curve fits is given by the correlation factor R term at the end <strong>of</strong> the<br />
equation. R<br />
€<br />
= 1 would indicate a perfect fit. (Note: The curve fit gives a value for R and for R 2 .)<br />
However, the Excel program does not allow the data to be fitted to any arbitrary function. Plot (1/T)<br />
versus ln(R). Fit the graph to a polynomial <strong>of</strong> degree 3. That is, the equation we are going to use is as<br />
following:<br />
5
1<br />
T = A + Bln(R) + (1)<br />
Cln(R)2 + Dln(R) 3<br />
7. Use the graph and the equation to determine the temperatures <strong>of</strong> the water bath at those points taken<br />
while the bath was cooling. Compare these values with those read from the mercury thermometer. The<br />
calculations<br />
€<br />
can be done using a calculator or an excel spreadsheet can be used.<br />
Data: (An Excel spreadsheet can be used. Print out the spreadsheet instead <strong>of</strong> using the table below.)<br />
1<br />
2<br />
3<br />
4<br />
5<br />
6<br />
7<br />
8<br />
9<br />
10<br />
11<br />
12<br />
13<br />
14<br />
15<br />
16<br />
17<br />
18<br />
19<br />
20<br />
Temperature<br />
(in C o )<br />
Temperature<br />
( in K)<br />
Resistance<br />
(in Ω)<br />
1/T<br />
(in K -1 )<br />
ln(R)<br />
Graph fitting equation:<br />
A = _________ B = ____________ C = ____________ D = _______________<br />
Comparison <strong>of</strong> four data points while the water is cooling.<br />
T (Measured) R (Measured) T (From Graph) T(From Equation 1)<br />
1<br />
2<br />
3<br />
4<br />
Questions<br />
1) How does resistance relate to temperature in your thermistor?<br />
6