Recycling and Waste Minimization Case Studies - Houston ...
Recycling and Waste Minimization Case Studies - Houston ...
Recycling and Waste Minimization Case Studies - Houston ...
Create successful ePaper yourself
Turn your PDF publications into a flip-book with our unique Google optimized e-Paper software.
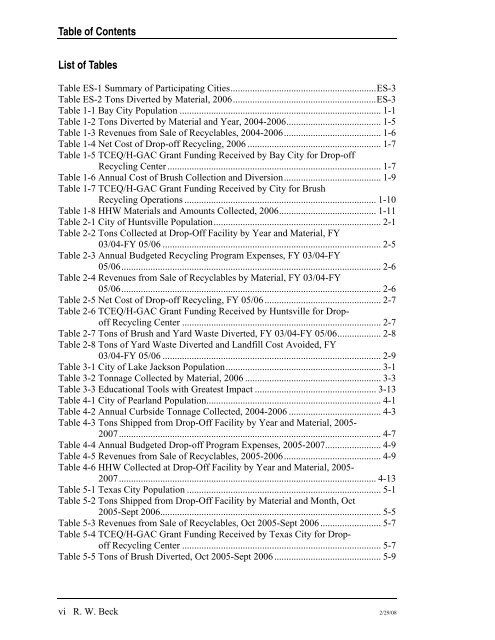
Table of Contents<br />
List of Tables<br />
Table ES-1 Summary of Participating Cities............................................................ES-3<br />
Table ES-2 Tons Diverted by Material, 2006...........................................................ES-3<br />
Table 1-1 Bay City Population ................................................................................... 1-1<br />
Table 1-2 Tons Diverted by Material <strong>and</strong> Year, 2004-2006....................................... 1-5<br />
Table 1-3 Revenues from Sale of Recyclables, 2004-2006........................................ 1-6<br />
Table 1-4 Net Cost of Drop-off <strong>Recycling</strong>, 2006 ....................................................... 1-7<br />
Table 1-5 TCEQ/H-GAC Grant Funding Received by Bay City for Drop-off<br />
<strong>Recycling</strong> Center ........................................................................................ 1-7<br />
Table 1-6 Annual Cost of Brush Collection <strong>and</strong> Diversion........................................ 1-9<br />
Table 1-7 TCEQ/H-GAC Grant Funding Received by City for Brush<br />
<strong>Recycling</strong> Operations ............................................................................... 1-10<br />
Table 1-8 HHW Materials <strong>and</strong> Amounts Collected, 2006........................................ 1-11<br />
Table 2-1 City of Huntsville Population..................................................................... 2-1<br />
Table 2-2 Tons Collected at Drop-Off Facility by Year <strong>and</strong> Material, FY<br />
03/04-FY 05/06 .......................................................................................... 2-5<br />
Table 2-3 Annual Budgeted <strong>Recycling</strong> Program Expenses, FY 03/04-FY<br />
05/06........................................................................................................... 2-6<br />
Table 2-4 Revenues from Sale of Recyclables by Material, FY 03/04-FY<br />
05/06........................................................................................................... 2-6<br />
Table 2-5 Net Cost of Drop-off <strong>Recycling</strong>, FY 05/06................................................ 2-7<br />
Table 2-6 TCEQ/H-GAC Grant Funding Received by Huntsville for Dropoff<br />
<strong>Recycling</strong> Center .................................................................................. 2-7<br />
Table 2-7 Tons of Brush <strong>and</strong> Yard <strong>Waste</strong> Diverted, FY 03/04-FY 05/06.................. 2-8<br />
Table 2-8 Tons of Yard <strong>Waste</strong> Diverted <strong>and</strong> L<strong>and</strong>fill Cost Avoided, FY<br />
03/04-FY 05/06 .......................................................................................... 2-9<br />
Table 3-1 City of Lake Jackson Population................................................................ 3-1<br />
Table 3-2 Tonnage Collected by Material, 2006 ........................................................ 3-3<br />
Table 3-3 Educational Tools with Greatest Impact .................................................. 3-13<br />
Table 4-1 City of Pearl<strong>and</strong> Population........................................................................ 4-1<br />
Table 4-2 Annual Curbside Tonnage Collected, 2004-2006 ...................................... 4-3<br />
Table 4-3 Tons Shipped from Drop-Off Facility by Year <strong>and</strong> Material, 2005-<br />
2007............................................................................................................ 4-7<br />
Table 4-4 Annual Budgeted Drop-off Program Expenses, 2005-2007....................... 4-9<br />
Table 4-5 Revenues from Sale of Recyclables, 2005-2006........................................ 4-9<br />
Table 4-6 HHW Collected at Drop-Off Facility by Year <strong>and</strong> Material, 2005-<br />
2007.......................................................................................................... 4-13<br />
Table 5-1 Texas City Population ................................................................................ 5-1<br />
Table 5-2 Tons Shipped from Drop-Off Facility by Material <strong>and</strong> Month, Oct<br />
2005-Sept 2006........................................................................................... 5-5<br />
Table 5-3 Revenues from Sale of Recyclables, Oct 2005-Sept 2006......................... 5-7<br />
Table 5-4 TCEQ/H-GAC Grant Funding Received by Texas City for Dropoff<br />
<strong>Recycling</strong> Center .................................................................................. 5-7<br />
Table 5-5 Tons of Brush Diverted, Oct 2005-Sept 2006............................................ 5-9<br />
vi R. W. Beck 2/29/08


