National Instrument 43-101 Technical Report ... - Hudbay Minerals
National Instrument 43-101 Technical Report ... - Hudbay Minerals
National Instrument 43-101 Technical Report ... - Hudbay Minerals

You also want an ePaper? Increase the reach of your titles
YUMPU automatically turns print PDFs into web optimized ePapers that Google loves.
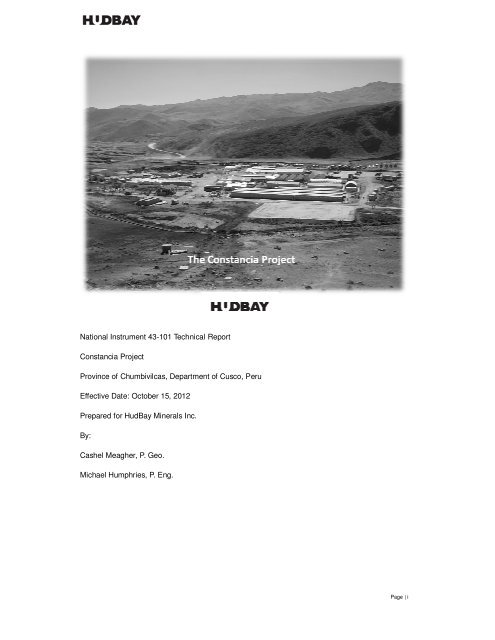
<strong>National</strong> <strong>Instrument</strong> <strong>43</strong>-<strong>101</strong> <strong>Technical</strong> <strong>Report</strong><br />
Constancia Project<br />
Province of Chumbivilcas, Department of Cusco, Peru<br />
Effective Date: October 15, 2012<br />
Prepared for HudBay <strong>Minerals</strong> Inc.<br />
By:<br />
Cashel Meagher, P. Geo.<br />
Michael Humphries, P. Eng.<br />
Page | i
“FORWARD LOOKING INFORMATION” STATEMENT<br />
This <strong>Technical</strong> <strong>Report</strong> contains “forward-looking statements” and “forward-looking information”<br />
(collectively, “forward-looking information”) within the meaning of applicable Canadian and United<br />
States securities legislation. All information contained in this <strong>Technical</strong> <strong>Report</strong>, other than<br />
statements of current and historical fact, is forward-looking information. Often, but not always,<br />
forward-looking information can be identified by the use of words such as “plans”, “expects”,<br />
“budget”, “guidance”, “scheduled”, “estimates”, “forecasts”, “strategy”, “target”, “intends”,<br />
“objective”, “goal”, “understands”, “anticipates” and “believes” (and variations of these or similar<br />
words) and statements that certain actions, events or results ‘‘may’’, ‘‘could’’, ‘‘would’’, ‘‘should’’,<br />
‘‘might’’ ‘‘occur’’ or ‘‘be achieved’’ or ‘‘will be taken’’ (and variations of these or similar<br />
expressions). All of the forward-looking information in this <strong>Technical</strong> <strong>Report</strong> is qualified by this<br />
cautionary statement.<br />
Forward-looking information includes, but is not limited to, the estimated capital cost and<br />
economics of the Constancia Project, <strong>Hudbay</strong>’s ability to fund the development of the Constancia<br />
Project, the construction and permitting schedule for the Constancia Project, the anticipated<br />
production from the Constancia Project, expectations regarding community relations and the<br />
relocation of individuals pursuant to community agreements, assumptions respecting commodity<br />
prices, exchange rates and future cash flows, estimates of mineral resources and reserves, and<br />
other plans respecting the Constancia Project.<br />
Forward-looking information is not, and cannot be, a guarantee of future results or events.<br />
Forward-looking information is based on, among other things, opinions, assumptions, estimates<br />
and analyses that, while considered reasonable by <strong>Hudbay</strong> at the date the forward-looking<br />
information is provided, inherently are subject to significant risks, uncertainties, contingencies and<br />
other factors that may cause actual results and events to be materially different from those<br />
expressed or implied by the forward-looking information.<br />
The material factors or assumptions that were applied in drawing conclusions or making forecasts<br />
or projections set out in the forward looking information include, but are not limited to:<br />
• the accuracy of geological, mining and metallurgical estimates;<br />
• the costs of production;<br />
• the supply and demand for produced metals;<br />
• the volatility of commodity prices;<br />
• the volatility in foreign exchange rates;<br />
• the availability of third party processing facilities for produced concentrate;<br />
• the supply and availability of all forms of energy and fuels at reasonable prices;<br />
• the availability of transportation services and other infrastructure at reasonable prices;<br />
• no significant unanticipated operational or technical difficulties;<br />
• the availability of financing for the construction of the project;<br />
• the ability to complete project targets on time and on budget;<br />
• the timing and receipt of various regulatory and governmental approvals;<br />
• maintaining good relations with the communities surrounding the Constancia Project;<br />
• no significant unanticipated events relating to regulatory, environmental, health and<br />
safety matters;<br />
• any assumptions related to taxes, including, but not limited to current tax laws and<br />
regulations; and<br />
• no significant and continuing adverse changes in general economic conditions or<br />
conditions in the financial markets.<br />
The risks, uncertainties, contingencies and other factors that may cause actual results to differ<br />
materially from those expressed or implied by the forward-looking information may include, but<br />
Page | ii
are not limited to, risks generally associated with the mining industry, such as economic factors<br />
(including future commodity prices, currency fluctuations and energy prices), uncertainties related<br />
to the development and operation of the Constancia Project, risks related to political or social<br />
unrest or change and those in respect of community relations, operational risks and hazards,<br />
including unanticipated environmental, industrial and geological events and developments and<br />
the inability to insure against all risks, failure of plant, equipment, processes, transportation and<br />
other infrastructure to operate as anticipated, compliance with government and environmental<br />
regulations, including permitting requirements and anti-bribery legislation, dependence on key<br />
personnel and employee relations, volatile financial markets that may affect <strong>Hudbay</strong>’s ability to<br />
obtain financing on acceptable terms, uncertainties related to the geology, continuity, grade and<br />
estimates of mineral reserves and resources and the potential for variations in grade and<br />
recovery rates, uncertain costs of reclamation activities, as well as the risks discussed under the<br />
heading “Risk Factors” in our most recent Annual Information Form, Form 40-F and<br />
Management’s Discussion and Analysis for the three and six months ended June 30, 2012.<br />
Should one or more risk, uncertainty, contingency or other factor materialize or should any factor<br />
or assumption prove incorrect, actual results could vary materially from those expressed or<br />
implied in the forward-looking information. Accordingly, you should not place undue reliance on<br />
forward-looking information. <strong>Hudbay</strong> does not assume any obligation to update or revise any<br />
forward-looking information after the date of this <strong>Technical</strong> <strong>Report</strong> or to explain any material<br />
difference between subsequent actual events and any forward-looking information, except as<br />
required by applicable law.<br />
Page | iii
Contents<br />
1.0 Summary ........................................................................................................................15<br />
1.1 Summary ................................................................................................................ 15<br />
1.2 Introduction ............................................................................................................. 15<br />
1.3 Reliance on Other Experts ...................................................................................... 15<br />
1.4 Property Description and Location ........................................................................... 16<br />
1.5 Accessibility, Climate, Local Resources, Infrastructure and Physiography ................ 16<br />
1.6 History .................................................................................................................... 18<br />
1.7 Geological Setting and Mineralization ...................................................................... 19<br />
1.7.1 Constancia ...............................................................................................................19<br />
1.7.2 Pampacancha ..........................................................................................................20<br />
1.8 Deposit Types ......................................................................................................... 20<br />
1.9 Exploration .............................................................................................................. 20<br />
1.10 Drilling .................................................................................................................... 21<br />
1.11 Sample Preparation, Analyses, and Security ........................................................... 22<br />
1.11.1 Constancia ...............................................................................................................22<br />
1.11.2 Pampacancha ..........................................................................................................22<br />
1.12 Data Verification ...................................................................................................... 23<br />
1.12.1 Constancia ...............................................................................................................23<br />
1.12.2 Pampacancha ..........................................................................................................24<br />
1.13 Mineral Processing and Metallurgical Testing .......................................................... 25<br />
1.14 Mineral Resource Estimates .................................................................................... 26<br />
1.14.1 Constancia ...............................................................................................................26<br />
1.14.2 Pampacancha ..........................................................................................................27<br />
1.15 Mineral Reserve Estimates...................................................................................... 28<br />
1.16 Mining Methods....................................................................................................... 30<br />
1.17 Recovery Methods .................................................................................................. 38<br />
1.18 Project Infrastructure ............................................................................................... 40<br />
1.19 Marketing and Contracts ......................................................................................... <strong>43</strong><br />
1.20 Environmental Studies, Permitting, and Social or Community Impact ....................... <strong>43</strong><br />
1.21 Capital and Operating Costs ................................................................................... 45<br />
1.22 Economic Analysis .................................................................................................. 46<br />
1.23 Adjacent Properties ................................................................................................. 46<br />
1.24 Other Relevant Data and Information ...................................................................... 46<br />
1.25 Interpretation and Conclusions ................................................................................ 46<br />
1.26 Recommendations .................................................................................................. 48<br />
2.0 Introduction ...................................................................................................................49<br />
2.1 Terms of Reference ................................................................................................. 49<br />
2.2 Source of Information .............................................................................................. 49<br />
Page | iv
2.3 Qualified Persons and Site Visits ............................................................................. 50<br />
2.4 Unit of Measure Abbreviations Used in <strong>Report</strong> ......................................................... 51<br />
2.5 Acronyms and Abbreviations Used in <strong>Report</strong> ........................................................... 52<br />
3.0 Reliance on Other Experts ............................................................................................54<br />
4.0 Property Description and Location ...............................................................................55<br />
4.1 The Property Location ............................................................................................. 55<br />
4.2 Mineral Tenure ........................................................................................................ 55<br />
4.2.1 Peruvian Mining Law ................................................................................................55<br />
4.2.2 Constancia and Pampacancha Mining Concessions .................................................57<br />
4.3 Surface Legal Right Access ..................................................................................... 62<br />
4.4 The Terms of Any Royalty or Payments ................................................................... 65<br />
4.5 Environmental Liabilities .......................................................................................... 66<br />
4.6 Risk factors property ............................................................................................... 67<br />
4.7 Permits ................................................................................................................... 67<br />
5.0 Accessibility, Climate, Local Resources Infrastructure and Physiography ................68<br />
5.1 Accessibility ............................................................................................................ 68<br />
5.2 Climate and vegetation............................................................................................ 69<br />
5.3 Local resource ........................................................................................................ 71<br />
5.4 Infrastructure ........................................................................................................... 71<br />
5.5 Geomorphology ...................................................................................................... 71<br />
6.0 History............................................................................................................................73<br />
6.1 Early History ........................................................................................................... 73<br />
6.2 Prior Ownership ...................................................................................................... 73<br />
6.3 <strong>Hudbay</strong> Ownerships ................................................................................................ 74<br />
6.4 Pampacancha ......................................................................................................... 74<br />
7.0 Geological Setting and Mineralization ..........................................................................75<br />
7.1 Geological Setting ................................................................................................... 75<br />
7.1.1 District Geology........................................................................................................75<br />
7.1.2 Property Geology .....................................................................................................77<br />
7.2 Significant Mineralization ......................................................................................... 84<br />
7.2.1 Constancia ...............................................................................................................84<br />
7.2.2 Pampacancha ..........................................................................................................85<br />
8.0 Deposit Types ................................................................................................................87<br />
9.0 Exploration ....................................................................................................................88<br />
9.1 Surface Mapping and sampling ............................................................................... 88<br />
9.2 Geophysics ............................................................................................................. 89<br />
9.3 Exploration Targets ................................................................................................. 90<br />
9.3.1 Pampacancha Other Prospects ................................................................................90<br />
9.3.2 Chilloroya South Prospect ........................................................................................94<br />
Page | v
10.0 Drilling ..........................................................................................................................<strong>101</strong><br />
10.1 Overview............................................................................................................... <strong>101</strong><br />
10.2 Collar Location ...................................................................................................... 104<br />
10.3 Rig Set up ............................................................................................................. 104<br />
10.4 Downhole survey .................................................................................................. 105<br />
11.0 Sample Preparation Analyses and Security ...............................................................106<br />
11.1 Exploration Campaigns ......................................................................................... 106<br />
11.1.1 Mitsui and Minera Katanga 1970-1980 ...................................................................106<br />
11.1.2 Rio Tinto 2003 – 2004 ............................................................................................106<br />
11.1.3 Norsemont 2005 ....................................................................................................107<br />
11.1.4 Norsemont 2006 – 2007 .........................................................................................107<br />
11.1.5 Norsemont 2008 – 2009 .........................................................................................108<br />
11.1.6 Norsemont 2010 ....................................................................................................108<br />
11.1.7 <strong>Hudbay</strong> 2011-2012 .................................................................................................109<br />
11.2 Constancia ............................................................................................................ 109<br />
11.2.1 Bulk Density ...........................................................................................................109<br />
11.2.2 Sample Preparation and Assaying .......................................................................... 112<br />
11.2.3 Database Integrity .................................................................................................. 112<br />
11.3 Pampacancha ........................................................................................................ 113<br />
11.3.1 Bulk Density Measurements ................................................................................... 113<br />
11.3.2 Sample Preparation ............................................................................................... 113<br />
11.3.3 Assay Methodology ................................................................................................ 113<br />
11.3.4 Blanks .................................................................................................................... 114<br />
11.3.5 Standards .............................................................................................................. 114<br />
11.3.6 Duplicates .............................................................................................................. 115<br />
11.3.7 Check Assaying ..................................................................................................... 115<br />
12.0 Data Verification .......................................................................................................... 116<br />
12.1 Constancia ............................................................................................................. 116<br />
12.1.1 Norsemont QC protocol.......................................................................................... 116<br />
12.1.2 QC Evaluation ........................................................................................................ 116<br />
12.1.3 Site Visit .................................................................................................................128<br />
12.1.4 Core Review ..........................................................................................................129<br />
12.2 Pampacancha ....................................................................................................... 130<br />
12.2.1 Quality Assurance / Quality Control ........................................................................130<br />
12.2.2 Site Visit .................................................................................................................137<br />
12.2.3 Core Review ..........................................................................................................137<br />
12.2.4 Drilling Database ....................................................................................................137<br />
13.0 Mineral Processing and Metallurgical Testing ...........................................................138<br />
13.1 Samples................................................................................................................ 138<br />
Page | vi
13.2 Constancia ............................................................................................................ 138<br />
13.2.1 Constancia Metallurgical Phase I ...........................................................................138<br />
13.2.2 Constancia Metallurgical Phase II...........................................................................138<br />
13.2.3 Constancia Metallurgical Phase III..........................................................................139<br />
13.2.4 Impact of deleterious elements ...............................................................................141<br />
13.3 Flotation products studies ..................................................................................... 141<br />
13.4 Pampacancha pfs testwork ................................................................................... 142<br />
13.4.1 Phase 1 .................................................................................................................142<br />
13.4.2 Phase 2 .................................................................................................................149<br />
13.4.3 Conclusion .............................................................................................................155<br />
13.4.4 Discussion .............................................................................................................155<br />
13.4.5 Recommendations .................................................................................................156<br />
14.0 Mineral Resource Estimates .......................................................................................157<br />
14.1 Constancia ............................................................................................................ 157<br />
14.1.1 Model and Composite Setup ..................................................................................157<br />
14.1.2 Geological Model ...................................................................................................162<br />
14.1.3 Exploratory Data Analysis ......................................................................................172<br />
14.1.4 Grade Estimation ...................................................................................................180<br />
14.1.5 Validation Model .....................................................................................................182<br />
14.1.6 Resource Classification ..........................................................................................190<br />
14.1.7 Mineral Resources .................................................................................................193<br />
14.2 Pampacancha ....................................................................................................... 195<br />
14.2.1 Model and Composite Setup ..................................................................................195<br />
14.2.2 Geological Model ...................................................................................................198<br />
14.2.3 Exploratory Data Analysis ......................................................................................200<br />
14.2.4 Grade Estimation ...................................................................................................203<br />
14.2.5 Validation Model .....................................................................................................204<br />
14.2.6 Mineral Resource Classification .............................................................................208<br />
14.2.7 Mineral Resources .................................................................................................209<br />
15.0 Mineral Reserve Estimates..........................................................................................210<br />
15.1 Pit Optimization ..................................................................................................... 210<br />
15.1.1 Block Models .........................................................................................................210<br />
15.1.2 Net Smelter Return ................................................................................................ 211<br />
15.1.3 Constancia Optimization Results ............................................................................217<br />
15.1.4 Pampacancha Optimization Results .......................................................................217<br />
15.1.5 Pit Design Criteria ..................................................................................................218<br />
15.2 Mineral Reserves .................................................................................................. 221<br />
15.2.1 Mineral Reserve Economics ...................................................................................224<br />
16.0 Mining Methods ...........................................................................................................225<br />
Page | vii
16.1 Introduction ........................................................................................................... 225<br />
16.2 Geotechnical Parameters ...................................................................................... 226<br />
16.2.1 Constancia .............................................................................................................226<br />
16.2.2 Pampacancha ........................................................................................................229<br />
16.3 Hydrogeological Parameters ................................................................................. 232<br />
16.3.1 Constancia .............................................................................................................232<br />
16.3.2 Pampacancha ........................................................................................................233<br />
16.4 Pit Design ............................................................................................................. 233<br />
16.4.1 Constancia .............................................................................................................233<br />
16.4.2 Pampacancha ........................................................................................................235<br />
16.5 Mine Phases ......................................................................................................... 236<br />
16.5.1 Constancia .............................................................................................................236<br />
16.5.2 Pampacancha ........................................................................................................239<br />
16.6 Mine and Process Schedule .................................................................................. 240<br />
16.6.1 Mine Pre – Production ............................................................................................240<br />
16.6.2 Production Schedule ..............................................................................................242<br />
16.7 Waste Rock Facility ............................................................................................... 245<br />
16.7.1 PAG - WRF ............................................................................................................245<br />
16.7.2 Non-PAG Stockpile ................................................................................................247<br />
16.7.3 Topsoil Stockpile ....................................................................................................247<br />
16.8 Mine Fleet Assessment ......................................................................................... 247<br />
16.9 Mine Unit Operations ............................................................................................ 251<br />
16.9.1 Drilling ...................................................................................................................251<br />
16.9.2 Blasting ..................................................................................................................252<br />
16.9.3 Loading ..................................................................................................................253<br />
16.9.4 Hauling ..................................................................................................................255<br />
16.10 Mining Losses and Dilution.................................................................................... 255<br />
17.0 Recovery Methods .......................................................................................................256<br />
17.1 Introduction ........................................................................................................... 256<br />
17.1.1 General Layout and Description .............................................................................256<br />
17.1.2 Facility description .................................................................................................257<br />
17.1.3 Throughput Optimization ........................................................................................261<br />
17.2 Processing Plant – General ................................................................................... 261<br />
17.3 Buildings ............................................................................................................... 262<br />
17.4 Crushing ............................................................................................................... 263<br />
17.4.1 Crushing ................................................................................................................263<br />
17.4.2 Crushed ore stockpile and reclaim..........................................................................263<br />
17.5 Grinding ................................................................................................................ 264<br />
17.6 Copper-Molybdenum Flotation .............................................................................. 265<br />
Page | viii
17.6.1 Layout ....................................................................................................................267<br />
17.6.2 Bulk Flotation Area Sumps .....................................................................................267<br />
17.7 Molybdenum Separation ....................................................................................... 268<br />
17.8 Copper Concentrate Thickening and Filtration ....................................................... 269<br />
17.9 Concentrate Storage and Loadout ......................................................................... 270<br />
17.10 Molybdenum Concentrate Thickening and Filtration............................................... 270<br />
17.11 Tailings Disposal ................................................................................................... 271<br />
17.12 Reagents .............................................................................................................. 271<br />
17.13 Nominal Operating Parameters ............................................................................. 272<br />
17.14 Metallurgical Accounting and Control ..................................................................... 273<br />
17.15 Pampacancha ....................................................................................................... 273<br />
18.0 Project Infrastructure ..................................................................................................275<br />
18.1 Tailings, Waste and water storage ......................................................................... 275<br />
18.1.1 Tailings Management facility ...................................................................................275<br />
18.1.2 Waste Rock Facility ................................................................................................277<br />
18.1.3 Water management ................................................................................................278<br />
18.2 On site camps ....................................................................................................... 279<br />
18.2.1 Permanent camp ....................................................................................................279<br />
18.2.2 Temporary camp (construction camp) .....................................................................279<br />
18.3 Electric power supply and transmission ................................................................. 280<br />
18.3.1 Power supply .........................................................................................................280<br />
18.3.2 Power transmission ................................................................................................281<br />
18.3.3 Current status ........................................................................................................281<br />
18.4 Roads and Port ..................................................................................................... 281<br />
18.4.1 Roads ....................................................................................................................281<br />
18.4.2 Port ........................................................................................................................283<br />
19.0 Market Studies and Contracts.....................................................................................285<br />
19.1 Marketing .............................................................................................................. 285<br />
19.2 Metal Price and Copper Concentrate TC/RC Forecast ........................................... 287<br />
19.3 Contracts .............................................................................................................. 288<br />
20.0 Environmental Studies, Permitting, and Social or Community Impact .....................289<br />
20.1 Environmental ....................................................................................................... 289<br />
20.1.1 Legal framework ....................................................................................................289<br />
20.1.2 Local and Regional Context ...................................................................................290<br />
20.1.3 Environmental instruments .....................................................................................291<br />
20.1.4 Environmental Impacts ...........................................................................................292<br />
20.1.5 Mine Closure Plan ..................................................................................................293<br />
20.2 Permitting ............................................................................................................. 294<br />
20.2.1 Constancia .............................................................................................................294<br />
Page | ix
20.2.2 Pampacancha ........................................................................................................295<br />
20.3 Social .................................................................................................................... 296<br />
20.4 Health and Safety ................................................................................................. 298<br />
21.0 Capital and Operating Costs .......................................................................................300<br />
21.1 Capital Costs ........................................................................................................ 300<br />
21.2 Operating Costs .................................................................................................... 301<br />
22.0 Economic Analysis ......................................................................................................303<br />
22.1 Cash Flow, NPV, IRR and Payback Period ............................................................ 303<br />
22.2 Principal Assumptions ........................................................................................... 309<br />
22.3 Sensitivity Analysis ................................................................................................ 314<br />
22.4 Taxes and Royalties .............................................................................................. 315<br />
23.0 Adjacent Properties .....................................................................................................318<br />
24.0 Other Relevant Data and Information .........................................................................319<br />
25.0 Interpretation and Conclusions ..................................................................................320<br />
26.0 Recommendations ......................................................................................................322<br />
27.0 References ...................................................................................................................324<br />
28.0 Signature Page ............................................................................................................326<br />
29.0 Certificates of Qualified Persons ................................................................................327<br />
Page | x
List of Tables<br />
Table 1-1: Approximate Distances and Driving Times to Constancia .......................................... 18<br />
Table 1-2: Recoveries ............................................................................................................... 26<br />
Table 1-3: Constancia Mineral Resources (Effective August 23, 2011) ....................................... 27<br />
Table 1-4: Pampacancha Mineral Resources (Effective April 2, 2012) ....................................... 28<br />
Table 1-5: Constancia and Pampacancha Mineral Reserves ..................................................... 30<br />
Table 1-6: Constancia Pit Design Parameters ........................................................................... 32<br />
Table 1-7: Constancia Slope Guidance ..................................................................................... 32<br />
Table 1-8: Pampacancha Pit Design Parameters ...................................................................... 33<br />
Table 1-9: Pampacancha Slope Guidance ................................................................................ 34<br />
Table 1-10: Breakdown of Phases ............................................................................................. 35<br />
Table 1-11: Mine Fleet Requirement - LOM ............................................................................... 37<br />
Table 1-12: Copper Concentrate Composition ........................................................................... <strong>43</strong><br />
Table 1-13: Capital Costs .......................................................................................................... 45<br />
Table 4-1: <strong>Hudbay</strong> Concession ................................................................................................. 59<br />
Table 4-2: <strong>Hudbay</strong> Concession Grants ...................................................................................... 60<br />
Table 4-3: Surface Legal Access Rights Table: .......................................................................... 63<br />
Table 5-1: Approximate Distances and Driving Times to Constancia .......................................... 69<br />
Table 10-1: Drilling Programmes by Year (in metres drilled) ..................................................... 102<br />
Table 10-2: Drilling Programmes (to 31 July 2012) .................................................................. 104<br />
Table 11-1: Summary of Density Samples by Mineralization Type............................................. 110<br />
Table 11-2: Summary of Density Samples by Mineralization Rock Type .................................... 111<br />
Table 11-3: SGS Assay Limits .................................................................................................. 114<br />
Table 11-4: Standard References Used by <strong>Hudbay</strong>................................................................... 115<br />
Table 12-1: Summary of Twin Samples .................................................................................... 117<br />
Table 12-2: Summary of Field Duplicates ................................................................................. 118<br />
Table 12-3: Summary of CRM Values and Performance .......................................................... 120<br />
Table 12-4: Summary of Blank Values ..................................................................................... 125<br />
Table 13-1: Phase 1: Comminution Results ............................................................................. 1<strong>43</strong><br />
Table 13-2: Phase 1: Locked Cycle Test Results – Revised Conditions ................................... 144<br />
Table 13-3: Phase 1: Locked Cycle Test Results – Constancia Project Conditions ................... 144<br />
Table 13-4: Phase 1: Rougher Variability Testing Results ........................................................ 146<br />
Table 13-5: Phase 1: Mineralogical analysis (Mineral Mass %)................................................ 147<br />
Table 13-6: Locked Cycle Test Conditions ............................................................................... 150<br />
Table 13-7: Phase 2: Locked Cycle Test Results ..................................................................... 151<br />
Table 13-8: Phase 2: Rougher Variability Testing Results ........................................................ 152<br />
Table 14-1: Summary of Drill hole Names ............................................................................... 158<br />
Table 14-2: Comparison of Composite Lengths by Lithology Type ........................................... 159<br />
Page | xi
Table 14-3: Comparison of Composites Lengths by Mineralization Type Zone ......................... 160<br />
Table 14-4: Composite Fields .................................................................................................. 161<br />
Table 14-5: Block Model Setup in MineSight® --- Extent .......................................................... 162<br />
Table 14-6: Summary of Lithology Group Coding .................................................................... 162<br />
Table 14-7: Comparison of Composites by As Logged Lithology Types (length ≥3.75 m) ......... 164<br />
Table 14-8: Lithology Code Back-tagging and As Logged Statistics (7.5 M Composites) .......... 165<br />
Table 14-9: Original mineralization type zone codes ................................................................ 167<br />
Table 14-10: Sequential Copper Range for Domaining ............................................................ 168<br />
Table 14-11: Summary of Mineralization Zone Group Coding .................................................. 168<br />
Table 14-12: Comparison of Composites by AsLogged Mineralization Type Zone .................... 169<br />
Table 14-13: Mineralization Back-tagging and As Logged Statistics (7.5 M Composites) .......... 170<br />
Table 14-14: Bulk Density by Lithology .................................................................................... 172<br />
Table 14-15: List of Elements for EDA ..................................................................................... 172<br />
Table 14-16: Summary of Composites by Lithology ................................................................. 175<br />
Table 14-17: Capping and Outlier Restriction Threshold and Range ........................................ 179<br />
Table 14-18: Summary of Interpolation Plan for Copper .......................................................... 181<br />
Table 14-19: Comparison between Average Cu Grade of Composite and Validation Set Block<br />
Model Estimate ....................................................................................................................... 184<br />
Table 14-20: BDV and CF for Measured and Indicated Blocks................................................. 186<br />
Table 14-21: Average Cu Grade Above Cut-off Validation Set –CUIDU Estimate ..................... 187<br />
Table 14-22: Quantity of Metal Removed in the Validation Blocks ............................................ 190<br />
Table 14-23: Results of Confidence Limits Calculations ........................................................... 192<br />
Table 14-24: Economic Parameters for Mineral Resource Pit Shell ......................................... 194<br />
Table 14-25: Mineral Resources with EffectiveDate23 August, 2011 ........................................ 195<br />
Table 14-26: Overranges for main element.............................................................................. 196<br />
Table 14-27: Block Model Limits and Size (PSAD56 UTM Zone 19S) ...................................... 198<br />
Table 14-28: Lithological Unit Description Domain ................................................................... 198<br />
Table 14-29: Summary of Measured SG Values ...................................................................... 200<br />
Table 14-30: Range of Assay Values (Uncapped) by Unit ........................................................ 201<br />
Table 14-31: Variography Parameters for Copper.................................................................... 203<br />
Table 14-32: Parameters of Ellipse Rotation............................................................................ 204<br />
Table 14-33: Search Parameters for Skarn by Pass ................................................................ 204<br />
Table 14-34: Mineral Resource by Ordinary Kriging (Cut-off 0.2% Cu) ..................................... 205<br />
Table 14-35: Mineral Resource by Inverse Distance Squared (Cut-off 0.2% Cu) ...................... 205<br />
Table 14-36: Mineral Resource by Inverse Distance Cubed (Cut-off 0.2% Cu) ......................... 205<br />
Table 14-37: Mineral Classification Resource........................................................................... 208<br />
Table 14-38: Mineral Resources by Ordinary Kriging (Cut-off 0.2% Cu)- effective April 2, 2012<br />
209<br />
Table 15-1: NSR Parameters .................................................................................................. 212<br />
Page | xii
Table 15-2: NSR Parameters .................................................................................................. 216<br />
Table 15-3: Constancia Pit Design Parameters ....................................................................... 219<br />
Table 15-4: Constancia Pit Slope Guidance ............................................................................ 219<br />
Table 15-5: Pampacancha Pit Design Parameters................................................................... 220<br />
Table 15-6: Pampacancha Pit Slope Guidance........................................................................ 221<br />
Table 15-7: Constancia and Pampacancha Mineral Reserves ................................................. 222<br />
Table 15-8: Constancia and Pampacancha Remaining Resources, Exclusive of Reserves ...... 222<br />
Table 15-9: Breakdown of Constancia and Pampacancha Reserves by Material Type ............. 223<br />
Table 16-1: Constancia Pit Design Parameters ....................................................................... 228<br />
Table 16-2: Constancia Slope Guidance ................................................................................. 229<br />
Table 16-3: Pampacancha Pit Design Parameters................................................................... 231<br />
Table 16-4: Pampacancha Slope Guidance............................................................................. 232<br />
Table 16-5: Constancia Pit Design Parameters ....................................................................... 234<br />
Table 16-6: Constancia Pit Slope Guidance ............................................................................ 234<br />
Table 16-7: Pampacancha Pit Design Parameters................................................................... 235<br />
Table 16-8: Pampacancha Pit Slope Guidance........................................................................ 235<br />
Table 16-9: Constancia Breakdown of Phases ........................................................................ 239<br />
Table 16-10: Pampacancha Phase ......................................................................................... 240<br />
Table 16-11: Mill Ramp Up Schedule ...................................................................................... 241<br />
Table 16-12: Tonnage Formulas .............................................................................................. 242<br />
Table 16-13: Mine Production Schedule .................................................................................. 244<br />
Table 16-14: WRF Design Parameters .................................................................................... 246<br />
Table 16-15: Total Mine Fleet Requirement ............................................................................. 248<br />
Table 16-16: Mine Fleet Requirement ..................................................................................... 249<br />
Table 16-17: Primary Drilling Parameters - SKL ...................................................................... 252<br />
Table 16-18: Secondary Drilling Parameters – Roc L8............................................................. 252<br />
Table 16-19: Blast Patterns, Production and Pre-Split ............................................................. 253<br />
Table 16-20: Loading Parameters, Shovel Hitachi EX 5600-6 .................................................. 254<br />
Table 16-21: Loading Parameters, Loader CAT 994H .............................................................. 254<br />
Table 16-22: Hauling Parameters, Loader CAT 994H and Haul Roads .................................... 255<br />
Table 17-1: Key Process Design Criteria ................................................................................. 258<br />
Table 17-2: Nominal Operating Parameters............................................................................. 272<br />
Table 19-1: Copper Concentrate Composition ......................................................................... 286<br />
Table 19-2: Price Forecast ...................................................................................................... 287<br />
Table 19-3: Summary of Contracts .......................................................................................... 288<br />
Table 21-1: Capital Costs ........................................................................................................ 301<br />
Table 21-2: Operating Costs ................................................................................................... 302<br />
Table 22-1: Economic Model Results ...................................................................................... 303<br />
Table 22-2: Cash Flow by Year ............................................................................................... 306<br />
Page | xiii
Table 22-3: Metal and exchange rate assumptions .................................................................. 309<br />
Table 22-4: Metallurgical Recovery Assumptions ..................................................................... 310<br />
Table 22-5: Smelting and Refining Cost Assumptions .............................................................. 310<br />
Table 22-6: Life of Mine Production Summary ......................................................................... 312<br />
Table 22-7: Life of Mine Concentrate Production Summary ..................................................... 313<br />
Table 22-8: Base case commodity price and exchange rate ................................................... 315<br />
Table 22-9: SMT Marginal Tax Rate and Effective Tax ............................................................. 316<br />
Table 22-10: MR Marginal Tax Rate and Effective Tax ............................................................. 317<br />
Page | xiv
List of Figures<br />
Figure 1-1: Location of the Constancia Project .......................................................................... 17<br />
Figure 1-2: Constancia Project- Main Facilities.......................................................................... 31<br />
Figure 1-3: Constancia Geotech Zones ..................................................................................... 33<br />
Figure 1-4: Pampacancha Geotech Zones ................................................................................ 34<br />
Figure 1-5: Overall site layout ................................................................................................... 40<br />
Figure 4-1: Project Location ...................................................................................................... 55<br />
Figure 4-2: Concession Boundaries .......................................................................................... 58<br />
Figure 5-1: Location of the Constancia Project .......................................................................... 68<br />
Figure 7-1: Simplified Geology of the Andahuaylas-Yauri Area .................................................. 76<br />
Figure 7-2: Geological Map of the Constancia Deposit .............................................................. 77<br />
Figure 7-3: Pampacancha Sectors ............................................................................................ 84<br />
Figure 9-1: Constancia Exploration Program ............................................................................. 88<br />
Figure 9-2: Pampacancha Geology Map ................................................................................... 91<br />
Figure 9-3: Pampacancha Prospect – Magnetic Halo Area ....................................................... 92<br />
Figure 9-4: Pampacancha Prospect – Limestone Replacement Area........................................ 94<br />
Figure 9-5: Chilloroya South – Geological Map and Drilling Layout ............................................ 95<br />
Figure 9-6: Chilloroya South – Target 3 ..................................................................................... 98<br />
Figure 9-7: Chilloroya South – Skarn Target .............................................................................. 99<br />
Figure 12-1: Cu in Twin Samples ............................................................................................. 117<br />
Figure 12-2: Cu in Check Samples - ACME vs. ALS ................................................................ 127<br />
Figure 12-3: Cu in Check Samples - Inspectorate vs. Inspectorate .......................................... 128<br />
Figure 12-4: Core Recovery .................................................................................................... 129<br />
Figure 12-5: Core Recovery Distribution in Mineralised Samples............................................. 129<br />
Figure 12-6: Reference Materials for Pampacancha Drilling – Copper Standard-010 ............... 131<br />
Figure 12-7: Reference Materials for Pampacancha Drilling – Copper Standard-020 ............... 131<br />
Figure 12-8: Reference Materials for Pampacancha Drilling – Copper Standard-020 ............... 132<br />
Figure 12-9: Reference Materials for Pampacancha Drilling – Gold Standard-010 ................... 132<br />
Figure 12-10: Reference Materials for Pampacancha Drilling – Gold Standard-020 ................. 133<br />
Figure 12-11: Reference Materials for Pampacancha Drilling – Gold Standard-030 ................. 133<br />
Figure 12-12: Comparison of Original Assay and Duplicate Analysis by Copper ....................... 134<br />
Figure 12-13: Comparison of Original Assay and Duplicate Analysis by Gold ........................... 135<br />
Figure 12-14: Comparison of Original Assay and Duplicate Analysis by Silver .......................... 135<br />
Figure 12-15: Comparison of Original Assay and Duplicate Analysis by Zinc ............................ 136<br />
Figure 12-16: Comparison of Original Assay and Duplicate Analysis by Molybdenum ............... 137<br />
Figure 14-1: Constancia Compilation Geology Map ................................................................. 159<br />
Figure 14-2: Mineralization Zones EW Section ........................................................................ 166<br />
Figure 14-3: Histogram and Probability Plot for All 7.5 m Copper Composites .......................... 174<br />
Page | xv
Figure 14-4: Lithology Domain Box Plot .................................................................................. 177<br />
Figure 14-5: Mineralization Type Zones Box Plot ..................................................................... 177<br />
Figure 14-6: Copper Blocks Grades – Bench 4260 .................................................................. 183<br />
Figure 14-7: Copper Block Grades – EW Section 8399850 ..................................................... 183<br />
Figure 14-8: MP1 Swath Plot for Copper Model ...................................................................... 185<br />
Figure 14-9: Contact Profile for DOMCU5 and DOMCU7 ......................................................... 186<br />
Figure 14-10: Herco DOMCU7 – Cu Ordinary Kriging Estimate ............................................... 189<br />
Figure 14-11: Isolated Indicated block within of Measured Blocks - Bench 4260 ...................... 193<br />
Figure 14-12: Measured and Indicated Boundaries on a Bench by Bench Basis ...................... 193<br />
Figure 14-13: Constancia Mineral Resource Pit Shell (MII)...................................................... 194<br />
Figure 14-14: Pampacancha Compilation Geology Map .......................................................... 197<br />
Figure 14-15: 3D View of the Geological Model of Pampacancha Project ................................. 199<br />
Figure 14-16: East-West Section 8,397,055 m N ..................................................................... 206<br />
Figure 14-17: Elevation Swath Plots ....................................................................................... 207<br />
Figure 14-18: Easting Swath Plots .......................................................................................... 207<br />
Figure 14-19: Plan View at 4532.5 m Elevation ........................................................................ 208<br />
Figure 14-20: Section View 8,397,055 m N ............................................................................. 209<br />
Figure 15-1: Constancia Whittle results ................................................................................... 217<br />
Figure 15-2: Pampacancha Whittle results .............................................................................. 218<br />
Figure 15-3: Constancia Ultimate Pit – Plan View.................................................................... 220<br />
Figure 15-4: Pampacancha Ultimate Pit – Plan View ............................................................... 221<br />
Figure 16-1: Constancia Project – Main Facilities .................................................................... 226<br />
Figure 16-2: Constancia Geotech Zones ................................................................................. 229<br />
Figure 16-3: Pampacancha Geotech Zones ............................................................................ 232<br />
Figure 16-4: Plan View Constancia Pit Phases ........................................................................ 236<br />
Figure 16-5: Section AA´ View Constancia Pit Phases ............................................................ 237<br />
Figure 16-6: Constancia Phases 1- 6 ...................................................................................... 238<br />
Figure 16-7: Plan View Constancia Pit Phases ........................................................................ 239<br />
Figure 16-8: Mine Production Schedule .................................................................................. 2<strong>43</strong><br />
Figure 16-9: Mine Production Schedule by Ore Type............................................................... 2<strong>43</strong><br />
Figure 16-10: Mine Components ............................................................................................. 245<br />
Figure 17-1: Site Layout ......................................................................................................... 257<br />
Figure 17-2: 3D view of the concentrator ................................................................................. 259<br />
Figure 17-3: Process flow diagram .......................................................................................... 260<br />
Figure 17-4: Processing Plant Layout ..................................................................................... 261<br />
Figure 17-5: Primary Crusher Isometric View .......................................................................... 263<br />
Figure 17-6: Coarse Ore Stockpile Isometric View .................................................................. 264<br />
Figure 17-7: Grinding circuit isometric view ............................................................................. 265<br />
Figure 17-8: Cu-Mo flotation circuit isometric view................................................................... 267<br />
Page | xvi
Figure 17-9: Cu-Mo separation circuit isometric view .............................................................. 269<br />
Figure 17-10: Cu concentrate thickening and filtration area isometric view .............................. 270<br />
Figure 18-1: Overall site layout ............................................................................................... 275<br />
Figure 18-2: Road Map. .......................................................................................................... 283<br />
Figure 18-3: Matarani Port Aerial View .................................................................................... 284<br />
Figure 22-1: Gross Revenue by Metal ..................................................................................... 305<br />
Figure 22-2: NPV Sensitivity ................................................................................................... 314<br />
Page | xvii
1.0 SUMMARY<br />
1.1 SUMMARY<br />
The information that follows provides an executive summary of important information contained in this<br />
<strong>Technical</strong> <strong>Report</strong>.<br />
1.2 INTRODUCTION<br />
The authors have prepared this <strong>Technical</strong> <strong>Report</strong> for HudBay <strong>Minerals</strong> Inc. (“<strong>Hudbay</strong>”) in respect of its<br />
Constancia Project located in southern Peru. <strong>Hudbay</strong>’s board of directors approved a US$1.5 billion<br />
investment to fund the development and construction of the Constancia Project on August 8, 2012.<br />
<strong>Hudbay</strong> acquired the Constancia Project in March 2011 through its acquisition of all of the outstanding<br />
shares of Norsemont Mining Inc. (“Norsemont”). <strong>Hudbay</strong> owns a 100% interest in the 36 mining<br />
concessions that comprise the Constancia Project, all of which are duly registered in the name of<br />
<strong>Hudbay</strong>’s wholly-owned subsidiary, HudBay Peru S.A.C. (“<strong>Hudbay</strong> Peru”); <strong>Hudbay</strong> Peru also has the<br />
required surface rights to develop the Constancia Project. This <strong>Technical</strong> <strong>Report</strong> represents the first<br />
technical report filed by <strong>Hudbay</strong> since its acquisition of Norsemont and updates Norsemont’s Feasibility<br />
Study Optimization dated February 21, 2011.<br />
This <strong>Technical</strong> <strong>Report</strong> provides current estimates of the mineral reserves and mineral resources at the<br />
Constancia Project (which now includes the Constancia and Pampacancha deposits) and describes the<br />
current state of metallurgical testing and the latest mine plan. The information presented in this <strong>Technical</strong><br />
<strong>Report</strong> relating to the Constancia deposit, including the estimates of mineral reserves and resources<br />
therein, is the result of “feasibility study” level work; and, the information presented in this <strong>Technical</strong><br />
<strong>Report</strong> relating to the Pampacancha deposit, including the estimates of mineral reserves and resources<br />
therein, is the result of “pre-feasibility study” level work. This <strong>Technical</strong> <strong>Report</strong> conforms to the CIM<br />
Definition Standards on Mineral Resources and Mineral Reserves referred to in <strong>National</strong> <strong>Instrument</strong> <strong>43</strong>-<br />
<strong>101</strong> – Standards of Disclosure for Mineral Projects (“NI <strong>43</strong>-<strong>101</strong>”).<br />
The qualified persons (each, a “QP”) who supervised the preparation of this <strong>Technical</strong> <strong>Report</strong> are:<br />
- Cashel Meagher, P. Geo., Vice President, South America Business Unit, <strong>Hudbay</strong>; and<br />
- Michael Humphries, P. Eng., Director, Engineering Studies, <strong>Hudbay</strong>.<br />
As <strong>Hudbay</strong> is a “producing issuer”, as defined in NI <strong>43</strong>-<strong>101</strong>, this <strong>Technical</strong> <strong>Report</strong> is not required to be<br />
prepared by or under the supervisions of an independent qualified person.<br />
1.3 RELIANCE ON OTHER EXPERTS<br />
The information, conclusions, opinions, and estimates contained herein are based on:<br />
• Information available to <strong>Hudbay</strong> at the time of preparation of this report,<br />
• Assumptions, conditions, and qualifications as set forth in this report<br />
The authors have relied on tax information provided by <strong>Hudbay</strong> tax department, Social and Environmental<br />
information as provided by appropriate Peru based personnel from <strong>Hudbay</strong>, marketing information from<br />
<strong>Hudbay</strong>’s marketing group and Forward price forecasts from <strong>Hudbay</strong>’s treasury department<br />
Page | 15
1.4 PROPERTY DESCRIPTION AND LOCATION<br />
The Constancia Project is located approximately 600km southeast of Lima in the south-eastern Andes of<br />
Peru, in the Chamaca, Livitaca and Velille districts, province of Chumbivilcas, department of Cusco, at<br />
approximately longitude 71°47´ and latitude 14°27´ south.<br />
It is accessible from Lima by air, via either Arequipa or Cusco, and then by vehicle over paved and gravel<br />
roads. The routes with approximate distances and driving times are shown in Table 1-1.<br />
<strong>Hudbay</strong> owns a 100% interest in the property, which consists in 36 metallic mining concessions, all of<br />
them dully granted by the Peruvian State and recorded at <strong>Hudbay</strong> Peru S.A.C’s name.<br />
1.5 ACCESSIBILITY, CLIMATE, LOCAL RESOURCES, INFRASTRUCTURE AND<br />
PHYSIOGRAPHY<br />
As described in Table 1-1 and shown in Figure 1-1, the Constancia Project is approximately 80km from<br />
Yauri by road. The road to Yauri (in the general vicinity of Xstrata’s Tintaya and Antapaccay mines) is<br />
expected to be upgraded in time to meet the construction and life of mine transportation requirements of<br />
the Constancia Project. From Yauri, the road system is currently used by traffic supplying mines in the<br />
area. It is routed through the Arequipa area to the port at Matarani (approximately 460km from<br />
Constancia) which is currently used to ship copper concentrates from other mines in southern Peru.<br />
The main economic activity in the area is subsistence agriculture and cattle farming. Food and basic<br />
supplies can be obtained in Yauri/Espinar (population 23,000 people). Cusco (population 350,000 people)<br />
and Arequipa (population 650,000 people) are the nearest major centres, 6 and 7 hours drive from the<br />
Project, respectively.<br />
In this part of Peru, there are two main seasons: one dry and cold from April to September with<br />
temperatures ranging from 16ºC to –11ºC, and the other wet with slightly higher temperatures from<br />
October to March. Annual rainfall for Cusco to the north of the Constancia Project averages 815 mm, but<br />
by contrast, Arequipa, a similar distance to the south of Constancia averages only 100 mm of rainfall per<br />
year. Several permanently flowing streams supply good flows in the area surrounding the Constancia<br />
Project and there are also more significant water sources, including the Apurimac and Chilloroya rivers.<br />
Exploration is possible throughout the year.<br />
The Katanga-Constancia district has moderate relief with shallow glacial valleys and low rolling<br />
(400-500 m) hills. Two erosion surfaces can be distinguished: an older one overlain by the Tacaza<br />
volcanics, and a younger surface that forms the present landscape. This erosion surface has incipient<br />
dendritic drainage indicating the beginning of a more intense erosion cycle. The geomorphology of the<br />
area suggests that the porphyry intrusives were exposed to an extensive period of weathering associated<br />
with an unusually deep oxidation profile compared to other porphyry deposits in the vicinity of similar age.<br />
There are abundant indications of glacial activity corresponding to the last glaciation period. This glacial<br />
erosion formed the present U-shaped valleys and resulted in the deposition of abundant moraines<br />
of up to tens of meters in thickness. Holocene glacial deposits are located on the margins of U-shaped<br />
valleys as lateral moraines, or in the centre of the drainage as terminal moraines. Recent alluvial<br />
deposits are not common, and are located only at the margins of the larger rivers.<br />
Page | 16
Figure 1-1: Location of the Constancia Project
Table 1-1: Approximate Distances and Driving Times to Constancia<br />
From Leg Distance (km) Time (hours)<br />
Arequipa Canahuasi 80 1.25<br />
Imata 63 0.75<br />
Yauri/Espinar 103 2.50<br />
Uchuccarco turnoff 68 2.00<br />
Project Site<br />
20 0.50<br />
Total 334 7.00<br />
Cusco Sicuani (paved road) 140 1.25<br />
El Descanso 40 0.75<br />
Yauri/Espinar 45 2.50<br />
Uchuccarco turnoff 68 2.00<br />
Project Site 20 0.50<br />
Total 313 6.25<br />
1.6 HISTORY<br />
• Copper and gold were exploited at the Katanga mine from early last century to the early 1990s.<br />
Katanga was the main mine in the area, located approximately 3 km northwest of Constancia,<br />
outside the <strong>Hudbay</strong> property boundaries.<br />
• Mitsui and Minera Katanga operated the Katanga mine at different times between the late 1970s<br />
and early 1990s.<br />
• The San José prospect (now part of the Constancia prospect) was explored by Mitsui during the<br />
1980s with a focus on locating more high-grade ore to add to the nearby Katanga mine operation.<br />
• In 1995, reconnaissance prospecting identified evidence for porphyry-style mineralisation exposed<br />
over an area of 1.4 km x 0.7 km, open in several directions, with some Cu enrichment below a<br />
widespread leach cap developed in both porphyry and skarn.<br />
• In May 2003, the area was revisited by Rio Tinto and it entered into agreements with Mitsui, Minera<br />
Livitaca and Mineral Katanga to acquire an interest in the property, including a Joint Venture (JV)<br />
option between Rio Tinto and Mitsui, and Purchase Option Agreements with Minera Livitaca and<br />
Minera Katanga. Rio Tinto commenced exploration in December 2003.<br />
• Rio Tinto’s exploration activities consisted of geological mapping, soil and rock chip sampling, and<br />
surface geophysics (magnetics and IP).<br />
Page | 18
• Norsemont entered into negotiations with Rio Tinto and these negotiations led to an agreement in<br />
early 2005. The first Norsemont geologists visited the property in June of 2005.<br />
• By 2009, Norsemont had entered into a transfer agreement with Mitsui (November 2007) for the<br />
purchase of their 30% interest in the Constancia project and had exercised the final option with Rio<br />
Tinto to acquire the remaining 19% interest in Constancia during 2008 providing Norsemont with<br />
100% ownership of the Constancia Project.<br />
• In March 2011, <strong>Hudbay</strong> acquired a 100% interest in the Constancia Project through its acquisition<br />
of all of the outstanding shares of Norsemont by way of a formal take-over bid.<br />
• Following its acquisition of the Constancia Project, <strong>Hudbay</strong>’s exploration activities focused on<br />
delineating the Pampacancha deposit.<br />
• By July 2012, a total of 197,621.85 meters had been drilled at the Constancia Project, including the<br />
Pampacancha deposit.<br />
• In August 2012, <strong>Hudbay</strong> entered into a silver purchase agreement with Silver Wheaton (Caymans)<br />
Ltd., pursuant to which it will receive US$295 million in upfront deposit payments (and ongoing<br />
cash payments, in respect of delivered silver, equal to the lesser of the market price and US5.90 /<br />
oz. of silver) against delivery of 100% of the silver production from the Constancia Project.<br />
1.7 GEOLOGICAL SETTING AND MINERALIZATION<br />
1.7.1 CONSTANCIA<br />
The Constancia deposit is a porphyry copper-molybdenum system which includes copper-bearing skarn<br />
mineralisation. Multiple phases of monzonite and monzonite porphyry have intruded a sequence of<br />
sandstones, mudstones and micritic limestone of Cretaceous age.<br />
The majority of the mineralisation is associated with potassic alteration and quartz veining, occurring as<br />
chalcopyrite-(bornite)-molybdenite-pyrite mineralisation in “A” and “B” type veinlets, and also replacing<br />
ferromagnesian minerals or filling fractures. Copper grades typically vary from 0.2% up to 4%, and are<br />
highest where fracture-filling style copper mineralisation is superimposed on earlier disseminated copper<br />
mineralisation. The high-grade hypogene copper mineralisation is hosted by a dense A-veinlet stockwork<br />
developed in an early porphyry phase. Pyrite/chalcopyrite ratio is typically low, being in the order of 1:1 to<br />
2:1. Molybdenite commonly increases with depth, related to “B” veinlets. Bornite occurs sporadically<br />
especially at deeper levels, sometimes associated with some gold values.<br />
Propylitic alteration is peripheral to the potassic alteration and extends more than one kilometre from the<br />
porphyry intrusive contacts. The propylitic alteration mineral assemblage includes epidote-chlorite-calcitepyrite-rhodochrosite.<br />
Subordinate chalcopyrite is also present, filling fractures or replacing mafic<br />
minerals. Sphalerite-galena veinlets and veins are distributed as a halo to the copper-molybdenum<br />
mineralisation within the propylitic alteration halo, occurring at distances of up to 3 km away from the<br />
porphyry copper system.<br />
Phyllic alteration forms a pervasive carapace surrounding and sometimes overprinting potassic alteration.<br />
The phyllic alteration accompanies almost complete destruction of primary rock textures; the mineral<br />
assemblage includes sericite-quartz-pyrite, limited amounts of chalcopyrite and associated occasional “D”<br />
veins and veinlets.<br />
At the contact between the intrusives and limestones, magnetite ± garnet skarn develops, while a<br />
pyroxene–diopside (garnet–epidote) association is more common in calcareous sandstones and arkoses<br />
of the Chilloroya formation. Skarn mineralisation is volumetrically much smaller, but grades are normally<br />
higher.<br />
Page | 19
Structural deformation has played a significant role in preparing and localising the hydrothermal alteration<br />
and copper-molybdenum-silver-gold mineralisation, including skarn formation. Major inter and postmineral<br />
fracture systems in the deposit area strike northeast, and include the Barite fault system. This is<br />
represented by a number of nearly parallel vein-faults carrying base metal sulphides and barite, which<br />
have been exploited by artisanal workings throughout the property. A second important system strikes<br />
north-south. It appears to be more recent than the Barite system, and controls part of the San José Pit<br />
mineralisation and most of the silicified breccias (sometimes mineralised) in the system. This is the same<br />
direction as that of the post-mineral dykes, and may have originated as tension gashes to the Barite<br />
direction.<br />
1.7.2 PAMPACANCHA<br />
The Pampacancha deposit is a porphyry related Skarn system, Oligocene unmineralised basement<br />
diorite is intruded by the diorite porphyry cited as the source for skarn mineralisation which in turn is cut<br />
by intra-mineral monzonite intrusions which provide minor local increases in Cu-Au and also locally stope<br />
out skarn Cu-Au mineralisation which is best developed at the upper and lower margins of the limestone<br />
body. Prograde magnetite-chalcopyrite-pyrite skarn grades to marginal less well mineralised garnet and<br />
pyroxene skarn which are locally overprinted by epidote-bearing retrograde skarn.<br />
Epithermal mineralisation of the low sulphidation quartz-sulphide Au + Cu style, accounts for common<br />
supergene enriched Au anomalies, and along with other features such as hydrothermal alteration and<br />
veins typical of near porphyry settings.<br />
1.8 DEPOSIT TYPES<br />
The Constancia deposit is a porphyry Cu-Mo-Ag system which includes copper-bearing skarn<br />
mineralisation. This type of mineralisation is common in the Yauri-Andahuaylas metallogenic belt where<br />
several porphyry Cu-Mo-Au prospects have been described but not exploited.<br />
Two individual porphyry-style deposits, Constancia and San José, are known within the project area and<br />
separated by approximately 350 m. The total mineralised zone extends about 1200 m in the north-south<br />
direction and 800 m in the east-west direction. Mineralisation occurs to surface at San José, but is<br />
deeper at Constancia. Glacial moraines cover the northern and eastern margins of the Constancia<br />
deposit; to the east these moraines cover potentially important extensions of copper mineralisation along<br />
broad east-west structural zones.<br />
The Pampacancha deposit is a porphyry related skarn system, with copper-bearing skarn mineralization,<br />
This type of mineralisation is common in the Yauri-Andahuaylas metallogenic belt where several skarn<br />
deposits have been developed, Corocohuayco in the Tintaya District and Las Bambas being the best<br />
examples.<br />
1.9 EXPLORATION<br />
Exploration is currently ongoing in the project area and is focused on the areas/targets described below:<br />
• Surface mapping and sampling<br />
o<br />
Through the years 2007 to 2011, 11,444 hectares were mapped in the Constancia project at<br />
several scales, including 1:1,000, 1:2,000 and 1:5,000. Of this, 8,905 hectares were mapped on<br />
<strong>Hudbay</strong>’s mining concessions, which represent 39% of <strong>Hudbay</strong>’s mining rights in the area.<br />
Additionally, 2,595 rock samples and 41 stream sediments samples were collected during this<br />
period.<br />
Page | 20
• Geophysic<br />
o<br />
o<br />
An in-house interpretation of the geophysical data along with interpretation of available surface<br />
mapping and rock and stream sediment geochemistry helped identify several targets within the<br />
project area. The most important ones are the anomalies associated with the Pampacancha<br />
deposit, the chargeability-magnetic anomalies observed in the Chilloroya South prospect and the<br />
chargeability anomalies located in Uchuccarco, at 3.8 km northeast of the Constancia porphyry.<br />
A Titan-24 DC-IP-MT survey was completed in July 2011 to the south of the Constancia deposit.<br />
• Exploration targets and drilling<br />
o<br />
o<br />
o<br />
Several targets have been identified in the Constancia area, including the Chilloroya South and<br />
Pampacancha prospects, both of which are scheduled to be drilled as part of the 2012<br />
exploration program.<br />
Pampacancha: The Pampacancha prospect is located approximately 3 kilometres SE of the<br />
Constancia porphyry. The prospect was identified in May 2008 after a stream sediment survey<br />
revealed a 27 sq-km, Au-Ag-Cu anomalous area, which was subsequently corroborated by<br />
mapping and rock sampling conducted on the area. Exploratory drilling at Pampacancha started<br />
in August 2008 and is ongoing (totalling 19,653.50 metres as at December 31, 2011). Drilling has<br />
been carried out at the “main body”, “magnetic halo” and “limestone replacement” target areas.<br />
Chilloroya South: This area is located 5 km south of the Constancia porphyry. Evidence of<br />
porphyry-related Cu-Au-Mo mineralisation and Cu-Au and Au-only bearing skarns occur in an<br />
area of about 3.5 km by 3.5 km coincident with several composite chargeability and magnetic<br />
anomalies at depth. Five primary targets were identified and preliminarily drill-tested from June<br />
2010 to January 2011 (totalling 12,028.55 metres distributed in 35 holes). In July 2011, a Titan-24<br />
DC-IP-MT survey was completed for mapping the resistivity and chargeability of the subsurface to<br />
significant depths, assisting geological interpretations and identified target at depth.<br />
1.10 DRILLING<br />
As of 31 July 2012, a total of 197,621.35 m (785 holes) have been drilled at the Constancia Project (this<br />
includes 7,484.15 m drilled by Rio Tinto prior to 2005), in six drilling programs (infill, condemnation,<br />
metallurgical, geotechnical, hydrogeological and exploration). Drilling has been comprised of both<br />
diamond drilling (core recovery) and reverse circulation (chip recovery), with diamond drilling representing<br />
90% of the total metreage.<br />
General characteristics of the drilling programs carried out at the Constancia Project are described below:<br />
• Constancia Infill Drilling (prefix CO): started prior to 2005 with the holes drilled by Rio Tinto and<br />
ended after December 2008, one hole was drilled in 2011 at west of San Jose Pit in a Titan<br />
anomaly area, totalling 110,383.00 m distributed in 321 holes (including 7,484.15 m, 24 holes,<br />
drilled by Rio Tinto). All the metreage was diamond drilling.<br />
• Constancia Condemnation Drilling (CC-CR): Reverse Circulation (CR) started in May 2008 and<br />
ended in September 2008. Drilling was carried out at the surroundings of the pit outline and<br />
sterilization of the plant facility locations, including the testing of some chargeability anomalies<br />
south of the Constancia pit outline; drilling totalled 8,751.70 m in 54 holes. Diamond Drill<br />
condemnation holes (CC) were drilled in 2011-2012 carried out at Tailing Management Facilities,<br />
Waste Dump and Plant Site Facilities, drilling totalled 5,729.10 m in 21 holes.<br />
• Constancia Metallurgical Drilling (CM): started in September 2008 and completed by mid-<br />
November 2008, twenty-one holes were drilled with PQ line totalling 3,380.75 m. allowed the<br />
collection of approximately 35 t of samples for metallurgical tests conducted in Chile. From August-<br />
September 2010, two more holes was drilled for zinc metallurgical testing, was drilled 691.45 m in<br />
two holes.<br />
Page | 21
• Constancia Geotechnical Drilling (CG): from May 2008 to July 2012 drilling was completed in the<br />
surroundings of the pit, the waste dump, tailing management facilities, camp site, haul rock and<br />
other facilities, totalling 10,903.70 m in 154 holes.<br />
• Constancia Hydrogeological Drilling (CH): from January 2009 to June 2012 3,816.45 m was drilled<br />
in 27 holes. Drilling was completed in the waste dump and TMF facility areas, and 9 large diameter<br />
holes (water holes) were completed along the Chilloroya River and at the Constancia pit.<br />
• Pampacancha Exploration-Infill Drilling (PO, PR): started in August 2008, exploration drilling<br />
continues at this time. A total of 144 holes were drilled, 28 being RC (7,090 m) and 116 core<br />
drilling (33,336.90 m) totalling 40,426.90 m.<br />
• Pampacancha Geotechnical Drilling (PG): from May to June 2012, three holes were drilled for the<br />
pre-feasibility study of the Pampacancha deposit, totalling 726.80 m. These holes had two<br />
purposes: geotechnical and hydrogeological.<br />
• Chilloroya South Exploration (SO, SR): started in June 2010, exploration drilling was carried out at<br />
five targets. A total of 35 holes were drilled, 14 being RC (4,142 m) and 21 core drilling (7,886.55<br />
m) totalling 12,028.55 m.<br />
• Uchuccarco Exploration (UO): in January 2010 three diamond drill holes were drilled in a zone of<br />
magnetic anomaly totalling 783.45m.<br />
1.11 SAMPLE PREPARATION, ANALYSES, AND SECURITY<br />
Sample preparation, analysis and security procedures were reviewed from the campaigns conducted on<br />
the Constancia project through the documentation available in this and 2005, 2006, 2007 and 2009 and<br />
<strong>Technical</strong> <strong>Report</strong>s.<br />
1.11.1 CONSTANCIA<br />
• Bulk Density: A total of 1,247 density measurements have been made for 145 drill cores from the<br />
Constancia - San José area. The bulk density measurements were conducted by ALS Chemex<br />
with paraffin wax coat method.<br />
• Sample Preparation and Assaying: Sample preparation and assaying for Norsemont was carried<br />
out by ALS Chemex in Peru until June 2008, after which SGS del Peru continued with this work<br />
with similar procedures.<br />
• Database Integrity: The database integrity procedures described in the previously filed technical<br />
reports were reviewed. All lithological, alteration, geotechnical and mineralization data is logged on<br />
paper logs that are later entered in spreadsheets from where they are imported into the database.<br />
1.11.2 PAMPACANCHA<br />
• Bulk Density: A total of 56 density measurements were taken from actual core for the<br />
Pampacancha project. As with Constancia, the analysis was conducted by ALS Chemex.<br />
• Sample Preparation: All samples were sent to SGS del Peru S.A.C. (SGS) for preparation and<br />
assaying. The laboratory conforms to ISO/IEC 17025 and ISO 9002 standards.<br />
• Assay Methodology: All samples were analyzed by SGS laboratory through Inductively Coupled<br />
Plasma – Atomic Emission Spectrometry (ICP-AES) after multi-acid digestion and gold was<br />
determined by fire assay with Atomic Absorption Spectroscopy (AAS).<br />
• Blanks, Standards and Duplicates: During the drilling, blanks were inserted into the sample stream<br />
as per geologist instruction at approximate intervals of every 30 samples. Standard references<br />
were prepared with material obtained from the Pampacancha deposit by <strong>Hudbay</strong> and were<br />
analyzed and certified by Acme labs. As part of the Pampacancha drilling, duplicates were<br />
obtained by splitting half core samples, obtaining two quarter core sub-samples, one quarter<br />
representing the original sample and the other quarter representing the duplicate sample.<br />
Page | 22
1.12 DATA VERIFICATION<br />
Data Verification was reviewed and approved by Cashel Meagher (Qualified Person pursuant NI <strong>43</strong>-<strong>101</strong>)<br />
from the campaigns conducted on the Constancia Project.<br />
1.12.1 CONSTANCIA<br />
• Norsemont QC Protocol<br />
o<br />
The Quality Control (QC) protocol during the Constancia exploration campaigns from 2006 to<br />
2010 included the insertion of the following control samples in the sample batches:<br />
• Twin samples (Core) or field duplicates (RC): one in 20 samples<br />
• CRMs: one in 20 samples; four CRMs are inserted in alternate order.<br />
• Blanks: one in 20 samples<br />
o<br />
The twin samples, field duplicates, coarse blanks and Certified Reference Materials (CRMs) are<br />
inserted on the drill site prior to submission to the laboratory.<br />
• Amec QC Evaluation<br />
o<br />
o<br />
o<br />
o<br />
Twin Samples: Twin samples are obtained by splitting half core samples, obtaining two quarter<br />
core sub-samples, one quarter representing the original sample and the other quarter<br />
representing the duplicate sample. Norsemont inserted a total of 1,952 twin samples in batches<br />
during the drill campaigns they operated between 2005 and 2011. AMEC processed these data<br />
using the hyperbolic method. The sampling procedure is considered to be acceptable if the<br />
proportion of failures (failure rate) does not exceed 10% using as failure limit the y2=m2x2+b2<br />
hyperbola evaluated for a 30% relative error1 (RE). The failure rates for Cu, Mo, Zn and Ag<br />
ranged between 7% and 16% (Table 3-7). Therefore, it was concluded that Norsemont Core<br />
sampling procedure was reasonable for Mo and Ag. However, for the frequency of twin sample<br />
failures for Cu and Zn was greater than expected, indicating sampling issues for copper and zinc,<br />
two of the most important metals in the resource model.<br />
Field Duplicates: Norsemont inserted a total of 51 field duplicates in batches from RC holes. The<br />
failure rates for Cu, Mo, Zn and Ag in samples ranged between 0% and 8%. Therefore, AMEC<br />
concluded that Norsemont RC sampling precision was reasonable for these metals.<br />
CRMs: Norsemont has used Certified Reference Materials (CRMs) prepared by SGS and ACME<br />
laboratories from coarse rejects from previous drilling campaigns at Constancia. To evaluate the<br />
accuracy of assaying using CRMs, outliers were excluded, values located outside the AV±3*SD<br />
interval (AV, SD: average value and standard deviation, respectively, calculated from the actual<br />
assay values of the inserted standards).<br />
Blanks: Coarse blanks are coarse samples of barren material, which provide information about<br />
the possible contamination during preparation; the coarse blanks should be prepared immediately<br />
after highly mineralized samples. A total of 2,119 coarse blanks were included in regular<br />
submission batches. It was concluded that the preparation process at ALS Chemex produced no<br />
significant Cu, Mo, Zn and Ag contamination in most of the blanks evaluated.<br />
o Check Samples: ACME acted as secondary laboratory for the 2006 and part of the 2007<br />
campaigns; 388 samples were submitted to ACME in 2007 for external review and control..<br />
Page | 23
• Site Visit<br />
o<br />
As part of their scope of work, AMEC Senior Geologists Waldo Arias, Rosario Basurto and<br />
Angelica Torres made a site visit to the core shack in the district of Saylla, province of Cusco from<br />
April 04th to April 08th, 2011. While on site, AMEC reviewed drill core at the core shack in order to<br />
evaluate the consistency of the core logging. Nineteen drill holes were reviewed to understand<br />
the lithology, alteration and the mineralization domains; and ten drill cores were reviewed to<br />
identify the rock quality and various geotechnical issues for the pit design.<br />
• Core Review<br />
o<br />
Average core recovery was 95.9%, with the vast majority of recoveries greater than 90%. To<br />
ensure there were no issues with recovery within mineralised zones, core recovery was also<br />
checked on a stand-alone basis in the mineralised zones; average core recovery in the<br />
mineralised zones was 96.3%, with a large majority of recoveries greater than 90%.<br />
1.12.2 PAMPACANCHA<br />
• Quality Assurance / Quality Control<br />
o<br />
o<br />
<strong>Hudbay</strong> submitted a total of 15,932 samples from 110 drill holes to SGS’s laboratory for analysis.<br />
In addition to these samples, 471 blanks, 336 reference standards and 486 duplicates were<br />
submitted.<br />
Blanks: A total of 471 blank non-mineralized quartz samples were submitted by <strong>Hudbay</strong> to test for<br />
cross-contamination from sample to sample during crushing and pulp separation.<br />
o Standards: The reference standards certified by Acmelabs were assayed by SGS. Of the 336<br />
copper standards submitted for assaying, 124 of the assays fell outside the lower standard<br />
deviation indicating possible sub-estimation of copper content.<br />
o<br />
Check Assaying: Despite having no duplicate pulps checked assayed in another laboratory, the<br />
geologist routinely inserted duplicate core samples to check the homogeneity of the<br />
mineralization and sampling precision. In total 453 duplicates were inserted, approximately every<br />
30 samples.<br />
• Site Visit<br />
o<br />
Arnaldo Zamorano, a <strong>Hudbay</strong> resource geologist from the Santiago office visited the<br />
Pampacancha deposit between November 08 to 11, 2011 to conduct a personal site inspection<br />
and become familiar with conditions on the property, observe the geology and mineralization and<br />
verify the work completed on the property as part of the mineral resource estimation and<br />
technical report process.<br />
• Core Review<br />
o<br />
Visits to the core facility at the Constancia camp site were conducted for core review and<br />
verification of mineralization.<br />
Page | 24
• Drilling Database<br />
o<br />
An internal validation of the drill hole database against the original drill logs and assay certificate<br />
information was carried out by <strong>Hudbay</strong>. The validation included 100% of the assay values from<br />
the Pampacancha drilling. No significant discrepancies existed within the database and it is<br />
believed to be accurate and suitable for mineral resource estimation.<br />
1.13 MINERAL PROCESSING AND METALLURGICAL TESTING<br />
Three phases of metallurgical process development were developed for Constancia and two phases were<br />
developed for Pampacancha. The Constancia testwork resulted in a finalized process selection of<br />
conventional SAG and ball mill grinding, rougher and cleaner flotation and copper-moly separation plant.<br />
Other processes such as thickening and filtering were tested and confirmed that Constancia ore is similar<br />
to other copper ores in the region. Zinc recovery to the copper concentrate is of concern and plant feed<br />
control will be required to adequately avoid excessive zinc grades in the copper concentrate. The<br />
molybdenum testwork was inconclusive and more work will need to be done during plant operations to<br />
achieve optimum performance. Consequently, conservatively low molybdenum concentrate grades have<br />
been assumed.<br />
Pampacancha testwork is still at the prefeasibility level, so there are still several assumptions that have<br />
been made for the Pampacancha ore recovery and throughput in the Constancia plant. More grinding,<br />
flotation and solid-liquid separation testwork for Pampacancha is planned to take it to the DFS level<br />
before it enters production.<br />
Table 1 -2 shows the recoveries that have been predicted from the plant after commissioning and ramp<br />
up once it has been optimized. These recoveries have been developed from testwork results, experience<br />
and using industry benchmarking data.<br />
Page | 25
Table 1-2: Recoveries<br />
Domain Recovery to Copper Concentrate Recovery to Moly<br />
Concentrate<br />
Cu % Zn % Pb % Au % Ag % Mo %<br />
Hypogene 90.5 30.0 41.4 60.0 72.0 55.0<br />
Supergene 88.4 80.0 41.4 60.0 90.0 55.0<br />
Mixed 88.4 30.0 41.4 60.0 90.0 55.0<br />
Skarn 84.4 30.0 41.4 60.0 52.0 55.0<br />
High Zn 84.4 30.0 41.4 60.0 52.0 55.0<br />
Pampacancha 85.0 30.0 41.0 65.0 65.0 55.0<br />
1.14 MINERAL RESOURCE ESTIMATES<br />
The mineral resource estimates contained herein pertain specifically to the Constancia and<br />
Pampacancha deposits.<br />
1.14.1 CONSTANCIA<br />
The Constancia mineral resource estimate was completed by AMEC, effective August 23, 2011, and was<br />
subsequently reviewed and approved by <strong>Hudbay</strong> (under the supervision of Cashel Meagher, P. Geo.,<br />
<strong>Hudbay</strong>’s Vice President South America Business Unit and a qualified person under NI <strong>43</strong>-<strong>101</strong>). The<br />
mineral resource estimate represents an update to previous model estimation (By GRD Minproc, DFS<br />
2009), used updated modelling methods and parameters and was completed using MineSight® Software<br />
in PSAD56 UTM 19S coordinates.<br />
Resource estimation for Constancia is based on integrated geological and assay interpretations of<br />
information recorded from diamond core logging and assaying and is comprised of following key steps:<br />
Exploratory Data Analysis, Modelling (Composites, variography and Interpolation) and Validations. A total<br />
of 161,110 m (554 holes) have been drilled at the Constancia deposit.<br />
The Constancia geological model is comprised of six lithology domains and five mineralization type<br />
zones. The mineralization type zones are: leached, oxide, supergene, mixed and hypogene material. The<br />
mineralization type model is based on logged codes, which have been checked against the sequential<br />
leach copper assay values.<br />
Statistical analyses were performed by lithology type and mineralization type zone and were used to<br />
develop estimation domains.<br />
Page | 26
In terms of resources categorization, the drill hole spacing analysis results indicate that, a drilling<br />
spacing of 50 m by 50 m could to classify material as measured resources and drilling spacing of 80 m<br />
by 80 m could be used to classify material as Indicated resources.<br />
Mineral resources above a 0.12% Cu cut-off grade are listed in Table 1-3. Mineral resources above a<br />
cut-off grade of 0.12 % Cu have reasonable prospects for economic extraction under the following<br />
assumptions: a copper price of US$2.88/lb, a molybdenum price of US$16.00/lb, copper recovery of 89%,<br />
molybdenum recovery of 60%, and processing costs of US$ 5.5/t and mining costs of US$ 1.30/t.<br />
Table 1-3: Constancia Mineral Resources (Effective August 23, 2011)<br />
Category<br />
Tonnage<br />
(Mt)<br />
Cu % Ag ppm Mo ppm Au ppb<br />
Measured 537.38 0.31 3 88.4 41.4<br />
Indicated 408.17 0.21 2.1 57.7 33.9<br />
Measured +<br />
Indicated<br />
945.55 0.27 2.61 75.15 38.16<br />
Inferred 221.11 0.19 1.8 48.6 31.8<br />
Note: The above mineral resources have a copper cut-off grade of 0.12% and have reasonable prospects for economic extraction.<br />
Mineral resources that are not mineral reserves and do not have demonstrated economic viability.<br />
After detailed review, <strong>Hudbay</strong> determined that AMEC’s mineral resource estimate for the Constancia<br />
deposit was accurate and that the resource model would be used in future engineering studies.<br />
1.14.2 PAMPACANCHA<br />
The Pampacancha mineral resource estimate was developed by <strong>Hudbay</strong>’s Geology Team under the<br />
direction Robert Carter, P. Eng. Director, <strong>Technical</strong> Services. The estimate was completed using GEMS®<br />
software in PSAD56 UTM 19S coordinates and has been approved by Cashel Meagher, P. Geo., Vice<br />
President, South America Business Unit.<br />
The Pampacancha deposit first began to be drilled by Norsemont in 2008 and continued to be drilled by<br />
<strong>Hudbay</strong> after it acquired Norsemont in 2011.<br />
A total of 110 holes (30,863 meters) were used in the resource calculation with 14 of those being derived<br />
from reverse circulation drilling and the remaining 96 from HQ diameter diamond drilling. All holes were<br />
drilled from surface by Geotec. Core recovery was near 100% for all holes.<br />
The drilling results were used to enable the preparation of a 3D geological interpretation and estimation of<br />
mineral resources. The database for the drill hole data utilised was maintained in Access spreadsheets<br />
and was validated by <strong>Hudbay</strong> in order to identify possible errors and compatibility to the assay<br />
certificates. <strong>Hudbay</strong> determined that the skarn mineralisation hosts the majority of the copper and the<br />
resource estimation was completed only for the skarn.<br />
Page | 27
The mineral resource was estimated by ordinary kriging interpolation and is shown in Table 1-4. Mineral<br />
resources above 0.2% copper cut-off have reasonable prospects for economic extraction under the<br />
following assumptions: an approximate $10/t operating cost, 80% recovery of copper and copper price of<br />
$2.25/lb net of selling costs.<br />
In contrast to the Constancia resource estimate, in the Pampacancha resource estimate, a pit<br />
optimization shell was not considered and the main parameter for resource categorization was a copper<br />
cut-off of 0.2%.<br />
Table 1-4: Pampacancha Mineral Resources (Effective April 2, 2012)<br />
Category Tonnage (Mt) Cu % Ag ppm Mo ppm Au ppb<br />
Measured 11.53 0.62 5.<strong>43</strong> 168.35 342.32<br />
Indicated 39.70 0.55 6.11 135.44 314.88<br />
Measured +<br />
Indicated<br />
51.23 0.57 5.96 142.85 321.06<br />
Inferred 4.47 0.<strong>43</strong> 6.5 110.82 215.47<br />
Note: No copper equivalency was used for the copper cut-off value and the estimated resource reports each grade value separately.<br />
Mineral resources that are not mineral reserves and do not have demonstrated economic viability.<br />
1.15 MINERAL RESERVE ESTIMATES<br />
The mineral reserve estimates for the Constancia Project are based on block models, as described in the<br />
sections of this <strong>Technical</strong> <strong>Report</strong> titled, Mineral Resource Estimates, Net Smelter Return, and Pit Design.<br />
Mining, processing, and economics parameters have been used to develop the mineral reserve estimate<br />
for the project. The mineral reserves’ economics are described in Section 22, Economic Analysis, of this<br />
<strong>Technical</strong> <strong>Report</strong>.<br />
This mineral reserve estimate has been determined and reported in accordance with NI <strong>43</strong>-<strong>101</strong>and the<br />
classifications adopted by CIM Council in November 2010. NI <strong>43</strong>-<strong>101</strong> defines a mineral reserve as “the<br />
economically mineable part of measured and indicated mineral resources”.<br />
Mineral reserves estimates for the Constancia and Pampacancha deposits, which are presented in this<br />
<strong>Technical</strong> <strong>Report</strong>, were prepared by the QP Audra Walsh (President, CEO at A2Z Mining Inc); and<br />
approved by <strong>Hudbay</strong> (under the supervisions of Cashel Meagher, P. Geo., <strong>Hudbay</strong>’s Vice President South<br />
America Business Unit and a qualified person under NI <strong>43</strong>-<strong>101</strong>).<br />
The Block Models used for the mineral reserve estimates have as a base the original mineral resource<br />
Estimate described in Section 14. Taking the original resource model for Constancia and re-blocking its<br />
Selective Mining Unit (SMU) from 10x10x15 meters to 20x20x15 meters, and re-blocking the<br />
Pampacancha resource model SMU from 10x10x5 meters to 20x20x10 meters.<br />
The regularized models which were created to simulate the actual mining practice by regularizing the<br />
SMU block sizes were considered a diluted model (the resulting dilution applied is approximately 2% in<br />
Page | 28
the Constancia deposit and 7.5% in the Pampacancha deposit) and no internal nor external dilution was<br />
added to the block models during the Mineral Reserve Estimation.<br />
The Qualified Person, Cashel Meagher, concluded that smoothing within the block model provided<br />
sufficient dilution and accounted for potential mine losses.<br />
Mine design and reserve estimation for the Constancia and Pampacancha pits used the Net Smelter<br />
Return (NSR) block models, which consist of the NSR values calculation for each block in the block<br />
models, taking into account the Cu, Mo, Ag, and Au grades, mill recoveries, contained metal in<br />
concentrate, deductions and payable metal values, metal prices, freight costs, smelting and refining<br />
charges and royalty charges. All of these parameters were applied to the block model (re-blocked<br />
resource models) to form the basis of the reserve estimate.<br />
Proven and probable reserves have continued to grow at Constancia and Pampacancha to 450 million<br />
tonnes at a copper equivalent grade of 0.49% supporting a 16 year mine life. The mine plan is such that<br />
the process plant is expected to operate to the capacity of the grinding circuit throughout LOM. The plant<br />
is expected to process 29 Mt /a (84,500 t/d at 94% availability) of ore. Concentrate production rates<br />
average 328,000 t/a over LOM. Constancia and Pampacancha mineral reserves are summarized in the<br />
following Table 1-5.<br />
Page | 29
Table 1-5: Constancia and Pampacancha Mineral Reserves<br />
Constancia Mineral Reserves - August 8, 2012<br />
Category<br />
M<br />
(tonnes)<br />
Cu<br />
(%)<br />
Mo<br />
(g/t)<br />
Ag<br />
(g/t)<br />
Au<br />
(g/t)<br />
Cu Eq (1)<br />
(%)<br />
Proven 349 0.37 100 3.29 0.0<strong>43</strong> 0.49<br />
Probable 54 0.24 60 2.98 0.035 0.33<br />
Total 403 0.35 96 3.25 0.042 0.47<br />
Pampacancha Mineral Reserves - August 8, 2012<br />
Proven 10 0.54 170 4.20 0.318 0.87<br />
Probable 37 0.46 140 4.56 0.276 0.76<br />
Total 47 0.48 149 4.49 0.285 0.78<br />
(1) Not accounting for recovery.<br />
The economics of the mineral reserves were confirmed by the financial model described in Section 22 of<br />
this <strong>Technical</strong> <strong>Report</strong>. The financial model confirmed a 14.5 percent internal rate of return, based on the<br />
following metals prices: a copper price of US$2.75/lb, gold price of US$1,150/oz, silver price of US$23.00<br />
/oz and molybdenum price of US$14.00/lb. Metallurgical recoveries were determined and used for each<br />
of the metallurgical domains determined for the deposit.<br />
1.16 MINING METHODS<br />
The Constancia project is a traditional open pit shovel/truck operation with two deposits, Constancia and<br />
Pampacancha. The project consists of open pit mining and flotation of sulphide minerals to produce<br />
commercial grade concentrates of copper and molybdenum. Silver and a small quantity of payable gold<br />
will report to the copper concentrate. The Pampacancha deposit, located 5 Km SE from Constancia,<br />
exhibits higher grades of copper and gold and is scheduled to enter into production during 2016.<br />
The Constancia ultimate pit will measure approximately 1.7 km east to west, 1.5 km north to south, and<br />
have a maximum depth of approximately 600 m. The Pampacancha ultimate pit will measure<br />
approximately 0.6 km east to west, 1 km north to south, and have a maximum depth of approximately 300<br />
m. There is one primary waste rock facility (WRF), which is located to the south of the Constancia pit and<br />
is intended to be used for both deposits. The processing facility is located approximately 1 km west of the<br />
Constancia pit, while the tailings management facility (TMF) is located approximately 3.5 km southwest of<br />
the Constancia pit. The pits and facilities can be seen in the following Figure 1-2.<br />
Page | 30
Figure 1-2: Constancia Project- Main Facilities<br />
Total project life is estimated to be 19 years, which consists of 2 years of construction, plus 17 years of<br />
mine production, including 3 quarters of pre-stripping and 8 months of production ramp up.<br />
Pit Design<br />
The Pit optimization was based on the profitability of the in situ blocks, and on the ability of each block of<br />
feed to cover the cost of stripping waste to access the feed block, utilizing the Lerch-Grossman algorithm.<br />
The diluted block models described in Section 15 were used for the pit optimizations.<br />
For the pit design, the targeted minimum mining width was 90 meters and honored the wall slope design<br />
provided by Knight Piésold (“KP”). Pit design parameters and final phase designs for Constancia and<br />
Pampacancha can be seen in the following Tables and Figures.<br />
Page | 31
Table 1-6: Constancia Pit Design Parameters<br />
Description<br />
Slope angles<br />
2011 KP Slopes<br />
Minimum Mining Width<br />
60 m, with a target of 90 m<br />
Road width<br />
30 m<br />
Catch berms<br />
8 and 9.9m (depending on IRAs)<br />
Bench height<br />
15 m single bench<br />
Ramp design grade 10%<br />
Other<br />
Last 4 benches will be designed as single lane (15 m) with 10% ramp<br />
Annual production<br />
Maximum Production at 80 Mt/year between both pits<br />
Process production<br />
+/- 29 Mt/yr ore<br />
Table 1-7: Constancia Slope Guidance<br />
Area IRA Overall slope Face Angles<br />
Northwest 45° 40° - 42° 65°<br />
Northeast 48° 40° - 42° 65°<br />
East 45° 40° - 42° 65°<br />
Southeast 45° 40° - 42° 65°<br />
Southwest 40° 37° 60°<br />
West 40° 37° 60°<br />
Page | 32
Figure 1-3: Constancia Geotech Zones<br />
Table 1-8: Pampacancha Pit Design Parameters<br />
Description<br />
May 2012 Plan<br />
Slope angles<br />
2012 KP Prefeasibility Slopes Study<br />
Minimum Mining Width<br />
60 m<br />
Road width<br />
30 m<br />
Catch berms<br />
9 and 12m (depending on IRAs)<br />
Bench height<br />
20m double bench<br />
Ramp design grade 10%<br />
Other<br />
Last 4 benches will be designed as single lane (15 m) with 10% ramp<br />
Annual production<br />
Maximum Production at 80 Mt/year between both pits<br />
Process production<br />
+/- 29 Mt/yr ore (combined with Constancia)<br />
Page | 33
Table 1-9: Pampacancha Slope Guidance<br />
Area IRA Overall slope Face Angles<br />
North <strong>43</strong>° 40° 65°<br />
East <strong>43</strong>° 40° 65°<br />
South <strong>43</strong>° 40° 65°<br />
Southwest 49° 45° 70°<br />
Northwest 49° 45° 70°<br />
Figure 1-4: Pampacancha Geotech Zones<br />
The ultimate pits have been divided into 6 phases for Constancia and a single phase for Pampacancha to<br />
facilitate the early extraction of the most profitable feed, and/or minimize the waste stripping. All phases<br />
are designed to provide the optimal ore for feeding the crusher based on the mining rate of up to 80mtpa<br />
and processing rates of ~29mtpa. The breakdown of the Phases can be seen in Table 1-10.<br />
Page | 34
Table 1-10: Breakdown of Phases<br />
Constancia Pit<br />
Ore<br />
Mdmt<br />
Cu % Mo % Ag g/t Au g/t Waste<br />
Mdmt<br />
Total<br />
Mdmt<br />
Strip<br />
Ratio<br />
Phase 1 56.88 0.53 0.011 3.68 0.04 61.37 118.25 1.08<br />
Phase 2 76.75 0.37 0.011 3.34 0.04 91.09 167.85 1.19<br />
Phase 3 (San Jose) 9.77 0.45 0.007 3.93 0.09 21.71 31.48 2.22<br />
Phase 4 93.82 0.31 0.010 3.54 0.04 179.81 273.62 1.92<br />
Phase 5 45.01 0.30 0.009 3.03 0.04 63.61 108.63 1.41<br />
Phase 6 120.96 0.29 0.008 2.79 0.04 110.59 231.54 0.91<br />
Total 403.19 0.35 0.010 3.25 0.04 528.18 931.37 1.31<br />
Pampacancha Pit<br />
Ore<br />
Mdmt<br />
Cu % Mo % Ag g/t Au g/t Waste Total Strip<br />
Ratio<br />
Phase 1 46.72 0.48 0.015 4.49 0.29 70.89 117.61 1.52<br />
Total 46.72 0.48 0.015 4.49 0.29 70.89 117.61 1.52<br />
The mine production plan contains 599 Mt of waste, and 450Mt of ore, yielding a waste to ore stripping<br />
ratio of 1.33 to 1. An average LOM mining rate of 65 Mt/a, with a maximum of 80 Mt/a, will be required to<br />
provide the assumed nominal process feed rate of approximately 29 Mt/a. The ore production schedule<br />
for the project shows average grades of 0.36% Cu, 0.010% Mo, 0.07 g/t Au and 3.38 g/t Ag. The metal<br />
contained in this production plan is approximately 3.6 billion pounds of copper, 100 million pounds of<br />
molybdenum, 970 thousand ounces of gold and 48.9 million ounces of silver.<br />
Total project mine life (not including construction) is estimated to be 17 years, including 9 months of prestripping<br />
and 8 months of ramp up. Feed stockpiled during the pre-stripping period will be processed<br />
during the first year of plant production. The priority plant feed will consist of high grade material (HG)<br />
Page | 35
and medium grade material (MG). The low grade material (LG) will be fed as needed and will otherwise<br />
be sent to the waste rock facility (WRF).<br />
Mine and Process Schedule<br />
For Constancia, mine road construction is expected to begin in the second quarter of 2013 and it will<br />
require the construction of approximately 9 kilometers of haul roads during a six month period. Haul road<br />
access to pit phases 2 through 4 are expected to be constructed during 2015 and will require the<br />
construction of 4.4 kilometers of haul roads.<br />
For Pampacancha, mine road construction is expected to begin in the third quarter of 2015 and will<br />
require the construction of approximately 4.5 kilometers of haul roads during a six month period.<br />
Pre-Stripping is expected to commence in November 2013, nine months before the initial start-up of the<br />
process plant. The mining ramp up rate is based on 50% availability of the shovel in the first month, and<br />
100% of availability of the shovel in the second month, with the erections starting one after another.<br />
Feed mined during pre-stripping is expected to be stockpiled. Initial pre-stripping of 31 Mt of waste<br />
material will be required before there will be continuous access to feed grade mineralization. During prestripping,<br />
16.5 Mt of Non Acid Generating material (NAG) is expected to be mined. This material will be<br />
required for the access roads, tailings dam and other construction facilities. The total waste dump volume<br />
requirement of 555 Mt will contain the Potentially Acid Generating material (PAG). The PAG waste dump<br />
is located south of the Constancia Pit, and it will store waste from Constancia and Pampacancha. For this<br />
mine plan 100% of the Pampacancha waste is considered PAG, this is a conservative assumption that<br />
might represent an opportunity in the future. Around 20 Mt of NAG materials will be stored at<br />
approximately 250 meters west of the waste dump.<br />
The Constancia Project is expected to have all necessary infrastructure for a large mine operation. Mining<br />
related infrastructure includes a truck shop, truck wash facility, warehouse, fuel storage and distribution<br />
facility, and electrical power distribution and substations to support construction and mine operations.<br />
Caterpillar 793F haulage trucks and Hitachi EX-5600 shovels were selected as the most suitable<br />
equipment for the Project. The selection criterion was based on flexibility, commercial terms, service<br />
terms and prices. The required mining fleet for the operation can be seen in Tables 1-11.<br />
Page | 36
Table 1-11: Mine Fleet Requirement - LOM<br />
Page | 37
1.17 RECOVERY METHODS<br />
The projected throughput rate is 85,000 tpd of ore from the Constancia and San José ore bodies.<br />
Annual concentrate production rates ramp up from 350,000 tpa in the first year to a peak of 450,000 tpa<br />
in Year 3. Production then drops to around 300,000 tpa until Year 10, after which it falls to 200,000 tpa<br />
and below until mine closure in Year 15.<br />
The primary crusher, belt conveyors, thickeners, tanks, pebble crushers, flotation cells, ball mills and<br />
various other types of equipment will be located outdoors without buildings or enclosures. To facilitate the<br />
appropriate level of operation and maintenance, the filters and concentrate storage will be housed in clad<br />
structural steel buildings.<br />
The crushing circuit consists of a 60” x 113” gyratory crusher, a variable speed belt feeder and a coarse<br />
ore stockpile feed conveyor.<br />
The grinding circuit requires two SAG mill feed conveyors. Dual reclaim chambers will be used to house<br />
four apron feeders that will draw ore from the crushed ore stockpile to the SAG mill feed conveyors.<br />
The grinding circuit consists of two identical trains of grinding; each train consists of a single semiautogenous<br />
grinding (SAG) mill and a ball mill. After year three of production there will be a pebble<br />
crusher added to each line. The ball mills are operated in closed circuit with a cyclone cluster to produce<br />
cyclone overflow which reports to rougher flotation feed.<br />
The function of the copper flotation area is to recover copper and molybdenum into a copper/molybdenum<br />
concentrate, reject zinc and reject gangue to the rougher tailings and cleaner scavenger tailings. The<br />
copper/molybdenum concentrate from the copper 3rd stage cleaner flotation column reports to a<br />
copper/molybdenum concentrate thickener.<br />
The function of the molybdenum flotation area is to recover molybdenum into a molybdenum concentrate<br />
and reject copper to the tailings as a copper concentrate. The stages of molybdenum flotation are:<br />
rougher, 1st to 5th stage cleaners, and cleaner scavengers. The molybdenum roughers, first cleaners,<br />
second cleaners and cleaner scavengers consist of 14 m 3 cells. Third cleaner consists of 8.5 m 3 cells and<br />
fourth cleaner consists of 4.3 m 3 cells. All are covered and gas is induced into each cell. The fifth cleaner<br />
flotation cell is a Jameson cell.<br />
The tailings from the molybdenum flotation roughers and molybdenum cleaner scavengers report to a<br />
copper concentrate thickener. The thickener underflow is removed and stored in two surge tanks. The<br />
filter feed is pumped to two Larox horizontal filters. The filters produce a filter cake of 9% moisture. The<br />
filter cake is dropped to ground and is transferred to temporary storage by front end loader. Filtrate, cloth<br />
wash, and flushing water are returned to the copper concentrate thickener.<br />
The molybdenum concentrate gravitates to a thickener. The thickened concentrate is pumped to an<br />
agitated molybdenum surge tank. The slurry is then pumped to a Larox horizontal pressure filter to<br />
produce a filter cake of approximately 15% moisture. Filter cake is conveyed by screw feeder to the<br />
molybdenum bagging plant. Molybdenum concentrate is bagged into 2 t bulk bags. The bulk bags are<br />
loaded onto trucks using forklifts.<br />
After filtering, the copper concentrate is transferred to copper concentrate product storage stockpiles<br />
inside the copper concentrate and load-out building. The building contains a live stockpile with capacity<br />
for seven days production (12,024 t). A fleet of about 64 tractor trailers, each with 33 t hauling capacity<br />
will be used to transport the concentrate to the port. A single front end loader will collect concentrate as it<br />
Page | 38
falls from the filters and either load it directly onto the trucks or temporarily store it in the same building.<br />
During daylight hours the trucks will drive from site to the Matarani port then back to the site empty. At<br />
peak production about 40 trucks per day will leave site.<br />
The copper tailings flow by gravity from the two copper rougher tailings lines, and by pumps from the<br />
cleaner scavenger tailings line, to tailings thickener, where it is thickened to 58% solids. Thickened<br />
underflow is then pumped to the tailings dam. The thickener overflow gravitates to the process water tank<br />
where it is used in the grinding and copper roughing circuits.<br />
The plant will normally run in automatic mode whereby all major units will be monitored and maintained<br />
by the DCS system logic. The plant operations will be monitored and controlled from a central control<br />
room that will be located between the grinding, flotation and regrinding areas. This control room will have<br />
CCTV views of different plant areas and DCS views of all the plant equipment, valves and<br />
instrumentation. The crusher and molybdenum areas will also have DCS interfaces. Various managers<br />
and remote parties will have access to the operating data via a web interface.<br />
Page | 39
1.18 PROJECT INFRASTRUCTURE<br />
The project infrastructure consists of the management of waste rock, tailings, water, electric power supply<br />
and transmission, and improvements to the roads and the port. Figure 1-5 provides an overall site layout<br />
showing the location of the various storage facilities relative to the Constancia and Pampacancha mines<br />
and the mill.<br />
Figure 1-5: Overall site layout<br />
Page | 40
Tailings Management Facility<br />
The tailings management facility (TMF) will be developed behind an east to west aligned, zoned<br />
earthfill and rockfill cross-valley embankment dam that will be raised in stages over the life of the<br />
mine and has been designed to store 445 million tonnes (Mt) of tailings (derived from 449.8 Mt<br />
of ore). The tailings will be impounded behind the south side of the embankment in a basin that<br />
contains two natural valleys running north to south that are separated by a central ridge.<br />
Tailings will be deposited from designated off-take points from a distribution pipeline located<br />
along the upstream crest of the embankment and around the perimeter of the facility, and will be<br />
delivered through drop-bar pipes running down the upstream face of the embankment and down<br />
the valley perimeter slopes into the TMF. The points of active deposition will be frequently<br />
rotated to form a thin layered, drained, and well consolidated beach that will slope away from the<br />
embankment towards the south side of the TMF basin. Initially, the surface pond will be located<br />
against the embankment in the east valley, but it will be displaced progressively upward and to<br />
the south by the development of the tailings beach, such that within the first three years of<br />
operations the beach is expected to become well developed against the embankment. The<br />
surface pond will vary in size throughout the life of mine depending on the season, precipitation,<br />
and operational requirements.<br />
The design of the TMF includes a LLDPE geomembrane liner and underdrains. The liner will<br />
cover the base of the entire eastern valley and a majority of the western valley to provide<br />
containment in areas where the surface water pond will be in contact with the base at any time<br />
over the life of mine. The liner will also be extended up the upstream face of the embankment to<br />
the top of the downstream constructed raise. Underdrain systems include groundwater<br />
underdrains beneath the liner, tailings underdrains, and an embankment toe drain.<br />
Waste Rock Facility<br />
The Potentially Acid Generating Waste Rock Facility (PAG WRF) is located in Cunahuiri Valley<br />
east of the Constancia Pit and provides storage for 560 Mt of PAG waste based on the mine plan<br />
received on, May 11-13, 2012. It has a placed density of 1.9 t/m 3 , resulting in a total volume of<br />
295 Mm 3 .<br />
Water Management<br />
Hydrologic and hydraulic analyses, including a detailed process water balance, were completed<br />
to determine the frequencies and quantities of flows as well as the types of flow, location, and<br />
resulting sizes of the water management structures required to contain or convey them. From the<br />
site assessment of the water management within the project area, the water was divided into<br />
categories of process water (water that is associated with the process and will be used in the<br />
process operation and/or it will be transferred throughout the project via conveyance pipelines)<br />
and non-process water (water that is not associated with process and typically consists of storm<br />
water runoff from areas within the project site). The non-process water was further divided into<br />
contact water (potentially acid generating (PAG) runoff water and non-PAG runoff water) and<br />
non-contact water.<br />
Page | 41
Based on the analysis of the water balance model and average climatological conditions,<br />
sufficient water exists in the system to operate at the proposed mining and milling rates and no<br />
additional water sources are required for operation.<br />
On site Camps<br />
Constancia is a remote site with restricted road access from the nearest significant town 1 ½<br />
hours away. This requires that two camps (one permanent and one for the construction<br />
phase) be constructed to house all personnel needed for community relations, environmental<br />
and safety support, and management, engineers and work crews that are required to perform<br />
exploration, geotechnical investigations and construction of the facilities. The camp facilities<br />
have been designed with reference to the IFC standards for camp construction for mining<br />
activities.<br />
Electric Power Supply and Transmission<br />
The Constancia Project’s maximum demand for electricity is estimated to be 96 MW with an<br />
average load of 85 to 90 MW in the first 5 years.<br />
Based on Supply/Demand studies it is expected that sufficient electricity will be available at the<br />
new 220 kV Tintaya substation (planned to be in operation in mid-2013) located about 70km from<br />
the mine site. It is estimated that electricity will be available in the $50 to $60/ MWhr range.<br />
HudBay is in the process of a Private Bid to a third party to be awarded by HudBay to provide<br />
Integrated Services for Power to the Constancia project, which will include, in general terms,<br />
engineering, procurement and construction of the power facilities, followed by operating and<br />
maintenance services of the Constancia 220 kV substation, the 220 kV transmission line running<br />
from the new Tintaya Substation to the Constancia HV Substation, and connection facilities<br />
Roads<br />
Currently there is a road to site, consisting of 70km of sealed road (<strong>National</strong> Route PE-3SG)<br />
from Yauri to the Livitaca turn-off and approximately 10 km of unsealed road (CU-764) from the<br />
Livitaca turn-off to site. These roads (and bridges) are expected to be upgraded by <strong>Hudbay</strong> Peru,<br />
as necessary, to meet the needs for construction and life of mine use.<br />
Port<br />
Copper concentrate is expected to be shipped from Constancia via road (~460km) and arrive at<br />
the Matarani port in trucks. These trucks are equipped with a hydraulically operated covered-box<br />
hinged at the rear, the front of which can be lifted to allow the concentrate to be deposited in the<br />
concentrate shed assigned to <strong>Hudbay</strong> by TISUR, the port operator (negotiations are currently<br />
underway with the port owners/operators). The shed will have between 45 and 90 wet kt<br />
capacity. A chute from the shed will feed a conveyor system in a tunnel below. The same<br />
conveyor and ship loading equipment will be shared with other copper concentrate exporters.<br />
Page | 42
The ship loading conveyor will be tubular to avoid concentrate losses and to conform to Peruvian<br />
regulations. The design, installation and operation of the port will be by TISUR. <strong>Hudbay</strong> will pay<br />
for its use on a per tonne basis, but will not contribute to the capital cost.<br />
1.19 MARKETING AND CONTRACTS<br />
The copper concentrate produced at Constancia is expected to be very marketable with average<br />
to above average copper grades, low impurities and low payable gold, making them attractive to<br />
smelters throughout Asia, Europe and even within South America. See Table 1-12 for estimated<br />
typical copper concentrate composition.<br />
Table 1-12: Copper Concentrate Composition<br />
Metal Unit Project Average Range<br />
Cu % 26.8 23.7 to 31.8<br />
Ag g/t 219 174 to 2<strong>43</strong><br />
Au g/t 2.1 1.6 to 3.0<br />
Zn % 3.3 1.75 to 5.5<br />
Pb % 0.86 0.5 to 1.7<br />
Both an EPCM contract and a contract covering heavy civil works as well as the first 5 years of<br />
mining are in place. Contracts for power supply and transmission line construction as well as port<br />
services are currently “under negotiation”.<br />
1.20 ENVIRONMENTAL STUDIES, PERMITTING, AND SOCIAL OR<br />
COMMUNITY IMPACT<br />
The Environmental and Social Impact Assessment (ESIA) for the Constancia Project is the<br />
principal mechanism for identifying baseline conditions and evaluating the impact of the project.<br />
Constancia’s ESIA, which was approved by the Peruvian Ministry of Energy and Mines (MINEM)<br />
on November 24, 2010, has been designed to satisfy the requirements of Peruvian legislation<br />
and to comply with internationally accepted guidelines for social and environmental protection. A<br />
first amendment to the ESIA is currently under preparation to match the Detailed Design<br />
Feasibility Study.<br />
<strong>Hudbay</strong> also obtained the approval of the third amendment to the Semi detailed Environmental<br />
Impact Assessment (SD-EIA) on May 23, 2011, which allows for exploration activities at the<br />
Constancia Project. A fourth amendment to this environmental instrument was submitted to the<br />
Page | <strong>43</strong>
MINEM on April 27, 2012 in order to conduct further exploration activities in the Pampacancha<br />
and Chilloroya South deposits. This amendment is currently under evaluation.<br />
In June 2012, <strong>Hudbay</strong> secured the permits required to start construction activities, including the<br />
authorization to construct the process plant and ancillary facilities and the construction permit for<br />
the Cunahuiri reservoir.<br />
As determined in the ESIA, the Project has a direct and an indirect area of influence. The direct<br />
area of influence is comprised of the peasant communities of Uchuccarco and Chilloroya. Both<br />
communities have a small "urban centre" and farmland. Line of sight from the urban centers to<br />
the mine operation will be largely obstructed by the natural topography. <strong>Hudbay</strong> has duly<br />
acquired the land rights required for the development of the mine from each community and the<br />
relocation of 36 rural households of the Chilloroya community is ongoing. Social development<br />
agreements have been duly executed and recorded with the Public Registry for both Chilloroya<br />
and Uchuccarco communities. Local employment and local procurement policies and procedures<br />
are also in place.<br />
The indirect area of influence is comprised of the following 7 communities: Huaylla Huaylla, Alto<br />
Collana, Casa Blanca, Collana, Merquez, Urazana and Añahuichi and the districts of Velille,<br />
Chamaca and Livitaca. Although no agreements with these entities are required for the<br />
construction and operation of the project, <strong>Hudbay</strong> is working on developing agreements with<br />
them in order to secure an appropriate social environmental for the development of the project.<br />
<strong>Hudbay</strong> has a Community Relations Plan and a solid team structure that will include one<br />
permanent office in Chilloroya and another in Uchuccarco.<br />
Page | 44
1.21 CAPITAL AND OPERATING COSTS<br />
The LOM capital costs are estimated to be $2,211.6M, including $1,546.1M for major project<br />
capital as summarized in Table 1-13. The capital cost estimate has an accuracy of +/- 15%.<br />
Table 1-13: Capital Costs<br />
Capital Expenditures<br />
Initial Capital<br />
Geology, Mine Design & Studies 000 US$ 2,112<br />
Mining 000 US$ 302,929<br />
Process Plant 000 US$ 359,838<br />
Site Services and Utilities 000 US$ 17,412<br />
Internal Infrastructure 000 US$ 372,505<br />
External Infrastructure 000 US$ 48,849<br />
Project Preliminaries 000 US$ 27,665<br />
Indirect Costs 000 US$ 144,049<br />
Owners Costs 000 US$ 270,787<br />
Total Initial Capital 000 US$ 1,546,146<br />
1, 2, 3<br />
Sustaining Capital<br />
Mining - Replacement 000 US$ 95,309<br />
Mining - Major Repair 000 US$ 223,706<br />
Plant - Pebble Crusher 000 US$ 18,858<br />
Plant - Tailings Pipeline 000 US$ 15,789<br />
TMF 000 US$ 297,130<br />
Other 000 US$ 14,657<br />
Total Sustaining Capital 000 US$ 665,448<br />
Total Capital Expenditures 000 US$ 2,211,594<br />
1<br />
Not including Closure costs<br />
2<br />
Cost model projects sustaining capital costs based on a forecast of the price of key<br />
input drivers, namely diesel, steel and the PEN/USD exchange rate<br />
3<br />
Undiscounted<br />
Operating costs include onsite mine development, ore production, processing, infrastructure and<br />
site specific G&A, as well as estimated costs for concentrate transport, storage and port<br />
handling.<br />
The total operating LOM costs are estimated to be US $9.40/tonne milled or $4,230.3M for the<br />
life of the mine.<br />
Page | 45
1.22 ECONOMIC ANALYSIS<br />
The Constancia project’s NPV 8% is C$571M as of July 1, 2012 and the IRR is 14.5%. The<br />
economic analysis incorporates capital expenditures that have been incurred during the first six<br />
months of 2012 and does not account for the silver stream transaction with Silver Wheaton.<br />
Project payback on an after-tax basis occurs in the fourth year of commercial production. The<br />
project’s gross revenue breakdown by metal is 81.1% from copper, 6.9% from silver, 6.8% from<br />
molybdenum and 5.2% from gold.<br />
The metal prices and exchange rates used in the economic analysis are based on a blend of<br />
consensus metal price forecasts from over 20 well known financial institutions as of June 2012<br />
as well as Brook Hunt’s metal price forecasts for copper. In addition to these forecasts, the<br />
forward curve and spot metal prices are taken into consideration. Long term equilibrium prices<br />
(LTEP) are in effect from 2017 onward.<br />
The Constancia cash flow model fully incorporates the Peruvian tax regime which includes the<br />
mining tax, mining royalty, 8% labour participation, corporate tax and IGV/VAT. The cash flow<br />
also incorporates the project’s closure and reclamation costs that are forecast to commence<br />
post-2020 and continue through to post-mine closure in 2030.<br />
Constancia’s effective mining tax and mining royalty are projected to be 2.86% and 2.61% of<br />
operating income over the life of the project. The Constancia cash flow model assumes that a tax<br />
stability agreement will be finalized in 2012. Companies operating under a tax stability<br />
agreement are subject to a 32% corporate tax rate and receive accelerated depreciation for<br />
certain classes of assets. Both the mining tax and the mining royalty as well as Peru’s 8% labour<br />
participation are deductible expenditures for the purposes of calculating the corporate tax.<br />
Capital expenditures in Peru are subject to a refundable IGV/VAT tax that is based on 18% of the<br />
cost of capital goods.<br />
The Constancia project is most sensitive to the copper price, followed by capital costs, operating<br />
costs, the PEN/USD exchange rate and lastly secondary metal prices (silver, molybdenum and<br />
gold), respectively.<br />
1.23 ADJACENT PROPERTIES<br />
There is no material information concerning mining properties adjacent to the Constancia project.<br />
1.24 OTHER RELEVANT DATA AND INFORMATION<br />
There is no other relevant data or information material to the Constancia project that could make<br />
this report clearer.<br />
1.25 INTERPRETATION AND CONCLUSIONS<br />
- The mine plan developed for the Constancia deposit is feasibility study quality and has been<br />
integrated with the mine plan for the Pampacancha deposit, which is pre-feasibility study quality.<br />
The projected supply of 16 year mill feed includes 450 million tonnes of proven and probable<br />
mineral reserves.<br />
Page | 46
- There are approximately 463 million tonnes of material currently classified as measured and<br />
indicated mineral resource that can be reviewed for economic returns should metal prices remain<br />
elevated.<br />
- The database is of sufficient quality to support the mineral resource and it has been validated by<br />
two external reviews<br />
- The methodology described for pit limit determination for both Constancia and Pampacancha,<br />
cut-off grade optimization, production sequence and scheduling, and estimation of<br />
equipment/manpower requirements is in line with good industry practice.<br />
- The Constancia project is one of many large projects to be constructed in Peru over the next<br />
several years. It is anticipated that there will be competition for workers and resources, which<br />
could result in potential schedule challenges during the construction period. The author believes<br />
that schedule slip will be the principal pressure on cost should the project experience construction<br />
delays. In the opinion of the author the amount of contingency of ~%11 allotted to construction<br />
capital cost should mitigate most cost risk and furthermore at the time of publication of this<br />
document committed and spent dollars would raise this contingency to close to ~15% of the<br />
remaining capital cost.<br />
-The authors believe that the current supply and demand for copper is such that the project will be<br />
completed in a favorable elevated copper market cycle when it reaches full production in 2015.<br />
- There exists to the West, adjacent to the Constancia proposed pit and at a depth of 250m, a<br />
Titan chargeability anomaly that <strong>Hudbay</strong> plans to test through diamond drilling in 2012. Further<br />
exploration is planned and warranted on the Pampacancha deposit with mineralization open to<br />
the North and West of the delineated deposit. The Chilloroya South prospect also has several<br />
exploration targets that merit follow up.<br />
- The return on investment and net present value are most sensitive to the price of copper. The<br />
resulting NPV (CAN$571 Million) and IRR (14.5%) utilizing the current <strong>Hudbay</strong> long term view on<br />
metal prices, TC/RC’s and economic assumptions, in the opinion of the author, support the<br />
declaration of mineral reserves as outlined in the CIM guidelines.<br />
-The test work to define the comminution characteristics of the Constancia deposit, particularly for<br />
the mill feed, is sufficient for all Constancia ore types that are likely to be encountered and are at<br />
a feasibility study level of design.<br />
- The proposed grinding circuit is sufficient to process the design tonnage and are at a feasibility<br />
level of design.<br />
- The comminution characteristics of the Pampacancha ore body are tested to a pre-feasibility<br />
level of design recognizing they will be treated in the Constancia mill.<br />
- Additional test work is required to raise the Pampacancha ores to a feasibility study level, but<br />
sufficient testing is complete for them to be considered at pre-feasibility study level.<br />
- The mine sequencing and planning will require care and review to ensure zinc concentrate<br />
grades are kept at marketable levels.<br />
- The molybdenum recovery circuit has assumed a lengthy ramp up to mitigate the difficult nature<br />
of achieving design recoveries.<br />
Page | 47
1.26 RECOMMENDATIONS<br />
- Acquire Pampacancha surface rights<br />
- Meet relocation commitments under the agreement with the community of Chilloroya<br />
- Update ESIA and other permits to reflect current design<br />
- Bring Pampacancha engineering design to feasibility study level<br />
- Incorporate data from infill drilling program at Pampacancha into future resource model updates<br />
- Continue exploration activities on nearby prospective properties<br />
- Add check of 3-5% of pulps from resource delineation drilling to exploration sampling and<br />
assaying protocols<br />
- Conduct periodic blank performance during diamond drill campaigns<br />
Page | 48
2.0 INTRODUCTION<br />
This <strong>Technical</strong> <strong>Report</strong> was prepared for <strong>Hudbay</strong> to support the public disclosure of the updated<br />
feasibility level mineral reserve and mineral resource estimate for the Constancia deposit and the<br />
new pre-feasibility level mineral reserve and mineral resource estimate for the Pampacancha<br />
deposit, both of which make up <strong>Hudbay</strong>’s Constancia Project, as of October 15, 2012.<br />
<strong>Hudbay</strong> is an integrated mining company with assets in North and South America. <strong>Hudbay</strong><br />
produces copper concentrate (containing copper, gold and silver) and zinc metal and is focused<br />
on the discovery, production and marketing of base and precious metals. Through its<br />
subsidiaries, <strong>Hudbay</strong> owns copper/zinc/gold mines, ore concentrators and a zinc production<br />
facility in northern Manitoba and Saskatchewan, and in Peru. Its mission is to create sustainable<br />
value through increased commodity exposure on a per share basis, in high quality and growing<br />
long life deposits in mining friendly jurisdictions.<br />
<strong>Hudbay</strong> acquired the Constancia Project in March 2011 through its acquisition of all of the<br />
outstanding shares of Norsemont Mining Inc. (“Norsemont”). <strong>Hudbay</strong> owns a 100% interest in<br />
the 36 mining concessions that comprise the Constancia Project, all of which are duly registered<br />
in the name of <strong>Hudbay</strong>’s wholly-owned subsidiary, HudBay Peru S.A.C. (“<strong>Hudbay</strong> Peru”);<br />
<strong>Hudbay</strong> Peru also has the required surface rights to develop the Constancia Project. This<br />
<strong>Technical</strong> <strong>Report</strong> represents the first technical report filed by <strong>Hudbay</strong> since its acquisition of<br />
Norsemont and updates Norsemont’s Feasibility Study Optimization dated February 21, 2011.<br />
2.1 TERMS OF REFERENCE<br />
This <strong>Technical</strong> <strong>Report</strong> provides current estimates of the mineral reserves and mineral resources<br />
at the Constancia Project (which now includes the Constancia and Pampacancha deposits) and<br />
describes the current state of metallurgical testing and the latest mine plan. The information<br />
presented in this <strong>Technical</strong> <strong>Report</strong> relating to the Constancia deposit, including the estimates of<br />
mineral reserves and resources therein, is the result of “feasibility study” level work; and, the<br />
information presented in this <strong>Technical</strong> <strong>Report</strong> relating to the Pampacancha deposit, including<br />
the estimates of mineral reserves and resources therein, is the result of “pre-feasibility study”<br />
level work. This <strong>Technical</strong> <strong>Report</strong> conforms to the CIM Definition Standards on Mineral<br />
Resources and Mineral Reserves referred to in <strong>National</strong> <strong>Instrument</strong> <strong>43</strong>-<strong>101</strong> – Standards of<br />
Disclosure for Mineral Projects (“NI <strong>43</strong>-<strong>101</strong>”).<br />
2.2 SOURCE OF INFORMATION<br />
This technical report is based, in part, on information provided from the following:<br />
- Most current technical reports for the project, written prior to the acquisition by <strong>Hudbay</strong>,<br />
titled as follows:<br />
Norsemont Mining Inc. CONSTANCIA COPPER PROJECT Definitive Feasibility Study<br />
<strong>Technical</strong> <strong>Report</strong> NI <strong>43</strong>-<strong>101</strong> Revision 0 28 September 2009<br />
Page | 49
Norsemont Mining Inc. CONSTANCIA PROJECT <strong>Technical</strong> <strong>Report</strong> Revision 0 21<br />
February 2011<br />
- AMEC (AMEC Perú S.A)– provided updated resource model for the Constancia deposit<br />
- Ausenco (Ausenco Solutions Canada Inc.) – provided the design for the Processing<br />
Plant and Site Infrastructure along with overall capital cost estimate, execution schedule<br />
and project execution plan in conjunction with their current role as project EPCM service<br />
provider<br />
- Stracon GyM S.A – provided input to Mine and Heavy Civil works capital and operating<br />
cost estimates in conjunction with their current role as heavy civil works and mining<br />
contractor for the project.<br />
- Knight Piesold Ltd.– provided Geotechnical and hydrogeological assessments of the<br />
site along with the design and capital cost estimates(with input from Stracon) for the<br />
Tailings and other waste storage facilities including water storage and usage.<br />
- A2Z Mining Inc. – provided mine design for both the Constancia and Pampacancha<br />
deposits.<br />
- Transmin Metallurgical Consultants – provided a comprehensive review of past<br />
Constancia deposit metallurgical testwork, organized current Constancia and<br />
Pampacancha test programs, compiled operating cost estimates and provided input to<br />
Process Plant design<br />
2.3 QUALIFIED PERSONS AND SITE VISITS<br />
This <strong>Technical</strong> <strong>Report</strong> has been prepared in accordance with NI Form <strong>43</strong>-<strong>101</strong> F1. The qualified<br />
persons who supervised the preparation of this <strong>Technical</strong> <strong>Report</strong> are:<br />
- Cashel Meagher, P. Geo., Vice President South America Business Unit.<br />
Mr. Meagher has direct authority over the Constancia project and was involved in<br />
early assessment of the project for <strong>Hudbay</strong> prior to its acquisition. In his past role as Vice<br />
President Exploration and in his current role, Mr. Meagher has made many visits to site and has<br />
overseen the reserve and resource estimation process for the deposits. Mr. Meagher has acted<br />
as Qualified Person for the Mineral Resource and Reserves Estimates, the Mining Method,<br />
Exploration Assessment. As well he acted as QP for the Permitting, Legal, Community Relations<br />
and Environmental Commentary (which had input and review from various individuals within<br />
those areas from the <strong>Hudbay</strong> Peru group).<br />
- Michael Humphries, P. Eng., Director – Engineering Studies<br />
Mr. Humphries has acted as Qualified Person for the Mineral Processing and<br />
Metallurgical Testing along with Recovery Methods (both in conjunction with review and input<br />
from Adam Johnston, Chief Metallurgist at Transmin Metallurgical Consultants), Project<br />
Infrastructure, Capital and Operating Cost, Marketing ( with review and input from the Director –<br />
Marketing for <strong>Hudbay</strong>) and Economic Evaluation (with input and review from Director – Treasury<br />
Page | 50
from <strong>Hudbay</strong> who was responsible for the Economic Evaluation model for the project and had<br />
responsibility for Metal Price and Economic condition outlook forecasting for the company). Mr.<br />
Humphries has made one visit to site during which port facilities and road to conditions site were<br />
reviewed.<br />
2.4 UNIT OF MEASURE ABBREVIATIONS USED IN REPORT<br />
• (%) - Percentage<br />
• (g/t) - Grams per tonne<br />
• (Mt) - Million tonnes<br />
• µg/m 3 - Micrograms per cubic meter<br />
• Ha - Hectare<br />
• Km - Kilometers<br />
• kV - Kilovolts<br />
• kWh/m3 - Kilowatt – hours per cubic meter<br />
• kWh/t - Kilowatt per tonne<br />
• m - Meter<br />
• m 3 - Cubic meter<br />
• m 3 /day - Cubic meter per day<br />
• m 3 /h - Cubic meter per hour<br />
• Mt/year - Cubic meter per year<br />
• Mt/yr ore - Million tonnes per year of ore<br />
• Mtpa - Million tonnes per annum<br />
• MW - Megawatt<br />
• MW-h/y - Mega watt hours per year<br />
• MWhr - Mega watt hour<br />
• ppb - Parts per billion<br />
• Ppm - Parts per million<br />
• sq-km - Square kilometers<br />
• t - Tonne<br />
• t / m 3 - Tonne per cubic meter<br />
• t/a - Tonnes per annum<br />
• t/BCM - Tonnes per billion cubic meters<br />
• t/Hole - Tonnes per hole<br />
• t/m 3. - Tonnes per cubic meter<br />
• Tonne/Hr - Tonnes per hour<br />
• Tpd - Tonnes per day<br />
• US$/dmt - US dollars per dry metric tonne<br />
• US$/oz - US dollars per ounce<br />
• US$/wmt - Us dollars per wet metric tonne<br />
Page | 51
2.5 ACRONYMS AND ABBREVIATIONS USED IN REPORT<br />
• (AAN) Andesite<br />
• (AAS) Atomic Absorption Spectroscopy<br />
• (AVRD) Absolute Value of the Relative Difference<br />
• (BAP) Biodiversity Action Plan<br />
• (CC-CR) Constancia Condemnation Drilling<br />
• (CG) Constancia Geotechnical Drilling<br />
• (CH)Constancia Hydrogeological Drilling<br />
• (CM) Constancia Metallurgical Drilling<br />
• (CO) Constancia Infill Drilling<br />
• (CR) Reverse Circulation<br />
• (CR) Reverse Circulation<br />
• (CRMs) Certified Reference Materials<br />
• (EIA) Environmental Impact Assessment<br />
• (FEED) Front End Engineering and Design<br />
• (GWI) Ground Water International Consulting Hydrogeologists<br />
• (HG) High Grade Material<br />
• (ICP-AES) Inductively Coupled Plasma – Atomic Emission Spectrometry<br />
• (IP) Induced Polarisation<br />
• (JV) Joint Venture<br />
• (LG) Low Grade Material<br />
• (LTEP) Long Term Equilibrium Prices<br />
• (LTEP) Long term equilibrium prices<br />
• (MCCs) Motor Control Center<br />
• (MG) Medium Grade Material<br />
• (MINEM) Peruvian Ministry of Energy and Mines<br />
• (MMP)Micro Monzonite Porphyry<br />
• (MP1) Monzonite Porphyry 1<br />
• (MP2) Monzonite Porphyry 2<br />
• (MR) Mining Royalty<br />
• (Mt) Million tonnes<br />
• (NAG) Non Acid Generating Material<br />
• (NI) <strong>National</strong> <strong>Instrument</strong><br />
• (NI) <strong>National</strong> <strong>Instrument</strong><br />
Page | 52
• (PAG WRF) Potentially Acid Generating Waste Rock Facility<br />
• (PAG) Potentially Acid Generating Material<br />
• (PFS) Pre-Feasibility Study<br />
• (PG)Pampacancha Geotechnical Drilling<br />
• (PO, PR)Pampacancha Exploration-Infill Drilling<br />
• (QC) The Quality Control<br />
• (QMP) Quartz Monzonite Porphyry<br />
• (RE) Relative Error<br />
• (RMR) Rock Mass Rating<br />
• (RQD) Rock Quality Designation<br />
• (SD-EIA) Semi detailed Environmental Impact Assessment<br />
• (SEIN) Peruvian <strong>National</strong> Interconnected Electric System<br />
• (SMT) Special Mining Tax<br />
• (SMU) Selective Mining Unit<br />
• (SO, SR) Chilloroya South Exploration<br />
• (SO, SR) Chilloroya South Exploration<br />
• (TMF) Tailings management facility<br />
• (UCS) Unconfined Compressive Strength<br />
• (UEA) Unidad Economica Administrativa<br />
• (UO) Uchuccarco Exploration<br />
• (WRF) Waste Rock Facility<br />
Page | 53
3.0 RELIANCE ON OTHER EXPERTS<br />
Standard professional procedures were followed in preparing the contents of this <strong>Technical</strong><br />
<strong>Report</strong>. Data used in this report has been verified where possible and the authors have no<br />
reason to believe that the data was not collected in a professional manner or that information has<br />
been withheld that would affect the conclusions made herein.<br />
The information, conclusions, opinions, and estimates contained herein are based on:<br />
• Information available to <strong>Hudbay</strong> at the time of preparation of this report; and<br />
• Assumptions, conditions, and qualifications as set forth in this report.<br />
The authors have relied on tax information (Section 22) provided by <strong>Hudbay</strong> tax department,<br />
social and environmental information (Sections 4 and 20) provided by <strong>Hudbay</strong>’s Social<br />
Responsibility and Environmental team in Peru, marketing information in Section 19 from<br />
<strong>Hudbay</strong>’s marketing group and commodity price forecasts (Section 22) from <strong>Hudbay</strong>’s treasury<br />
department.<br />
Except for the purposes legislated under provincial securities law, any use of the report by any<br />
third party is at the party’s sole risk.<br />
Page | 54
4.0 PROPERTY DESCRIPTION AND LOCATION<br />
4.1 THE PROPERTY LOCATION<br />
The Constancia Project is located in the south-eastern Andes of Peru, in the Chamaca, Livitaca<br />
and Velille districts, province of Chumbivilcas, department of Cusco. The property is<br />
approximately 600 km southeast of Lima at elevations of 4000 to 4500 masl and 100 km south of<br />
the city of Cusco. (Figure 4-1 and Appendix A)<br />
Road access to the property is from either Arequipa (7 hours by road) or Cusco (6.5 hours by<br />
road). Geographic coordinates at the centre of the property are longitude 71°47’ west and<br />
latitude 14°27’ south.<br />
Figure 4-1: Project Location<br />
4.2 MINERAL TENURE<br />
4.2.1 PERUVIAN MINING LAW<br />
The General Mining Law of Peru defines and regulates different categories of mining activities,<br />
from sampling and prospecting to commercialization, exploration, exploitation, processing and<br />
mining transportation (concessions granted by the Peruvian state are only required to conduct<br />
the latter four activities). Mining concessions (which grants the right to explore and exploit<br />
mineral deposits) are granted using UTM coordinates to define areas generally ranging from<br />
100 ha to 1000 ha in size. Mining concessions are irrevocable and perpetual, as long as the<br />
titleholder complies with two main mining obligations: (i) pay an annual validity fee (“Derecho de<br />
Vigencia”); and, (ii) achieve an annual minimum production level on the concessions.<br />
Page | 55
The “Derecho Vigencia” is an annual maintenance fee of $3/ha (for metallic mineral<br />
concessions) for each concession actually acquired, or for a pending application (petitorio),<br />
payable by June 30th of each year. Non-compliance with this obligation for two (2) consecutive<br />
years results in the cancellation of the respective mining concession. Holders of mining<br />
concessions granted up to October 10, 2008 must sustain a minimum level of annual commercial<br />
production of greater than $100/ha in gross sales within six years of the grant of the concession<br />
(‘’Minimum Required Production’’). If the concession has not been put into production within that<br />
period, then the concession holder must make an additional payment in the form of a penalty of<br />
$6/ha for the seventh through eleventh year of the grant of the concession, rising to $20/ha<br />
thereafter. The concession holder shall be exempted from the penalty if the investment made<br />
during the previous year was 10 times the penalty. Following the same principle established for<br />
the Derecho de Vigencia, non-compliance with this obligation for two (2) consecutive years<br />
results in the cancellation of the respective mining concession.<br />
Mining concessions granted after October 10, 2008, are subject to a new minimum production<br />
regime as amended by Legislative Decrees No. <strong>101</strong>0 and 1054 and its regulations enacted by<br />
Supreme Decree No. 54-2008-EM. Under such regime, the holder of a mining concession should<br />
achieve an annually minimum production of at least one (1) tax unit per hectare granted in the<br />
mining concession title, within a ten (10) year term following the year in which the respective<br />
mining concession title was granted. If such minimum production is not reached within the<br />
referred term, the holder of the concession shall pay penalties equivalent to 10% of the aforesaid<br />
tax unit per hectare per year. Regardless of the investments made in the concession, there are<br />
no exemptions from payment of these penalties.<br />
The mining concession shall be cancelled if minimum production is not reached and the<br />
applicable penalties are not paid for two (2) consecutive years.<br />
Furthermore, if the minimum production is not reached within a fifteen (15) year term following<br />
the granting of the concession title, the mining concession shall be cancelled by the mining<br />
authority, unless (i) a qualified force majeure event is evidenced to and approved by the mining<br />
authority, or, (ii) applicable penalties are paid and investments of at least ten (10) times the<br />
relevant penalties have been made; in which cases the concession may not be cancelled up to a<br />
maximum term of five (5) additional years. If minimum production is not reached within an overall<br />
twenty (20) year term following the granting of the concession title, the concession shall<br />
inevitably be cancelled.<br />
The holder of a mining concession is entitled to all the protection available to all holders of<br />
private property rights under the Peruvian Constitution, the Civil Code, and other applicable laws.<br />
A Peruvian mining concession is a property-related right; distinct and independent from the<br />
ownership of land on which it is located, even when both belong to the same person. The rights<br />
granted by a mining concession are defensible against third parties, are transferable and<br />
chargeable, and, in general, may be the subject of any transaction or contract.<br />
To be enforceable, any and all transactions and contracts pertaining to a mining concession must<br />
be entered into a public deed and registered with the Public Mining Registry. Conversely, the<br />
holder of a mining concession must develop and operate his/her concession in a progressive<br />
manner, in compliance with applicable safety and environmental regulations and with all<br />
Page | 56
necessary steps to avoid third-party damages. The concession holder must permit access to<br />
those mining authorities responsible for assessing that the concession holder is meeting all<br />
obligations<br />
It is worth noting that the thirty-six mining concessions which comprise the Constancia Project<br />
have been titled and have also been recorded with the Public Registries in <strong>Hudbay</strong> Peru’s name.<br />
Likewise, all thirty-six concessions are currently in good standing and concession fees and<br />
applicable penalties have been paid for the calendar year 2012. Accordingly, all such mining<br />
concessions are in good standing (i.e. the mining concessions are in full force and effect) as of<br />
2012 and there are no foreseeable circumstances that could result in the mining concessions<br />
being cancelled by the Peruvian State.<br />
4.2.2 CONSTANCIA AND PAMPACANCHA MINING CONCESSIONS<br />
Figure 4-2 shows the Constancia and Pampacancha mineralised zones on the property in<br />
relation to the concession boundaries. Most of the known mineralisation is located in the claims<br />
Katanga J, Katanga Q, Katanga K, Peta 7, Peta 6 and Constancias 8. <strong>Hudbay</strong> Peru is the<br />
current registered titleholder of the Constancia concessions which comprise 23,146.35 ha in<br />
thirty-six mineral concessions.<br />
Page | 57
Figure 4-2: Concession Boundaries<br />
Thirteen mining concessions out from the thirty six comprising the project have been included in<br />
Page | 58
an administrative economical unit (“Unidad Economica Administrativa” - UEA) called “Katanga<br />
Este”. UEAs are groups of two or more mining concessions of the same class and nature which<br />
allow the respective holder to work only in one or some of such concessions, instead of working<br />
simultaneously in all of those encompassing the UEA. However, the holder is obliged to obtain in<br />
those mining concessions which are exploited, the minimum production levels corresponding to<br />
all the mining concessions comprising the UEA.<br />
The UEA Katanga Este (code N° 01-00029-83-U) was originally approved by Resolución<br />
Directoral No. 148/86-EM-DCM dated 1 September 1986 comprising only the “Katanga J” and<br />
“Katanga K” mining concessions. Through Resolucion Jefatural N° 5404-2006-INACC/J issued<br />
on 14 December 2006 the remaining eleven mining concessions listed above were added,<br />
bringing a total of 13 claims (6785.2831 Ha.) to the UEA.<br />
Table 4-1 shows the names, codes, dates and areas of the concessions comprising the UEA<br />
Katanga Este. All the properties are located on the Livitaca (29-S) map sheet.<br />
Table 4-1: <strong>Hudbay</strong> Concession<br />
Concession Name Code Concession Granted Hectares<br />
Peta 5 05006089X01 28-11-1989 934.52<br />
Katanga J 05004406X01 29-03-1990 400.00<br />
Katanga Q 05005529X01 09-05-1990 150.01<br />
Katanga K 05004407X01 16-07-1990 300.00<br />
Peta 6 05006090X01 29-10-1996 1000.00<br />
Santiago 4 010083495 23-12-1996 34.16<br />
Santiago 3 010083695 25-03-1997 700.58<br />
Santiago 5 010083295 30-04-1997 602.12<br />
Katanga V 010248497 31-10-1997 100.00<br />
Katanga T 010248397 15-11-1997 100.00<br />
Page | 59
Concession Name Code Concession Granted Hectares<br />
Santiago Apostol I 010229294 31-03-1998 424.49<br />
Peta 17 0506198AX01 13-12-1999 49.05<br />
Peta 7 05006198X01 13-12-1999 351.70<br />
On November 23, 2007, 11 mining applications were submitted to Ingemmet to cover new areas<br />
with a total of 7700 ha. In addition, Norsemont also entered into an auction at the Ministry of<br />
Energy and Mines for an additional 12 claims in 2007 and received notification in 2008 that the<br />
claims were granted to it. The mining applications were granted to Norsemont as shown in Table<br />
4-2.<br />
Table 4-2: <strong>Hudbay</strong> Concession Grants<br />
Concession<br />
Name<br />
Code<br />
Concession<br />
Granted<br />
Resolution<br />
Area<br />
(Ha)<br />
Constancia 5 01-00253-07 01/03/2007 D.M. Titulado D.L. 708 1000<br />
Constancia 6 01-00254-07 15/12/2008 005610-2008-INGEMMET/PCD/PM 1000<br />
Constancia 7 01-00255-07 19/11/2008 004949-2008-INGEMMET/PCD/PM 1000<br />
Constancia 8 01-00256-07 15/12/2008 005627-2008-INGEMMET/PCD/PM 900<br />
Constancia 9 01-00257-07 15/12/2008 005601-2008-INGEMMET/PCD/PM 1000<br />
Constancia 10 01-00258-07 18/12/2008 006090-2008-INGEMMET/PCD/PM 100<br />
Constancia 11 01-00259-07 19/11/2008 004951-2008-INGEMMET/PCD/PM 1000<br />
Constancia 12 01-00260-07 19/11/2008 004950-2008-INGEMMET/PCD/PM 1000<br />
Constancia 13 01-00261-07 15/12/2008 005608-2008-INGEMMET/PCD/PM 1000<br />
Page | 60
Concession<br />
Name<br />
Code<br />
Concession<br />
Granted<br />
Resolution<br />
Area<br />
(Ha)<br />
Constancia 14 01-00262-07 16/12/2008 005757-2008-INGEMMET/PCD/PM 1000<br />
Constancia 15 01-00263-07 15/12/2008 005614-2008-INGEMMET/PCD/PM 1000<br />
Constancia 16 01-00264-07 15/12/2008 005609-2008-INGEMMET/PCD/PM 300<br />
Constancia 17 01-06147-07 05/05/2008 001061-2008-INGEMMET/PCD/PM 700<br />
Constancia 18 01-06148-07 21/04/2008 000937-2008-INGEMMET/PCD/PM 400<br />
Constancia 19 01-06149-07 12/05/2008 001175-2008-INGEMMET/PCD/PM 700<br />
Constancia 20 01-06150-07 12/05/2008 001234-2008-INGEMMET/PDC/PM 600<br />
Constancia 21 01-06151-07 12/05/2008 001422-2008-INGEMMET/PCD/PM 700<br />
Constancia 22 01-06152-07 12/05/2008 001291-2008-INGEMMET/PCD/PM 600<br />
Constancia 23 01-06153-07 18/04/2008 000872-2008-INGEMMET/PCD/PM 1000<br />
Constancia 24 01-06154-07 17/04/2008 000724-2008-INGEMMET/PCD/PM 800<br />
Constancia 25 01-06155-07 17/04/2008 000717-2008-INGEMMET/PCD/PM 800<br />
Constancia 26 01-06156-07 18/04/2008 000874-2008-INGEMMET/PCD/PM 600<br />
On June 20, 2010, Norsemont entered into an agreement with the Chilloroya Community by<br />
means of which Norsemont granted the latter the right to exploit a total area of 1,000 hectares<br />
involving certain portions of the mining concessions Peta 6, Peta 7, Santiago 5, Santiago Apostol<br />
I, Constancia 12, Constancia 13 and Constancia 8. This agreement was executed in order to<br />
contribute to the formalization process of certain illegal miners in the Chilloroya Community and<br />
will be in force until 2015.<br />
Page | 61
4.3 SURFACE LEGAL RIGHT ACCESS<br />
According to Peruvian law, mining concessions and surface lands are two different and separate<br />
rights. Thus, in order for a mining concession titleholder to obtain access to surface lands, the<br />
latter shall enter into an agreement with the respective landowner. In case the landowner is a<br />
peasant community (which are acknowledged by the Peruvian State as legal entities), the<br />
agreement must be approved by a minimum vote of the community's assembly, as further<br />
provided in specific regulations. Alternatively, mining concession titleholders can request to the<br />
Ministry of Energy and Mines the creation of legal easements over surface lands. Because of the<br />
complexity of this procedure, easements are not commonly requested and rarely granted.<br />
The project is principally located within six lands owned by <strong>Hudbay</strong>.<br />
In addition, on March 19 th , 2012, <strong>Hudbay</strong> and the Uchuccarco Community entered into an<br />
agreement granting <strong>Hudbay</strong> a right to use 256.50 hectares located in the so-called<br />
“Sayhualoma” sector through the life of mine. Likewise, one significant plot of 750 ha in the socalled<br />
“Ichuni” sector has been purchased by <strong>Hudbay</strong> from the Chilloroya Community on April<br />
12 th , 2012. <strong>Hudbay</strong> has also purchased two pieces of land of 361.8670 ha and 7,7319 ha,<br />
respectively called “Quinsachata Sub Lote 1” and “Quinsachata Sub Lote 2” for relocation<br />
purposes. Through these agreements, <strong>Hudbay</strong> has secured all surface land rights required for<br />
the construction and development of the Constancia Project.<br />
On May 9 th , 2012, <strong>Hudbay</strong> entered into an agreement with the Chilloroya Community in order to<br />
access and use for exploration purposes 6,148 hectares covering the Pampacancha deposit.<br />
This agreement will be in force until 2015.<br />
Below is a summary of the surface rights held by <strong>Hudbay</strong>:<br />
Page | 62
Table 4-3: Surface Legal Access Rights Table:<br />
No LOCATION AREA<br />
(hectares)<br />
RIGHT<br />
HELD BY<br />
HUDBAY<br />
CONSTANCIA/<br />
PAMPACANCHA<br />
1 Rustic Property located in the<br />
District of Velille, Province of<br />
Chumbivilcas, Department of<br />
Cusco, named “Chilloroya<br />
Lote B, San Antonio, Area<br />
Afectable”<br />
499.64 Owner Constancia<br />
2 Rustic Property located in the<br />
District of Velille, Province of<br />
Chumbivilcas, Department of<br />
Cusco, named “Chilloroya Lote<br />
B, San Antonio, Area<br />
Inafectable”<br />
9<strong>43</strong> Owner Constancia<br />
3 Rustic Property located in the<br />
District of Velille, Province of<br />
Chumbivilcas, Department of<br />
Cusco, named “Fortunia, Area<br />
Afectable”.<br />
974.91 Owner Constancia<br />
4 Rustic Property located in the<br />
District of Velille, Province of<br />
Chumbivilcas, Department of<br />
Cusco, named “Fortunia Area<br />
Inafectable”.<br />
423.38 Owner Constancia<br />
5 Rustic Property located in the<br />
District of Velille, Province of<br />
Chumbivilcas, Department of<br />
Cusco, named “Arizona”.<br />
885.35 Owner Constancia<br />
6 Rustic Property located in the<br />
District of Velille, Province of<br />
Chumbivilcas, Department of<br />
Cusco, named “Arizona –<br />
340.71 Owner Constancia<br />
Page | 63
No LOCATION AREA<br />
(hectares)<br />
RIGHT<br />
HELD BY<br />
HUDBAY<br />
CONSTANCIA/<br />
PAMPACANCHA<br />
Moroccota”.<br />
7 Rustic Property located in the<br />
District of Coporaque, Province<br />
of Espinar, Department of<br />
Cusco, named “Quinsachata<br />
Sub Lote 1”.<br />
361.8670 Owner Constancia<br />
8 Rustic Property located in the<br />
District of Coporaque, Province<br />
of Espinar, Department of<br />
Cusco, named “Quinsachata<br />
Sub Lote 2”.<br />
7,7319 Owner Constancia<br />
9 Rustic Property located in the<br />
District of Livitaca, Province of<br />
Chumbivilcas, Department of<br />
Cusco, named “Ichuni”.<br />
750 Owner Constancia<br />
10 Rustic Property located in the<br />
District of Chamaca, Province<br />
of Chumbivilcas, Department of<br />
Cusco, named “Sayhualoma”.<br />
256.5 Right of<br />
use to<br />
carry out<br />
all types of<br />
mining<br />
activities<br />
during the<br />
entire<br />
useful life<br />
of the<br />
Constancia<br />
Mine<br />
Constancia<br />
11 Rustic Property located in the<br />
District of Livitaca, Province of<br />
Chumbivilcas, Department of<br />
Cusco,<br />
named<br />
6148 Right of<br />
use to<br />
carry out<br />
all types of<br />
Pampacancha<br />
Page | 64
No LOCATION AREA<br />
(hectares)<br />
RIGHT<br />
HELD BY<br />
HUDBAY<br />
CONSTANCIA/<br />
PAMPACANCHA<br />
“Pampacancha”.<br />
exploration<br />
activities<br />
during the<br />
2012 –<br />
2015<br />
period.<br />
4.4 THE TERMS OF ANY ROYALTY OR PAYMENTS<br />
<strong>Hudbay</strong>’s mining concessions are free and clear of recorded liens, encumbrances or agreements<br />
except for the following:<br />
(i) A lien in the form of a 0.5% Net Smelter Return (“NSR Royalty”) has been established<br />
over the sale of the mineral products obtained from the following concessions:<br />
Property<br />
Katanga Q<br />
Peta 5<br />
Peta 6<br />
Peta 7<br />
Peta 17<br />
Such NSR Royalty has been granted in favor of Compañia Minera Katanga S.A.<br />
(“Katanga”) and Minera Livitaca S.A. (“Livitaca”) up to a maximum amount of US$<br />
10’000,000 (ten million and 00/100 Dollars of the United States of America). Once the<br />
aforesaid amount is reached, the NSR Royalty will automatically expire.<br />
This NSR Royalty has been established as a consequence of the execution of the<br />
transfer of the 30% interest of the above-listed mining concessions granted by Katanga<br />
and Livitaca in favor of Rio Tinto Mining and Exploration S.A.C. (formerly Rio Tinto<br />
Mining and Exploration Limited, Sucursal del Peru, hereinafter “Rio Tinto”), formalized by<br />
public deed dated December 20, 2007 and duly recorded with the Public Registry.<br />
Page | 65
(ii) By virtue of the Mining Concessions Transfer Agreement dated December 31, 2008, and<br />
its addendum, dated February 19, 2009, both executed by and between Norsemont and<br />
Rio Tinto a legal mortgage up to the amount of US$ 500,000 has automatically been<br />
established (and is currently registered) over the following mining concessions in order<br />
to secure the timely payment of the additional or contingent payment.<br />
Property<br />
Katanga Q<br />
Peta 5<br />
Peta 6<br />
Peta 7<br />
Peta 17<br />
(iii) <strong>Hudbay</strong> entered into a silver purchase agreement (the “SPA”) with Silver Wheaton<br />
(Caymans) Ltd. Pursuant to which it will receive US $295 million in upfront deposit<br />
payments (and ongoing cash payments, in respect of delivered silver, equal to the lesser<br />
of the market prive and U.S. $5.90/oz. Of silver) against delivery of 100% of the silver<br />
production from the Constancia Project. The SPA also provides that Silver Wheaton will<br />
be granted certain security over the project assets.<br />
<strong>Hudbay</strong> has also assumed the following payment commitments to the Chilloroya and<br />
Uchuccarco Communities:<br />
a) Approximately US$ 30 million to the Uchuccarco Community, which corresponds to (i)<br />
compensation for the right of use specified in point 10 of the Surface Legal Access<br />
Rights Table; and (ii) social responsibility commitments. Currently, the payment of<br />
approximately US$ 15 million of this commitment is being carried out and the remaining<br />
amount will be paid during the next fifteen years for the construction of sustainable<br />
development works for the Uchuccarco Community.<br />
b) Approximately US$ 30 million to the Chilloroya Community, which corresponds to (i)<br />
compensation for acquisition of the land specified in point 9 of the Surface Legal Access<br />
Rights Table and (ii) social responsibility commitments. Currently, approximately US$ 15<br />
million of this commitment has been paid and the remaining amount will be paid during<br />
the next fifteen years for the construction of sustainable development works for the<br />
Chilloroya Community.<br />
c) Approximately US$ 2.3 million to the Chilloroya Community as compensation for the<br />
right of use specified in point 11 of the Surface Legal Access Rights Table. This<br />
commitment will be paid during the next 3 years for the construction of sustainable<br />
development works for the Chilloroya Community.<br />
4.5 ENVIRONMENTAL LIABILITIES<br />
During the preparation of the environmental baseline for the ESIA, Knight Piesold Consultores<br />
S.A. determined the existence of 21 mining environmental liabilities within the Constancia Project<br />
in the areas called Sacsa Orcco, the San Jose pit, Chilloroya and the Yanaccocha Lake. Since<br />
Page | 66
these environmental liabilities were generated by former operations and titleholders, <strong>Hudbay</strong> is<br />
not obligated to undertake any measure for its reclamation or closure.<br />
4.6 RISK FACTORS PROPERTY<br />
<strong>Hudbay</strong> has secured all legal rights on the mining concessions comprising the Constancia<br />
project as well as on the lands required for the development of this project. Considering that<br />
such rights have been registered before the Public Registries and are enforceable before the<br />
Peruvian state and third parties, <strong>Hudbay</strong> does not foresee any risk in losing its rights over the<br />
Constancia project, provided that the legal obligations applicable to keep such properties in full<br />
force and effect are duly complied with.<br />
Regarding Pampacancha, although <strong>Hudbay</strong> has secured the necessary mining concessions to<br />
explore and exploit such deposit, <strong>Hudbay</strong> required to enter into an agreement with the Chilloroya<br />
Community for using the lands for construction and exploitation.<br />
4.7 PERMITS<br />
Information regarding permits can be found in Section 20.2.<br />
Page | 67
5.0 ACCESSIBILITY, CLIMATE, LOCAL RESOURCES<br />
INFRASTRUCTURE AND PHYSIOGRAPHY<br />
5.1 ACCESSIBILITY<br />
The project is accessible from Lima by air, via either Arequipa or Cusco, and then by vehicle over<br />
paved and gravel roads. The Figure 5-1 below shows the main route from Arequipa and Cusco<br />
to the project.<br />
Figure 5-1: Location of the Constancia Project<br />
The routes with approximate distances and driving times are shown in Table 5-1.<br />
Page | 68
Table 5-1: Approximate Distances and Driving Times to Constancia<br />
From Leg Distance (km) Time (hours)<br />
Arequipa Canahuasi 80 1.25<br />
Imata 63 0.75<br />
Yauri/Espinar 103 2.50<br />
Uchuccarco turnoff 68 2.00<br />
Project Site 20 0.50<br />
Total 334 7.00<br />
Cusco Sicuani (paved road) 140 2.00<br />
El Descanso 40 1.00<br />
Yauri/Espinar 45 0.75<br />
Uchuccarco turnoff 68 2.00<br />
Project Site 20 0.50<br />
Total 313 6.25<br />
5.2 CLIMATE AND VEGETATION<br />
Climate at the Constancia site can be classified as humid and seasonably cool with well-defined,<br />
rainy, and drier seasons. The majority of the precipitation typically occurs over the period of<br />
October to April, the summer months. Orographic (elevation) and physiographic effects also<br />
have influences on the climate.<br />
A design set of climatological data has been developed based on collected site data and data<br />
from stations located near the site. Due to the short length of climatological record at the on-site<br />
station (4 years), a synthetic precipitation record was developed for the site. A regression<br />
analyses was used by correlating the precipitation data from the on-site station with nearby<br />
climatological stations located in Santo Tomas, Yauri, Caylloma Imata, which have longer periods<br />
of record that overlap with site as well as the best correlation with the site data.<br />
Estimates for the design 24 hour storm events were calculated using a theoretical Extreme Type<br />
I (Gumbel) probability distribution on precipitation data from the Livitaca station, which is the<br />
Page | 69
closest station to the Constancia site and is located within the same drainage basin. Storm<br />
events observed at the Livitaca station were also the largest of the nearby stations.<br />
The land is seldom cultivated and has significant vegetative cover by natural grasses with no<br />
forest areas. It was assessed that 70 percent of the existing ground is covered by vegetation<br />
within the catchment area. Exploration and mining operations are possible throughout the year.<br />
The following summarises the climatological and hydrologic data adopted for the design: (Knight<br />
Piesold, Constancia Project Detailed Engineering Climatological Data Analysis <strong>Report</strong>, and<br />
December 8, 2011):<br />
• Annual Precipitation values:<br />
Annual average precipitation – 1000 mm<br />
Annual maximum precipitation –1353 mm<br />
Annual minimum precipitation –590 mm<br />
Average wet season (October to April) precipitation – 932 mm<br />
Average dry season (May to September) precipitation – 72 mm<br />
• 24 hour Storm Event Estimates:<br />
• Run-off and Infiltration:<br />
• Air Temperatures:<br />
100 year/24 hour storm precipitation – 91.8 mm<br />
PMP/24 hour storm precipitation – 263 mm<br />
Average annual runoff – 136.5 mm<br />
Average annual infiltration – 383 mm<br />
Daily average maximum – between 13 and 16 °C<br />
Daily average minimum – between (-11 and 0°C)<br />
• Average Annual Evaporations:<br />
Potential annual evaporation – 961 mm<br />
Annual evaporation from existing ground – 480 mm<br />
Evaporation from dry tailing – 455 mm<br />
Evaporation from wet tailing surface– 865 mm<br />
Page | 70
5.3 LOCAL RESOURCE<br />
The main economic activity in the area is subsistence agriculture and cattle farming. Food and<br />
basic supplies can be obtained in Yauri/Espinar (23,000 people). Cusco (population 350,000<br />
people) and Arequipa (population 650,000 people) are the nearest major centres, 6 and 7 hours<br />
drive from the project, respectively.<br />
Several permanently flowing streams which supply good flows are present in the area. More<br />
significant water sources include the Apurimac or Chilloroya rivers.<br />
Near the community of Chilloroya, the local population is engaged in the informal mining of<br />
superficial gold. The company and members of the community have raised concerns with<br />
Peruvian authorities regarding environmental and labour conditions related to the informal mining<br />
activities. For example, levels of mercury found in sediments near a rudimentary gold processing<br />
area exceed international standards for the protection of aquatic life.<br />
5.4 INFRASTRUCTURE<br />
Arequipa and Cusco are the nearest major centres, and both are over 300 km from the Project<br />
site by road.<br />
A public, but privately managed, landing strip is located in Espinar, about 2 hours from the<br />
project. The air strip is paved and maintained by Xstrata, and <strong>Hudbay</strong> has authorisation to use<br />
the strip. Small commercial and/or charter flights can use the air strip for daytime operations.<br />
Tintaya is the only operating mine near the Constancia Project and is located approximately 80<br />
kilometres to the Southeast. Tintaya (owned by Xstrata) has an annual production capacity of<br />
120,000 tonnes of copper in concentrates and cathodes. Development projects in the area<br />
include Antapaccay and Coroccohuayco (both owned by Xstrata) approximately 10 kilometres<br />
from Tintaya and Las Bambas approximately 50 kilometres north west of Constancia.<br />
The road to Yauri (in the general vicinity of Xstrata’s Tintaya and Antapaccay Mines) is expected<br />
to be upgraded to meet construction and life of mine transportation requirements. From Yauri,<br />
the road system is currently used by traffic supplying mines in the area. It is routed through the<br />
Arequipa area to the port at Matarani (approximately 460km from Constancia) which is currently<br />
used to ship copper concentrates from other mines in Southern Peru.<br />
Power supply for the site is expected to be brought from the 220 kV Tintaya substation which is<br />
expected to be fed from the <strong>National</strong> power grid via a new 220kV transmission line that is slated<br />
for completion by the summer of 2013. A new 220kV transmission line from Tintaya to<br />
Constancia is expected to be built for and owned by <strong>Hudbay</strong> with its operation and maintenance<br />
by a third party operator.<br />
Further details regarding Project Infrastructure can be found in Section 18.0 of this report.<br />
5.5 GEOMORPHOLOGY<br />
The Katanga-Constancia district has moderate relief with shallow glacial valleys and low<br />
rolling (400-500 m) hills. Two erosion surfaces can be distinguished; an older one overlain by<br />
Page | 71
the Tacaza volcanics, and a younger surface that forms the present landscape. This erosion<br />
surface has incipient dendritic drainage indicating the beginning of a more intense erosion cycle.<br />
The geomorphology of the area suggests that the porphyry intrusives were exposed to an<br />
extensive period of weathering associated with an unusually deep oxidation profile compared to<br />
other porphyry deposits in the vicinity of similar age.<br />
There are abundant indications of glacial activity corresponding to the last glaciation period.<br />
This glacial erosion formed the present U-shaped valleys and resulted in the deposition<br />
of abundant moraines of up to tens of meters in thickness. Holocene glacial deposits are<br />
located on the margins of U-shaped valleys as lateral moraines, or in the centre of the drainage<br />
as terminal moraines. Recent alluvial deposits are not common, and are located only at the<br />
margins of the larger rivers.<br />
Page | 72
6.0 HISTORY<br />
6.1 EARLY HISTORY<br />
Copper and gold were exploited at Katanga, located approximately 3km northwest of Constancia<br />
outside the Constancia property boundary from early last century to the early 1990s.<br />
The Katanga deposit consists of narrow skarn bodies developed in the contact between marbles<br />
and monzonite stocks, with Cu, Ag and Au mineralisation in hypogene sulphides.<br />
6.2 PRIOR OWNERSHIP<br />
• The San José Prospect (now part of the Constancia Project) was explored by Mitsui during<br />
the 1980s with a focus on locating more high-grade ore to add to the nearby Katanga mine<br />
operation. Exploration consisted of detailed mapping, soil sampling (1,949 samples), rock<br />
chip sampling (1,138 samples), ground magnetic and induced polarisation (IP) surveys<br />
with several drilling campaigns. Drilling was mainly located in the western and southern<br />
sides of the prospect. Mitsui completed 24 drill holes (4,190.5m) and Minera Katanga<br />
completed 24 shallow close-spaced drill holes (1,239.8m) at San José.<br />
• In 1995, reconnaissance prospecting identified evidence for porphyry style mineralization<br />
exposed over an area 1.4 x 0.7 kilometres open in several directions, with some Cu<br />
enrichment below a widespread leach cap developed in both porphyry and skarn.<br />
Negotiations to acquire an interest in the property were unsuccessful at this time.<br />
• In May 2003, the area was revisited by Rio Tinto and the presence of a leached cap and<br />
potential for a significant copper porphyry deposit was confirmed. Negotiations with Mitsui,<br />
Minera Livitaca and Minera Katanga resulted in an agreement being signed on October<br />
2003 with the underlying owners. The agreements included a Joint venture (JV) Option<br />
between Rio Tinto and Mitsui and Purchase Option Agreements with Minera Livitaca and<br />
Minera Katanga to acquire 100% interests in their property. Rio Tinto commenced<br />
exploration in December 2003.<br />
• The Rio Tinto exploration activities consisted of geological mapping, soil, and rock chip<br />
sampling, surface geophysics (magnetics and IP). Rio Tinto completed 24 diamond drill<br />
holes for a total of 7,8<strong>43</strong>.9m. Based on this drilling, and using 50x50x10 m blocks with<br />
inverse distance squared (250x250x20 m) interpolation, Rio Tinto estimated a resource of<br />
189 million tonnes of 0.68% copper and 200 ppm molybdenum, using a 0.5% Copper cutoff.<br />
Although considered relevant, this resource estimate can only be considered historical<br />
in nature as it does not comply with the guidelines of national instrument (NI) <strong>43</strong>-<strong>101</strong>.<br />
• In late 2004, Rio Tinto sought partners for the Constancia prospect, mostly because the<br />
property was thought to be too small. Eventually, Norsemont entered into negotiations with<br />
Rio Tinto and these negotiations led to an agreement in early 2005. The first Norsemont<br />
geologists visited the property in June of 2005.<br />
• By 2009, Norsemont had entered into a transfer agreement with Mitsui (November 2007)<br />
for the purchase of their 30% interest in the Constancia Project and had exercised the final<br />
option with Rio Tinto to acquire the remaining 19% interest in Constancia during 2008<br />
providing 100% ownership of the Constancia Project.<br />
Page | 73
6.3 HUDBAY OWNERSHIPS<br />
In March 2011, <strong>Hudbay</strong> acquired a 100% interest in the Constancia Project through its<br />
acquisition of all of the outstanding shares of Norsemont by way of a formal take-over bid.<br />
During the period between 2005 and 2010 Norsemont’s exploration activities were mainly<br />
focused on delineating the known Constancia and San Jose zones, although surface exploration<br />
of adjacent areas was also carried out, specifically focusing on the two new Cu-Au-Mo targets<br />
leading to the discovery of the Pampacancha porphyry-related skarn and Chilloroya South<br />
porphyry. Exploration drilling, including Rio Tinto’s original holes, totalled 161,040.55 meters by<br />
2010.<br />
Following the acquisition of the Constancia project in 2010, <strong>Hudbay</strong>’s exploration activities<br />
focused on delineating the Pampacancha deposit.<br />
By July 2012, a total of 197,621.85 meters had been completed for the Constancia Project<br />
including Pampacancha.<br />
Exploration activities during 2005 to 2012 included:<br />
• Geophysical Surveying<br />
• Geologic Mapping<br />
• Rock Sampling<br />
• Drilling<br />
• Surveying<br />
• Camp Construction<br />
6.4 PAMPACANCHA<br />
The Pampacancha prospect was identified in May 2008 after a stream sediment survey revealed<br />
a 27 sq-km, Au-Ag-Cu anomaly which was corroborated by mapping and rock sampling<br />
conducted in the area.<br />
Exploratory drilling carried out in Pampacancha South during August-September 2008 identified<br />
a high grade Cu-Au-Mo-Ag bearing skarn target with preliminary dimensions of 1,000m by 300-<br />
400 m. Preliminary results indicated at least two zones of skarn mineralisation over this 1,000 m<br />
strike length that were subjected to follow-up drilling carried out during November-December<br />
2009 and June-December 2010.<br />
From January to November 2011, there was a campaign of infill drilling and exploratory growth in<br />
these areas, in order to define measured and indicated resources of Cu-Au-Mo. The most<br />
important was the identification at a north-western area of high grade skarn Cu-Au below post<br />
mineral rocks, which has meant a substantial increase in the amount of resources and the<br />
deposit grade.<br />
Page | 74
7.0 GEOLOGICAL SETTING AND MINERALIZATION<br />
7.1 GEOLOGICAL SETTING<br />
7.1.1 DISTRICT GEOLOGY<br />
The oldest rocks in the area (Figure 7-1) correspond to a sequence of white, red, violet or grey<br />
medium-grained sandstones with intercalations of reddish mudstones of the Lower Cretaceous<br />
Chilloroya Formation (also referred to as the Murco Formation).<br />
The Arcurquina Formation discordantly overlies the Chilloroya Formation and correlates with the<br />
Upper Cretaceous Ferrobamba Formation. These rocks are exposed in a north-south elongate<br />
area, 15 km long by 5 km wide, comprising a sequence of limestones, calc-arenites and lenses<br />
of conglomerates.<br />
These sedimentary formations have been intruded by plutonic rocks belonging to the<br />
Andahuaylas-Yauri Batholith of Oligocene age. The batholith varies from dioritic to granodioritic<br />
in composition, with plagioclase and orthoclase feldspar, quartz, hornblende, biotite, apatite,<br />
zircon and sphene being the main rock-forming minerals. Small mantos, veins and lenses of<br />
massive magnetite skarn are common in the area, and are probably related to emplacement of<br />
the batholith.<br />
Several monzonitic stocks, dykes or laccoliths intrude and cross-cut all the lithologies mentioned<br />
above. Where these rocks have intruded limestones, it is common to find mineralised skarns,<br />
some of which contain Cu-Au-Ag mineralisation such as those at the Katanga mine. Some of<br />
the stocks have characteristics typical of porphyry copper deposits such as at Constancia.<br />
.<br />
Page | 75
Figure 7-1: Simplified Geology of the Andahuaylas-Yauri Area<br />
Page | 76
7.1.2 PROPERTY GEOLOGY<br />
CONSTANCIA<br />
The Constancia porphyry copper prospect is located on the eastern margin of the Andahuaylas-<br />
Yauri Batholith, approximately 3 km southeast of the old Katanga mine (Figure 7-2).<br />
Figure 7-2: Geological Map of the Constancia Deposit<br />
Stratigraphy<br />
The oldest stratigraphic unit recognised on the prospect comprises clastic sediments<br />
corresponding to the Chilloroya Formation, consisting of a sequence of white, red, violet and<br />
grey medium-grained sandstones with intercalations of reddish mudstones. Immediately<br />
overlying this basal unit are massive, grey micritic limestones with minor intercalations of shales,<br />
which outcrop sporadically around the prospect and near the contacts with monzonite,<br />
sometimes occurring as roof pendants. This unit corresponds to the Arcurquina Formation<br />
(locally known as Ferrobamba Formation). When in contact with intrusive rocks, these alter to<br />
marble or pyroxene diopside-garnet-magnetite-epidote skarn, with or without sulphides. The<br />
limestones and skarns dip gently south-east, away from the principal monzonite in the southern<br />
part of the Constancia mineralised zone. The overall thickness of the sedimentary package is<br />
unknown.<br />
Page | 77
The determination of the base of this limestone unit may be of importance at Constancia, as this<br />
potential contact seems to correlate with the favourable skarn horizon at the Tintaya Mine and<br />
elsewhere in the region. This contact may be found at depth south and east of the presently<br />
drilled area, if not intruded by the monzonite.<br />
The underlying clastic sediments of the Murco Formation, and possibly the upper parts of the<br />
further underlying Hualhuani Formation (locally known as Soraya Formation), which lithologically<br />
consist of sandstones and siltstones, with occasional calcareous and quartzite horizons, are<br />
known to host copper mineralisation in several copper systems within the belt. At Mitsui’s<br />
Quechua deposit near Tintaya, and also at the Antillas porphyry copper deposit near Antabamba<br />
(north of Constancia), these rocks are the main host for the copper mineralisation. The same<br />
style of mineralisation occurs at Haquira (10 km south of Las Bambas), where Murco sediments<br />
are the host for most of the copper oxide resource of the system.<br />
At Constancia, these types of clastic sediments, especially the Murco or Chilloroya Formation<br />
which is the host for the copper oxide mineralisation at Haquira, have been identified in the<br />
southern sector of the property, around the Chilloroya village, where recent surface exploration<br />
has identified evidence of porphyry-related copper-gold-molybdenum mineralisation associated<br />
with the sediments and altered porphyry rocks. Common to these clastic sediments is their ironstained<br />
colouration, which comes from oxidation of former disseminated pyrite.<br />
Glacial moraines cover the northern and eastern margins of the Constancia deposit. To the east<br />
these moraines entirely cover potentially important extensions of copper mineralisation along<br />
broad east-west structural zones.<br />
Intrusions<br />
Multiple phases of monzonite and monzonite porphyry characterise much of the surface area of<br />
the prospect, as well as dominating the rock types observed in the drilling to date.<br />
At this stage of the understanding of the deposit, at least four main phases of intrusion are<br />
recognised, with the second oldest being associated with the main mineralisation event. From<br />
oldest to youngest they are:<br />
Diorite: while not part of the intrusive event associated with mineralisation, the Andahuaylas-<br />
Yauri Batholith forms the ‘Intrusive Basement’ to the Constancia deposit.<br />
Monzonite Porphyry 1 (MP1): this unit outcrops as a large stock on the Constancia hill,<br />
extending west to San José. It hosts most of the porphyry-related mineralisation. It is<br />
characterised by abundant (40-50%) plagioclase phenocrysts up to 3 mm long. Hornblende<br />
constitutes 5-7%, with elongated crystals up to 6 mm long. The matrix is pinkish, with smaller<br />
magnetite and orthoclase crystals. The upper parts of this stock are mostly leached, making its<br />
recognition difficult.<br />
Micro Monzonite Porphyry (MMP): characterised by a fine-grained texture with plagioclase<br />
crystals (60-70%) up to 2 mm long. Biotite (1-3%) and magnetite (
xenoliths. This body outcrops as a stock in the south, but is more widespread west of the<br />
deposit, including the San José zone. Some dykes of MMP have seen cutting the MP1 porphyry.<br />
Quartz Monzonite Porphyry (QMP): this occurs mostly in the Constancia zone, as wide, northsouth<br />
to north-northwest trending dykes with dark, fine–grained chilled boundaries, misclassified<br />
sometimes as andesites in previous logging. Abundant (40-60%) plagioclase with tabular, wellformed<br />
hornblende crystals (7%) occur as phenocrysts in a greenish matrix. The most distinctive<br />
characteristic is a small amount (1-2%) of quartz ‘eyes’ three to four millimetres wide. These<br />
dykes are up to 60 m wide, and, based on sections, most are vertical. There is no mineralisation<br />
associated with the dykes. This unit appears to be offset by a dextral fault in the vicinity of<br />
drillholes CO-05-024 and CO-05-036.<br />
Monzonite Porphyry 2 (MP2): this dyke-like monzonite porphyry outcrops mostly to the west of<br />
Constancia, between the Constancia and San José zones. It is characterised by abundant (60-<br />
70%) plagioclase phenocrysts up to 4 mm long. These crystals are normally sub-rounded in a<br />
whitish matrix with little magnetite and mafics (hb>bio) for about 5-8%. The monzonite porphyry<br />
occurs as dykes up to 150 m wide, which strike north-south, possibly with a steep easterly dip.<br />
Andesite (AAN): dark-gray, aphanitic rock (greenish from chloritisation), with plagioclase and<br />
hornblende phenocrysts, and with magnetite about 1%. This occurs mainly as narrow dyke-like<br />
bodies, some of them close to the contacts with quartz monzonite porphyries. Additionally<br />
several brecciated units and minor felsic dykes occur in the area.<br />
Alteration<br />
Potassic Alteration<br />
The potassic alteration assemblage is characterised by secondary potassium-feldspar, and by<br />
variable amounts of hydrothermal biotite replacing earlier ferromagnesian minerals and rock<br />
matrix. Quartz veining is common; especially “A” and “B” type veinlets. Intensity of alteration is<br />
variable, ranging from weak to strong. Hydrothermal magnetite is also present as<br />
disseminations and associated with A type veinlets in deeper sections. Anhydrite veinlets are<br />
also common. Within the potassic alteration zone, chalcopyrite-(bornite)-molybdenite-pyrite<br />
mineralisation is present in A and B veinlets, and also replacing ferromagnesian minerals or<br />
filling fractures.<br />
Copper grades in general vary from 0.2%-4%, and are highest where fracture-filling style copper<br />
mineralisation is superimposed on earlier disseminated copper mineralisation. The high-grade<br />
(hypogene) copper mineralisation is hosted by a dense A-veinlet stockwork developed in an<br />
early porphyry phase. Pyrite/chalcopyrite ratio is typically low and in the order of 1:1 to 2:1.<br />
Molybdenite also commonly increases with depth, related to “B” veinlets. Bornite occurs<br />
sporadically especially at deeper levels, sometimes associated with gold values.<br />
Propylitic Alteration<br />
Propylitic alteration is transitional to the potassic alteration and extends more than one kilometre<br />
from the porphyry intrusive contacts. The propylitic alteration mineral assemblage includes<br />
Page | 79
epidote-chlorite-calcite-pyrite-rhodochrosite. Subordinate chalcopyrite is also present, filling<br />
fractures or replacing mafic minerals. Sphalerite-galena veinlets and veins are distributed as a<br />
halo to the copper-molybdenum mineralisation within the propylitic alteration halo, occurring at<br />
distances of up to 3 km away from the porphyry copper system.<br />
Phyllic Alteration<br />
Phyllic alteration forms a pervasive carapace surrounding and sometimes overprinting potassic<br />
alteration. This alteration accompanies almost complete destruction of primary rock textures.<br />
The phyllic alteration mineral assemblage includes sericite-quartz-pyrite, limited amounts of<br />
chalcopyrite and associated occasional “D” veins and veinlets.<br />
Structural Geology<br />
As with most porphyry copper complexes, structural activity at Constancia has played the most<br />
significant role in preparing and localising the hydrothermal alteration and accompanying coppermolybdenum-silver-gold<br />
mineralisation, including skarn formation.<br />
Major inter- and post-mineral fracture systems in the deposit area strike northeast. One of the<br />
best known is the ‘Barite Fault’, and reference is made to the ‘Barite’ direction. The Barite system<br />
is formed by a number of nearly parallel vein-faults carrying base metal sulphides and barite.<br />
These veins have been exploited by artisanal workings throughout the property. This system is<br />
clearly visible in the ground magnetic maps, controlling major features including topographic and<br />
shear fabric changes in the San José zone. A second important system strikes north-south. It<br />
seems to be more recent than the Barite system, controlling part of the San José deposit and<br />
most of the silicified breccias (some of them mineralised) in the system. This is the same<br />
direction as that of the post-mineral dykes, and may have originated as tension gashes to the<br />
Barite direction. Latest in the sequence is the north-northwest to south-southeast oriented fault<br />
system, with the Yanak Fault as the main example. These faults generate wide areas of gouge<br />
and milled rock, some of which show high hydraulic gradients.<br />
Barite Fault<br />
The Barite Fault is a late, northeast-southwest striking structure between the Constancia and<br />
San José zones. The fault zone is generally 5-10 m in width, and characterised by broken and<br />
brecciated monzonite-barite-quartz-copper oxides and galena. In detail, the vein shows an en<br />
echelon structure, with tight northeast sections followed by east-northeast and even east-west<br />
tension gashes which contain better grade mineralisation.<br />
Numerous exploration pits and tunnels are located along this structure for more than 1000 m.<br />
Parallel veins occur, showing similar strike and mineralisation. Owing to the scarcity of outcrops<br />
and the changing strike, the Barite Fault is defined as a zone with single defined faults as<br />
opposed to a shear zone, where the individual faults/veins have not been defined.<br />
The Barite Fault has late post-hypogene copper movement that post-dates and limits the<br />
Constancia zone on its north-western side. The fault system may also control the San José<br />
Page | 80
zone on its south side. It is possible that the San José and Constancia zones may be offset<br />
equivalents along a left-lateral Barite Fault.<br />
San José Pit Wall Fault<br />
This is a fault that bounds the eastern side of the San José pit. It strikes north-south, but<br />
meanders in its northern extension, where it may be associated with the Yanaccaca silicification<br />
zones.<br />
Yanak Fault<br />
This fault belongs to the latest structural event in the area. The structure strikes north-northwest<br />
to south-southeast and is located between the Constancia and San José deposits. It has been<br />
recognised for about 3 km, and has developed a zone of influence up to 50 m wide where gouge<br />
and milled rock are present. This type of structure commonly shows high water conductivity.<br />
Mineralisation<br />
The Constancia deposit is a porphyry Cu-Mo-Ag system which includes copper-bearing skarn<br />
mineralisation. This type of mineralisation is common in the Yauri-Andahuaylas metallogenic belt<br />
where several porphyry Cu-Mo-Au prospects have been described but not exploited.<br />
Five distinct mineral associations are found within the Constancia Project area, namely:<br />
1. Hypogene, porphyry-style mineralisation including disseminated, quartz-vein<br />
stockwork and fracture-controlled chalcopyrite-molybdenite mineralisation in the<br />
intrusive<br />
2. Hypogene chalcopyrite, rare bornite, galena and sphalerite mineralisation in<br />
skarns<br />
3. Supergene digenite-covellite-chalcocite (rare native copper) mainly hosted by<br />
intrusive, lying below a leached cap<br />
4. Transitional (Mixed) including secondary copper sulphides/chalcopyrite in the<br />
monzonite (overlap of 1 and 3, above)<br />
5. Oxide copper mineralisation.<br />
Of these, the hypogene mineralisation (Type 1) constitutes the bulk of the deposit, extending to<br />
well below the 3,900 m level.<br />
Type 2, skarn, is volumetrically smaller, but grades are normally higher, and mineralisation<br />
occurs at or near the surface. At the contact between the intrusives and limestones, magnetite -<br />
garnet skarn develops, while the pyroxene–diopside (garnet–epidote) association is more<br />
common in calcareous sandstones and arkoses of the Chilloroya Formation.<br />
Supergene enrichment (Type 3) occurs immediately beneath, and occasionally as remnants<br />
within, the leached cap. The highest copper grades in the Constancia porphyry are typically<br />
associated with this and with the skarn zone.<br />
Page | 81
Transitional (Mixed) zone (Type 4) corresponds to the zone where the supergene and hypogene<br />
mineralisation mix, e.g. both supergene and hypogene sulphides co-exist.<br />
Oxide copper mineralisation (Type 5) occurs locally. While shallow, it is volumetrically small and,<br />
therefore, is not considered relevant to exploitation at this stage of development.<br />
Two areas of porphyry-style mineralisation are known within the project area, Constancia and<br />
San José. At Constancia, mineralisation is deeper than that observed at San José which occurs<br />
at surface. The mineralised zone extends about 1,200 m in the north-south direction and 800 m<br />
in the east-west direction. Several new exploration areas were identified in the surroundings of<br />
Constancia, other than “Yanaccaca” and “Old Adits” already mentioned in the NI <strong>43</strong>-<strong>101</strong><br />
<strong>Technical</strong> <strong>Report</strong>, prepared by SRK Consulting and issued December 2007. The new areas<br />
include the Pampacancha, Eastern Uchuccarco and South Chilloroya, all of them highlighted by<br />
the recent Induced Polarisation (chargeability/resistivity) and ground magnetometry geophysical<br />
surveys carried out on the property during 2008. Some exploratory holes were drilled at the<br />
Pampacancha area during August-September 2008.<br />
PAMPACANCHA<br />
The Pampacancha Main Body project is located approximately 3 kilometres SE of the<br />
Constancia porphyry. From June to August 2008 a detailed surface mapping was focused on the<br />
areas where geophysical anomalies were identified at depth and stream sediment survey<br />
revealed an Au-Ag-Cu high anomalous values.<br />
The stratigraphy unit in the area is the massive, gray micritic limestone of Upper Cretaceous<br />
Ferrobamba Formation; this unit in contact with the dioritic porphyry generate a magnetite skarn,<br />
hosts economic mineralization of Cu-Au-Mo.<br />
The intrusive rocks present in the are the Oligocene unmineralised basement diorite, this is<br />
intruded by the diorite porphyry recognized as the source for skarn mineralisation which in turn is<br />
cut by intra-mineral monzonite intrusions which provide minor local increases in Cu-Au and also<br />
locally stope out skarn Cu-Au mineralisation which is best developed at the upper and lower<br />
margins of the limestone body.<br />
Prograde magnetite-chalcopyrite-pyrite skarn grades to marginal less well mineralised garnet<br />
and pyroxene skarn which are locally overprinted by epidote-bearing retrograde skarn.<br />
Epithermal mineralisation of the low sulphidation quartz-sulphide Au + Cu style, accounts for<br />
common supergene enriched Au anomalies, and along with other features such as hydrothermal<br />
alteration and veins typical of near porphyry settings<br />
The Pampacancha Main Body, according to lithology and mineralization has been divided into<br />
three sectors (Showed in Figure 7-3)<br />
Page | 82
Sector 1<br />
This extends for about 300m (EW direction) and 250m (NS direction) respectively. This area is<br />
characterized by the presence of magnetite>>calc-silicates skarns which developed from surface<br />
extending down to about 200m true depth (occasional deeper lenses have been identified too),<br />
intruded by potassically-altered diorite porphyry and fine-to-medium grained diorite, the latter<br />
also showing evidences of potassic alteration. Skarn bodies are thinning out as going southward,<br />
feature expected because of erosion along the slope of the hill<br />
Sector 2<br />
Immediately north of Sector 1 (200 by 250m) is characterized by the presence of a limestone<br />
body in between two main skarn layers, which extends from about 70m depth (the shallower<br />
level) down to about 250m (the deepest level). The upper skarn extends basically from surface,<br />
showing alternations with thin limestone layers, all disrupted by the emplacement of diorite<br />
porphyry dikes and endoskarn, whereas the lower skarn layer extends to a maximum depth of<br />
about 300m.<br />
Sector 3<br />
Extends immediately NW of sector 2 for about 500m and 350m wide. It has basically the same<br />
characteristics of sector 2, with a limestone body in between two skarn layers, which is thinning<br />
out as going northward, eastward and westward.<br />
Page | 83
Figure 7-3: Pampacancha Sectors<br />
7.2 SIGNIFICANT MINERALIZATION<br />
7.2.1 CONSTANCIA<br />
The Constancia porphyry has been evaluated by 317 diamond drillholes (pre-January 2009),<br />
some to depths of more than 600 m, with a maximum of 675.80 m (CO-08-133). The majority of<br />
Page | 84
the mineralisation occurs as disseminations, quartz vein stockworks and fracture filling of<br />
sulphides, mainly associated with the “Monzonite Porphyry 1 (MP1). When mineralised, MP1<br />
shows either extensive quartz-sericite or potassic alteration.<br />
Copper mineralisation is best developed in the central part of the deposit within the monzonite<br />
porphyry and is open at depth below 3,800 mRL (e.g. CO-06-083, CO-07-105, CO-08-233, CO-<br />
08-278 and CO-08-288).<br />
Oxidation and leaching are intense, with almost no fresh sulphides occurring at surface. A<br />
leached cap occurs to variable depths, up to a maximum of 100 m where fracturing is more<br />
intense, or in rocks with intense stockwork development.<br />
Oxidation decreases towards the margins of the prospect and in the magnetite skarn, reaching<br />
only a few tens of meters depth. The main iron-oxide minerals are jarosite and goethite with<br />
lesser amounts of hematite after supergene chalcocite. Typical copper grades in the leached<br />
cap are in the order of 100-200 ppm, values considered as strongly geochemically anomalous.<br />
Molybdenum and gold values in the leached cap are generally similar to hypogene grades.<br />
The San José zone lies adjacent west-northwest of the western limit of the Constancia deposit<br />
and is separated from it by the Barite Fault Zone. Sixty drillholes have been completed in the<br />
area; most of them intended to identify the extension and depth of the mineralisation.<br />
Major controls for the area appear to be two faults that bound it on the east (San José Fault) and<br />
west. These two faults strike generally north-south, but would merge into one at the Yanaccaca<br />
zone.<br />
Mineralisation in this area corresponds mostly to hypogene type assemblages, with skarn<br />
mineralisation playing a secondary role.<br />
7.2.2 PAMPACANCHA<br />
Mineralization at Pampacancha, as with the lithology, is divided in three sectors:<br />
Sector 1<br />
This sector contains the best Cu, Mo and Au grades in the deposit so far. Mineralization includes<br />
chalcopyrite, bornite, molybdenite with variable amounts of sphalerite and galena. Because of<br />
the best Cu, Mo and Au mineralization associated to magnetite-rich prograde skarns occur<br />
widespread in this sector, strongly suggests that the center of the porphyry-related skarn system<br />
would be located precisely in this area, fading out further north towards sectors 2 and 3.<br />
Sector 2<br />
Cu-Au mineralisation mostly occurs at the margins of the gently dipping host limestone unit in a<br />
more distal setting and up-dip of the Sector 1 Cu-Au magnetite skarn mineralisation, which is<br />
developed closest to the intersection between the limestone and diorite porphyry source.<br />
Page | 85
Sector 3<br />
This sector contains the best Cu-Au grades in the deposit and the best mineralized interval, the<br />
mineralization includes chalcopyrite and bornite and gold associated this, located at west of<br />
sector this was discovered in 2011.<br />
Page | 86
8.0 DEPOSIT TYPES<br />
The Constancia deposit is a porphyry Cu-Mo-Ag system which includes copper-bearing skarn<br />
mineralisation. This type of mineralisation is common in the Yauri-Andahuaylas metallogenic belt<br />
where several porphyry Cu-Mo-Au prospects have been described but not exploited.<br />
The principal porphyry deposits in the belt include Antapaccay (720 Mt @ 0.54% Cu, Xstrata plc<br />
Half Yearly <strong>Report</strong> 2009), Quechua (~260 Mt @ 0.61% Cu, Mitsui Kinzoku press release, Nov 7,<br />
2007 ) and Los Chancas (~200 Mt @ 1% Cu, 0.08% Mo, 0.12 g/t Au). Several other porphyry<br />
prospects are also being explored in the district.<br />
Historically, the belt was better known for copper skarn deposits such as Tintaya (130 Mt @<br />
1.7% Cu, 0.26 g/t Au) and Las Bambas (copper skarn-porphyry) where Xstrata recently reported<br />
resources of 1100 MT @ 0.77% Cu (Xstrata plc Half Yearly <strong>Report</strong> 2009).<br />
The Pampacancha deposit is a porphyry related Skarn system, with copper-bearing skarn<br />
Mineralization, This type of mineralisation is common in the Yauri-Andahuaylas metallogenic belt<br />
where several skarn project have in development, Corocohuayco in Tintaya District and Las<br />
Bambas is the best examples.<br />
The Constancia project area geology contains the classic characteristics typical of poly metallific<br />
copper porphyry deposits. The following generalized geological characteristics are the typical<br />
targets of exploration compilation efforts and support the classic genesis model of a<br />
copper porphyry:<br />
• Orebodies are associated with multiple intrusions and dikes of diorite to quartz<br />
monzonite composition with porphyritic textures.<br />
• Breccia zones with angular or locally rounded fragments are commonly associated with<br />
the intrusives. The sulfide mineralization typically occurs between or within fragments.<br />
• The deposits typically have an outer epidote - chlorite mineral alteration zone.<br />
• A quartz - sericite alteration zone typically occurs closer to the center and may overprint.<br />
• A central potassic zone of secondary biotite and orthoclase alteration is commonly<br />
associated with most of the ore.<br />
• Fractures are often filled or coated by sulfides, or by quartz veins with sulfides.<br />
• Closely spaced fractures of several orientations are usually associated with the highest<br />
grade ore.<br />
• The upper portions of porphyry copper deposits may be subjected to supergene<br />
enrichment. This involves the metals in the upper portion being dissolved and carried<br />
down to below the water table, where they precipitate.<br />
Page | 87
9.0 EXPLORATION<br />
The exploration is currently underway in the project area, and is focused on targets described in<br />
the following sub-sections. Drill intersections in this section are recorded as core lengths and<br />
assays are composites of continuous sampling for the length of the core interval. Core length<br />
does not indicate true thickness, and the nature of non-tabular porphyry and skarn mineralisation<br />
requires detailed geological modeling to ascertain “thickness” or volume. The following Figure 9-<br />
1 shows a general view of the current Constancia Exploration Program.<br />
Figure 9-1: Constancia Exploration Program<br />
Note: Drill intersections are core lengths and do not represent true thicknesses.<br />
9.1 SURFACE MAPPING AND SAMPLING<br />
During the first months of 2007, geological mapping at 1:1,000 scales was conducted in the area<br />
surrounding the Constancia deposit, covering an area of approximately 450 hectares. Owing to<br />
the scarcity of outcrops, most of this mapping was made along roadcuts, and combined with<br />
information from some trenches. First rock intercepts from drill holes were also used to help<br />
define the different rock types at surface. Locations were based on GPS measurements.<br />
Page | 88
From April to October 2008, surface mapping was focused on the areas where geophysical<br />
anomalies were identified at depth as well as the surface reconnaissance of the projected waste<br />
dump and plant facilities. By October 2008, additional 2,200 hectares were mapped at 1:2,000<br />
and 1:5,000 scales, including the collection of over 900 rock samples and 41 stream sediment<br />
samples, the latter in the eastern sector of the Constancia deposit where scattered gold<br />
occurrences were observed in an area of 4.5 km by 0.8 km, now known as the Pampacancha<br />
deposit. Surface mapping resumed mid February 2009 to the south of the Pampacancha deposit<br />
(SE of the Constancia deposit), and the Arizona and San Antonio areas, where the tailings<br />
storage facility (TMF) is planned to be built. By March 2009, an additional 1,500 hectares had<br />
been mapped and about 350 rock samples collected. From April to June 2009 mapping was<br />
carried out in the Chilloroya South area, where evidence of porphyry-related copper-goldmolybdenum<br />
was found. From February to June 2010, mapping was focused on the Norsemont<br />
properties located at the western side of the project, in the vicinity of Uchuccarco, as well as the<br />
Norsemont-owned Arizona-Morocota and Fortunia areas.<br />
In summary, from 2007 to 2011, Norsemont mapped 11,444 hectares at the Constancia Project<br />
at several scales, including 1:1,000, 1:2,000 and 1:5,000. Of this, 8,905 hectares were mapped<br />
on <strong>Hudbay</strong>’s mining concessions, which represent 39% of the <strong>Hudbay</strong>’s mining rights in the<br />
area. Additionally, 2595 rock samples and 41 stream sediments samples were collected during<br />
this period.<br />
9.2 GEOPHYSICS<br />
An in-house interpretation of the geophysical data along with interpretation of available surface<br />
mapping and rock and stream sediment geochemistry helped identify several targets within the<br />
project area. The most important ones are the anomalies associated with the Pampacancha<br />
deposit, the chargeability-magnetic anomalies observed in the Chilloroya South prospect and the<br />
chargeability anomalies located in Uchuccarco, at 3.8 km northeast of the Constancia porphyry.<br />
<strong>Hudbay</strong> completed a Titan-24 DC-IP-MT survey in July 2011 on the Constancia Project. The<br />
survey includes 16 DC/IP/MT spreads along 8 lines with 100 m station interval and irregular line<br />
spacing. The survey lines were surveyed in the E-W direction. A total of 38.4 km of DC/IP survey<br />
line and 36.8 km of MT survey line were surveyed. A pole-dipole configuration was used for DC<br />
and IP measurements.<br />
The exploration objective of the Titan 24 DCIP & MT survey was:<br />
• Locating potential sulphide rich zones and/or associated alteration.<br />
• Mapping the resistivity and chargeability of the subsurface to significant depths.<br />
• Geologic interpretations.<br />
• Focus drilling thereby reducing overall drilling costs.<br />
Several targets were identified in the Constancia area, South Chilloroya and Pampacancha and<br />
are expected to be drilled within the drilling program this year.<br />
Page | 89
9.3 EXPLORATION TARGETS<br />
9.3.1 PAMPACANCHA OTHER PROSPECTS<br />
The Pampacancha prospect is located approximately 3 kilometres SE of the Constancia<br />
porphyry. The prospect was identified by Norsemont in May 2008 after a stream sediment<br />
survey revealed a 27 sq-km, Au-Ag-Cu anomalous area, which was subsequently corroborated<br />
by mapping and rock sampling conducted on the area. The following figure 9-1 shows the<br />
general configuration of Pampacancha targets.<br />
Page | 90
Figure 9-2: Pampacancha Geology Map<br />
Pampacancha is also coincident with a NE striking structural break and several chargeability<br />
anomalies that occur at depth. The prospect comprises scattered outcrops of limestone and<br />
minor fine grained clastic sediments intruded by dioritic and lesser monzonite intrusive which<br />
generated magnetite and lesser garnet-calc silicate skarns at their contacts. On surface, high<br />
grade Au-Ag-(Cu) mineralisation associated with epithermal, low sulfidation veins, shear zones<br />
and limestone replacements occur in an area of about 6 square kilometers. The longest<br />
structure can be projected up to one kilometre in length. Gold and silver returned values up to<br />
39 g/t Au and 38 oz/t Ag.<br />
Norsemont commenced exploratory drilling at Pampacancha in August 2008 and drilling has<br />
continued to date. A total of 19,653.50 metres had been drilled as of December 31, 2011. Drilling<br />
was carried out at the “main body”, “magnetic halo” and “limestone replacement” target areas.<br />
The “main body”, which is the porphyry-related skarn target first discovered by Norsemont in<br />
2008, received about 12,000m of drilling in 47 holes.<br />
Page | 91
Magnetic Halo Area<br />
Evaluation of the ground magnetic data revealed the presence of a magnetic halo roughly<br />
coincident with a chargeability anomaly extending up to 1,400m west from the “main body”. This<br />
area is bounded and crosscut by high-grade epithermal, low-sulfidation Au-Ag-bearing<br />
polymetallic quartz (carbonate) veins, which crosscut regional diorites, monzonite porphyries and<br />
magnetite skarn bodies. Target types are copper-bearing skarns, epithermal, high-grade Au-Ag<br />
veins and disseminated Au-(Zn-Pb) associated with monzonite porphyries.<br />
Most of this area consists of regional diorites, which formed shallow magnetite skarn bodies at<br />
their contacts with former limestones, some of them Cu-bearing. The best copper-bearing skarn<br />
interval at this target came from hole PR-10-022 which returned <strong>43</strong>m @ 0.64% Cu. However,<br />
most of the holes returned Au anomalies, as seen in hole PR-10-016, which returned 124m @<br />
0.28 g/t Au; PR-10-017 with 9m @ 1g/t Au; PR-10-019 with 15m @ 0.33gpt Au and PR-10-021<br />
which returned 6m @ 0.46 gpt Au.<br />
Hole PR-10-024 (reverse circulation) drilled at the centre of the halo upon an area of high<br />
chargeability anomaly, intercepted a porphyrytic monzonite which returned significant Au-(Zn-Pb)<br />
mineralization from 106m to 202m depth (end of hole). Within this interval, 33 m (from 169 to<br />
202m depth) returned 6.08g/t Ag, 0.51g/t Au, 0.27%Pb and 0.60% Zn, with the last run (199 to<br />
202m) returning 13.90g/t Ag, 1,21g/t Au, 0.66% Pb and 1.5% Zn. Hole PO-10-036, drilled<br />
vertical from the same platform was anomalous in Au, Pb and Zn, although the grades were not<br />
as high as the ones obtained in hole PR-10-024 (the best interval is 18m wide associated with a<br />
hydrothermal breccia which occurs from 46 to 64m depth, returning 0.26gpt Au, 737ppm Pb and<br />
1040ppm Zn).<br />
<strong>Hudbay</strong> intends to continue to drill prospective area through the remainder of 2012.<br />
Figure 9-3: Pampacancha Prospect – Magnetic Halo Area<br />
Page | 92
Note: Drill intersections are core lengths and do not represent true thicknesses.<br />
Limestone Replacement Area<br />
The area of Au-Ag mineralized mantos hosted by limestones is located 1.3 km NNE of the<br />
central part of the Pampacancha “main body”, covering a prospective area of about 1,400 by 400<br />
metres. Surface samples collected in 2008 from the mineralized manto that crops out at the<br />
northern edge of <strong>Hudbay</strong>’s properties returned up to 33 g/t Au and 38 oz/t Ag. Structurally, the<br />
limestones are forming a northward-plunging anticline with gold-bearing structures located at<br />
both flanks, with a diorite intrusive emplaced at the anticline hinge, defining both an eastern and<br />
western-dipping sectors.<br />
Hole PR-10-027, completed in year 2010, was drilled vertical at the edge of this mineralized<br />
manto, intersecting silicified limestones and quartz-limonite (Mn and Fe oxides) structures from<br />
surface to <strong>43</strong> m depth, from where altered diorites and pyrite-bearing limestones occur to the<br />
end of hole. The first 7m (0-7m depth) returned 1.74 g/t Au and 9.77 g/t Ag; additionally, a 3m<br />
wide vein (from 106-109m) assayed 8.34 g/t Au. Hole PR-08-003, drilled in 2008, located 800m<br />
SSE of hole PR-10-027, returned 25.50 m (from 229.50 to 255.00 m, the end of hole) of 0.82 g/t<br />
Au.<br />
Preliminary results indicate strong potential for gold mineralization, and as such additional drilling<br />
is programmed to be carried out by <strong>Hudbay</strong> during 2012 in order to evaluate this prospective<br />
area.<br />
Page | 93
Figure 9-4: Pampacancha Prospect – Limestone Replacement Area<br />
PR-10-027<br />
7m @ 1.74gpt Au, 9.77gpt Ag (0-7m)<br />
3m @ 8.34gpt Au (106-109m)<br />
PR-08-002<br />
4.50m @ 1.17gpt Au, 5.20gpt Ag<br />
(144-148.50m)<br />
PR-08-003<br />
25.50m @ 0.82gpt Au<br />
(229.50-255m)<br />
Note: Drill intersections are core lengths and do not represent true thicknesses.<br />
9.3.2 CHILLOROYA SOUTH PROSPECT<br />
This area is located 5 km south of the Constancia porphyry. Evidence of porphyry-related Cu-Au<br />
Mo mineralisation and Cu-Au and Au-only bearing skarns occur in an area of about 3.5 by<br />
3.5 km coincident with several composite chargeability and magnetic anomalies at depth. Five<br />
primary targets were identified and were preliminarily drill-tested by Norsemont during year 2010.<br />
Page | 94
Target 1 – Quartz-limonite brecciated structures<br />
At the western sector of the Chilloroya South area, a series of roughly EW-oriented quartzlimonite<br />
brecciated structures hosted by feldspathic sandstones occur in an area of about 500 x<br />
500 m. On the hill crest oxidation and leaching of former sulphides have been strong, leaving<br />
limonite crusts and gossanous areas where former sulphides were massive. About 50 m down<br />
slope there are green and black copper shows on fractures in feldspathic sandstones, visible at<br />
only a few tens of centimetres below surface.<br />
Figure 9-5: Chilloroya South – Geological Map and Drilling Layout<br />
Note: Drill intersections are core lengths and do not represent true thicknesses.<br />
Of 152 rock samples taken from this area by Norsemont in 2009, 52% returned values from 0.1<br />
up to 7.84 g/t Au, 85% were anomalous in copper, returning from 70 ppm up to a maximum of<br />
1.33 % Cu and 40% were anomalous in molybdenum, with values in the order of 10 up to 446<br />
ppm Mo. This area is coincident with a magnetic high and an 800 x 900 m chargeability<br />
anomaly, the latter extending westward to an area covered by post-mineral quaternary deposits.<br />
Page | 95
Four holes were drilled by Norsemont during 2010, the deepest one being <strong>43</strong>6.90 m. Among the<br />
best intervals, hole SO-10-002, returned 57.65 m (from surface) @ 0.60gpt Au; and hole SO-10-<br />
003 returned 24 m (from surface) @ 0.95 % Cu and 0.19 g/t Au (copper mineralization<br />
associated mainly to supergene chalcocite). Hole SO-10-021, at 719.40m (Jan 8th, 2011), which<br />
was being drilled 400m east of hole SO-10-003, intercepted magnetite skarns from 478.55 m<br />
depth downward, locally cut by diorite, hydrothermal breccias and post-mineral andesites, with<br />
copper sulfides seen associated to several skarn intervals.<br />
The fact that skarns and relicts of former limestones were found below the clastic sediments of<br />
Chilloroya formation strongly suggests that the whole sedimentary sequence in the area of<br />
Chilloroya South would be overturned, enhancing the prospectiveness of the area to host<br />
additionally Cu-bearing skarns at depth.<br />
Target 2 – Quartz-Tourmaline Breccias<br />
One kilometre south of Target 1 there is a hill containing several SE-oriented quartz-tourmalinelimonite<br />
brecciated structures which occur in an area of 750 x 340 m. Evidence of multistage<br />
brecciation has been seen in outcrops, including massive quartz-tourmaline replacements,<br />
quartz-tourmaline-limonite (after sulphides) breccias and massive limonite (sulphides) brecciated<br />
structures, all of them hosted by feldspathic sandstones and siltstones of the Chilloroya<br />
formation. A total of 48 samples were collected in 2009 directly from the quartz-tourmaline<br />
breccias, where 79% were anomalous in gold, from 0.1 g/t Au up to 5.32 g/t Au; 65% anomalous<br />
in copper, from 71 ppm Cu up to 693 ppm Cu and 53% anomalous in molybdenum, from 8 ppm<br />
Mo to 75 ppm Mo. This area is coincident with a large, 1000 by 900 m chargeability anomaly at<br />
depth, partially coincident with a magnetic high.<br />
Three holes were drilled in this area by Norsemont during 2010, the deepest one to <strong>43</strong>2.25 m<br />
depth. Preliminary drilling suggests high-level evidences of porphyry system, evidenced by an<br />
alteration assemblage affecting the Chiloroya sediments consisting of quartz, pyrite, calcite,<br />
specularite, with also quartz-actinolite veinlets rimmed by K-feldspar at depth, as seen at the<br />
lower portion of hole SO-10-007. Tourmaline-bearing breccias were intercepted in two holes, SO-<br />
10-004 and SO-10-007 (300 m apart), interpreted to be peripheral to the centre of the pipe,<br />
which would be associated with a magnetic anomaly that remains untested.<br />
Target 3 – Felsic Porphyry Area<br />
Approximately 2 km to the northeast of the Target 2 area, a 2 m wide, SSW-oriented, quartzsericite-altered<br />
brecciated felsic porphyry is emplaced discordantly within fine-grained hornfelsed<br />
siltstones. The felsic porphyry is strongly altered, showing randomly-oriented quartz veinlets and<br />
carrying pyrite, chalcopyrite and bornite. Three samples taken from the porphyry in year 2009<br />
returned up to 2.1% Cu, 32 ppm Mo and 265 ppb Au. The porphyry is thought to be associated<br />
with a 500 x 700 m chargeability anomaly located right to the east of the porphyry outcrop.<br />
Six holes were drilled in this area by Norsemont during 2010. Preliminary results suggest strong<br />
evidence of deep-seated, porphyry-style mineralization. From hole SO-10-005 through holes SO-<br />
10-006 (drilled 220m east of hole SO-10-005) and SO-10-008 (drilled 370m SE of SO-10-005),<br />
alteration and mineralization evolved laterally from propylitic to weak potassic, clearly exposed at<br />
hole SO-10-008, where micro-veinlets of chalcopyrite, molybdenite, magnetite and K-feldspar,<br />
Page | 96
coupled with fairly anomalous copper values were seen from 400m depth down to the end of<br />
hole. Hydrothermal brecciation activity was also verified in this area, such as the 12 m-wide<br />
breccia observed at hole SO-10-006 (from 302 to 314m depth), which returned 0.74% Cu.<br />
Additionally, a Cu-bearing skarn layer was intercepted at holes SO-10-008 and SO-10-012, the<br />
latter drilled 185 m SSE of hole 008. At hole SO-10-008, 31.60 m interval (from 251.75 to<br />
283.35m depth) averaged 0.72% Cu, 6.0 g/t Ag and 0.29 g/t Au, whereas hole SO-10-012<br />
intercepted 24.70m (from 266.40 to 291.10m) of 0.29% Cu, 7.56 g/t Ag and 0.17 g/t Au. This<br />
skarn layer is still open at several directions.<br />
Page | 97
Figure 9-6: Chilloroya South – Target 3<br />
Note: Drill intersections are core lengths and do not represent true thicknesses.<br />
Apart from the evidence of mineralization seen in the prospect area, several copper and gold<br />
occurrences hosted by the Chilloroya sediments associated with shear zones and vein-like<br />
structures occur on surface and at depth in several parts of the prospect. For instance, on<br />
surface, at 500 m southwest of the felsic porphyry outcrop there is an open cut exposing green<br />
copper oxides with randomly-oriented chalcopyrite veinlets; mineralisation is not well exposed on<br />
surface, but starts to be clearly defined just 0.50 m below. Five samples taken from this area<br />
returned up to 1.49% Cu, 2.88 g/t Au and 521 ppm Mo. Three reverse circulation holes drilled<br />
between 500 and 800 m west of Target 3 intercepted significant Au and Ag values expected to be<br />
hosted by low-sulfidation epithermal veins. The best intervals were found in holes SR-10-006,<br />
which intercepted 3m (from 277 to 280m depth) of 13.7gpt Au; SR-10-005, with 3 m interval<br />
(from 307 to 310m) returning 2.33 g/t Au and 10.6 g/t Ag , and SR-10-009 which intercepted 6m<br />
(from 235 to 241m depth) averaging 29.3 g/t Ag and 0.29 g/t Au.<br />
Skarn Target 1<br />
This area is located at the northern edge of the Chilloroya South prospect, encompassing an<br />
area of 800 by 400m. Significant gold mineralization was returned from some holes drilled in this<br />
area, mainly associated with magnetite skarns and epithermal gold-bearing veins that are<br />
common in the area. The best intervals came from holes SR-10-010 which returned 84m @<br />
Page | 98
0.52gpt Au; SR-10-013 where 3m of bonanza gold values were intercepted from 136 to 139m<br />
assaying 242.56 g/t Au; and SO-10-016, with 42.90m of 0.54 g/t Au.<br />
Based on these encouraging results, additional drilling is planned to be carried out by <strong>Hudbay</strong><br />
during 2012 to properly evaluate the gold potential of this area.<br />
Figure 9-7: Chilloroya South – Skarn Target<br />
Note: Drill intersections are core lengths and do not represent true thicknesses.<br />
Page | 99
The evidence of mineralisation reported for Chilloroya South strongly suggests the presence of a<br />
large copper-gold-molybdenum system at depth. Excellent potential exists for the discovery of<br />
additional mineralisation of this style and/or porphyry copper-gold-molybdenum mineralisation in<br />
other phases of the porphyry bodies.<br />
Page | 100
10.0 DRILLING<br />
10.1 OVERVIEW<br />
As of 31 July 2012, a total of 197,621.35 m (785 holes) had been drilled at the Constancia<br />
Project (this includes 7,484.15 m drilled by Rio Tinto prior to 2005), in six drilling programs (infill,<br />
condemnation, metallurgical, geotechnical, hydrogeological and exploration).<br />
Drilling comprises both diamond drilling (core recovery) and reverse circulation (chip recovery).<br />
At Constancia, diamond drilling represents 90% of the total metreage.<br />
Diamond drilling constituted all the drilling until May 2008 when a RC rig started on the project.<br />
Since 2005, GEOTEC has been drilling on the property and during 2008 they had six rigs on site<br />
(four Longyear 44 and two UDR650 rigs). AK Drilling started operating in May 2008, using a<br />
Foremost Prospector 4x4 reverse circulation rig. MCA was the contractor for the geotechnical<br />
drilling between May 2008 and February 2009, operating one Atlas Copco CS-1000 rig. Since<br />
March 31 2009, two UDR 200-DLS of AK Drilling continued geotechnical drilling in the TMF<br />
facility until completion of this work in April 2009. In May 2009, a Barber Foremost DR24 rig of<br />
AK Drilling began drilling four large diameter water holes along the Chilloroya River and the<br />
surroundings of the Constancia pit.<br />
From November-December 2010, Perforaciones Del Peru drilled in Pampacancha with 2 drills,<br />
one a UDR 650 rig and the other a Longyear 44 rig. From June 2010-November 2011, 4 drill rigs<br />
were operating, two by Perforaciones Del Peru (the same as the previous year) and two oby AK<br />
Drilling, (a UDR 650 rig and, Sandvic E-710 model). Drilling continued this year with the two drill<br />
rigs operated by AK Drilling.<br />
Page | <strong>101</strong>
Table 10-1: Drilling Programmes by Year (in metres drilled)<br />
Company PQ HQ NQ RC HOLES TOTAL<br />
Rio Tinto (2003-2004) 7,124.80 359.35 24 7,484.15<br />
NOM 2005 9,799.05 41 9,799.05<br />
NOM 2006 20,026.80 377.60 66 20,404.40<br />
NOM 2007 23,863.75 5,197.35 77 29,061.10<br />
NOM 2008 3,380.75 39,502.45 7,374.60 12,792.70 219 63,050.50<br />
NOM 2009 4,487.45 113.65 409.00 33 5,010.10<br />
NOM 2010 16,604.05 1,933.20 7,694.00 93 26,231.25<br />
HB 2011 28,090.75 1,866.05 984.00 186 30,940.80<br />
HB 2012 5,045.04 130.76 464.70 46 5,640.50<br />
GRAND TOTAL 3,380.75 154,544.14 17,352.56 22,344.40 785 197,621.85<br />
General characteristics of the drilling programs carried out at Constancia are described below.<br />
• Constancia Infill Drilling (prefix CO): started prior to 2005 with the holes drilled by Rio<br />
Tinto and ended after December 2008, one hole was drilled in 2011 at west of San Jose<br />
Pit in a Titan anomaly area, totalling 110,383.00 m distributed in 321 holes (including<br />
7,484.15 m, 24 holes, drilled by Rio Tinto). All the metreage was diamond drilling.<br />
• Constancia Condemnation Drilling (CC-CR): Reverse Circulation (CR) started in May<br />
2008 and ended in September 2008. Drilling was carried out at the surroundings of the pit<br />
outline and sterilization of the plant facility locations, including the testing of some<br />
chargeability anomalies south of the Constancia pit outline; drilling totalled 8,751.70 m in<br />
54 holes. Diamond Drill condemnation holes (CC) were drilled in 2011-2012 carried out at<br />
Tailing Management Facilities, Waste Dump and Plant Site Facilities, drilling totalled<br />
5,729.10 m in 21 holes.<br />
Page | 102
• Constancia Metallurgical Drilling (CM): started in September 2008 and completed by<br />
mid-November 2008, twenty-one holes were drilled with PQ line totalling 3,380.75 m.<br />
allowed the collection of approximately 35 t of samples for metallurgical tests conducted in<br />
Chile. From August-September 2010, two more holes was drilled for zinc metallurgical<br />
testing, was drilled 691.45 m in two holes.<br />
• Constancia Geotechnical Drilling (CG): from May 2008 to July 2012 drilling was<br />
completed in the surroundings of the pit, the waste dump, tailing management facilities,<br />
camp site, haul rock and other facilities, totalling 10,903.70 m in 154 holes.<br />
• Constancia Hydrogeological Drilling (CH): from January 2009 to June 2012 3,816.45 m<br />
was drilled in 27 holes. Drilling was completed in the waste dump and TMF facility areas,<br />
and 9 large diameter holes (water holes) were completed along the Chilloroya River and at<br />
the Constancia pit.<br />
• Pampacancha Exploration-Infill Drilling (PO, PR): started in August 2008, exploration<br />
drilling continues at this time. A total of 144 holes were drilled, 28 being RC (7,090 m) and<br />
116 core drilling (33,336.90 m) totalling 40,426.90 m.<br />
• Pampacancha Geotechnical Drilling (PG): from May to June 2012, three holes were<br />
drilled for the pre-feasibility study of the Pampacancha deposit, totalling 726.80 m. These<br />
holes had two purposes: geotechnical and hydrogeological.<br />
• Chilloroya South Exploration (SO, SR): started in June 2010, exploration drilling was<br />
carried out at five targets. A total of 35 holes were drilled, 14 being RC (4,142 m) and 21<br />
core drilling (7,886.55 m) totalling 12,028.55 m.<br />
• Uchuccarco Exploration (UO): in January 2010 three diamond drill holes were drilled in<br />
a zone of magnetic anomaly totalling 783.45m.<br />
Page | 103
Table 10-2: Drilling Programmes (to 31 July 2012)<br />
PROGRAM COMPANY METERAGE HOLES STATUS<br />
Constancia Infill (CO) Rio Tinto/Norsemont/<strong>Hudbay</strong> 110,383.00 321 Completed<br />
Condemnation (CR,CC) Norsemont/<strong>Hudbay</strong> 14,480.80 75 Completed<br />
Metallurgical (CM) Norsemont 4,072.20 23 Completed<br />
Geotechnical Constancia (CG) Norsemont/<strong>Hudbay</strong> 10,903.70 154 Completed<br />
Geotechnical Pampacancha<br />
(PG)<br />
<strong>Hudbay</strong> 726.80 3 In Progress<br />
Hydrogeological (CH) Norsemont/<strong>Hudbay</strong> 3,816.45 27 Completed<br />
Pampacancha (PR,PO) Norsemont/<strong>Hudbay</strong> 40,426.90 144 In Progress<br />
Exploration (SO,SR,UO) Norsemont 12,812.00 38 In Progress<br />
TOTAL 197,621.85 785<br />
10.2 COLLAR LOCATION<br />
Drillhole locations are initially defined using hand-held GPS. The Drillhole collars and elevations<br />
are then surveyed by a surveyor every three months or as necessary. The instruments used<br />
accord with the date of the survey, with Total Station, and generally with differential GPS. All<br />
measurements are tied to the <strong>National</strong> Grid. UTM coordinates based on the Provisional South<br />
America 1956 (PSAD56) datum are used throughout the project.<br />
The collar survey procedures are, in general, according to best practices.<br />
10.3 RIG SET UP<br />
The borehole azimuth is set up by marking front and back sights with a Brunton compass. After<br />
the rig is set up, the azimuth is checked by the geologist. Inclination is measured with the<br />
inclinometer incorporated into the rig. Comparisons between the planned and downhole survey<br />
measurements (done between 5 to 20 m below the surface to allow for the casing) have shown<br />
variations under 0.5 o , with only one case being greater than 1 o .<br />
Page | 104
Since November 2007, the initial inclination has been measured with a more precise digital<br />
inclinometer, and the front and back sights are left in the field to be measured by the surveyors at<br />
a later date.<br />
Once the rig is positioned, the senior geologist on site approves the location and set-up. During<br />
the drilling, a <strong>Hudbay</strong>-appointed drilling supervisor checks the compliance with the drilling<br />
procedures. The same supervisor is responsible for the correct measurements of downhole<br />
surveys at the end of the drilling.<br />
10.4 DOWNHOLE SURVEY<br />
Downhole deviation surveying (showing both dip and azimuth) has been completed at<br />
reasonable intervals down the hole for most of the drillholes. <strong>Instrument</strong>s that have been used<br />
for this task are the Eastman Single Shot, Flexit and Maxibor. It is clear that measurements in<br />
the southern end, where magnetite is more common, should be repeated with a non-magnetic<br />
system. In the case of the photographic records (Eastman), these are read by the senior<br />
geologist, and entered into the database.<br />
Measurements not within range are flagged as invalid in the database. The Maxibor and Flexit<br />
data is delivered both electronically and in a printout. Flexit data contains measurements of the<br />
magnetic field intensity which is used to validate the data. All data is input into the database, and<br />
anomalous values are flagged as invalid.<br />
Flexit data has been collected at 30 m intervals since January 2007. Prior to this date, the<br />
measurements were made at 50 m intervals, proceeding upwards from the base of the hole. A<br />
final measurement is made just below the surface casing (5-20 m below surface). If, for any<br />
reason, the rods have to be removed prior to completion of the hole, then the hole is surveyed at<br />
that time as a safety measure.<br />
For Pampacancha, the downhole deviation surveying (showing both dip and azimuth) were<br />
measured at 3 m intervals down the hole using a Maxibor 2 instrument and were, recorded both<br />
electronically and in a hardcopy. All data is recorded in the database, and anomalous values are<br />
flagged as invalid.<br />
Page | 105
11.0 SAMPLE PREPARATION ANALYSES AND<br />
SECURITY<br />
Sample preparation, analysis and security procedures were reviewed and verified by Cashel<br />
Meagher (Qualified Person pursuant NI <strong>43</strong>-<strong>101</strong>) from the campaigns conducted on the<br />
Constancia Project through the documentation available in the 2005, 2006, 2007, and 2009<br />
<strong>Technical</strong> <strong>Report</strong>s. It is the opinion of the author that the sampling methodology, analyses and<br />
security measures are adequate for the compilation of data at Constancia and Pampacancha<br />
and such processes continue to be used by <strong>Hudbay</strong>.<br />
11.1 EXPLORATION CAMPAIGNS<br />
11.1.1 MITSUI AND MINERA KATANGA 1970-1980<br />
Company<br />
Mitsui and Minera Katanga<br />
Sample type<br />
Core<br />
Number of holes 48<br />
Number of samples<br />
Unknown<br />
Year 1970-1980<br />
Total meters drilled<br />
5,<strong>43</strong>0 m<br />
Collar survey<br />
None known<br />
Down-hole survey azimuth None known<br />
Down-hole survey dip None known<br />
Assay Lab<br />
None known<br />
QA/QC program<br />
None known<br />
Supervisor QA/QC<br />
None known<br />
Core recovery<br />
None known<br />
Blanks<br />
None known<br />
Duplicates<br />
None known<br />
Standards<br />
None known<br />
Total QA/QC<br />
None known<br />
Umpire lab<br />
Unknown<br />
Used in resource model No<br />
Comments<br />
Data excluded from the resource estimate<br />
11.1.2 RIO TINTO 2003 – 2004<br />
Company<br />
Rio Tinto<br />
Sample type<br />
Core<br />
Number of holes 24<br />
Number of samples<br />
3,413 submitted for assaying.<br />
Year 2003–2004<br />
Total meters drilled<br />
7,483.9 m<br />
Collar survey<br />
Hand GPS survey at time of drilling, checked by<br />
outsidecontractor in 2006. Not all holes were found in<br />
2006 by Norsemont staff<br />
Down-hole survey azimuth None known<br />
Page | 106
Down-hole survey dip Eastman single shot at the time of the drilling. Not all<br />
holes were surveyed<br />
Assay Lab<br />
ALS Chemex Lima<br />
QA/QC program<br />
Yes, 5% of samples submitted for assaying<br />
Supervisor QA/QC<br />
None known<br />
Core recovery<br />
Data exists, method of measurement unknown.<br />
Average 97.3%<br />
Blanks<br />
Yes, 1.5 % of the samples submitted for assaying<br />
Duplicates<br />
Unknown<br />
Standards<br />
Yes, 3.5 % of the samples submitted for assaying<br />
Total QA/QC<br />
Total 189 samples, 5.5% of samples stream<br />
Umpire lab<br />
Unknown<br />
Used in resource model Yes<br />
Comments<br />
Data for these holes are recorded in the Norsemont<br />
database. Drill cores were not relogged by Norsemont.<br />
11.1.3 NORSEMONT 2005<br />
Company<br />
Norsemont<br />
Sample type<br />
Core<br />
Number of holes 41<br />
Number of samples 5,460<br />
Year 2005<br />
Total meters drilled<br />
9,799.05 m<br />
Collar survey<br />
T&S<br />
Down-hole survey azimuth GEOTEC<br />
Down-hole survey dip GEOTEC<br />
Assay Lab<br />
ALS Chemex Lima<br />
QA/QC program<br />
Yes, 5% of samples submitted for assaying<br />
Supervisor QA/QC<br />
None known<br />
Core recovery<br />
Data exists, method of measurement unknown<br />
Blanks<br />
Yes, 4.1% of the samples submitted for assaying<br />
Duplicates<br />
Yes, 4.1% of the samples submitted for assaying<br />
Standards<br />
Yes, 2.4% of the samples submitted for assaying<br />
Total QA/QC<br />
Total 575 samples, 10.5% of Total samples<br />
Umpire lab<br />
Unknown<br />
Used in resource model Yes<br />
Comments<br />
Data included from the resource estimate<br />
11.1.4 NORSEMONT 2006 – 2007<br />
Company<br />
Norsemont<br />
Sample type<br />
Core<br />
Number of holes 1<strong>43</strong><br />
Number of samples 27,650<br />
Year 2006-2007<br />
Total meters drilled<br />
49,465.50 m<br />
Collar survey<br />
T&S<br />
Page | 107
Down-hole survey azimuth<br />
Down-hole survey dip<br />
Assay Lab<br />
QA/QC program<br />
Supervisor QA/QC<br />
Core recovery<br />
Blanks<br />
Duplicates<br />
Standards<br />
Total QA/QC<br />
Umpire lab<br />
Used in resource model<br />
Comments<br />
GEOTEC-Flexit<br />
GEOTEC-Flexit<br />
ALS Chemex Lima<br />
Yes, 5% of samples submitted for assaying<br />
None known<br />
Data exists, method of measurement unknown<br />
Yes, 3.9% of the samples submitted for assaying<br />
Yes, 3.6% of the samples submitted for assaying<br />
Yes, 3.2% of the samples submitted for assaying<br />
Total 2944 samples, 10.6% of Total samples<br />
Unknown<br />
Yes<br />
Data included from the resource estimate<br />
11.1.5 NORSEMONT 2008 – 2009<br />
Company<br />
Norsemont<br />
Sample type<br />
Core<br />
Number of holes 192<br />
Number of samples 33,701<br />
Year 2008-2009<br />
Total meters drilled<br />
59,625.95 m<br />
Collar survey<br />
Geosurvey<br />
Down-hole survey azimuth Bornav-Maxibor<br />
Down-hole survey dip Bornav-Maxibor<br />
Assay Lab<br />
ALS Chemex Lima-SGS Lima<br />
QA/QC program<br />
Yes, 5% of samples submitted for assaying<br />
Supervisor QA/QC<br />
Gaston Loyola<br />
Core recovery 98%<br />
Blanks<br />
Yes, 2.7% of the samples submitted for assaying<br />
Duplicates<br />
Yes, 2.7% of the samples submitted for assaying<br />
Standards<br />
Yes, 2.7% of the samples submitted for assaying<br />
Total QA/QC<br />
Total 2,726 samples, 8.1% of Total samples<br />
Umpire lab<br />
None known<br />
Used in resource model Yes<br />
Comments<br />
Data included from the resource estimate<br />
11.1.6 NORSEMONT 2010<br />
Company<br />
Norsemont<br />
Sample type<br />
Core<br />
Number of holes 86<br />
Number of samples<br />
Unknown<br />
Year 2010<br />
Total meters drilled<br />
24,536.90 m<br />
Collar survey<br />
Geosurvey<br />
Down-hole survey azimuth Bornav-Maxibor<br />
Down-hole survey dip Bornav-Maxibor<br />
Page | 108
Assay Lab<br />
SGS Lima<br />
QA/QC program<br />
Yes, 5% of samples submitted for assaying<br />
Supervisor QA/QC<br />
Gaston Loyola<br />
Core recovery 98%<br />
Blanks<br />
Yes, 2.8% of the samples submitted for assaying<br />
Duplicates<br />
Yes, 2.5% of the samples submitted for assaying<br />
Standards<br />
Yes, 2.6% of the samples submitted for assaying<br />
Total QA/QC<br />
Total 903 samples, 7.9% of Total samples<br />
Umpire lab<br />
Unknown<br />
Used in resource model Yes<br />
Comments<br />
Data included from the resource estimate<br />
11.1.7 HUDBAY 2011-2012<br />
Company<br />
<strong>Hudbay</strong><br />
Sample type<br />
Core<br />
Number of holes 82<br />
Number of samples 14,226<br />
Year 2011<br />
Total meters drilled<br />
24,333.20 m<br />
Collar survey<br />
Geosurvey<br />
Down-hole survey azimuth Bornav-Maxibor<br />
Down-hole survey dip Bornav-Maxibor<br />
Assay Lab<br />
SGS Lima<br />
QA/QC program<br />
Yes, 5% of samples submitted for assaying<br />
Supervisor QA/QC<br />
Carlos Salazar<br />
Core recovery 98%<br />
Blanks<br />
Yes, 2.8% of the samples submitted for assaying<br />
Duplicates<br />
Yes, 3.0% of the samples submitted for assaying<br />
Standards<br />
Yes, 2.6% of the samples submitted for assaying<br />
Total QA/QC<br />
Total 1,194 samples, 8.4% of Total samples<br />
Umpire lab<br />
Unknown<br />
Used in resource model Yes<br />
Comments<br />
Data included from the resource estimate<br />
11.2 CONSTANCIA<br />
11.2.1 BULK DENSITY<br />
A total of 1,247 density measurements have been made for 145 drill cores from the Constancia -<br />
San José area. The bulk density measurements were conducted by ALS Chemex with paraffin<br />
wax coat method.<br />
Samples for density measurement in each major rock unit were extracted, at approximately 50 m<br />
intervals and are representative of the different rock and mineralization domains recognized to<br />
date (Tables 11-1 and 11-2). In addition, Norsemont re-analyzed 281 samples in SGS as part of<br />
its QC program.<br />
Page | 109
Table 11-1: Summary of Density Samples by Mineralization Type<br />
Mineralization Type Count Average of Density<br />
(g/cm3)<br />
HY 979 2632<br />
LX 138 2381<br />
MX 34 2377<br />
OX 3 2403<br />
SG 93 2356<br />
Total 1247 2576<br />
Page | 110
Table 11-2: Summary of Density Samples by Mineralization Rock Type<br />
Rock Type Count Average of Density<br />
(g/cm3)<br />
MAR 70 2703<br />
AN 11 2514<br />
BXH 24 2738<br />
DIO 8 2514<br />
ESK 45 2734<br />
FA 36 2460<br />
MMP 34 2547<br />
MP1 786 2504<br />
MP2 111 2617<br />
PAN 1 2350<br />
QMP 23 2447<br />
SIL 7 2546<br />
SKN 80 3029<br />
SMS 4 4218<br />
SS 7 2<strong>43</strong>3<br />
Total 1247 2576<br />
Page | 111
11.2.2 SAMPLE PREPARATION AND ASSAYING<br />
During the resource estimate update documented in Section 14 of this <strong>Technical</strong> <strong>Report</strong>, all the<br />
documentation available from the 2005 to 2009 <strong>Technical</strong> <strong>Report</strong>s about sample preparation,<br />
analysis and security procedures were reviewed and verified by <strong>Hudbay</strong>.<br />
Previous sample preparation and assaying, used in the resource estimation made by GRD<br />
Minproc –in Norsemont 2009 Definitive Feasibility Study, was carried out by ALS Chemex in<br />
Peru until June 2008, after which SGS Peru continued with this work with similar procedures.<br />
Samples were prepared and analyzed in Lima following standard procedures.<br />
Samples were routinely analyzed for gold (Fire Assay, AAS finish,30 g charge) and 41<br />
elements by Inductively Coupled Plasma - Atomic Emission Spectroscopy (ICP-AES) with<br />
HNO3-HClO4-HF-HCl digestion, HCl Leach. Samples above detection limit were analyzed by<br />
Atomic Absorption Spectrophotometry (AAS).<br />
All samples with copper values above 0.2% were analyzed by a Sequential Copper Method.<br />
Regarding the previous drilling campaign made by Rio Tinto (2003-2004), the samples were<br />
analyzed for gold (Fire Assay, AAS finish, 30 g charge, 47 elements (multiacid digestion and ICP<br />
MS - ICP AES determination).<br />
All the samples were also analyzed with multiacid digestion and AAS (AA62, ALS code) for Cu.<br />
The same method was also applied to some samples for Mo, Ag and a few for Zn, when they<br />
reached the upper detection limit.<br />
Sequential copper data was not available for Rio Tinto’s campaign. According to Rio Tinto<br />
Exploration <strong>Report</strong> from 2004, limited Cu soluble analysis (CN leach) was performed over<br />
selected intervals when chalcocite was described as the main Cu bearing mineral.<br />
11.2.3 DATABASE INTEGRITY<br />
The database integrity procedures described from the documentation available in <strong>Technical</strong><br />
<strong>Report</strong>s (2005 – 2009) were reviewed. All lithological, alteration, geotechnical and mineralization<br />
data was logged on paper logs that were later entered in spreadsheets from where they were<br />
imported into the database.<br />
It was noted that the data entry spreadsheets had a number of built-in logical checks to improve<br />
the validity of the database. As was mentioned in Norsemont 2009 Definitive Feasibility Study,<br />
the geological and sample data was verified by a senior geologist before importing into a<br />
database.<br />
Assay data was delivered in digital form by the main laboratory. Checks for inconsistent values<br />
were made by the senior geologist before, data was uploaded.<br />
<strong>Hudbay</strong> checked collar positions visually on plans for correctness in the data entry. Down-hole<br />
surveys were checked by examining coarse changes in the variables. Check runs were at<br />
regular intervals to check consistency of the drilling data.<br />
Page | 112
A random revision from the lithology and mineralization log data and assay certificates from 27<br />
drill holes. Discrepancies were not identified between the log data and assay certificates and the<br />
drill hole database of text files used for the mineral resource estimate.<br />
11.3 PAMPACANCHA<br />
11.3.1 BULK DENSITY MEASUREMENTS<br />
A total of 56 density measurements were taken from actual core for the Pampacancha deposit.<br />
The density measurements were conducted by ALS Chemex and are representative of the<br />
different rock and mineralization domains recognized to date.<br />
The measurement methodology applied to core samples was as follows:<br />
1. Weigh dry core sample in air (W1).<br />
2. Cover the core sample with wax, to avoid absorption of water in the core sample<br />
during immersion.<br />
3. Weigh core sample covered with wax in air (W2).<br />
4. Immerse core sample covered with wax in water-filled tub avoiding the water<br />
overflowing the tub.<br />
5. Measure displaced water volume (V1).<br />
Density is calculated using the formula below:<br />
Density = W1 / (V1 – (W2 – W1/Density Wax))<br />
11.3.2 SAMPLE PREPARATION<br />
All samples were sent to SGS for preparation and assaying. The laboratory conforms to ISO/IEC<br />
17025 and ISO 9002 standards.<br />
Samples arriving at SGS were crushed in oscillating jaw crushers to 90% passing 10 mesh<br />
(1.70mm). Samples were riffle split and a 250g sample pulverized. Ring- mill pulverizers grind<br />
samples to 95% passing 150 mesh (106 micron). Crushers, riflers, and pans are cleaned with<br />
compressed air between samples. Pulverizing pots and rings are brushed, hand cleaned, and air<br />
blown. The remaining crushed core samples (coarse reject) not used for assay analysis and<br />
pulps were sent to Abil Corporacion warehouse located in Lima for storage.<br />
The sample preparation, analyses and security procedures are considered to be industry<br />
standard and are adequate and acceptable.<br />
11.3.3 ASSAY METHODOLOGY<br />
All samples were analyzed by SGS laboratory through Inductively Coupled Plasma – Atomic<br />
Emission Spectrometry (ICP-AES) after multi-acid digestion and gold was determined by fire<br />
assay with Atomic Absorption Spectroscopy (AAS). SGS is currently registered with ISO/IEC<br />
17025 and ISO 9002 accreditation.<br />
Page | 113
Samples were analyzed by 32 elements through ICP-AES (ICP40B Lab Code) after multi-acid<br />
digestion of a 0.20 g of sample. If silver, copper, iron, molybdenum, lead and zinc values rise<br />
above upper limit indicated in Table 11.1, then that element is re-assayed using AAS after multiacid<br />
digestion of 0.25 g of sample. Gold was analyzed by AAS after fire assay using 30 g of<br />
sample (FAA313 Lab Code) and values greater than 5000 ppb were re-assayed using a<br />
gravimetric finish. All analytical balances are certified annually by a third party. Check weights<br />
are used daily to verify calibration of balances. All metal standards used to make the calibration<br />
standards for the AAS and ICP are certified and traceable. Each is received with a certificate of<br />
analysis.<br />
Table 11-3: SGS Assay Limits<br />
Element Au Ag Cu Fe Mo Zn Pb<br />
Unit ppb ppm ppm % ppm ppm ppm<br />
Methodology<br />
Code<br />
FAA31<br />
3<br />
ICP40<br />
B<br />
ICP40B ICP40B ICP40B ICP40B ICP40B<br />
Detection Limit 5 0.2 0.5 0.01 1 0.5 2<br />
Upper Limit 5000 100 10000 15 10000 10000 10000<br />
11.3.4 BLANKS<br />
During the drilling, blanks were inserted into the sample stream as per geologist instruction at<br />
approximate intervals of every 30 samples. Blank material consisting of barren quartz was<br />
certified by three laboratories (INSPEC, CIMM and SGS) to be inert material with no metal value<br />
grade.<br />
11.3.5 STANDARDS<br />
Standard references were prepared with material obtained from the Pampacancha deposit by<br />
<strong>Hudbay</strong> and were analyzed and certified by Acmelabs, as shown in Table 11.2. A total of 336<br />
standards were inserted when logging the core every 30 sample intervals. Their values are<br />
identified in Table 11-4.<br />
Page | 114
Table 11-4: Standard References Used by <strong>Hudbay</strong><br />
Standard Reference Number of<br />
samples<br />
Au<br />
(ppb)<br />
Ag<br />
(ppm)<br />
Cu<br />
(ppm)<br />
Mo<br />
(ppm)<br />
Zn<br />
(ppm)<br />
STD-010 102 19 1.3 2055 102 93<br />
STD-020 117 66 2.4 5177 111 120<br />
STD-030 117 79 58 9986 180 192<br />
11.3.6 DUPLICATES<br />
As part of the Pampacancha drilling, duplicates were obtained by splitting half core samples,<br />
obtaining two quarter core sub-samples, one quarter representing the original sample and the<br />
other quarter representing the duplicate sample. These samples were collected to assess the<br />
homogeneity of the mineralization and sampling precision. In total 453 duplicates were inserted<br />
every 30 samples.<br />
11.3.7 CHECK ASSAYING<br />
No pulp material was check assayed at another laboratory. It is recommended by the author of<br />
this sectopn of the <strong>Technical</strong> <strong>Report</strong> that 5% of the samples should be sent for check assaying in<br />
future campaigns.<br />
Page | 115
12.0 DATA VERIFICATION<br />
A report of the Constancia data verification process was conducted by Amec Peru on behalf of<br />
<strong>Hudbay</strong>. Data Verification was reviewed and approved by Cashel Meagher (Qualified Person<br />
pursuant NI <strong>43</strong>-<strong>101</strong>) from the campaigns conducted on the Constancia Project. It is the opinion<br />
of the author that the quality of the data is suitable for use in resource calculations.<br />
12.1 CONSTANCIA<br />
12.1.1 NORSEMONT QC PROTOCOL<br />
The Quality Control (QC) protocol during the Constancia exploration campaigns from 2006 to<br />
2010 included the insertion of the following control samples in the sample batches:<br />
• Twin samples (Core) or field duplicates (RC): one in 20 samples<br />
• CRMs: one in 20 samples; four CRMs are inserted in alternate order.<br />
• Blanks: one in 20 samples<br />
The twin samples, field duplicates, coarse blanks and Certified Reference Materials (CRMs)<br />
were inserted on the drill site prior to submission to the laboratory.<br />
Furthermore, Norsemont inserted the other controls listed below:<br />
• Pulp duplicates were routinely analyzed by the laboratory. These samples are<br />
good indicators of the assay reproducibility (precision), although they were not<br />
blind for the laboratory, and their value was therefore diminished. These are<br />
inserted at a proportion of 1 in 20.<br />
• Coarse duplicates (or preparation duplicates) were taken after the first crushing<br />
to provide information about the sub-sampling variance, which is introduced<br />
during the preparation process. Although, they were not submitted to the same<br />
laboratory as the original, and their value was therefore diminished. These are<br />
inserted at a proportion of 1 in 20.<br />
• Check samples (same pulp externally analyzed) were resubmitted to an external<br />
laboratory (ACME and Inspectore). These samples are used to estimate the<br />
assay accuracy, together with the standards. These are submitted at a<br />
proportion of 1 in 20.<br />
12.1.2 QC EVALUATION<br />
Twin Samples<br />
Twin samples are obtained by splitting half core samples, obtaining two quarter core subsamples,<br />
one quarter representing the original sample and the other quarter representing the<br />
duplicate sample. Norsemont inserted a total of 1,952 twin samples in batches during the drill<br />
campaigns they operated between 2005 and 2011.<br />
This data was processed using the hyperbolic method. The sampling procedure is considered<br />
to be acceptable if the proportion of failures (failure rate) does not exceed 10% using as a<br />
Page | 116
failure limit the y 2 =m 2 x 2 +b 2 hyperbola evaluated for a 30% relative error 1 (RE). The failure<br />
rates for Cu, Mo, Zn and Ag ranged between 7% and 16% (Table 3-7).<br />
The author concludes that Norsemont’s core sampling procedure was reasonable for Mo and Ag.<br />
However, the frequency of twin sample failures for Cu and Zn was greater than expected,<br />
indicating sampling issues for copper and zinc, two of the most important metals in the resource<br />
model.<br />
Some outliers are evident from sample mix-ups and the author recommends a review of the<br />
database to address these issues (Figure 12-1). After the database revision, the sampling<br />
precision should be analyzed again expecting an improvement in the failure rates for the<br />
elements evaluated.<br />
Table 12-1: Summary of Twin Samples<br />
Failures<br />
Element No. of Samples No. %<br />
Cu 1,952 314 16%<br />
Mo 1,952 145 7%<br />
Zn 1,952 285 15%<br />
Ag 1,952 131 7%<br />
Figure 12-1: Cu in Twin Samples<br />
Page | 117
1 Relative error: calculated as the absolute value of the pair difference divided by the pair<br />
average, and expressed in percentage; also known as Absolute Value of the Relative<br />
Difference, or AVRD.<br />
Field Duplicates<br />
Norsemont inserted a total of 51 field duplicates in batches from RC holes. The failure rates for<br />
Cu, Mo, Zn and Ag in samples ranged between 0% and 8% (Table 12.2). Therefore, the author<br />
concludes that Norsemont RC sampling precision was reasonable for these metals.<br />
Table 12-2: Summary of Field Duplicates<br />
Element No. of Samples No. Failures % Failures<br />
Cu 51 4 8%<br />
Mo 51 1 2%<br />
Zn 51 3 6%<br />
Ag 51 0 0%<br />
CRMs<br />
Norsemont used Certified Reference Materials (CRMs) prepared by SGS and ACME<br />
laboratories from coarse rejects from previous drilling campaigns at Constancia.<br />
To evaluate the accuracy of assaying using CRMs, AMEC excludes the outliers, values located<br />
outside the AV±3*SD interval (AV, SD: average value and standard deviation, respectively,<br />
calculated from the actual assay values of the inserted standards), and calculates the analytical<br />
bias as:<br />
Bias (%) = (AVeo / BV) – 1<br />
where AVeo represents the average recalculated after the exclusion of the outliers, and BV is the<br />
Best Value calculated as a result of round-robin tests. Accuracy is assessed according to the<br />
following bias ranges: good: between -5% and +5%; questionable: from -5% to -10% or from<br />
+5 to +10%; and unacceptable: below -10% or above 10%.<br />
The CRM dataset includes 1,807 assays of 18 Certified Reference Materials (CRMs). The<br />
results of the evaluation of 12 CRMs are presented in Table 12.3. Cu, Mo, Zn and Ag show<br />
reasonable accuracies for most CRMs with biases between -3.9% and 4.5% and low<br />
Page | 118
proportions of outliers. However, the GQ601195 CRM with best values of 7,383.6 ppm for Cu<br />
and 65 ppm for Mo shows high biases, which are 9% and 6.1% respectively.<br />
On the basis of these results, the author concludes that the Cu, Mo, Zn and Ag<br />
accuracies at ALS Chemex during the 2006 to 2008 campaigns were generally within reasonable<br />
ranges for the CRMs reviewed.<br />
Page | 119
Table 12-3: Summary of CRM Values and Performance<br />
ALS Chemex<br />
CRM (Code) Parameters Cu Mo Zn Ag<br />
GQ601193 (2006)<br />
BV * (ppm)<br />
2,452.4<br />
86.0<br />
---<br />
---<br />
Average (ppm)<br />
2,426.5<br />
85.6<br />
---<br />
---<br />
Number of Samples<br />
98<br />
---<br />
---<br />
Outliers<br />
1<br />
1<br />
---<br />
---<br />
Bias (%)<br />
-1.2<br />
-0.5<br />
---<br />
---<br />
GQ601194 (2006)<br />
BV* (ppm)<br />
5,165.7<br />
319<br />
---<br />
---<br />
Average (ppm)<br />
5,084.3<br />
317.4<br />
---<br />
---<br />
Number of Samples<br />
97<br />
---<br />
---<br />
Outliers<br />
0<br />
0<br />
---<br />
---<br />
Bias (%)<br />
-1.6<br />
-0.5<br />
---<br />
---<br />
GQ601195 (2006)<br />
BV* (ppm)<br />
7,383.6<br />
65<br />
---<br />
---<br />
Average (ppm)<br />
8,051.7<br />
---<br />
---<br />
Number of Samples<br />
95<br />
---<br />
---<br />
Outliers<br />
2<br />
1<br />
---<br />
---<br />
Bias (%)<br />
9<br />
6.1<br />
---<br />
---<br />
GQ601196 (2006)<br />
BV* (ppm)<br />
12,500<br />
159<br />
---<br />
---<br />
Average (ppm)<br />
12,495<br />
156.8<br />
---<br />
---<br />
Number of samples<br />
99<br />
---<br />
---<br />
Outliers<br />
2<br />
1<br />
---<br />
---<br />
Bias (%)<br />
0<br />
-1.3<br />
---<br />
---<br />
Page | 120
ALS Chemex ALS Chemex ALS<br />
Chemex<br />
ALS Chemex ALS Chemex ALS<br />
Chemex<br />
MV600011 (2006-2007)<br />
BV* (ppm)<br />
2,052<br />
74<br />
---<br />
---<br />
Average (ppm)<br />
2,084.1<br />
72.3<br />
---<br />
---<br />
Number of Samples<br />
55<br />
---<br />
---<br />
Outliers<br />
1<br />
1<br />
---<br />
---<br />
Bias (%)<br />
1.6<br />
-2.4<br />
---<br />
---<br />
MV600013 (2006-2007)<br />
BV* (ppm)<br />
5,052<br />
127<br />
---<br />
---<br />
Average (ppm)<br />
4,962.50<br />
129.5<br />
---<br />
---<br />
Number of Samples<br />
45<br />
---<br />
---<br />
Outliers<br />
1<br />
1<br />
---<br />
---<br />
Bias (%)<br />
-1.8<br />
2<br />
---<br />
---<br />
BV* (ppm) 7,503 81 --- ---<br />
Page | 121
ALS Chemex ALS Chemex ALS<br />
Chemex<br />
ALS<br />
Chemex<br />
ALS Chemex<br />
ALS<br />
Chemex<br />
MV600014 (2006-<br />
2007)<br />
Average (ppm)<br />
7,562<br />
79.3<br />
---<br />
---<br />
Number of<br />
Samples<br />
54<br />
---<br />
---<br />
Outliers<br />
Bias (%)<br />
1<br />
0.8<br />
0<br />
-2.0<br />
---<br />
---<br />
---<br />
---<br />
MV600015 (2006-<br />
2007)<br />
BV* (ppm)<br />
24,476<br />
120<br />
---<br />
---<br />
Average (ppm)<br />
24,652<br />
120.2<br />
---<br />
---<br />
Number of<br />
Samples<br />
51<br />
---<br />
---<br />
Outliers<br />
Bias (%)<br />
1<br />
0.7<br />
0<br />
0.1<br />
---<br />
---<br />
---<br />
---<br />
MV700038 (2007-<br />
2008)<br />
BV* (ppm)<br />
1,972<br />
106<br />
294<br />
5.9<br />
Average (ppm)<br />
1960.6<br />
103.5<br />
302.9<br />
6.2<br />
Number of<br />
Samples<br />
289<br />
Outliers<br />
Bias (%)<br />
11<br />
-0.6<br />
8<br />
-2.4<br />
13<br />
3<br />
2<br />
5.1<br />
MV700039 (2007-<br />
2009)<br />
BV* (ppm)<br />
5,039<br />
106<br />
751<br />
4<br />
Average (ppm)<br />
4,916.90<br />
78.1<br />
774.1<br />
4.1<br />
Number of<br />
Samples<br />
311<br />
Outliers<br />
2<br />
1<br />
2<br />
Page | 122
ALS Chemex ALS Chemex ALS<br />
Chemex<br />
ALS<br />
Chemex<br />
ALS Chemex<br />
ALS<br />
Chemex<br />
Bias (%) -2.4 2.8 3.1 4<br />
2.9<br />
MV700040 (2007-<br />
2008)<br />
BV* (ppm)<br />
7,406<br />
65<br />
2,317<br />
15.1<br />
Average (ppm)<br />
7,201.60<br />
62.4<br />
2,323.60<br />
15.7<br />
Number<br />
Samples<br />
Outliers<br />
Bias (%)<br />
of<br />
1<br />
0.1<br />
251<br />
1<br />
-3.9<br />
1<br />
0.3<br />
1<br />
4.5<br />
MV700041 (2007-<br />
2008)<br />
BV* (ppm)<br />
25,013<br />
121<br />
2,317<br />
15.1<br />
Average (ppm)<br />
25,033.20<br />
118.5<br />
2,323.60<br />
15.7<br />
Number<br />
Samples<br />
Outliers<br />
Bias (%)<br />
of<br />
1<br />
0.1<br />
190<br />
0<br />
-2.1<br />
1<br />
0.3<br />
1<br />
4.5<br />
Blanks<br />
Coarse blanks are coarse samples of barren material, which provide information about the<br />
possible contamination during preparation. Coarse blanks should be prepared immediately after<br />
highly mineralized samples.<br />
The report considers possible contamination issues if the blank value exceeds five times the<br />
detection limit for the element, and/or if a definite, positive rapport is observed between the blank<br />
grade and the grade of the preceding sample.<br />
Page | 123
A total of 2,119 coarse blanks were included in regular submission batches. The results<br />
of the evaluation of the four main blanks used during the Norsemont drill programs are<br />
presented in Table 12-4. There are few a examples of Cu and Mo possible contamination.<br />
These revision and evaluation were verified and approved by <strong>Hudbay</strong>, under the supervision of<br />
Cashel Meagher, P Geo (Qualified Person pursuant to NI <strong>43</strong>-<strong>101</strong>).<br />
Page | 124
Table 12-4: Summary of Blank Values<br />
Blank (Code) Element No. of Samples No. Failures %<br />
Cu<br />
45<br />
5.5%<br />
Mo<br />
813<br />
20<br />
2.5%<br />
Zn<br />
13<br />
1.6%<br />
GQ601663 (2006-<br />
2007)<br />
Ag<br />
7<br />
0.9%<br />
Cu<br />
7<br />
6.9%<br />
Mo<br />
<strong>101</strong><br />
1<br />
1.0%<br />
Zn<br />
5<br />
5.0%<br />
MV700670 (2007-<br />
2008)<br />
Ag<br />
1<br />
1.0%<br />
Cu<br />
14<br />
3.1%<br />
Mo<br />
450<br />
15<br />
3.3%<br />
Zn<br />
13<br />
2.9%<br />
ST800006 (2008)<br />
Ag<br />
1<br />
0.2%<br />
Cu<br />
37<br />
12.2%<br />
Mo<br />
304<br />
50<br />
16.4%<br />
Zn<br />
3<br />
1.%<br />
ST800039 (2008-<br />
2010)<br />
Ag<br />
1<br />
0.3%<br />
Page | 125
The report concludes that the preparation process at ALS Chemex produced no significant Cu,<br />
Mo, Zn and Ag contamination in most of the blanks evaluated. However, the material ST800039<br />
used during 2008 to 2010 campaigns showed failure rates which exceed10% for Cu and Mo<br />
elements.<br />
The report recommends to check the database to address the failure samples, and check the<br />
ST800039 blank to clarify if the blank was not adequate or there were contamination issues<br />
during these campaigns.<br />
Check Samples<br />
The report reviewed 388 samples submitted for external control to ACME in 2007, which acted<br />
as secondary laboratory for the 2006 and part of the 2007 campaigns.<br />
For evaluating the check samples, Reduction-to-Major-Axis (RMA) plots are<br />
constructed for the studied elements. The RMA method offers an unbiased fit for two sets of pair<br />
values (original samples and check samples) that are considered independent from each other.<br />
In this case, the coefficient of determination R2 between the two laboratories is determined, and<br />
the bias of the primary laboratory for each element as compared to the secondary laboratory is<br />
calculated as:<br />
Bias (%) = 1- RMAS<br />
Where RMAS is the slope of the RMA regression line of the secondary laboratory values<br />
versus the primary laboratory values for each element.<br />
The RMA analysis carried out over 389 check samples from part of the 2006-2007 campaign<br />
analyzed by ACME in 2007. The RMA plot indicates good fits for Cu (0.988 R2), Mo (0.974<br />
R2), Zn (0.994 R2) and Ag (0.92 R2) after the exclusion of four outliers for Mo (1.0%), two<br />
outliers for Zn (0.5%), and eight outliers for Ag (3.8%), and reassembles values of the relative<br />
bias 2.4%, 9.7%, 1.2% and 7.9%, respectively (Figure 12-2).<br />
The report concluded that the accuracy of ALS for Cu, Mo, Zn and Ag, as compared to ACME,<br />
was adequate. Although, the report recommends verification of the accuracy of ACME using<br />
CRMs, if the CRMs were analyzed with the check samples.<br />
Page | 126
Figure 12-2: Cu in Check Samples - ACME vs. ALS<br />
Norsemont also submitted 620 check samples from part of the 2006-2007 and 2008-2009<br />
campaigns to Inspectorate in 2009, which acted as secondary laboratory.<br />
AMEC, under the supervision of the author, noted that the samples were submitted and assayed<br />
twice at Inspectorate and the analytical precision of Cu, Mo, Zn and Ag was evaluated. The<br />
precision of the Inspectorate assays was found to be poorer than acceptable so they were<br />
rejected for use as check assays (Figure 12-3).<br />
Page | 127
Figure 12-3: Cu in Check Samples - Inspectorate vs. Inspectorate<br />
The author emphasizes that the objective of the external verification program is to increase<br />
confidence in the accuracy of the primary laboratory; therefore, the selection of a referee<br />
laboratory with good precision and accuracy is crucial. Furthermore, the analytical methods of<br />
the secondary laboratory should be as similar as possible to the methods used by the primary<br />
laboratory. Finally, the check sample batches should include controls as pulp duplicates,<br />
CRMs and pulp blanks, meant to assess analytical precision, analytical accuracy and assay<br />
contamination at the secondary laboratory.<br />
12.1.3 SITE VISIT<br />
As part of updating the resource model, as requested by <strong>Hudbay</strong>, AMEC Senior Geologists<br />
Waldo Arias, Rosario Basurto and Angelica Torres made a site visit to the core shack in the<br />
district of Saylla, province of Cusco from April 04th to April 08th, 2011. While on site, AMEC and<br />
the <strong>Hudbay</strong> geologists reviewed drill core at the core shack in order to evaluate the consistency<br />
Page | 128
of the core logging. Nineteen drill holes were reviewed to understand the lithology, alteration and<br />
the mineralization domains; and ten drill cores were reviewed to identify the rock quality and<br />
various geotechnical issues for the pit design. This job also covers the review of metallurgical<br />
sampling in order to make recommendations for a work program to bring the existing database<br />
and implementations up to industry best practices where necessary.<br />
12.1.4 CORE REVIEW<br />
Average core recovery was 95.9% (Figure 12-4) with the vast majority of recoveries greater than<br />
90%. To ensure there were no issues with recovery within mineralised zones, this was checked<br />
also (Figure 12-5); average core recovery in mineralised zones was 96.3%, with a large majority<br />
of recoveries greater than 90%.<br />
Figure 12-4: Core Recovery<br />
Figure 12-5: Core Recovery Distribution in Mineralised Samples<br />
Page | 129
12.2 PAMPACANCHA<br />
12.2.1 QUALITY ASSURANCE / QUALITY CONTROL<br />
<strong>Hudbay</strong> submitted a total of 15,932 samples from 110 drill holes to SGS’s laboratory for analysis.<br />
In addition to these samples, 471 blanks, 336 reference standards and 486 duplicates were<br />
submitted.<br />
The author’s opinion is that the data verification is adequate for the purposes used in this<br />
<strong>Technical</strong> <strong>Report</strong>.<br />
Blanks<br />
A total of 471 blank non-mineralized quartz samples were submitted by <strong>Hudbay</strong> to test for crosscontamination<br />
from sample to sample during crushing and pulp separation. These samples<br />
yielded copper values between 0.00 and 10 ppm; gold values between 0.00 to 5 ppb; silver<br />
values between 0.00 and 0.5 ppm; zinc values between 0.00 and 10 ppm and molybdenum<br />
values between 0.00 and 5 ppm.<br />
Standards<br />
The reference standards certified by Acmelabs were assayed by SGS. Of the 336 copper<br />
standards submitted for assaying, 124 of the assays fell outside the lower standard deviation<br />
indicating possible subestimation of copper content, as shown in Figures 12-6 to 12-8. Only one<br />
sample returned a value above the upper standard deviation limits.<br />
The gold standards assayed at SGS showed a good comparison (Figures 12-9 to 12-11) for<br />
standards STD-020 and STD-030 with only one returned value outside the upper standard<br />
deviation limits. Standard STD-010 assayed mainly above the expected value, with 12 values<br />
assaying above the upper standard deviation limit and one value below the lower standard<br />
deviation limit.<br />
Page | 130
Figure 12-6: Reference Materials for Pampacancha Drilling – Copper Standard-010<br />
2400<br />
STD-010 - Cu<br />
2300<br />
2200<br />
2100<br />
ppm<br />
2000<br />
1900<br />
1800<br />
1700<br />
1600<br />
PO-09-006<br />
PO-09-007<br />
PO-09-008<br />
PO-09-009<br />
PO-09-011<br />
PO-09-013<br />
PO-09-014<br />
PO-10-015<br />
PO-10-016<br />
PO-10-017<br />
PR-10-017<br />
PR-10-019<br />
PR-10-021<br />
PO-10-018<br />
PO-10-019<br />
PO-10-020<br />
PO-10-021<br />
PO-10-023<br />
PO-10-023<br />
PO-10-029<br />
PR-10-023<br />
PR-10-025<br />
PR-10-027<br />
PO-10-033<br />
PO-10-036<br />
PO-10-039<br />
PO-10-041<br />
PO-10-044<br />
PO-10-046<br />
PO-10-046<br />
PO-11-048<br />
PO-11-050<br />
PO-11-051<br />
PO-11-052<br />
PO-11-053<br />
PO-11-055<br />
PO-11-057<br />
PO-11-058<br />
PO-11-059<br />
PO-11-061<br />
PO-11-061<br />
PO-11-062<br />
PO-11-063<br />
PO-11-065<br />
PO-11-068<br />
PO-11-068<br />
PO-11-069<br />
PO-11-070<br />
PO-11-071<br />
PO-11-072<br />
PO-11-074<br />
Expected value 2* Deviation Standard 3* Deviation Standard<br />
Figure 12-7: Reference Materials for Pampacancha Drilling – Copper Standard-020<br />
6000<br />
5800<br />
5600<br />
5400<br />
5200<br />
5000<br />
4800<br />
4600<br />
4400<br />
4200<br />
4000<br />
3800<br />
3600<br />
STD-020 - Cu<br />
PO-09-006<br />
PO-09-007<br />
PO-09-008<br />
PO-09-010<br />
PO-09-011<br />
PO-09-012<br />
PO-09-014<br />
PO-10-015<br />
PO-10-016<br />
PR-10-021<br />
PR-10-025<br />
PO-10-016<br />
PO-10-018<br />
PO-10-019<br />
PO-10-021<br />
PO-10-021<br />
PO-10-024<br />
PO-10-025<br />
PO-10-026<br />
PO-10-027<br />
PO-10-028<br />
PO-10-029<br />
PO-10-030<br />
PO-10-035<br />
PO-10-036<br />
PO-10-036<br />
PO-10-038<br />
PO-10-041<br />
PO-10-0<strong>43</strong><br />
PO-10-044<br />
PO-10-045<br />
PO-10-046<br />
PO-10-046<br />
PO-11-047<br />
PO-11-048<br />
PO-11-049<br />
PO-11-051<br />
PO-11-053<br />
PO-11-055<br />
PO-11-055<br />
PO-11-057<br />
PO-11-058<br />
PO-11-059<br />
PO-11-059<br />
PO-11-061<br />
PO-11-063<br />
PO-11-065<br />
PO-11-067<br />
PO-11-068<br />
PO-11-069<br />
PO-11-070<br />
PO-11-072<br />
PO-11-073<br />
PO-11-075<br />
PO-11-076<br />
PO-11-079<br />
PO-11-082<br />
PO-11-083<br />
PO-11-085<br />
Expected value 2* Deviation Standard 3* Deviation Standard<br />
Page | 131
Figure 12-8: Reference Materials for Pampacancha Drilling – Copper Standard-020<br />
10600<br />
10400<br />
10200<br />
10000<br />
ppm<br />
9800<br />
9600<br />
9400<br />
9200<br />
9000<br />
8800<br />
8600<br />
8400<br />
8200<br />
8000<br />
STD-030 - Cu<br />
PO-09-006<br />
PO-09-009<br />
PO-09-011<br />
PO-09-012<br />
PO-09-014<br />
PO-10-015<br />
PO-10-015<br />
PO-10-017<br />
PO-10-017<br />
PO-10-019<br />
PO-10-024<br />
PO-10-027<br />
PO-10-032<br />
PO-10-036<br />
PO-10-037<br />
PO-10-040<br />
PO-10-041<br />
PO-10-044<br />
PO-10-045<br />
PO-11-047<br />
PO-11-047<br />
PO-11-049<br />
PO-11-050<br />
PO-11-052<br />
PO-11-052<br />
PO-11-054<br />
PO-11-054<br />
PO-11-056<br />
PO-11-057<br />
PO-11-057<br />
PO-11-058<br />
PO-11-060<br />
PO-11-062<br />
PO-11-064<br />
PO-11-065<br />
PO-11-067<br />
PO-11-068<br />
PO-11-068<br />
PO-11-069<br />
PO-11-072<br />
PO-11-073<br />
PO-11-075<br />
PO-11-076<br />
PO-11-077<br />
PO-11-078<br />
PO-11-079<br />
PO-11-081<br />
PO-11-083<br />
PO-11-083<br />
PO-11-085<br />
PO-11-085<br />
PO-11-086<br />
PO-11-086<br />
PO-11-084<br />
PO-11-087<br />
PO-11-087<br />
PO-11-088<br />
PO-11-089<br />
PO-11-090<br />
Expected value 2* Deviation Standard 3* Deviation Standard<br />
Figure 12-9: Reference Materials for Pampacancha Drilling – Gold Standard-010<br />
30<br />
STD-010 - Au<br />
25<br />
20<br />
15<br />
10<br />
5<br />
0<br />
PO-09-006<br />
PO-09-007<br />
PO-09-008<br />
PO-09-009<br />
PO-09-011<br />
PO-09-013<br />
PO-09-014<br />
PO-10-015<br />
PO-10-016<br />
PO-10-017<br />
PR-10-017<br />
PR-10-019<br />
PR-10-021<br />
PO-10-018<br />
PO-10-019<br />
PO-10-020<br />
PO-10-021<br />
PO-10-023<br />
PO-10-023<br />
PO-10-029<br />
PR-10-023<br />
PR-10-025<br />
PR-10-027<br />
PO-10-033<br />
PO-10-036<br />
PO-10-039<br />
PO-10-041<br />
PO-10-044<br />
PO-10-046<br />
PO-10-046<br />
PO-11-048<br />
PO-11-050<br />
PO-11-051<br />
PO-11-052<br />
PO-11-053<br />
PO-11-055<br />
PO-11-057<br />
PO-11-058<br />
PO-11-059<br />
PO-11-061<br />
PO-11-061<br />
PO-11-062<br />
PO-11-063<br />
PO-11-065<br />
PO-11-068<br />
PO-11-068<br />
PO-11-069<br />
PO-11-070<br />
PO-11-071<br />
PO-11-072<br />
PO-11-074<br />
Expected value 2* Deviation Standard 3* Deviation Standard<br />
Page | 132
Figure 12-10: Reference Materials for Pampacancha Drilling – Gold Standard-020<br />
90<br />
STD-020 - Au<br />
80<br />
70<br />
ppm<br />
60<br />
50<br />
40<br />
PO-09-006<br />
PO-09-007<br />
PO-09-008<br />
PO-09-010<br />
PO-09-011<br />
PO-09-012<br />
PO-09-014<br />
PO-10-015<br />
PO-10-016<br />
PR-10-021<br />
PR-10-025<br />
PO-10-016<br />
PO-10-018<br />
PO-10-019<br />
PO-10-021<br />
PO-10-021<br />
PO-10-024<br />
PO-10-025<br />
PO-10-026<br />
PO-10-027<br />
PO-10-028<br />
PO-10-029<br />
PO-10-030<br />
PO-10-035<br />
PO-10-036<br />
PO-10-036<br />
PO-10-038<br />
PO-10-041<br />
PO-10-0<strong>43</strong><br />
PO-10-044<br />
PO-10-045<br />
PO-10-046<br />
PO-10-046<br />
PO-11-047<br />
PO-11-048<br />
PO-11-049<br />
PO-11-051<br />
PO-11-053<br />
PO-11-055<br />
PO-11-055<br />
PO-11-057<br />
PO-11-058<br />
PO-11-059<br />
PO-11-059<br />
PO-11-061<br />
PO-11-063<br />
PO-11-065<br />
PO-11-067<br />
PO-11-068<br />
PO-11-069<br />
PO-11-070<br />
PO-11-072<br />
PO-11-073<br />
PO-11-075<br />
PO-11-076<br />
PO-11-079<br />
PO-11-082<br />
PO-11-083<br />
PO-11-085<br />
Expected value 2* Deviation Standard 3* Deviation Standard<br />
Figure 12-11: Reference Materials for Pampacancha Drilling – Gold Standard-030<br />
110<br />
STD-030 - Au<br />
100<br />
90<br />
ppb<br />
80<br />
70<br />
60<br />
50<br />
PO-09-006<br />
PO-09-009<br />
PO-09-011<br />
PO-09-012<br />
PO-09-014<br />
PO-10-015<br />
PO-10-015<br />
PO-10-017<br />
PO-10-017<br />
PO-10-019<br />
PO-10-024<br />
PO-10-027<br />
PO-10-032<br />
PO-10-036<br />
PO-10-037<br />
PO-10-040<br />
PO-10-041<br />
PO-10-044<br />
PO-10-045<br />
PO-11-047<br />
PO-11-047<br />
PO-11-049<br />
PO-11-050<br />
PO-11-052<br />
PO-11-052<br />
PO-11-054<br />
PO-11-054<br />
PO-11-056<br />
PO-11-057<br />
PO-11-057<br />
PO-11-058<br />
PO-11-060<br />
PO-11-062<br />
PO-11-064<br />
PO-11-065<br />
PO-11-067<br />
PO-11-068<br />
PO-11-068<br />
PO-11-069<br />
PO-11-072<br />
PO-11-073<br />
PO-11-075<br />
PO-11-076<br />
PO-11-077<br />
PO-11-078<br />
PO-11-079<br />
PO-11-081<br />
PO-11-083<br />
PO-11-083<br />
PO-11-085<br />
PO-11-085<br />
PO-11-086<br />
PO-11-086<br />
PO-11-084<br />
PO-11-087<br />
PO-11-087<br />
PO-11-088<br />
PO-11-089<br />
PO-11-090<br />
Expected value 2* Deviation Standard 3* Deviation Standard<br />
Page | 133
Check Assaying<br />
Despite having no duplicates’ pulps check assayed in another laboratory, the geologist routinely<br />
inserted duplicate core samples to check the homogeneity of the mineralization and sampling<br />
precision. In total, 453 duplicated were inserted, approximately every 30 samples. Figures 12-12<br />
through 12-16 display a comparison of the original copper, gold, silver, zinc and molybdenum<br />
assays and the duplicate assays. The comparison shows good correlation of 0.94 for copper,<br />
0.89 for molybdenum and 0.75 for silver and low correlation of 0.17 for gold and 0.45 for zinc.<br />
The copper and silver shows dispersion on duplicates core samples over the 1,000 ppm and 8<br />
ppm, respectively. The poor correlation for gold and zinc is based on a few outlier samples and<br />
once removed the relationship greatly improves. The poor correlation may be a result of the<br />
variable nature of the gold and zinc mineralization. Further check assaying of the gold and zinc<br />
values should be completed for future drill programs.<br />
Figure 12-12: Comparison of Original Assay and Duplicate Analysis by Copper<br />
Page | 134
Figure 12-13: Comparison of Original Assay and Duplicate Analysis by Gold<br />
Figure 12-14: Comparison of Original Assay and Duplicate Analysis by Silver<br />
Page | 135
Figure 12-15: Comparison of Original Assay and Duplicate Analysis by Zinc<br />
Page | 136
Figure 12-16: Comparison of Original Assay and Duplicate Analysis by Molybdenum<br />
+20%<br />
-20%<br />
12.2.2 SITE VISIT<br />
Arnaldo Zamorano, a <strong>Hudbay</strong> resource geologist from the Santiago office visited the<br />
Pampacancha deposit between November 08 to 11, 2011 to conduct a personal site inspection<br />
and become familiar with conditions on the property, to observe the geology and mineralization<br />
and verify the work completed on the property as part of the mineral resource estimation and<br />
technical report process.<br />
12.2.3 CORE REVIEW<br />
Visits to the core facility at the Constancia camp site were conducted for core review and<br />
verification of mineralization.<br />
12.2.4 DRILLING DATABASE<br />
Confidence Limit (±20%) Linear 1:1<br />
An internal validation of the drill hole database against the original drill logs and assay certificate<br />
information was carried out by <strong>Hudbay</strong>. The validation included 100% of the assay values from<br />
the Pampacancha drilling. No significant discrepancies existed within the database and it is<br />
believed to be accurate and suitable for mineral resource estimation.<br />
Page | 137
13.0 MINERAL PROCESSING AND METALLURGICAL<br />
TESTING<br />
13.1 SAMPLES<br />
The grade, geography, spatial location, lithology, alterations and copper mineralization were<br />
considered in all stages of sample selection. Consequently, the samples used for Constancia<br />
development are considered to be representative of that ore to the feasibility study level of detail,<br />
whereas the samples used for Pampacancha are considered to be representative of that deposit<br />
domain to the pre-feasibility study level of detail. No major ore types have been identified that<br />
have not been sampled and tested.<br />
13.2 CONSTANCIA<br />
The following provides a summary of the Constancia metallurgical testwork. Details were<br />
reported previously in the following report:<br />
Norsemont Mining Inc. CONSTANCIA COPPER PROJECT Definitive Feasibility Study <strong>Technical</strong><br />
<strong>Report</strong> NI <strong>43</strong>-<strong>101</strong> Revision 0 28 September 2009<br />
13.2.1 CONSTANCIA METALLURGICAL PHASE I<br />
Constancia Metallurgical Phase I was carried out during 2007 by Plenge Laboratories in Lima<br />
and flotation variability tests by SGS in Canada. Sample sets selected for metallurgical testing<br />
were fresh quarter core samples collected from diamond drill holes drilled during 2006.<br />
Three master composites were produced, denominated Hypogene (HY), Supergene (SG) and<br />
Skarn (SK) composites.<br />
The flotation program consisted of collector rougher evaluation (A-5100, A-7518, A-3418, A-<br />
3894, A-3302, A-404, Z-6) with Z-14 as a secondary collector, primary grinding evaluation (76,<br />
106, 150, 212 and 250 µm), rougher pH evaluation (neutral, 9, 10 and 11) and regrinding size<br />
evaluation (127, 76, 37 and 20 µm). Evaluation of sodium cyanide in the cleaner circuit to<br />
depress pyrite and locked cycle test for optimal conditions were also performed. For composite<br />
SK rougher pH was not evaluated (was considered pH 9)<br />
13.2.2 CONSTANCIA METALLURGICAL PHASE II<br />
Constancia Metallurgical Phase II flotation testwork was carried out during 2008 by Plenge<br />
Laboratories in Lima, comminution tests and mineralogical analysis through SGS Chile and<br />
flotation variability tests by SGS in Canada.<br />
Three master composites were produced, denominated Hypogene (PHY), Supergene (PSG) and<br />
Skarn (PSK) composites.<br />
The flotation program consisted of collector rougher evaluation (A-3302, A-3477) with Z-14 as<br />
the secondary collector, primary grinding evaluation (76, 106, 125, 212 and 250 µm), rougher pH<br />
evaluation (neutral and 9) and regrinding size evaluation (<strong>43</strong>, 35, 27 and 18 µm). Evaluation of<br />
sodium cyanide, zinc sulfate and bisulfite in the cleaner circuit to depress pyrite and finally<br />
Page | 138
locked cycle test for optimal conditions were also performed. Additionally, for composite PHY, the<br />
froth skimming rate and molybdenum collector (Diesel) was also evaluated. For composite PSK,<br />
zinc sulfate and bisulfite in the rougher circuit to depress pyrite were also tested.<br />
For comminution testwork, Bond rod mill work index tests reported values in the range from 10.9<br />
to 14.3 kWh/t and Bond ball mill work index tests reported values in the range from 11.2 to 15.8<br />
kWh/t which means that the orebody is a medium hard material. SAG power index tests reported<br />
values in the range from 39.8 to 75.2 min, Minnovex crushability index tests reported values in<br />
the range from 15 to 29, Bond abrasion index tests reported values in the range from 0.09 to<br />
0.17 g, which means that the orebody is a moderately abrasive material, and specific gravity<br />
reported values in the range from 2.75 to 3.66.<br />
13.2.3 CONSTANCIA METALLURGICAL PHASE III<br />
The Norsemont definitive feasibility study metallurgical test program was designed to provide<br />
process parameters that could be used in the design of the Constancia plant. 13 supergene (SG)<br />
samples, 9 skarn – medium zinc samples, 4 skarn – high zinc samples, 19 hypogene (HY)<br />
samples and 6 mixed samples were tested. All the tests were performed at SGS Chile.<br />
Mineralogy from each variability sample was determined. The average main copper mineral<br />
distribution for the supergene samples indicated that 63% of the copper present was<br />
chalcopyrite, with chalcocite (23%), bornite (10%) and covellite (2%) making up the majority of<br />
the remainder. For the hypogene samples copper was present predominantly as chalcopyrite,<br />
representing approximately 90% of the sample. Minor copper minerals included chalcocite (8%)<br />
and bornite (2%). For the combined skarn samples, copper was present predominantly as<br />
chalcopyrite, representing approximately 90% of the sample. Minor copper minerals included<br />
chalcocite (7%) and bornite (3%).<br />
In comminution testing, SG was classified as the least competent ore type at Constancia with an<br />
80th percentile DWi of 3.7 kWh/m 3 . In terms of ore hardness for ball milling, SG was in the<br />
middle of the range with an 80th percentile BWiof 13.1 kWh/t. The average abrasion index for<br />
SG ore samples was in the medium range at Ai = 0.1146 g. HY was classified as the most<br />
competent ore type at Constancia with an 80th percentile DWi of 7.5 kWh/m3. In terms of ore<br />
hardness for ball milling, HG was also the hardest with an 80th percentile BWiof 16.3 kWh/t. The<br />
average abrasion index for HG samples was also the highest, Ai = 0.1863 g. There were eight<br />
(8) comminution samples representing soft skarn and three (3) representing hard skarn. Soft<br />
skarn was classified as the least competent ore type at Constancia with an 80th percentile DWi<br />
of 3.8 kWh/m 3 . In terms of ore hardness for ball milling, skarn was the softest with an 80th<br />
percentile BWi of 10.6 kWh/t. Hard skarn was classified as moderately competent with an 80th<br />
percentile DWi of around 6.0 - 7.5 kWh/m 3 . In terms of ore hardness for ball milling, hard skarn<br />
was classified as slightly harder than soft skarn with an 80th percentile BWiof around 11.6 kWh/t.<br />
The average abrasion index for skarn samples was also the lowest, Ai = 0.0659 g.<br />
Composite flotation test work was undertaken to determine the optimum operating conditions for<br />
being treated in the processing plant. The test program involved determination of lime addition to<br />
achieve a range of pH values, the optimum primary cyclone overflow size (d 80 ), frother and<br />
collector type, pH and rougher flotation residence time. These optimum conditions were then<br />
used to generate rougher concentrate for cleaner evaluation tests. Once both rougher and<br />
Page | 139
cleaner conditions were determined, locked cycle tests were conducted to indicate plant<br />
performance.<br />
For SG, composite conditions were a primary grind d 80 of 106 µm, using 30 g/t collector at pH<br />
10.0 with 10 minutes for flotation rougher residence time and three stages of cleaning with a<br />
regrind d 80 of 37 µm at pH 11.5. The locked cycle test results indicate that when treating<br />
predominantly supergene ore through the concentrator, a concentrate grade of 29.6% Cu can be<br />
achieved with a copper recovery of 86% and a molybdenum recovery of 53%. A recovery of 71%<br />
of the zinc to the cleaner concentrate would also occur without a depression strategy but the<br />
concentrate would still be saleable without the need for depression. Variability test for individual<br />
SG samples were performed using the primary grinding and rougher flotation conditions of the<br />
locked cycle test. Significant variation was seen in both copper and molybdenum feed grades.<br />
This variation exhibited itself in a widely fluctuating rougher concentrate grade, with rougher<br />
recoveries being more robust. The average copper recovery was 89% (standard deviation =<br />
8%), with an average molybdenum recovery of 75% (standard deviation = 11%).<br />
For the HY composite, conditions were a primary grind d 80 of 75 µm, using collector 30 g/t at pH<br />
10.0 with 10 minutes for flotation rougher residence time and three stages of cleaning with a time<br />
regrind of 8 minutes atpH 11.5. The locked cycle test results indicate that when treating<br />
predominantly hypogene ore through the concentrator, a concentrate grade of 23.4% Cu can be<br />
achieved with a copper recovery of 88% and a molybdenum recovery of 75.4%. Variability test<br />
for individual HY samples were performed using the primary grinding and rougher flotation<br />
conditions of the locked cycle test. Significant variation was seen in both copper and<br />
molybdenum feed grades. The average copper recovery was 90% (standard deviation = 9%),<br />
with an average molybdenum recovery of 83% (standard deviation = 8%). Grinding to 75 µm<br />
produced a 7% increase in rougher copper recovery and an 11% increase in rougher<br />
molybdenum recovery with a lower percentage variation in results.<br />
For medium-zinc skarn, composite conditions were a primary grind d 80 of 106 µm, using collector<br />
30 g/t at pH 10.0 with 10 minutes for flotation rougher residence time and three stages of<br />
cleaning with a time regrind of 4 minutes at pH 11 and 11.5. The locked cycle test results indicate<br />
that when treating predominantly medium-zinc skarn ore through the concentrator with no<br />
depressant use, a concentrate grade of 22.8% Cu can be achieved with a copper recovery of<br />
90% and a molybdenum recovery of 56%. It was expected that with the use of zinc depressants,<br />
copper concentrates of 26% copper, with less than 5% zinc will be achievable, at a copper<br />
recovery of approximately 85%.<br />
For high-zinc skarn, composite conditions were a primary grind d 80 of 106 µm, using collector 30<br />
g/t at pH 9.0 with 10 minutes for flotation rougher residence time and three stages of cleaning<br />
with a time regrind of 4 minutes at pH 11. The locked cycle test results indicate that when<br />
treating predominantly high grade zinc skarn ore through the concentrator with no depressant<br />
use, a concentrate grade of 19% Cu can be achieved with a copper recovery of 86% and a<br />
molybdenum recovery of 33%. It was expected that with the use of zinc depressants, copper<br />
concentrates of 28% copper, with less than 5% zinc will be achievable, at a copper recovery of<br />
approximately 65%.<br />
GRDM Minproc elected not to perform any “skarn only” variability testing.<br />
Page | 140
A pilot plant circuit was performed in SGS Chile. Column concentrate grades for copper and zinc<br />
and lead and molybdenum during the duration of the pilot plant campaign were as follows:<br />
copper grade varied between 24% Cu and 29% Cu; Zinc content in the concentrate varied from<br />
4% to 5%; with lead grades varying 0.6% Pb to 1.0% Pb. During the pilot plant operation,<br />
samples of rougher concentrate were composited to allow IsaMill test grinds to be conducted.<br />
Samples of copper/molybdenum concentrate and tailings were settled to determine respective<br />
thickener requirements. All column concentrate samples were collected during the pilot plant<br />
campaign for filtration test. Typically this was concentrate with greater than 25% Cu and less<br />
than 0.15% Mo. These samples were then filtered in a Larox laboratory pressure filter.<br />
Copper/molybdedum concentrate produced in the pilot plant was transferred to SGS Chile<br />
laboratories to undertake a bench scale molybdenum rougher circuit evaluation. Tests were<br />
conducted with 10 g/t kerosene and several NaHS addition rates. A series of five first<br />
cleaner/cleaner scavenger tests were conducted for cleaner circuit evaluation but molybdenum<br />
grade recovery curve exhibited an inverted profile. Subsequent modeling by GRDM was used to<br />
project the 55% Mo recovery and 40% Mo concentrate grade prediction.<br />
13.2.4 IMPACT OF DELETERIOUS ELEMENTS<br />
Constancia concentrates are not expected to be penalized for elements such as As, Cd, Sb or<br />
Bi.<br />
However, there are substantial amounts of zinc, predominantly in skarn domains, that could<br />
produce high zinc copper concentrates that would be penalized by the smelter.<br />
There are three strategies which will be considered to manage this phenomenon during<br />
operations:<br />
1. Very high grade zinc and medium or low grade copper ore will be sent to waste;<br />
2. High zinc and high copper ore will not be mixed with supergene ore at the mill,<br />
avoiding zinc activation and reducing zinc recovery; and<br />
3. Low grade zinc and high grade copper will be treated normally<br />
The result is expected to be that Constancia will produce a commercial concentrate that may be<br />
subject to minor penalties for zinc.<br />
13.3 FLOTATION PRODUCTS STUDIES<br />
The main products of the flotation process using Constancia conditions copper concentrate and<br />
total tailings (a mix of rougher tailings and cleaner scavenger) were tested for thickening,<br />
filtration, and tailings transport.<br />
Two studies were performed by Ausenco Brazil and Pocock EEUU. For the first stage of this<br />
study, a composite formed with archived Constancia ore samples (12% SG, 21% SK and 67%<br />
HY) was used to generate the main products using a locked cycle test with Constancia flotation<br />
conditions. The tailings products were sent to Ausenco PSI Canada for a tailings transport study<br />
and the copper concentrate was sent to Pocock for thickening and a filtration study.<br />
For the second stage of this study, two composites formed with remaining Constancia ore<br />
samples and were used to generate a tailings product (a mix of rougher tailings and cleaner<br />
Page | 141
tailings) using an open cycle test with Constancia flotation conditions. The tailings were sent to<br />
Ausenco PSI Canada for TMF study and to Pocock for thickening and a filtration study.<br />
Results were used to confirm equipment selection by Ausenco.<br />
Additionally, samples from locked a cycle test were generated and sent to Pocock (USA) and<br />
Ausenco (Brazil) for rheology studies.<br />
13.4 PAMPACANCHA PFS TESTWORK<br />
Pampacancha is a resource that was delineated during the Constancia feasibility study phase,<br />
and its development is only at the pre-feasibility study phase.<br />
The principal development philosophy was to assume that the Constancia plant, process and<br />
reagents would be used to treat Pampacancha ore. However, the mineralization and rock types<br />
at Pampacancha were found to be different to those at Constancia and consequently it may be<br />
necessary to develop a different regime for this domain.<br />
13.4.1 PHASE 1<br />
Preliminary metallurgical tests on Pampacancha samples were performed by SGS in 2012. The<br />
objective of Phase 1 testwork was to provide comminution and flotation design information for<br />
the Pampacancha resource. Phase 1 included mineralogical analysis through SGS Chile and<br />
comminution and flotation test by SGS Perú. Phase 1 involved head assay, specific gravity,<br />
natural pH determination, preliminary rougher flotation reagent screening and pH on flotation<br />
performance. Locked cycle tests were conducted using the standard Constancia regime and<br />
some attempts at optimization.<br />
The core samples selected for Pampacancha metallurgical testwork were fresh quarter core<br />
samples collected from diamond drill holes drilled from 2008 to 2011. Samples with Skarn<br />
lithology and Hypogene lithology were considered representative for the Pampacancha deposit.<br />
There was some concern about the age of the samples as oxidation of the samples may impact<br />
flotation results. Three master composites for comminution testing and two additional master<br />
composites for flotation testing were produced.<br />
Page | 142
Comminution<br />
Preliminary comminution test, SAG Power Index (SPI), Abrasion Index (Ai) and Bond Ball Work<br />
Index (BWi), were conducted by SGS Peru, results are shown in Table 13-1.<br />
Table 13-1: Phase 1: Comminution Results<br />
Comminution Parameters Unit Value<br />
SAG Power Index<br />
Range Min 59.3 - 93.6<br />
Bond Abrasion Index<br />
Range g 0.0772 – 0.1160<br />
Bond Ball Work Index<br />
Range kW-h/t 12.1 – 13.0<br />
Page | 1<strong>43</strong>
Locked Cycle Test<br />
Revised conditions for two composites were a primary grind P80 of 106 µm, using a collector<br />
dosage of 30 g/t A-3302 and 10 g/t A-404 at a pH of 9.5 with rougher flotation time of 10 min, a<br />
regrind P80 of 25 µm and three stages of cleaning at a pH of 11.<br />
Locked cycle test results are shown in Table 13-2, a concentrate grade from 19.6 to 21.6% Cu<br />
with a recovery from 78.6 to 79.2% Cu were achieved.<br />
Table 13-2: Phase 1: Locked Cycle Test Results – Revised Conditions<br />
Composite Grade Recovery<br />
Cu,<br />
Fe,<br />
Au,<br />
Ag,<br />
S,<br />
Cu,<br />
Fe,<br />
Au,<br />
Ag,<br />
S,<br />
%<br />
%<br />
g/t<br />
g/t<br />
%<br />
%<br />
%<br />
%<br />
%<br />
%<br />
PMC01 19.6 25.4 9.95 174 22.7 78.6 2.36 61 61.6 56<br />
PMC02 21.6 24.4 18.1 207 25 79.2 2.85 72.6 68.4 60.6<br />
Constancia project conditions for two composites were a primary grind P80 of 106 µm, using a<br />
single collector dosage of 30 g/t A-3302 at a pH of 10 with rougher flotation time of 10 min, a<br />
regrind P80 of 25 µm and three stages of cleaning at a pH of 11.5. Results are shown in (Table<br />
13-3).<br />
Table 13-3: Phase 1: Locked Cycle Test Results – Constancia Project Conditions<br />
Composite Grade Recovery<br />
Cu,<br />
Fe,<br />
Au,<br />
Ag,<br />
S,<br />
Cu,<br />
Fe,<br />
Au,<br />
Ag,<br />
S,<br />
%<br />
%<br />
g/t<br />
g/t<br />
%<br />
%<br />
%<br />
%<br />
%<br />
%<br />
PMC01 26.6 26.9 13.3 223 26.1 77.5 2.01 59.6 61.6 47.1<br />
PMC02 21.9 22.3 21.9 203 23 79.9 2.58 76.7 62.9 53.2<br />
Flotation Variability Test<br />
Using the optimal rougher conditions, fifteen samples were floated to determine the effect of the<br />
variability on rougher flotation. The head grades were in the range from 0.36 to 1.89% Cu. The<br />
Page | 144
variability flotation test was a kinetic flotation for several times (0, 1, 2, 4, 8, 12 and 18 min). The<br />
results of the variability test are shown in (Table 13-4).<br />
In the Phase 1 variability test, rougher concentrate recoveries were in the range from 81.2 to<br />
93.5% Cu, 7.85 to 21.1% Fe, 75.8 to 93% Au and 65.9 to 88.4% Ag.<br />
Page | 145
Table 13-4: Phase 1: Rougher Variability Testing Results<br />
ID<br />
Head Calculated Rougher Grade Rougher Recovery<br />
Sample<br />
Cu<br />
%<br />
Au<br />
g/t<br />
Ag<br />
g/t<br />
Fe<br />
%<br />
Cu<br />
%<br />
Au<br />
g/t<br />
Ag<br />
g/t<br />
Fe<br />
%<br />
Cu<br />
%<br />
Au<br />
g/t<br />
Ag<br />
g/t<br />
Fe<br />
%<br />
Mass<br />
Pull<br />
%<br />
PMS-01 1.19 0.53 4.40 35.7 5.91 2.71 19.7 26.8 84.7 86.7 76.7 12.8 17.1<br />
PMS-03 0.68 0.25 3.92 11.3 2.96 1.13 14.1 11.8 88.2 90.2 72.7 21.1 20.1<br />
PMS-04 0.88 0.33 8.91 33.7 3.71 1.37 34.3 25.6 91.1 88.3 83.2 16.4 21.6<br />
PMS-05 0.49 0.42 8.20 12.8 2.13 1.73 33.0 11.2 90.1 84.8 83.5 18.2 20.7<br />
PMS-06 0.72 1.03 7.93 35.6 4.07 6.03 40.7 26.3 89.8 93.0 81.3 11.7 15.8<br />
PMS-07 1.05 0.22 6.23 39.0 4.44 0.83 22.0 29.5 88.0 78.1 73.7 15.7 20.8<br />
PMS-08 1.89 0.89 6.20 41.4 9.38 4.05 23.9 30.5 90.9 83.2 70.7 13.5 18.3<br />
PMS-09 0.93 0.34 2.65 48.6 7.18 2.42 15.0 32.9 89.5 81.7 65.9 7.85 11.6<br />
PMS-10 0.93 0.30 13.1 36.1 5.56 1.49 70.5 28.1 92.4 76.5 83.4 12.1 15.5<br />
PMS-11 0.36 0.26 2.98 12.2 1.58 1.10 10.9 10.6 81.2 77.5 68.3 16.3 18.7<br />
PMS-13 0.83 1.10 21.2 21.8 3.42 4.71 83.0 19.4 89.6 92.8 85.2 19.4 21.7<br />
PMS-15 0.62 0.57 9.26 17.4 2.48 2.29 35.3 15.5 86.0 86.2 81.6 19.1 21.4<br />
PMS-16 0.84 0.42 4.36 32.0 4.64 2.19 20.5 20.8 93.5 88.2 80.0 11.0 17.0<br />
PMS-17 0.92 0.39 6.47 24.0 3.63 1.35 20.5 21.6 87.3 75.8 70.0 19.9 22.1<br />
PMS-18 0.72 0.46 5.29 17.9 3.37 1.98 23.8 15.4 91.2 84.6 88.4 16.9 19.6<br />
Page | 146
ID<br />
Head Calculated Rougher Grade Rougher Recovery<br />
Sample<br />
Cu<br />
%<br />
Au<br />
g/t<br />
Ag<br />
g/t<br />
Fe<br />
%<br />
Cu<br />
%<br />
Au<br />
g/t<br />
Ag<br />
g/t<br />
Fe<br />
%<br />
Cu<br />
%<br />
Au<br />
g/t<br />
Ag<br />
g/t<br />
Fe<br />
%<br />
Mass<br />
Pull<br />
%<br />
Average 0.87 0.50 7.40 28.0 4.30 2.36 31.2 21.7 88.9 84.5 77.6 15.5 18.8<br />
Mineralogy<br />
QemSCAN, analysis type PMA, was conducted on the Locked Cycle Test (LCT) head stream for<br />
the two composites to determine the mineral assemblage. The copper occurrence for PMC01<br />
was mainly chalcopyrite (70.1%), bornite (27.9%) and chalcocite (1.06%). For PMC02, copper<br />
occurrence was mainly chalcopyrite (73.1%), bornite (22.0%) and enargite - tennantite (2.27%).<br />
Table13-5 reports QemSCAN modal analysis results.<br />
Table 13-5: Phase 1: Mineralogical analysis (Mineral Mass %)<br />
<strong>Minerals</strong> PMC-01 PMC-02<br />
Chalcopyrite 11.20 10.29<br />
Chalcocite/Covellite 0.23 0.48<br />
Bornite 2.81 1.98<br />
Enargite/Tennantite 0.11 0.29<br />
Pyrite 4.66 3.64<br />
Pyrrhotite 0.16 0.08<br />
Molybdenite 0.03 0.69<br />
Sphalerite 1.23 1.41<br />
Galena 0.35 0.45<br />
Page | 147
<strong>Minerals</strong> PMC-01 PMC-02<br />
Quartz 9.75 13.32<br />
Plagioclase 0.73 1.00<br />
K-Feldspar 3.39 3.91<br />
Biotite 4.61 2.99<br />
Amphibole 3.11 4.24<br />
Pyroxene 1.39 1.26<br />
Tourmaline 0.88 1.15<br />
Other Silicates 0.09 0.08<br />
Muscovite/Sericite 0.86 1.32<br />
Chlorite 10.31 5.04<br />
Albite 0.06 0.23<br />
Epidote 0.16 0.19<br />
Clays 0.26 0.59<br />
Calcite 15.75 16.24<br />
Ankerite 6.64 10.59<br />
Anhydrite/Gypsum 1.74 1.51<br />
Rutile 0.13 0.21<br />
Page | 148
<strong>Minerals</strong> PMC-01 PMC-02<br />
Ilmenite 0.01 0.02<br />
Fe Oxides 18.88 15.20<br />
Sphene 0.07 0.07<br />
Siderite 0.08 1.19<br />
Apatite 0.23 0.21<br />
Others 0.11 0.13<br />
Total 100.00 100.00<br />
13.4.2 PHASE 2<br />
During 2012, SGS Laboratory in Lima, Peru conducted a test program using drill core rejects<br />
from the 2011 program. The main objective of Phase 2 was to obtain the metallurgical response<br />
of mineralized material from the Pampacancha deposit to Constancia project flotation conditions.<br />
Phase 2 involved head assay, specific gravity, natural pH determination, a locked cycle test to<br />
approximate plant metallurgical results and variability flotation test on Constancia flotation<br />
conditions.<br />
Samples with Skarn lithology and Hypogene lithology were considered representative for the<br />
Pampacancha deposit. Three master composites were produced and designated for each sector<br />
in the Pampacancha deposit.<br />
Locked Cycle Test<br />
Constancia project flotation conditions for locked cycle tests are shown in Table 13-6.<br />
Page | 149
Table 13-6: Locked Cycle Test Conditions<br />
Reagents, g/t Grind Time, min<br />
Stage<br />
CaO A-3302 AF-65 P80, µm Cond. Flot.<br />
pH<br />
Grinding Req 15 106<br />
Conditioning Req 15 Req 10<br />
Rougher 10<br />
Regrinding 25 2<br />
Cleaner 1 Req 4 11.5<br />
Conditioning<br />
Scavenger 8 11.5<br />
Cleaner 2 Req 3 11.5<br />
Cleaner 3 Req 3 11.5<br />
Locked cycle test results are shown in Table 13-7. A concentrate grade from to 14.9 to 25.3% Cu<br />
with a recovery from 67.8 to 80.6% Cu was achieved.<br />
Page | 150
Table 13-7: Phase 2: Locked Cycle Test Results<br />
Grade<br />
Recovery<br />
Composite<br />
Cu, % Fe, % Au, g/t Ag, g/t Cu, % Fe, % Au, % Ag, %<br />
PMC-03 21.1 22.4 9.7 188.5 76.3 2.2 62.2 63.1<br />
PMC-04 25.3 24.7 11.3 151.1 67.8 1.7 53.8 56.5<br />
PMC-05 14.9 21.1 6.7 165.8 80.6 2.4 61.3 70.3<br />
Flotation Variability Test<br />
A variability test was performed under Constancia project flotation conditions on 30 variability<br />
samples with Skarn lithology and Hypogene zone, which were floated to determine the effect of<br />
the variability on rougher flotation. The head grades were in the range from 0.21 to 1.29% Cu.<br />
The variability flotation test was a kinetic flotation for several times (0, 1, 2, 4, 8, 12 and 18 min).<br />
The results of the variability test including, cumulative recovery and grade until flotation<br />
completion (18 min), are shown in Table 13-8. Rougher concentrate recoveries were in the range<br />
from 75.3 to 95.7% Cu, 8.6 to 36.5% Fe, 54.7 to 91.8% Au and 54.1 to 95.1% Ag.<br />
Page | 151
Table 13-8: Phase 2: Rougher Variability Testing Results<br />
Head Calculated Rougher Grade Rougher Recovery<br />
Sample<br />
s<br />
Cu<br />
Fe<br />
Au<br />
Ag<br />
Cu<br />
Fe<br />
Au<br />
Ag<br />
Cu<br />
Fe<br />
Au<br />
Ag<br />
Mas<br />
s<br />
%<br />
%<br />
g/t<br />
g/t<br />
%<br />
%<br />
g/t<br />
g/t<br />
%<br />
%<br />
%<br />
%<br />
Pull<br />
%<br />
PRS-01<br />
0.3<br />
1<br />
19.<br />
9 0.13<br />
0.7<br />
6<br />
1.3<br />
7<br />
12.<br />
2<br />
0.5<br />
6<br />
2.5<br />
4<br />
90.<br />
0<br />
12.<br />
5<br />
89.<br />
8<br />
68.<br />
3 20.3<br />
PRS-02<br />
1.2<br />
6<br />
42.<br />
6 0.55<br />
6.8<br />
1<br />
5.4<br />
7<br />
26.<br />
7<br />
2.2<br />
7<br />
28.<br />
3<br />
90.<br />
0<br />
13.<br />
0<br />
85.<br />
1<br />
86.<br />
3 20.8<br />
PRS-03<br />
0.4<br />
3<br />
32.<br />
1 0.14<br />
6.5<br />
8<br />
1.7<br />
8<br />
22.<br />
0<br />
0.5<br />
5<br />
23.<br />
0<br />
89.<br />
9<br />
14.<br />
8<br />
82.<br />
9<br />
75.<br />
3 21.5<br />
PRS-04<br />
1.3<br />
0<br />
33.<br />
3 0.62<br />
6.8<br />
0<br />
4.4<br />
5<br />
28.<br />
4<br />
1.6<br />
3<br />
19.<br />
9<br />
90.<br />
3<br />
22.<br />
4<br />
69.<br />
0<br />
77.<br />
1 26.3<br />
PRS-07<br />
0.3<br />
1<br />
28.<br />
1 0.13<br />
1.8<br />
5<br />
1.0<br />
3<br />
20.<br />
2<br />
0.4<br />
3<br />
5.6<br />
7<br />
86.<br />
9<br />
18.<br />
5<br />
84.<br />
2<br />
79.<br />
1 25.8<br />
PRS-11<br />
0.2<br />
2<br />
3.7<br />
6 0.11<br />
2.7<br />
9<br />
0.5<br />
5<br />
3.9<br />
6<br />
0.2<br />
3<br />
6.1<br />
8<br />
87.<br />
6<br />
36.<br />
5<br />
74.<br />
3<br />
76.<br />
6 34.7<br />
PRS-12<br />
0.6<br />
0<br />
26.<br />
9 0.26<br />
3.7<br />
3<br />
1.9<br />
2<br />
20.<br />
2<br />
0.8<br />
1<br />
11.<br />
2<br />
85.<br />
2<br />
19.<br />
8<br />
82.<br />
1<br />
79.<br />
1 26.4<br />
PRS-15<br />
0.3<br />
8<br />
13.<br />
4 0.12<br />
1.5<br />
1<br />
1.3<br />
8<br />
11.<br />
5<br />
0.4<br />
3<br />
5.3<br />
0<br />
86.<br />
6<br />
20.<br />
7<br />
88.<br />
2<br />
84.<br />
4 24.0<br />
PRS-16<br />
0.4<br />
6<br />
30.<br />
2 0.17<br />
3.3<br />
6<br />
2.2<br />
5<br />
21.<br />
3<br />
0.8<br />
4<br />
15.<br />
4<br />
89.<br />
8<br />
13.<br />
0<br />
91.<br />
8<br />
84.<br />
7 18.5<br />
PRS-18<br />
0.3 24.<br />
0.34<br />
10. 1.2 20. 0.9 28. 84. 22. 72. 74.<br />
27.2<br />
Page | 152
Head Calculated Rougher Grade Rougher Recovery<br />
Sample<br />
s<br />
Cu<br />
Fe<br />
Au<br />
Ag<br />
Cu<br />
Fe<br />
Au<br />
Ag<br />
Cu<br />
Fe<br />
Au<br />
Ag<br />
Mas<br />
s<br />
%<br />
%<br />
g/t<br />
g/t<br />
%<br />
%<br />
g/t<br />
g/t<br />
%<br />
%<br />
%<br />
%<br />
Pull<br />
%<br />
9 8 5 0 1 0 7 2 0 7 4<br />
PRS-19<br />
1.2<br />
4<br />
41.<br />
1 0.63<br />
11.<br />
2<br />
4.9<br />
0<br />
32.<br />
8<br />
2.1<br />
2<br />
41.<br />
2<br />
85.<br />
5<br />
17.<br />
3<br />
72.<br />
8<br />
79.<br />
9 21.7<br />
PRS-20<br />
1.0<br />
0<br />
21.<br />
1 0.69<br />
29.<br />
0<br />
2.6<br />
2<br />
18.<br />
4<br />
1.5<br />
9<br />
71.<br />
5<br />
88.<br />
7<br />
29.<br />
3<br />
77.<br />
6<br />
83.<br />
0 33.7<br />
PRS-21<br />
0.6<br />
4<br />
25.<br />
2 0.19<br />
5.0<br />
2<br />
2.0<br />
5<br />
17.<br />
5<br />
0.5<br />
9<br />
14.<br />
7<br />
88.<br />
7<br />
19.<br />
3<br />
84.<br />
1<br />
81.<br />
1 27.8<br />
PRS-22<br />
0.3<br />
5<br />
41.<br />
2 0.19<br />
5.2<br />
3<br />
1.5<br />
1<br />
29.<br />
9<br />
0.8<br />
0<br />
18.<br />
6<br />
89.<br />
2<br />
14.<br />
8<br />
86.<br />
9<br />
72.<br />
3 20.3<br />
PRS-23<br />
0.3<br />
3<br />
14.<br />
3 0.26<br />
5.1<br />
3<br />
0.9<br />
7<br />
12.<br />
1<br />
0.6<br />
8<br />
13.<br />
4<br />
83.<br />
8<br />
24.<br />
5<br />
74.<br />
8<br />
75.<br />
5 28.9<br />
PRS-24<br />
0.2<br />
7<br />
11.<br />
5 0.21<br />
5.6<br />
5<br />
0.7<br />
3<br />
12.<br />
4<br />
0.4<br />
7<br />
9.2<br />
4<br />
90.<br />
2<br />
35.<br />
6<br />
73.<br />
6<br />
54.<br />
1 33.1<br />
PRS-27<br />
0.3<br />
7<br />
15.<br />
5 0.16<br />
2.3<br />
8<br />
1.0<br />
2<br />
12.<br />
3<br />
0.4<br />
0<br />
6.2<br />
5<br />
84.<br />
5<br />
24.<br />
7<br />
80.<br />
5<br />
81.<br />
5 31.0<br />
PRS-30<br />
0.6<br />
0<br />
<strong>43</strong>.<br />
0 0.18<br />
2.9<br />
0<br />
2.8<br />
6<br />
29.<br />
7<br />
0.7<br />
8<br />
10.<br />
4<br />
90.<br />
6<br />
13.<br />
1<br />
83.<br />
1<br />
68.<br />
1 18.9<br />
PRS-31<br />
0.6<br />
4<br />
18.<br />
2 0.17<br />
6.1<br />
4<br />
1.7<br />
8<br />
15.<br />
4<br />
0.4<br />
7<br />
15.<br />
5<br />
93.<br />
2<br />
28.<br />
3<br />
89.<br />
3<br />
84.<br />
6 33.5<br />
Page | 153
Page | 154<br />
Sample<br />
s<br />
Head Calculated Rougher Grade Rougher Recovery<br />
Mas<br />
s<br />
Pull<br />
%<br />
Cu<br />
%<br />
Fe<br />
%<br />
Au<br />
g/t<br />
Ag<br />
g/t<br />
Cu<br />
%<br />
Fe<br />
%<br />
Au<br />
g/t<br />
Ag<br />
g/t<br />
Cu<br />
%<br />
Fe<br />
%<br />
Au<br />
%<br />
Ag<br />
%<br />
PRS-32<br />
1.0<br />
8<br />
39.<br />
6 0.42<br />
5.0<br />
1<br />
3.8<br />
2<br />
29.<br />
6<br />
1.2<br />
4<br />
16.<br />
1<br />
75.<br />
3<br />
16.<br />
0<br />
63.<br />
6<br />
68.<br />
9 21.4<br />
PRS-34<br />
0.4<br />
6<br />
13.<br />
2 0.60<br />
9.8<br />
4<br />
1.4<br />
5<br />
11.<br />
3<br />
1.6<br />
0<br />
29.<br />
8<br />
89.<br />
7<br />
24.<br />
4<br />
75.<br />
8<br />
86.<br />
5 28.6<br />
PRS-35<br />
0.4<br />
4<br />
7.5<br />
5 0.62<br />
23.<br />
5<br />
1.7<br />
7<br />
8.6<br />
1<br />
2.5<br />
9<br />
90.<br />
7<br />
82.<br />
0<br />
23.<br />
4<br />
85.<br />
9<br />
79.<br />
0 20.5<br />
PRS-36<br />
0.6<br />
5<br />
15.<br />
1<br />
0.09<br />
8<br />
14.<br />
4<br />
2.1<br />
7<br />
14.<br />
0<br />
0.3<br />
1<br />
47.<br />
9<br />
95.<br />
7<br />
26.<br />
6<br />
89.<br />
1<br />
95.<br />
1 28.7<br />
PRS-37<br />
0.4<br />
8<br />
28.<br />
8 0.31<br />
6.5<br />
9<br />
2.4<br />
6<br />
19.<br />
2<br />
1.4<br />
1<br />
32.<br />
2<br />
84.<br />
9<br />
10.<br />
9<br />
75.<br />
5<br />
80.<br />
4 16.5<br />
PRS-39<br />
0.5<br />
2<br />
16.<br />
7 0.16<br />
13.<br />
1<br />
2.1<br />
9<br />
18.<br />
9<br />
0.5<br />
2<br />
52.<br />
3<br />
92.<br />
1<br />
24.<br />
8<br />
69.<br />
9<br />
87.<br />
8 22.0<br />
PRS-40<br />
0.4<br />
9<br />
31.<br />
9 0.13<br />
2.6<br />
1<br />
2.4<br />
5<br />
21.<br />
2<br />
0.6<br />
1<br />
10.<br />
5<br />
88.<br />
3<br />
11.<br />
8<br />
84.<br />
1<br />
71.<br />
6 17.8<br />
PRS-42<br />
0.5<br />
0<br />
22.<br />
2 0.19<br />
11.<br />
3<br />
1.6<br />
8<br />
16.<br />
9<br />
0.5<br />
2<br />
35.<br />
7<br />
84.<br />
9<br />
19.<br />
0<br />
67.<br />
5<br />
78.<br />
9 25.0<br />
PRS-<strong>43</strong><br />
0.3<br />
7<br />
14.<br />
5 0.16<br />
6.4<br />
2<br />
1.2<br />
6<br />
11.<br />
9<br />
0.4<br />
8<br />
21.<br />
6<br />
88.<br />
7<br />
21.<br />
6<br />
81.<br />
5<br />
88.<br />
3 26.2<br />
PRS-46<br />
0.8<br />
0<br />
40.<br />
1 0.32<br />
6.3<br />
3<br />
4.0<br />
4<br />
24.<br />
0<br />
1.6<br />
1<br />
31.<br />
4<br />
91.<br />
8<br />
10.<br />
8<br />
90.<br />
5<br />
89.<br />
6 18.1
Head Calculated Rougher Grade Rougher Recovery<br />
Sample<br />
s<br />
Cu<br />
Fe<br />
Au<br />
Ag<br />
Cu<br />
Fe<br />
Au<br />
Ag<br />
Cu<br />
Fe<br />
Au<br />
Ag<br />
Mas<br />
s<br />
%<br />
%<br />
g/t<br />
g/t<br />
%<br />
%<br />
g/t<br />
g/t<br />
%<br />
%<br />
%<br />
%<br />
Pull<br />
%<br />
PRS-49<br />
0.4<br />
5<br />
29.<br />
3 0.17<br />
6.3<br />
5<br />
2.7<br />
5<br />
16.<br />
7<br />
0.6<br />
1<br />
34.<br />
4<br />
92.<br />
9<br />
8.5<br />
6<br />
54.<br />
7<br />
81.<br />
5 15.1<br />
13.4.3 CONCLUSION<br />
The Phase 1 locked cycle test with revised conditions yielded a final concentrate grade at 95 per<br />
cent confidence level of 19.6 ± 2.7% Cu for PMC01 and 21.6 ± 1.8% Cu for PMC02 with a<br />
recovery of 78.6 ± 0.5% Cu for PMC01 and 79.2 ± 2.2% Cu for PMC02 at the same level<br />
confidence. On the other hand, locked cycle test with Constancia project conditions yielded a<br />
final concentrate grade at 95 per cent confidence level of 26.6 ± 0.7% Cu for PMC01 and 21.9 ±<br />
0.8% Cu for PMC02 with a recovery of 77.5 ± 0.9% Cu for PMC01 and 79.9 ± 2.7% Cu for<br />
PMC02 at the same level confidence.<br />
Phase 1 mineralogy copper sulphide (chalcopyrite, bornite, chalcocite, covellite, digenite) was<br />
found majority free and liberated in head of composite PMC01 (80.0%) and PMC02 (79.9%).<br />
Phase 2 locked cycle test with revised conditions yielded a final concentrate grade at 95 per cent<br />
confidence level of 21.1 ± 1.7% Cu for PMC03, 25.3 ± 0.9% Cu for PMC04 and 14.9 ± 4.4% Cu<br />
for PMC05 with a recovery of 76.3 ± 0.9% Cu for PMC03, 67.8 ± 2.8% Cu for PMC04 and 80.6 ±<br />
1.9% Cu for PMC05 at the same level confidence.<br />
13.4.4 DISCUSSION<br />
In Phase 1 locked cycle testing with revised conditions, the copper grade for composite PMC02<br />
was below industry commercial copper grade. Chemical characterization of the cleaner<br />
concentrate reported values that may be close to penalty levels for As (0.26%), Sb (0.19%), and<br />
Pb (1.5%). In locked cycle testing with Constancia project conditions, copper grade for<br />
composite PMC02 was below commercial copper grade. Chemical characterization of the<br />
cleaner concentrate reported values that may be close to penalty levels for As (0.25%), Sb<br />
(0.19%), and Pb (1.02%). Lime consumption was from 865 to 1,245 g/t.<br />
In Phase 2 locked cycle test with Constancia conditions, the copper grade for composite PMC03<br />
and PMC05 was below commercial copper grade. Chemical characterization for cleaner<br />
concentrate reported values that might be close to penalty levels for Sb (0.15%) and Zn (3.48%)<br />
for PMC03 and Zn (3.33%) for PMC04. Lime consumption was from 1,595 to 2,053 g/t.<br />
Page | 155
The low concentrate grades from the locked cycle tests, and the low recoveries in cleaning are<br />
accompanied with low sulphur grades in the concentrates. Preliminary mineralogy suggests that<br />
this may be due to small copper sulphide inclusions in hard silicates. QemSCAN mineralogy<br />
showed that over 90% of the copper sulphides were moderately liberated or better, which was<br />
also evident in the rougher flotation variability testwork. However, 10 to 16% of the copper<br />
sulphides were associated with silicates and so this may explain the difficulty in getting adequate<br />
cleaning recovery and final concentrate grade in the locked cycle testwork.<br />
13.4.5 RECOMMENDATIONS<br />
In Phase 1, average rougher concentrate recoveries of 88.9% Cu, and 77.6% Ag were obtained<br />
in the variability tests. Therefore, it is recommended that recoveries of 85% Cu and 65% Ag be<br />
used for pre-feasibility study level projections, assuming typical losses in cleaning. The locked<br />
cycle testing had much higher losses in cleaning, but it is assumed at this stage that further<br />
investigation will resolve this issue.<br />
While the concentrate in the locked cycle tests had low copper grades, they were not diluted by<br />
pyrite, lead, zinc or other metals that are typically difficult to remove in cleaning. Therefore it is<br />
assumed that the silicate dilution of concentrate will be resolved in the next round of testwork. As<br />
a result, 25 to 28% Cu concentrate is assumed for the pre-feasibility study purposes.<br />
It is planned to treat the Pampacancha resource in the Constancia plant, blending it with<br />
Constancia ores. It is recommended that further testwork be conducted on mining blends of<br />
these two ore types to ensure that they do not adversely affect each other. On the other hand,<br />
this also may be an opportunity as they may produce better results than either ore type by itself.<br />
As with Constancia supergene ore, the minor chalcocite-diginite components in Pampacancha<br />
feed are expected to activate sphalerite in the high zinc Constancia ore type, so the two should<br />
be kept separate. Current mine planning will allow for segregation of the high zinc Constancia<br />
ore should separate treatment prove to be necessary.<br />
A further test program for the Pampacancha deposit should be developed based on samples<br />
collected from fresh drill cores in order to verify metallurgical parameters from comminution,<br />
flotation, mineralogical and settling testwork.<br />
The next phase should use fresh drill cuttings to avoid sample oxidation from impacting flotation<br />
recovery. Confirmation of the comminution results is also required, in case oxidation may have<br />
weakened the samples.<br />
Further testwork on comminution should include JK Drop Weight Tests, SMC testing and a<br />
repeat of Bond work index and abrasion indexes to confirm the assumptions made at this stage.<br />
Detailed diagnostic mineralogy is required on rougher concentrates, final concentrate and<br />
cleaner scavenger tailings samples in order to target regime changes to improve cleaner<br />
recovery and final concentrate grades.<br />
Page | 156
14.0 MINERAL RESOURCE ESTIMATES<br />
Mineral resources contained herein pertain specifically to the Constancia and Pampacancha<br />
deposits.<br />
There are no known factors that could materially affect the mineral resource estimates. In<br />
general, these factors include but are not limited to, environmental, permitting, legal, marketing,<br />
political, economic or other factors.<br />
In the case of the Constancia deposit, most of these factors are well understood and have been<br />
described in other sections of this report.<br />
In the case of the Pampacancha deposit, the surface rights are not yet purchased, though there<br />
are allowances in the capital cost estimate to do so at market rates. In addition, the extraction of<br />
minerals from Pampacancha will require an EISA modification which is currently being planned.<br />
14.1 CONSTANCIA<br />
The Constancia mineral resources estimate completed by AMEC effective August 23, 2011 and<br />
subsequently reviewed and approved by the author (the QP Cashel Meagher, Principal<br />
Geologist, <strong>Hudbay</strong>’s Vice-President South America Business Unit), represents an update to the<br />
previous estimate (GRD Minproc, DFS 2009), and uses updated modelling methods and<br />
parameters.<br />
14.1.1 MODEL AND COMPOSITE SETUP<br />
The current model extends 2.5 km east–west by 2.0 km north–south by 0.9 km vertically.<br />
Orthogonal vertical sections are spaced at 50 m intervals and are oriented EW and NS. The<br />
mine bench plans are at 15 m intervals. Thirty-eight long-sections cover the length of the deposit<br />
from the south to the north end of the project. Thirty-three cross-sections cover the width of the<br />
deposit. UTM coordinates based on the Provisional South America 1956 (PSAD56) datum were<br />
used for the collar survey that is the base for the Constancia resources block model.<br />
Topographic Surface<br />
The topographic surface, provided by <strong>Hudbay</strong>, was used to generate a new surface, at intervals<br />
of 10 m. This surface was used as the base to construct all the related topographic surfaces in<br />
MineSight®.<br />
Resource Drilling<br />
Three hundred eighty-four resource drill holes were loaded into MineSight® using the<br />
MineSight® CONCSA procedure, which requires inputs in ASCII format of the following files:<br />
collar, survey, assays and lithology. The geology database used for the 2011 resource model<br />
was updated to include all drilling, comprising drill holes summarized in Table 14-1.<br />
Page | 157
Assays for Cu, Mo, Ag, Au, Pb, Zn, CuSS, CuCN, Fe, S, Sb, Cd and As were available for<br />
modeling.<br />
Table 14-1: Summary of Drill hole Names<br />
DDH Name # Holes From To Description<br />
CSXXX 1 CS001 - Unknown<br />
KAXXXX 7 KA001 KA007 Unknown<br />
CG-XX-XX 10 CG-08-001 CG-08-010 Geotechnical Drilling<br />
COXXX 16 CA008 CO022 Infill Diamond Drilling<br />
CR-XX-XXX 54 CR-08-001 CR-08-054 Condemnation RC<br />
Drilling<br />
CO-XX-XX 296 CO-05-001 CO-10-296 Infill Diamond Drilling<br />
Note: CS and CO = Rio Tinto 2003 – 2004, KA = Mitsui 1990´s, CG - = Norsemont 2005 –<br />
2010, CR - = Norsemont 2008, CO - = Norsemont 2005 – 2010.<br />
Surface Mapping<br />
Surface mapping was used to adjust the section interpretations. The compilation map was<br />
provided by <strong>Hudbay</strong> as DXF files and transferred to the MineSight® 3D and converted into 3D<br />
surface with the capability of being sliced in vertical sections. Dikes and other lithological<br />
contacts in sections and plans were reconciled against the outcrop mapping. Mapped outcrops<br />
represent a very low percentage of all exposed area on the property due to overburden material.<br />
Figure 14-1 shows the geologic map for the deposit.<br />
Page | 158
Figure 14-1: Constancia Compilation Geology Map<br />
Composite Length<br />
The composite length used in estimation was 7.5 m so that two composites would have a similar<br />
length to the 15 m high bench for the project. The down-hole composite was broken at<br />
interpreted mineralization boundaries. A minimum of 3.75 m composite length was used for the<br />
EDA. Table 14-2 shows a comparison between the greater of 3.75 m length composites and the<br />
short-length composites. There is no significant number of short-length composites by lithology<br />
types. The short-length composites by lithology represent
Lithology<br />
Composites<br />
Composites<br />
% Difference<br />
(Length≥3.75 m)<br />
(Length
Description of Composite Fields<br />
Composite fields are listed in Table 14-4. These codes are stored in the composite field LITMD<br />
and MINMD. The estimation domain code for each element is stored in a separate field as:<br />
DOMCU, DOMMO, DOMAG, DOMZN, DOMAU, etc.<br />
Table 14-4: Composite Fields<br />
Field Name<br />
Description<br />
DOMAU<br />
Gold domain code<br />
DOMCS<br />
Soluble copper domain code<br />
DOMCN<br />
Cyanide copper domain code<br />
DOMAS<br />
Arsenic domain code<br />
DOMS<br />
Sulphur domain code<br />
DOMFE<br />
Iron domain code<br />
DOMPB<br />
Lead domain code<br />
DOMSB<br />
Antimony domain code<br />
DOMCD<br />
Cadmium domain code<br />
Block Model Set Up<br />
The block size in the MineSight® project is 10 m x 10 m x 15 m. Minimum and maximum<br />
coordinates in X, Y and Z are shown in Table 4-5. The block model contains 250 columns (X),<br />
200 rows (Y), and 60 benches (Z). The block model is not rotated.<br />
Page | 161
Table 14-5: Block Model Setup in MineSight® --- Extent<br />
Minimum Maximum Block Size<br />
Easting 200,500 203,000 10<br />
Northing 8,399,000 8,401,000 10<br />
Elevation 3,600 4,500 15<br />
14.1.2 GEOLOGICAL MODEL<br />
The current Constancia geological model interprets six lithology domains and five mineralization<br />
type zones in vertical sections and horizontal plan views as described in the following<br />
subsections.<br />
Lithology Model<br />
Interpretation of the lithology domains was based on exploration drill hole assay intervals.<br />
Lithology grouping was carried out to improve the continuity of the geology and grades. Where a<br />
minor lithology unit had insufficient data, minor units were grouped together into a major lithology<br />
group domain based on the grade similarity, and a new set of codes was used for the lithology<br />
group domains (Table 14-6).<br />
Table 14-6: Summary of Lithology Group Coding<br />
Lithology<br />
Group<br />
Code<br />
Description<br />
SS 2 Sediments<br />
SKN 3 Skarn<br />
MP1 4 Monzonite Porphyry - Mineralized<br />
MP2 5 Monzonite Porphyry - Post<br />
Mineralized<br />
QMP 6 Quartz eyed MP<br />
Page | 162
The following rock types were modeled as individual units.<br />
• Monzonite Porphyry (MP1)<br />
This unit outcrops as a large stock on the Constancia hill, extending west to San José. It hosts<br />
most of the porphyry-related mineralization. It is characterized by abundant (40-50%)<br />
plagioclase phenocrysts up to 3 mm long. Hornblende constitutes 5-7%, with elongated crystals<br />
up to 6 mm long. The matrix is pinkish, with smaller magnetite and orthoclase crystals. The<br />
upper parts of this stock are mostly leached, making its recognition difficult.<br />
• Micro Monzonite Porphyry (MMP)<br />
Characterized by a fine-grained texture with plagioclase crystals (60-70%) up to 2 mm<br />
long. Biotite (1-3%) and magnetite (
a) Summary of Total Length by Lithology Types<br />
Table 14-7 provides a comparison of composites length and number of composites. These are<br />
tabulated by as logged (AL) lithology types.<br />
Table 14-7: Comparison of Composites by As Logged Lithology Types (length ≥3.75 m)<br />
Lithology Code Length No. Composites % of Total<br />
Average<br />
Average % Cu<br />
MMP (1) 9,688.55 1,310 9% 0.117<br />
SS (2) 6,417.15 864 6% 0.072<br />
SKN (3) 4,623.64 620 4% 0.571<br />
MP1 (4) 79,817.99 10,730 73% 0.250<br />
MP2 (5) 6,769.60 910 6% 0.0<strong>43</strong><br />
QMP (6) 1,806.90 2<strong>43</strong> 2% 0.026<br />
Total 109,123.83 14,677 100% 0.225<br />
In general, the distribution of composites by lithology type shows that the major lithology<br />
unit lies on the MP1 with 73% of the total composite but, the highest mean copper grade lies on<br />
the skarn (SKN) unit which is volumetrically small.<br />
b) Interpretation Process<br />
The lithology type model was built based on interpretation from three orthogonal sets of sections:<br />
two vertical sections, followed by bench plans for the MP1 unit. The other minor lithology units<br />
were built based on the interpretation of one set of vertical sections, followed by bench<br />
plans. The initial sections were east-west and spaced 50 m apart (all lithology types). This<br />
interpretation was then projected to a set of north-south vertical sections (MP1 only) also<br />
spaced 50 m apart. These two sets of sections were then re-interpreted in an iterative manner<br />
to balance the interpretation. The final pass of interpretation was completed through the 10 m<br />
benches at toe elevation.<br />
The sections on which the interpretation was completed are:<br />
Page | 164
- 8399100N to 8400700N (33 sections at 50 m spacing).<br />
- 200750E to 202600E (38 sections at 50 m spacing).<br />
- Bench plans 3600El to 4490El (90 plans at 10 m spacing).<br />
c) Lithology Model Verification<br />
The bench interpretation resulted in a set of closed polygons, each representing a rock type as<br />
listed in Table 14-8. These polygons were used to create a wire frame solid into the MineSight®,<br />
which contained the lithology type attributes needed to code composites and block models.<br />
Codification of the block model from the lithology wireframes was verified by visual inspection of<br />
the blocks. Sections and plans were inspected visually to ensure that the wireframe solid<br />
process resulted in blocks being coded properly. The method worked as desired on about 98%<br />
of the blocks. Where some no coded blocks occurred due to the conflict issues of the wireframe<br />
solid, a second pass of coding from bench polygons were applied, then block coding was seen to<br />
be consistent with the geologic interpretation.<br />
A few drill hole intersections of MP2 and/or QMP units were, found to have copper grades in<br />
excess of 0.5%. This occurred at the contact between barren dikes and the porphyry –<br />
mineralized monzonite or the skarn bodies due to the problems with projection when the<br />
wireframe solids were built. Composite codes were manually corrected in these cases,<br />
changing the lithology code to the corresponding domain. Total of nine to twelve composite<br />
codes were changed to correct the projection issues.<br />
d) Lithology Back-Tagging Validation<br />
Statistics were generated to verify tagging of composites versus the assignment of the ―as<br />
logged‖ lithology to composites which is summarized in Table 14-8. In some cases the<br />
wireframe solids may have been slightly misinterpreted, causing misclassification.<br />
Table 14-8: Lithology Code Back-tagging and As Logged Statistics (7.5 M Composites)<br />
Lithology<br />
Logged* (m) Back-Tagged (m) % Match<br />
Code<br />
MMP (1) 9,688.55 7,519.74 78%<br />
SS (2) 6,417.15 6,615.15 103%<br />
SKN (3) 4,623.64 4,020.75 87%<br />
MP1 (4) 79,817.99 81,568.49 102%<br />
Page | 165
MP2 (5) 6,769.60 7,449.05 110%<br />
QMP (6) 1,806.90 1,950.65 108%<br />
Total 109,123.83 109,123.83 100%<br />
As observed above, misclassifications through back tagging of composites from the geological<br />
model range from -10% for barren dike MP2 to 22% for micro porphyrytic Monzonite (MMP),<br />
both are un-mineralized units. Back-tagging improves miss-matches to 2% in the main<br />
mineralized monzonite porphyry (MP1).<br />
The relatively high misclassification of SKN composites is likely caused by the small volumes<br />
and poor continuity of this unit and suggests that this unit is near the practical limit of<br />
resolution of the geologic model given the present drill spacing. As a result, the interpretation of<br />
the SKN unit incorporates some foreign composites, since some minor units are included within<br />
the greater lithological domain. There are a significant number of faults logged with lithology<br />
code 11 in the original assay database which cannot be modeled as a specific lithology type<br />
which leads to some degree of misclassification. Core logging should be reviewed and<br />
focused on the faults zones so that the lithology types can be assigned to these intervals and<br />
the continuity of the fault zones improved to allow construction of a structural model.<br />
Mineralization Zones<br />
Leached, oxide, supergene enriched, mixed and hypogene mineralization types are observed at<br />
Constancia. Mineralization type zones were modeled to allow for the application of parameters<br />
for metallurgical recovery and mineralization type zone mine planning. Deterministic domains of<br />
leached, oxide, supergene, mixed and hypogene material were built in section and plan from the<br />
mineralization type codes in the drill hole file. A typical cross section is show in Figure 14-2.<br />
Figure 14-2: Mineralization Zones EW Section<br />
Page | 166
The mineralization type model is based on logged codes, which have been checked against the<br />
sequential leach copper assay values. The original mineralization type zone codes are<br />
summarized in Table 14-9, and numerical codes for later data analysis and grouping are also<br />
shown.<br />
Table 14-9: Original mineralization type zone codes<br />
Name Code Description<br />
LX 1 Leached (includes soil, manganese or iron oxides)<br />
OX 2 Copper Oxides<br />
SG 3 Supergene<br />
MX 4 Mixed<br />
HY 5 Hypogene<br />
NN 23 Unknown<br />
NR 24 No recovery<br />
The Norsemont drill core was analyzed for total copper by Inductively Coupled Plasma -<br />
Atomic Emission Spectroscopy (ICP - AES), and with a four acid digestion and atomic<br />
adsorption spectroscopy (AAS) when values were reported above the upper detection limit<br />
for ICP. Those samples that returned a total copper content of above 0.2% were sent for<br />
additional analysis via sequential copper leach – first, digestion by H2SO4 (Cu_SS, acid<br />
soluble or oxide copper), followed by digestion by NaCN (Cu_CN, cyanide soluble, typically<br />
chalcocite and bornite – secondary copper minerals), then finally digestion by HCl and HNO3<br />
(Cu_R, residual copper, typically chalcopyrite).<br />
The definition of the majority of the domains is based on the percentage of the sequential<br />
copper leach compared to total copper content as summarized in Table 14-10.<br />
Page | 167
Table 14-10: Sequential Copper Range for Domaining<br />
Mineralization Type<br />
Copper Sequential<br />
Oxide CuSS >65%<br />
Supergene<br />
CuCN>50%<br />
Mixed<br />
CuSS>25% and 25%
a) Summary of Total Length by Mineralization Type Zone<br />
Table 14-12 provides a comparison of composite length and composite numbers. These are<br />
tabulated by logged (AL) mineralization zone.<br />
Table 14-12: Comparison of Composites by AsLogged Mineralization Type Zone<br />
Lithology Code Length No. Composites % of Total Average % Cu<br />
LX (1) 12,484.35 1,700.00 12 0.065<br />
OX (2) 904.90 127.00 1 0.622<br />
SG (3) 6,106.67 830.00 6 0.659<br />
MX (4) 1,768.80 2<strong>43</strong>.00 2 0.<strong>43</strong>8<br />
HY (5) 87,859.11 11,777.00 80 0.209<br />
Total 109,123.83 14,677.00 100 0.225<br />
In general, the distribution of composites by mineralization type zone show that the dominant<br />
mineralization type zone is HY with 80% of the total composites. The highest mean copper grade<br />
is in the OX and SG zones which are volumetrically minor.<br />
b) Interpretation Process<br />
The mineralization type zone model was constructed from interpretation on three orthogonal sets<br />
of sections: longitudinal sections, cross sections, followed by bench plans. The initial sections<br />
were east-west and spaced 50 m apart. This interpretation was then projected to a set of<br />
north-south vertical sections also spaced 50 m apart for all mineralization type zones. These<br />
two sets of sections were then re-interpreted in an iterative manner to balance the interpretation.<br />
The final pass of interpretation was completed through the 10 m benches at toe elevation for<br />
SG, OX and MX zones.<br />
The sections on which the interpretation was completed are:<br />
8399450N to 8400650N (25 sections at 50 m spacing).<br />
200750E to 202450E (35 sections at 50 m spacing).<br />
Bench plans 4120El to <strong>43</strong>90El (28 plans at 10 m spacing).<br />
Page | 169
c) Mineralization Type Zones Model Verification<br />
The bench interpretation resulted in a set of closed polygons, each representing a zone as listed<br />
in Table 5-7. These polygons were used to create wireframe solids in MineSight® where<br />
composites and block models were coded.<br />
Coding of the block model from the mineralization type wireframes was verified by visual<br />
inspection of the blocks in sections and plans to ensure that the wireframe solid process resulted<br />
in blocks being coded properly. The method worked as desired and block coding was seen to be<br />
consistent with the mineralization interpretation.<br />
AMEC identified a few holes lying just beside the HY zone which were not contained within the<br />
HY at the east limit of the solid which were not contained within it. It was decided to extend the<br />
HY solid to contain the composites outside the model.<br />
d) Mineralization Type Zones Back-Tagging Validation<br />
Statistics were generated to verify tagging of composites versus the assignment of the as-logged<br />
mineralization type zones to composites. In some cases the wireframe solids may have been<br />
slightly misinterpreted, causing misclassification as seen in the Table 14-13.<br />
Table 14-13: Mineralization Back-tagging and As Logged Statistics (7.5 M Composites)<br />
Mineralization<br />
As Logged* Back-Tagged % Match<br />
Code<br />
LX (1) 12,484.35 11,119.20 89%<br />
OX (2) 904.90 503.35 56%<br />
SG (3) 6,106.67 3,746.37 61%<br />
MX (4) 1,768.80 4,123.87 234%<br />
HY (5) 87,859.11 89,622.04 102%<br />
Total 109,123.83 109,123.83 100%<br />
Page | 170
As observed in Table 5-9, misclassification through back-tagging from the model was 2% for<br />
Hypogene, which is the main mineralization type zone and constitutes the majority of the<br />
deposit. The un-mineralized zone (leached cap) had 11% mismatches. Oxide and supergene<br />
zones had nearly 40% mismatches due to the irregular shape and small volume of the pods,<br />
but, those zones are volumetrically insignificant. The mixed zone had a high percentage of<br />
mismatching. This misclassification is because the mixed zone is a transitional zone, where<br />
both supergene and hypogene zones coexist. In addition, the interpretation incorporates some<br />
generalization since some irregular supergene mineralization are included within the mixed<br />
domain. There are inconsistencies in logging of drill holes intervals from the RTZ and 2005 drill<br />
campaigns when compared to nearby drill holes from later campaigns. Because these earlier<br />
campaigns were not assayed for sequential copper, inconsistent mineralization zone codes were<br />
to be consistent with the logging and sequential copper assay of the more recent drill holes for<br />
consistency. For future models it will be necessary to re-log the drill holes from the earlier<br />
campaigns and test for sequential copper to confirm the current interpretation.<br />
In <strong>Hudbay</strong>´s opinion, the back-tagging exercise for mineralization type zones works reasonably<br />
well considering the geometry of the deposit and the legacy data.<br />
Bulk Density<br />
A total of 1,247 density measurements have been made for 145 drill cores from the Constancia -<br />
San José area. The bulk density measurements were conducted by ALS Chemex with the<br />
paraffin wax coat method.<br />
Samples for density measurement in each major rock unit were extracted, at approximately 50 m<br />
intervals and are representative of the different rock and mineralization domains recognized to<br />
date. In addition, Norsemont re-analyzed 281 samples at SGS as part of its QC program and did<br />
not find significant differences; there was generally less than 10% of relative error.<br />
Block density data was assigned to the block taking into account the lithology type domains.<br />
Table 14-14 lists the bulk density values by lithology domains.<br />
Page | 171
Table 14-14: Bulk Density by Lithology<br />
Lithology Code<br />
Bulk Density<br />
1 (MMP) 2.55<br />
2 (SS) 2.66<br />
3 (SKN) 3.04<br />
4 (MP1) 2.51<br />
5 (MP2) 2.61<br />
6 (QMP) 2.46<br />
14.1.3 EXPLORATORY DATA ANALYSIS<br />
Exploratory data analysis (EDA) was completed on 7.5 m down-hole assay composites. Each<br />
composite was tagged with the lithology and mineralization types of the wireframe solids. Only<br />
composites greater than or equal to 3.75 m in length were used in the analysis. There were a<br />
total of 14,677 composite samples, which formed the base for the EDA for the 13 elements listed<br />
in the Table 14-15.<br />
Table 14-15: List of Elements for EDA<br />
Element Name<br />
Element Abbreviation<br />
Silver<br />
Ag<br />
Arsenic<br />
As<br />
Gold<br />
Au<br />
Cadmium<br />
Cd<br />
Copper<br />
Cu<br />
Page | 172
Cyanide Copper<br />
CuCN<br />
Soluble Copper<br />
Cuss<br />
Iron<br />
Fe<br />
Molybdenum<br />
Mb<br />
Lead<br />
Pb<br />
Sulphur<br />
S<br />
Antimony<br />
Sb<br />
Zinc<br />
Zn<br />
Histograms and Probability Plots<br />
A series of histograms and probability plots were generated using 7.5 m composites to<br />
characterize each lithology type separately. The histograms/probability plots were completed by<br />
lithology type, mineralization zone and by mineralization zone within lithology domains for MP1.<br />
A general copper histogram/probability plot for all lithology types is shown in Figure 14-3. Table<br />
14-16 summarizes average grades and coefficients of variation (CV = standard deviation/mean)<br />
calculated for each lithology type.<br />
Page | 173
Figure 14-3: Histogram and Probability Plot for All 7.5 m Copper Composites<br />
Page | 174
Table 14-16: Summary of Composites by Lithology<br />
Lithology<br />
Type<br />
Code<br />
Number of<br />
Composites<br />
Cu (%) Mo (ppm) Ag (ppm) Au (ppb) Zn (%) Sb (ppm) S (%) Pb (ppm) Fe (%) Cd (ppm) As (ppm)<br />
Mean CV Mean CV Mean CV Mean CV Mean CV Mean CV Mean CV Mean CV Mean CV Mean CV Mean CV<br />
MMP 1 1,016 0.12 1.6 42 1.64 2 1.45 22 1.58 0.06 1.99 3 2.48 2.26 0.72 331 3.64 3.54 0.67 2 1.9 13 1.53<br />
SS 2 891 0.06 3.53 11 3.29 2 2.31 23 2.28 0.18 3.09 4 1.38 1.41 1.13 696 2.44 2.9 0.93 5 2.94 18 1.38<br />
SKN 3 540 0.48 1.33 52 1.52 5 1.32 87 1.78 0.5 1.88 5 1.36 3.88 0.73 651 2.88 10.98 0.98 12 1.98 48 1.33<br />
MP1 4 10,967 0.25 1.2 81 1.<strong>43</strong> 3 1.45 37 2.53 0.06 3.28 4 1.78 1.59 0.9 334 3.31 3.32 0.91 2 2.93 11 2.23<br />
MP2 5 1,001 0.09 2.64 29 3.23 1 1.92 20 5.47 0.06 2.77 4 1.15 0.86 1.7 270 4.29 3.11 0.81 2 2.5 10 1.71<br />
QMP 6 262 0.08 2.42 41 2.92 1 1.87 12 2.36 0.09 5.32 4 1.29 0.42 1.8 296 5.25 2.75 0.3 2 5.82 7 2<br />
All 14,677 0.23 1.4 68 1.6 3 1.55 35 2.63 0.08 3.66 4 1.74 1.64 0.98 363 3.34 3.57 1.07 2 3.36 13 2.13<br />
Page | 175
EDA focused on the main mineralized monzonite porphyry (MP1) and skarn (SKN), as the MP1 represents<br />
the greatest volume in the deposit and the skarn mineralization domain has the highest mean copper grade.<br />
The main observations are presented here:<br />
• The MP1’s probability curve is slightly curvilinear with an inflection point between 0.10 and 0.20%<br />
Cu indicating the possibility of two low-grade populations in this unit. The mean grade is 0.25% Cu<br />
and the CV is 1.20.<br />
• SKN has a weakly curvilinear probability plot; the mean copper grade is 0.476% Cu, and the<br />
unit has a CV of 1.33.<br />
• MP1 is a relatively high-grade molybdenum unit with a mean Mo grade of 81 ppm Mo and a<br />
CV of 1.<strong>43</strong>. The log-probability curve is weakly curvilinear.<br />
• Molybdenum grades in the SKN unit are distributed lognormally, with an average of 52 ppm Mo and<br />
a CV of 1.52.<br />
• Silver grades in MP1 are distributed lognormally and have an average of 3 ppm Ag and a CV<br />
of 1.45.<br />
• The SKN probability curve is slightly curvilinear with an inflection point between 2 ppm and 3 ppm<br />
Ag. The mean silver grade is 5 ppm Ag and the CV is 1.32.<br />
• Zinc grades are lognormally distributed in SKN where the average grade (0.50% Zn) is higher<br />
than the other units, but the CV (1.88) is lower. This reflects the discontinuous mineralization<br />
occurring with the skarn.<br />
Probability plots generally indicate lognormal distributions for some elements and weak inflections were<br />
observed in others. There were some exceptions in minor elements, such as sulphur, where strong inflexion<br />
was observed. This may indicate mixing of grade populations, caused by a geological feature that is not<br />
currently incorporated in the modeling domains, such as fracture intensity, fracture family orientation, etc.<br />
Box Plots<br />
Box plots were created to facilitate comparisons between lithology types and mineralization type zones. A<br />
breakdown by mineralization type zone was also performed only on the MP1 for Ag, As, Cd, Cu, Fe, Pb, S,<br />
and Zn, to identify spatial trends. The other lithologies did not have enough data to produce meaningful<br />
plots.<br />
All domain box plots, by lithology and mineralization type are reproduced in Figure 14-4 and Figure 14-5<br />
respectively, and permit comparison of the grade distributions on these two sets of geology domains. The<br />
position of the average grade is represented by a point on the box plot. The relative distance between the<br />
lower and upper quartile limits (represented by box limits) gives an indication of variability.<br />
In SS, MP2 and QMP, the mean point is above the box which is characteristic of a highly skewed population<br />
with a high CV. In the remaining units, the points are within the boxes and reflect less-skewed distribution<br />
and lower CVs.<br />
Page | 176
Figure 14-4: Lithology Domain Box Plot<br />
Figure 14-5: Mineralization Type Zones Box Plot<br />
Box plots were also constructed by five mineralization type zones. The following observations were made for<br />
the most important elements:<br />
Page | 177
The average copper grade in MP1 is much lower in leached zone (0.10% Cu). The highest mean grades<br />
are in oxide and supergene (> 0.70% Cu). The mixed zone has a mean copper grade near 0.55% Cu and<br />
hypogene zone has a mean grade near 0.22% Cu.<br />
The mean zinc grade in MP1 is less than 0.03% Zn in leached and supergene zone. The highest zinc<br />
mean grades are in the mixed zone. Oxide and hypogene zones have zinc mean grades near 0.05% Zn.<br />
The overall mean zinc grade is low (
Treatment of Extreme Grades<br />
Histograms/probability plots were reviewed for each domain to determine the appropriate high grade<br />
threshold cutoff. Outlier restriction and grade capping were applied to control the extreme grades in the<br />
model. Table 14-17 shows a summary for copper that was evaluated from the cumulative probability plot.<br />
Table 14-17: Capping and Outlier Restriction Threshold and Range<br />
Copper<br />
Domain<br />
Maximum<br />
Value<br />
%Cu<br />
High Grade<br />
Threshold %Cu<br />
Population<br />
DOMCU1 2.39 1 99.50%<br />
DOMCU2 2.76 0.65 98.00%<br />
DOMCU3 4.91 1.7 95.00%<br />
DOMCU4 2.06 0.4 97.00%<br />
DOMCU5 7.14 3 99.50%<br />
DOMCU6 2.33 1.5 97.00%<br />
DOMCU7 4.24 1.3 99.90%<br />
DOMCU8 0.68 0.3 98.00%<br />
DOMCU9 0.65 0.2 95.00%<br />
DOMCU10 1.77 0.1 95.00%<br />
DOMCU11 0.45 0.15 80.00%<br />
DOMCU12 0.28 0.12 93.00%<br />
DOMCU13 0.36 0.2 95.00%<br />
The amount of copper metal removed (Or Reduction) by the application of the outlier restriction and<br />
capping strategy is discussed in Validation Model.<br />
Page | 179
14.1.4 GRADE ESTIMATION<br />
The block grade estimation was completed using a variety of interpolation methods. Ordinary kriging (OK),<br />
simple kriging (SK) and inverse distance to a power of 2 and 3 were selected as possible interpolation<br />
methods for grade estimation. Each element was reviewed by domain and an appropriate interpolation<br />
method was selected based on the quantity and spatial distribution of data and also the continuity of grades<br />
as indicated by the correlogram models.<br />
Three estimations were completed during the interpolation process:<br />
• Outlier-restricted inverse distance and kriging, using OK and SK to estimate the final resource<br />
model grade for each element.<br />
• Unrestricted inverse distance and kriging, using OK and SK to determine the metal reduction<br />
caused by the outlier restriction and capping strategies.<br />
• Unrestricted nearest-neighbor to provide an independent validation model to be used to validate<br />
the final resource model.<br />
In the case of copper, the block model variable CUIDU contains the unrestricted estimate. The block model<br />
variable CU contains the estimate using outlier restriction at the threshold summarized in the Table 6-11 and<br />
the nearest neighbor (NN) estimate is contained in the block model variable CUNNU.<br />
Each estimation was completed in three or four passes, according to the domain or element; the general<br />
estimation strategy is as follows:<br />
• Pass 1: Ordinary kriging (OK) or inverse distance,<br />
• Pass 2: OK or inverse distance, using the pass 1 search ellipsoid expanded by 50%<br />
• Pass 3: Simple kriging or inverse distance, using the pass 1 search ellipsoid<br />
expanded by 100%. Mean grade for simple kriging was obtained from<br />
maximum search radio of 450.<br />
• Pass 4: Assignment of local mean to un-interpolated blocks.<br />
The minimum and maximum number of composites used in block interpolation was four and twelve<br />
respectively, and the maximum number of composites from a single drill hole was two. Composite selection<br />
could change from pass 1 to pass 3. Interpolation plans for copper is provided in Table 14-18.<br />
Page | 180
Table 14-18: Summary of Interpolation Plan for Copper<br />
Blocks that are not estimated in the first or second passes are generally located in areas of sparse drilling.<br />
Under these conditions the data closest to the block will tend to have very weak correlations, and an<br />
ordinary kriged estimate would be very inaccurate. Neighborhood effects such as (adjacent blocks having<br />
very dissimilar kriged grades) would be seen in the output as composites entered and exited search<br />
ellipsoids as the ellipsoids passed through the model. Under these conditions, simple kriging is a more<br />
appropriate method.<br />
Local Means<br />
The local mean was calculated by averaging the composites within a maximum search distance of 450 m<br />
using the MineSight® procedure pintrp.dat. Simple kriging was applied in the third pass for Cu in some<br />
copper domains, as well as in the third pass for Zn, Mo, CuSS, CuCN and S. All other elements were<br />
estimated by inverse distance weighted to a power of two or three.<br />
Blocks that were not interpolated in passes 1, 2 or 3 were assigned the local mean in the four pass.<br />
Nearest-neighbor Assignment<br />
The unrestricted nearest-neighbor assignment (NN) was completed using the same search criteria used in<br />
the inverse distance and/or kriging. The NN assignment was performed in parallel with the ordinary kriging<br />
or inverse distance estimation in the three passes.<br />
The unrestricted NN grade assignment runs were completed using 7.5 m composites with the same<br />
MineSight® Multiruns as used in the unrestricted kriging and/or inverse distance estimate.<br />
Page | 181
Unrestricted Kriging<br />
Unrestricted kriging and/or inverse distance were completed using multiruns, MineSight® tool. Block model<br />
composite matching and composite selection was the same as for outlier-restricted kriging and/or<br />
inverse distance estimate.<br />
14.1.5 VALIDATION MODEL<br />
The validation set for block model consists of 509,<strong>43</strong>2 blocks that were classified as Measured and<br />
indicated mineral resources (RCLAS = 1 and 2) as described in Section 14.1.6.<br />
The validation set encompasses the portion of the deposit which contains the highest concentration of drill<br />
holes. A high degree of precision is expected in this portion of the model making it an important dataset to<br />
perform validation.<br />
A series of validation tools were used, including Visual Inspection, Histogram and probability, Plots, Boxplots,<br />
Swath plots, Contact plots, and Herco validation.<br />
Block Model Visualization<br />
A visual inspection of the estimated grades was performed, to confirm that the block model honors the drill<br />
hole data. During the review, several few grade-blowouts were detected at the west edge of the model<br />
where erratic, high grades were over-projected in areas of sparse drilling. These blowouts were then<br />
fixed by adjusting the outlier restriction strategy.<br />
The screen-capture plots in Figures 14-6 and 14-7 present a representative bench and section, respectively,<br />
for the copper model. These figures illustrate the spatial distribution of copper grades into the main<br />
Intrusive (MP1). The high-grade areas in red and magenta are characteristic of the supergene and mixed<br />
mineralization type zones.<br />
Page | 182
Figure 14-6: Copper Blocks Grades – Bench 4260<br />
Figure 14-7: Copper Block Grades – EW Section 8399850<br />
Page | 183
Global Bias Check<br />
Histograms and box plots of the unrestricted grades of the measured and indicated blocks were completed<br />
for variables and compared to composite values. Table 14-9 compares the validation set block model grades<br />
with the 7.5 m composite grades. The CV of the unrestricted kriged or inverse distance estimate<br />
(CUIDU) is much lower than the original 7.5 m composites due to the reasonable smoothing achieved<br />
during the interpolation. The average grade of the kriged or inverse distance estimated is also lower than the<br />
7.5 m composites within the mineralized copper domains (DOMCU3, DOMCU6 and DOMCU7).<br />
Some un-mineralized copper domains show a slightly higher value than the 7.5 m composites, this<br />
may indicate some conditional bias at the lower grades. The mean grades of the CUIDU are comparable<br />
with NN and CV values are reasonable. The average grade of the NN model represents a declustered<br />
distribution of composite grades and is used to check for global bias. The main mineralized copper<br />
estimation domains are unbiased compared to the NN model. There are some barren domains that show<br />
some bias, when isolated medium grade composite, is influenced for high grade NN block’s assignment.<br />
Swath Plots by Northing, Easting and Elevation<br />
Swath plots are used to check for local biases in the grade estimates. This was done by plotting the<br />
mean values from variables CUIDU and CUNNU in east-west, north-south and horizontal plan views.<br />
An example swath plot is presented in Table 14-19. Both variables agree well in general, and no major<br />
spatial bias was observed.<br />
Table 14-19: Comparison between Average Cu Grade of Composite and Validation Set Block Model<br />
Estimate<br />
Page | 184
Figure 14-8: MP1 Swath Plot for Copper Model<br />
Page | 185
Block Model Contact Plot<br />
Contact plots for the uncapped CUIDU kriging and inverse distance estimate were evaluated to assess<br />
how well modeling reproduced boundary relationships. The results show good correlation and are<br />
illustrated in Figure 8-4 which compares the original composite contact plot with the block model<br />
(CUIDU) contact plot between DOMCU5 and DOMCU7. The composite contact plot is on the left and<br />
block model contact plot is on the right.<br />
Figure 14-9:<br />
Contact Profile for DOMCU5 and DOMCU7<br />
Block Dispersion Variance and Herco Correction Factor<br />
Block dispersion variances (BDV) are required to calculates variance correction factor used in Herco<br />
validation. The BDV were calculated for the measured and indicated blocks in the model. The BDV<br />
values were calculated for four copper domains (Table 14-20). Herco analyses were not completed for<br />
un-mineralized copper domains.<br />
Table 14-20: BDV and CF for Measured and Indicated Blocks<br />
Copper<br />
Domain<br />
N°<br />
Blocks<br />
Block<br />
Dispersion<br />
Variance<br />
CV 7.5 m<br />
Comps<br />
CV<br />
NN<br />
CF<br />
DOMCU3 9,624 0.4<strong>43</strong>4 1.293 1.284 0.45<br />
DOMCU5 7,151 0.5149 0.835 0.868 0.476<br />
DOMCU6 6,008 0.5903 0.666 0.722 0.524<br />
DOMCU7<br />
331,988 0.6777 1.015 1.147 0.531<br />
186 | P a g e
Block dispersion variances were calculated with the Fortran program SBKC500.exe (SBK). Variogram<br />
models generated for each copper domain in the EDA section and its parameters were used as input into<br />
the SBK program.<br />
Corrections factors (CF), used in the Herco analysis, were calculated using the BDV, the 7.5 m composite<br />
CV (CV7.5), and nearest-neighbor assignment CUNNU CV (CVNN) in the following formula:<br />
CF = BDV7.5m * (CV7.5m) 2 / (CVNN) 2<br />
Herco Validation<br />
Herco validation was performed with the Fortran programs herco_04f.exe and gtcomp2.exe. Resulting<br />
grade–tonnage and grade-above-cut-off curve (Herco - adjusted and kriged).<br />
The table and grade-tonnage graphs for the Herco validation data set are in Table 14-21 and Figure 14-<br />
10, respectively. Figure 14-10 is an example for the DOMCU7.<br />
Table 14-21: Average Cu Grade Above Cut-off Validation Set –CUIDU Estimate<br />
Cut-off<br />
Herco Kriged/IDW Ratio Kriged/Herco<br />
(% Cu)<br />
% Above Cu Grade<br />
above cutoff<br />
(%)<br />
(%) Above Cu Grade<br />
above cutoff<br />
(%)<br />
(%) Above Cu Grade<br />
above cutoff<br />
(%)<br />
DOMCU3<br />
0 100 0.467 100 0.467 100 100<br />
0.2 75 0.582 77 0.571 103 98<br />
0.4 45 0.775 47 0.748 105 97<br />
0.6 26 0.979 26 0.958 <strong>101</strong> 98<br />
0.8 15 1.185 16 1.144 103 97<br />
1 9 1.39 8 1.393 89 100<br />
1.5 2 1.893 2 1.873 94 99<br />
DOMCU5<br />
187 | P a g e
Cut-off<br />
Herco Kriged/IDW Ratio Kriged/Herco<br />
(% Cu)<br />
% Above Cu Grade<br />
above cutoff<br />
(%)<br />
(%) Above Cu Grade<br />
above cutoff<br />
(%)<br />
(%) Above Cu Grade<br />
above cutoff<br />
(%)<br />
0 100 0.768 100 0.768 100 100<br />
0.2 97 0.785 97 0.79 99 <strong>101</strong><br />
0.4 80 0.885 79 0.897 98 <strong>101</strong><br />
0.6 58 1.037 54 1.086 93 105<br />
0.8 38 1.214 39 1.236 102 102<br />
1 24 1.406 28 1.374 116 98<br />
1.5 7 1.942 6 1.995 92 103<br />
DOMCU6<br />
0 100 0.524 100 0.524 100 100<br />
0.2 93 0.552 95 0.545 102 99<br />
0.4 63 0.667 66 0.642 105 96<br />
0.6 32 0.832 32 0.795 100 96<br />
0.8 14 1.018 11 1.016 78 100<br />
1 6 1.206 4 1.226 73 102<br />
1.5 0 1.657 1 1.622 113 98<br />
DOMCU7<br />
0 100 0.18 100 0.18 100 100<br />
188 | P a g e
Cut-off<br />
Herco Kriged/IDW Ratio Kriged/Herco<br />
(% Cu)<br />
% Above Cu Grade<br />
above cutoff<br />
(%)<br />
(%) Above Cu Grade<br />
above cutoff<br />
(%)<br />
(%) Above Cu Grade<br />
above cutoff<br />
(%)<br />
0.2 33 0.334 34 0.315 103 94<br />
0.4 7 0.555 6 0.519 80 94<br />
0.6 2 0.792 1 0.762 55 96<br />
0.8 1 1.032 0 1.002 47 97<br />
1.0 0 1.267 0 1.204 44 95<br />
1.5 0 1.813 0 1.663 21 92<br />
Figure 14-10: Herco DOMCU7 – Cu Ordinary Kriging Estimate<br />
In DOMCU3, the Herco-adjusted grade-proportion curves fit the inverse distance grade-proportion curves<br />
very well, indicating the appropriate amount of smoothing has been achieved using inverse distance<br />
squared interpolation. The total contained metal of the inverse distance estimate is 2% lower than the<br />
Herco validation at a 0.2% Cu cut-off. DOMCU3 is a minor ore contributor.<br />
189 | P a g e
In DOMCU5, the adjusted grade-proportion curves correspond well to the inverse distance cubed gradeproportion<br />
curves. The total contained metal of the inverse distance estimate is 1% higher at a 0.2%<br />
Cu cut-off than the Herco validation. DOMCU5 is a small unit and not an important contributor of<br />
copper mineralization.<br />
In DOMCU6, the adjusted grade-proportion curves correspond well with the inverse distance squared<br />
grade-proportion curves. The total contained metal of the inverse distance estimate is 1% lower than the<br />
Herco validation at a 0.2% Cu cut-off. The DOMCU6 is a minor ore contributor.<br />
In DOMCU7, the adjusted grade–tonnage curves fit reasonably well. The total contained metal of the<br />
kriged estimate is within 5% of the Herco validation at 0.4% Cu cut-off. DOMCU7 is a major ore<br />
contributor.<br />
The Herco validation indicates that the block model grade-tonnage profiles are valid and that the change<br />
of support from composite to SMU has been achieved.<br />
Metal Reduction<br />
The effective amount of metal removed by outlier restriction or capping can be evaluated by<br />
comparing kriged or inverse distance block models CUIDU and CU. An assessment of this effective<br />
amount by copper domain is presented in Table 14-22 for main mineralized copper domains. A total of<br />
1.1% metal was removed from the model for the main mineralized intrusive in the hypogene zone<br />
(DOMCU7), while in the other copper domains that are minor ore contributors, the quantity of metal<br />
removed was less than 5.8%, which was the target.<br />
Table 14-22: Quantity of Metal Removed in the Validation Blocks<br />
Rock Type (Code) Count Cu AVG Grade (% Cu) % Dif<br />
Uncapped<br />
Capped<br />
DOMCU3 9624 0.467 0.44 5.80%<br />
DOMCU5 7151 0.768 0.754 1.80%<br />
DOMCU6 6008 0.523 0.506 3.30%<br />
DOMCU7 331,988 0.18 0.178 1.10%<br />
* [(CAP-UNCAPPED)/UNCAPPED]<br />
14.1.6 RESOURCE CLASSIFICATION<br />
<strong>Hudbay</strong> has found it is useful to quantify risk, and to take this into account in mineral resource<br />
classification.<br />
For large mines, general risk quantification criteria, which <strong>Hudbay</strong> considers is acceptable, are as follows:<br />
190 | P a g e
The spatial continuity of Inferred Mineral Resources is not well known; it is usually impossible to reliably<br />
quantify risk.<br />
Indicated Mineral Resources should be known (tonnage, grade, and metal) with a relative accuracy of ±<br />
15% with 90% confidence. That is the true value will lie within 85% and 115% of the estimate, with 90%<br />
probability. The basis (support) is an annual production increment. Annual production increments are<br />
used for long range planning; most operations have sufficient spare capacity such that the mine plan can<br />
be adjusted to make up a shortfall of 15% in tonnage, grade or metal.<br />
Measured Mineral Resources should be known (tonnage, grade, and metal) with a relative accuracy of ±<br />
15% with 90% confidence, with a basis (support) of no more than a quarterly production increment.<br />
Monthly to quarterly production increments are used for short/medium term planning. Operating budgets<br />
and sales forecasts can be adjusted to make up a shortfall of 15% in tonnage, grade or metal for a<br />
quarter‘s production, but this would be regarded as an occasional occurrence (10% probability).<br />
Geostatistics provides an assortment of tools to establish confidence levels on resource estimates.<br />
The simplest of these methods involves evaluation of estimation variances for large blocks. This method<br />
gives an estimate of global confidence or confidence over large areas and is not dependent on the local<br />
data. In this method, the 90% confidence limits are calculated using the ordinary kriging standard<br />
deviation (σOK) and the coefficient of variation of the composites (CV):<br />
Relative Standard Error: RSE = σOK x CV<br />
Accuracy at 90% confidence level on the quarterly panel grade is then defined by:<br />
Q90% = 1.645 x RSE / √3<br />
Accuracy at 90% confidence level on an annual production equivalent panel grade is then defined by:<br />
A90% = Q90% / √4<br />
Note: The calculation is based on the assumption that there is independence between the quarterly<br />
panels, and the grade distribution is normal.<br />
This method was used to determine the confidence limits for a series of possible drilling configurations at<br />
Constancia.<br />
The results from the confidence limits study are summarized in Table 14-23. These results indicate that,<br />
according to drill hole spacing analysis, a drilling spacing of 50 m by 50 m could be used to classify<br />
material as measured resources and drilling spacing of 80 m by 80 m could be used to classify material<br />
as indicated resources. These results obtained are similar for other Cu porphyry deposits. For a given<br />
deposit, the confidence limits are inversely related to the monthly volume (i.e., to the daily mining rate).<br />
Thus, a 50 m x 50 m drill spacing will support measured resources for Constancia at mining rates of<br />
60,000 Mt/day or greater. At lower mining rates, closer drill spacing may be needed.<br />
191 | P a g e
Table 14-23: Results of Confidence Limits Calculations<br />
Spacing (X x Y or N x E)<br />
CVCom<br />
p<br />
KV RSE A90% Q90% Slope BDV KV/BDV<br />
50 m x 50 m 1.398 0.0116 0.15 8% 15% 0.93 0. 155 0.07<br />
60 m x 60 m 1.398 0.0167 0.18 9% 18% 0.94 0. 155 0.11<br />
80 m x 80 m 1.398 0.0<strong>43</strong>7 0.29 14% 28% 0.79 0. 155 0.28<br />
100 m x 100 m 1.398 0.0746 0.38 19% 37% 0.67 0. 155 0.48<br />
KV<br />
RSE<br />
Ordinary Kriging Variance for the estimation of a monthly volume.<br />
Relative Standard Error = CVcomp x OK.<br />
A90% Confidence Limit at 90% for an Annual Volume = (1.645 x RSE) / √ 12.<br />
Q90% Confidence Limit at 90% for a Quarterly Volume = (1.645 x RSE) / √ 3.<br />
BDV<br />
Slope<br />
KV/BDV<br />
Block Dispersion Variance.<br />
Slope of regression line.<br />
Ordinary Kriging Variance to Block Dispersion Variance ratio.<br />
Closer spaced drilling will affect the analysis of the calculations since results are contingent on data<br />
variability that can get better or worse with infill drilling.<br />
Computerized classification systems, such as the one used at Constancia, always produce discontinuous<br />
results (see isolated indicated blocks within a zone of measured blocks in Figure 9-1, particularly in zones<br />
with low data density). Therefore, it was recommended either to use a post-processing (smoothing)<br />
procedure to eliminate isolated blocks or, alternatively, to use the results from the computerized<br />
classification only as a first approximation, and manually draw by hand the Measured and Indicated<br />
boundaries on a bench by bench (or section by section) basis as see in Figure 9-2.<br />
All interpolated blocks that did not meet the criteria for Measured and Indicated Mineral Resource were<br />
classified as Inferred Mineral Resource if they fell within the drill hole grid and/or had geological<br />
information.<br />
192 | P a g e
Figure 14-11: Isolated Indicated block within of Measured Blocks - Bench 4260<br />
Figure 14-12: Measured and Indicated Boundaries on a Bench by Bench Basis<br />
14.1.7 MINERAL RESOURCES<br />
A pit optimization was performed using the MineSight® Economic Planner module to delimit the portion of<br />
the mineral resource block model having reasonable prospects for economic extraction. The Constancia<br />
mineral resource pit consists of a non-operational pit shell, considers measured, indicated and inferred<br />
mineral resources (Figure 14-14) and is based on the economic and technical inputs in Table 14-24 and<br />
an overall 45° pit slope.<br />
193 | P a g e
Table 14-24: Economic Parameters for Mineral Resource Pit Shell<br />
Mineral<br />
Material<br />
Type<br />
Metal Price<br />
($/t)<br />
Recovery (%)<br />
Mining<br />
Cost($/t)<br />
Process Cost<br />
($/t)<br />
Cu All 6,349 89% 1.8 5.0<br />
Mo All 35,274 60% 1.8 5.0<br />
Figure 14-13: Constancia Mineral Resource Pit Shell (MII)<br />
Mineral Resource Statement<br />
Mineral resources above a 0.12% Cu cut-off grade are listed in Table 14-25. Mineral resources above a<br />
cut-off grade of 0.12% Cu have reasonable prospects for economic extraction considering a copper price<br />
of $2.88/lb, a molybdenum price of $16.00/lb, copper recovery of 89%, molybdenum recovery of 60%,<br />
and processing costs of $5.5/t and mining costs of $1.30/t.<br />
194 | P a g e
Table 14-25: Mineral Resources with EffectiveDate23 August, 2011<br />
Category Tonnage (Mt) Cu % Ag ppm Mo ppm Au ppb<br />
Measured 537.38 0.31 3 88.4 41.4<br />
Indicated 408.17 0.21 2.1 57.7 33.9<br />
Measured +<br />
Indicated<br />
945.55 0.27 2.61 75.15 38.16<br />
Inferred 221.11 0.19 1.8 48.6 31.8<br />
Note: Mineral Resources are stated above a copper cut-off grade of 0.12% and have reasonable<br />
prospects for economic extraction.<br />
14.2 PAMPACANCHA<br />
The Pampacancha mineral resources estimate was developed by <strong>Hudbay</strong>’s Geology Team under the<br />
direction of Robert Carter, P. Eng. Director <strong>Technical</strong> Services and reviewed by the QP Cashel Meagher.<br />
14.2.1 MODEL AND COMPOSITE SETUP<br />
The resource block model was created using Gemcom v6.3 on PSAD56 UTM Zone 19S coordinates with<br />
an origin at 204,200 m east, 8,396,950 m north, and 4,400 m above sea level elevation.<br />
Topographic Surface<br />
The topographic surface used for this resource estimation was the same surface provided by <strong>Hudbay</strong>.<br />
UTM coordinates based on the Provisional South America 1956 (PSAD56) datum were used for the collar<br />
survey that is the base for the Pampacancha Resources block model.<br />
Resource Drilling<br />
A total of 110 drill holes (totalling 30,812 meters in length) were used in the resource estimation for<br />
Pampacancha, as shown in Table 14-26. Drill hole spacing along the deposit was almost 50 m. Core<br />
recovery was near 100% for all holes and there are no factors that could materially impact the accuracy<br />
and reliability of the drilling results. All holes were drilled from surface by Geotec using HQ and NQ core<br />
size.<br />
195 | P a g e
Table 14-26: Overranges for main element.<br />
Campaign Type Holes Length<br />
Min (m)<br />
Length<br />
Max (m)<br />
Total<br />
Length (m)<br />
Norsemont RC 14 166 349 3,695<br />
Norsemont DDH 59 54.6 500.1 16,107.55<br />
<strong>Hudbay</strong> DDH 37 153.7 609.65 11,010.40<br />
TOTAL 110 54.6 609.65 30,812.95<br />
Surface Mapping<br />
Surface mapping was used to adjust the section interpretations. The compilation map was provided by<br />
<strong>Hudbay</strong> as DXF files and transferred to the GEMS® and converted into 3D surface with the capability of<br />
being sliced in vertical sections to be used in the geological modeling. Figure 14-14 shows the geologic<br />
map for the deposit.<br />
196 | P a g e
Figure 14-14: Pampacancha Compilation Geology Map<br />
Composite Length<br />
A review of copper assay values for the resource estimation included the preparation of histograms and<br />
cumulative probability charts. Because high grade outliers can lead to overestimation of a resource, the<br />
high grade assays were capped at the 99.7 percentile prior to compositing. The capped assay value for<br />
copper was 4.22% Cu.<br />
Assay samples were composited into 2 m downhole lengths. The start of the composite is the collar of the<br />
drill hole. Intervals with missing assays were ignored and a new composite was generated at that point.<br />
Values below assay detection limits were set to half of that detection limit. Codes were assigned based on<br />
the location of the composite centroid relative to the geologic block model.<br />
197 | P a g e
Block Model Set Up<br />
Block dimensions of 10m by 10m by 5m were selected based on average width of the resource<br />
wireframes, as well as anticipation of the smallest mining unit. Block model geometry and parameters are<br />
provided in Table 14-27.<br />
Table 14-27: Block Model Limits and Size (PSAD56 UTM Zone 19S)<br />
East North Elevation<br />
Min Coordinate 204200 8396950 3940<br />
Max Coordinate 205050 8397900 4400<br />
Number<br />
Blocks<br />
of<br />
85 95 92<br />
14.2.2 GEOLOGICAL MODEL<br />
Lithology Model<br />
The geologic model for Pampacancha corresponds to a lithological model developed by the <strong>Hudbay</strong><br />
geology team, which is based on lithology data from core logging. Modelled lithological units are:<br />
Limestone (LMT), Diorite (DIO), Diorite porphyry (PDI), Skarn (SKN) and Monzonite porphyry (MP2). The<br />
geologic model was done by section and plan view in Gemcom and then converted to triangulations. The<br />
<strong>Hudbay</strong> geology team validated the triangulations with contact points from drill holes. These units were<br />
converted to wireframe solids to provide the primary support for the estimation domains. Table 14-28<br />
summarizes the lithological domains used for modeling and their relationship with core logging data.<br />
Table 14-28: Lithological Unit Description Domain<br />
Unit<br />
Code<br />
Limestone<br />
LMT<br />
Diorite<br />
DIO<br />
Dioritic porphyry<br />
PDI<br />
Skarn<br />
SKN<br />
Monzonite porphyry<br />
MP2<br />
198 | P a g e
The <strong>Hudbay</strong> geology team determined that the Skarn unit hosts the majority of the copper and the<br />
mineral resource estimation was completed only for the Skarn. No other mineralized lithology unit was<br />
estimated. The geological interpretation is based on a diorite porphyry intrusion being the source of<br />
copper fluids and solutions subsequently disseminated through the Skarn unit acting as a buffer to the<br />
precipitate copper content inside the Skarn unit. Figure 14-15 shows a wireframe solid of each of the<br />
modeled geological units and the drill holes used to complete the interpretation.<br />
Figure 14-15: 3D View of the Geological Model of Pampacancha Project<br />
Diorite<br />
Limestone<br />
MonzonitePorphyry<br />
DioriticPorphyry<br />
Skarn<br />
199 | P a g e
Bulk Density<br />
A total of 56 density measurements were taken from actual core for the Pampacancha project. The<br />
density measurements were conducted by ALS Chemex and are representative of the different rock and<br />
mineralization domains recognized to date.<br />
Specific gravity (SG) was measured on 56 sampled assay intervals included in the resource<br />
estimation. A summary of all the measured SG values that were part of the resource estimation is<br />
displayed in Table 14-29.<br />
Table 14-29: Summary of Measured SG Values<br />
Lithology Number of Minimum Maximum Mean<br />
Skarn 21 2.62 4.29 3.5<br />
Endoskarn 11 2.63 3.32 2.94<br />
Dioritic<br />
Porphyry<br />
13 2.58 3.04 2.75<br />
Diorite 11 2.51 3.03 2.78<br />
The average specific gravity value used to estimate resources was based on the endoskarn and skarn<br />
values shown in Table 13-3, and was 3.31. After removing outliers and values greater or equal to 4 the<br />
average was reduced to 3.22 this is what was used to estimate tonnages.<br />
14.2.3 EXPLORATORY DATA ANALYSIS<br />
A total of 15,932 assay intervals from 110 drill holes, as of the January 07, 2012 cut-off date, were<br />
selected as defining the mineral resource estimate for the Pampacancha deposit. Samples were<br />
grouped according to their interpreted lithology. Sample statistics of the assayed information are shown in<br />
Table 14-30. Data analysis was conducted by creating probability and histogram plots of the data.<br />
200 | P a g e
Table 14-30: Range of Assay Values (Uncapped) by Unit<br />
SKARN Cu Mo Ag Au Zn<br />
ppm ppm ppm ppb ppm<br />
Records 5907 5907 5907 5907 5907<br />
Minimum 0.25 0.50 0.10 2.50 18.20<br />
Maximum 253800 15000 1382 77000 68400<br />
Mean 3326.99 110.70 3.96 287.08 1059.83<br />
Std. Dev. 7351.31 346.67 20.06 1667.91 3497.79<br />
CV 2.21 3.13 5.06 5.81 3.30<br />
DIORITIC<br />
PORPHYRY<br />
Cu Mo Ag Au Zn<br />
ppm ppm ppm ppb ppm<br />
Records 1761 1761 1761 1761 1761<br />
Minimum 3.20 0.50 0.10 2.50 35.00<br />
Maximum 23900.00 3049.00 372.00 33670 46100.00<br />
Mean 596.26 59.88 1.80 137.46 812.70<br />
Std. Dev. 1323.72 203.27 9.25 945.35 2854.74<br />
CV 2.22 3.39 5.12 6.88 3.51<br />
201 | P a g e
LIMESTONE Cu Mo Ag Au Zn<br />
ppm ppm ppm ppb ppm<br />
Records 2061 2061 2061 2061 2061<br />
Minimum 0.25 0.50 0.10 2.50 9.70<br />
Maximum 92600.00 1968.00 110.00 15080 56700.00<br />
Mean 470.29 27.40 1.86 77.97 942.42<br />
Std. Dev. 942.42 120.17 5.22 504.67 2684.87<br />
CV 5.74 4.39 2.80 6.47 2.85<br />
MONZONITE<br />
PORPHYRY<br />
Cu Mo Ag Au Zn<br />
ppm ppm ppm ppb ppm<br />
Records 1<strong>43</strong>4 1<strong>43</strong>4 1<strong>43</strong>4 1<strong>43</strong>4 1<strong>43</strong>4<br />
Minimum 0.25 0.50 0.10 2.50 36.20<br />
Maximum 12300.00 466.00 33.90 10050 32600.00<br />
Mean 151.<strong>43</strong> 5.54 0.86 82.05 404.99<br />
Std. Dev. 616.97 28.28 1.66 423.57 1484.54<br />
CV 4.07 5.10 1.93 5.16 3.67<br />
202 | P a g e
DIORITE Cu Mo Ag Au Zn<br />
ppm Ppm ppm ppb ppm<br />
Records <strong>43</strong>60 <strong>43</strong>60 <strong>43</strong>60 <strong>43</strong>60 <strong>43</strong>60<br />
Minimum 0.25 0.50 0.10 2.50 32.00<br />
Maximum 20500.00 1415.00 86.60 12820 53900.00<br />
Mean 192.25 18.24 1.06 53.87 528.61<br />
Std. Dev. 537.84 69.08 2.75 341.54 1920.46<br />
CV 2.80 3.79 2.60 6.34 3.63<br />
Capping of High Grades<br />
A review of copper assay values for the resource estimation included the preparation of histograms and<br />
cumulative probability charts. Because high grade outliers can lead to overestimation of a resource, the<br />
high grade assays were capped at the 99.7 percentile prior to compositing. The capped assay value for<br />
copper was 4.22% Cu.<br />
14.2.4 GRADE ESTIMATION<br />
Spatial Analysis<br />
Correlograms using Gemcom software were completed for the skarn copper composites based on the<br />
wireframe interpretation. Correlograms were generated to determine the spatial continuity of the<br />
composited mineralization using omni-directional search parameters. The search rotation conforms to the<br />
interpreted mineralization trends of the Skarn Unit. A summary of the results is shown in Tables 14-31<br />
and 14-32.<br />
Table 14-31: Variography Parameters for Copper<br />
Unit Nugget Sill 1 Range<br />
(m)<br />
Skarn 0.173374 0.224017 42.453<br />
203 | P a g e
Table 14-32: Parameters of Ellipse Rotation<br />
Unit<br />
Major-<br />
Axis m<br />
Semi<br />
Major-Axis<br />
m<br />
Minor-<br />
Axis m<br />
Strike Dip Plunge<br />
Skarn 82 77 57 -134.338° -44.961° 0°<br />
Interpolation Plan<br />
The interpolation plan of the Pampacancha resource estimation model was completed using the<br />
following estimation methods: ordinary kriging (OK), inverse distance squared (ID2), and inverse<br />
distance cube (ID3).<br />
The OK, ID2 and ID3 estimations were completed in two iterations with the search parameters in Table<br />
14-33. The first pass is designed to estimate a block grade where there is a minimum of four composites<br />
found and up to a maximum of twelve with a limit of three composites per drill hole based on the search<br />
distances shown. The second pass doubles the search distance, therefore allowing non estimated blocks<br />
to be estimated.<br />
Table 14-33: Search Parameters for Skarn by Pass<br />
Unit Pass Major Semi Minor Minimum Maximum Per Drill<br />
Skarn First 82 77 57 4 12 3<br />
Second 164 154 114 4 12 3<br />
14.2.5 VALIDATION MODEL<br />
The Pampacancha resource estimation model was validated by the following methods:<br />
• Comparison of the global mean grades based on OK, ID2 and ID3 estimation methods.<br />
• Inspection of the OK block model grades in plan and sectional views in comparison to the drill<br />
hole composite grades.<br />
• Swath plot comparisons of the estimated methods of OK, ID2 and ID3.<br />
Global Comparison<br />
The block model estimation for the OK method compared to the estimation of the ID2 and ID3 model<br />
values with a cut-off of 0.2% Cu, as illustrated in Table 14-34, Table 14-35 and Table 14-36, shows that<br />
these different methods provided very similar results.<br />
204 | P a g e
Table 14-34: Mineral Resource by Ordinary Kriging (Cut-off 0.2% Cu)<br />
Method Resources Volume Density Tonnage Cu Au Ag Mo<br />
m 3<br />
1000<br />
x<br />
t / m 3 t x 1000 % ppb ppm ppm<br />
OK Measured 3,581 3.220 11,531 0.62 342.32 5.<strong>43</strong> 168.35<br />
Indicated 12,329 3.220 39,701 0.55 314.88 6.11 135.44<br />
Inferred 1,389 3.220 4,474 0.<strong>43</strong> 215.47 6.50 110.82<br />
Table 14-35: Mineral Resource by Inverse Distance Squared (Cut-off 0.2% Cu)<br />
Method Resources Volume Density Tonnage Cu Au Ag Mo<br />
m 3<br />
1000<br />
x<br />
t / m 3 t x 1000 % ppb ppm ppm<br />
ID2 Measured 3,536 3.220 11,388 0.64 344.18 5.45 166.50<br />
Indicated 12,023 3.220 38,716 0.58 316.50 6.16 135.73<br />
Inferred 1,257 3.220 4,049 0.44 226.18 6.76 118.14<br />
Table 14-36: Mineral Resource by Inverse Distance Cubed (Cut-off 0.2% Cu)<br />
Method Resources Volume Density Tonnage Cu Au Ag Mo<br />
m 3<br />
1000<br />
x<br />
t / m 3 t x 1000 % ppb ppm ppm<br />
ID3 Measured 3,392 3.220 10,924 0.67 349.61 5.55 167.52<br />
Indicated 11,<strong>43</strong>7 3.220 36,827 0.61 321.91 6.29 137.59<br />
Inferred 1,170 3.220 3,767 0.45 231.20 6.85 125.06<br />
205 | P a g e
Visual Comparison<br />
The block model was checked in plan and section views to compare block copper grades with the<br />
drill hole copper grades, and ensures that the interpolation honoured the composites. The visual<br />
comparison of block grades with composite grades of copper showed a reasonable correlation between<br />
the values. Figure 14-16 display the copper colour coded OK block model grades and drill hole copper<br />
composites in longitudinal view looking south for copper. Looking north showing the OK Copper Colour<br />
Coded Block Model Grades (above) and Drill Hole Composite Values (below) for the Skarn Lithology<br />
Figure 14-16: East-West Section 8,397,055 m N<br />
206 | P a g e
Swath Plots<br />
Swath plots were generated to assess the model for global bias by comparing OK values with ID2<br />
and ID3 values of the estimated blocks on elevations and east-west (eastings) throughout the deposit<br />
(Figures 14-18 and 14-19). The ID2 and ID3 models show slightly higher values of the grades compared<br />
to the OK method. The swath plot results have a similar trend between the three estimation methods.<br />
Figure 14-17: Elevation Swath Plots<br />
Figure 14-18: Easting Swath Plots<br />
207 | P a g e
14.2.6 MINERAL RESOURCE CLASSIFICATION<br />
Mineral resources have been classified according to the CIM Definition Standards on Mineral Resources<br />
and Mineral Reserves (CIM definitions), as incorporated in NI <strong>43</strong>-<strong>101</strong>. Resource blocks are classified as<br />
Measured, Indicated or Inferred, depending upon the confidence level of the resource based on Table 14-<br />
37 parameter requirements of blocks estimated within a defined search distance with a minimum number<br />
of composites.<br />
Table 14-37: Mineral Classification Resource<br />
Unit Resource Major Semi Minor Minimum Maximum Per Drill Hole<br />
Major<br />
Skarn Measured 41 38 28 8 12 3<br />
Indicated 82 77 57 6 12 3<br />
Inferred 164 154 114 4 12 3<br />
The location of the classified Measured, Indicated and Inferred Resource blocks for Skarn shows a<br />
reasonable continuity of the classification as in Figures 14-19 and 14-20.<br />
Figure 14-19: Plan View at 4532.5 m Elevation<br />
Showing the Distribution of Measured, Indicated and Inferred Mineral<br />
Resource Blocks of the Pampacancha deposit.<br />
208 | P a g e
Figure 14-20: Section View 8,397,055 m N<br />
Showing the Distribution of Measured, Indicated and Inferred Mineral Resource Blocks of the<br />
Pampacancha deposit.<br />
14.2.7 MINERAL RESOURCES<br />
Mineral resources estimated by the ordinary kriging interpolation method for the Pampacancha deposit<br />
are shown in Table 14-38 at a 0.2% cut-off.<br />
Table 14-38: Mineral Resources by Ordinary Kriging (Cut-off 0.2% Cu)- effective April 2, 2012<br />
Category Tonnage (Mt) Cu % Ag ppm Mo ppm Au ppb<br />
Measured 11.53 0.62 5.<strong>43</strong> 168.35 342.32<br />
Indicated 39.70 0.55 6.11 135.44 314.88<br />
Measured +<br />
Indicated<br />
51.23 0.57 5.96 142.85 321.06<br />
Inferred 4.47 0.<strong>43</strong> 6.5 110.82 215.47<br />
Note: No copper equivalency was used for the copper cut-off value and the estimated resource reports<br />
each grade value separately.<br />
209 | P a g e
15.0 MINERAL RESERVE ESTIMATES<br />
The Mineral Reserve Estimates for the project are based on block models compiled under Section 14,<br />
Mineral Resource Estimates, Net Smelter Return, and the detailed Pit Design.<br />
Mining, processing, and economics parameters have been used to develop the mineral reserve estimate<br />
for the project. The mineral reserve economics are described in Section 22, Economic Analysis, of this<br />
<strong>Technical</strong> <strong>Report</strong>.<br />
This Mineral Reserve estimate has been determined and reported in accordance with NI <strong>43</strong>-<strong>101</strong> and the<br />
classifications adopted by CIM Council in November 2010. NI <strong>43</strong>-<strong>101</strong> defines a Mineral Reserve as “the<br />
economically mineable part of measured and indicated mineral resources”.<br />
Mineral Reserves estimates for the Constancia and Pampacancha deposits, which are presented in this<br />
report, were prepared by Audra Walsh (President, CEO at A2Z Mining Inc); and approved by <strong>Hudbay</strong><br />
(under the supervision of Cashel Meagher, Vice-President South America Business Unit and a QP<br />
pursuant to NI <strong>43</strong>-<strong>101</strong>). The mineral reserve estimates for the Constancia deposit and the Pampacancha<br />
deposit were done at the feasibility study level and the pre-feasibility study level, respectively.<br />
15.1 PIT OPTIMIZATION<br />
Revenue from the Constancia Project will be generated from the sale of copper and molybdenum<br />
concentrates to smelters and roasters who will further refine the product. In addition, the copper<br />
concentrate contains some payable silver and minor quantities of gold credits. Significant amounts of zinc<br />
and lead are also present in the deposit but in quantities that are uneconomic to liberate.<br />
Pit optimization of multi-element revenue generating deposits like Constancia and Pampacancha can<br />
either be performed on the grade equivalent of all the revenue generating elements expressed in terms of<br />
the predominant metal (copper in the case of Constancia and Pampacancha), or on the Net Smelter<br />
Return (NSR).<br />
A copper grade equivalent optimization model is simpler to implement than a NSR model but is not able<br />
to adequately represent the many variables used in the calculation of revenues as a NSR model can.<br />
<strong>Hudbay</strong> has therefore decided to use a NSR optimization model despite its additional complexity.<br />
Ultimate and staged pit designs were developed by <strong>Hudbay</strong> from optimization shells. Six pit stages were<br />
selected for the Constancia pit (San José is the third Stage) and a single stage for the Pampacancha pit.<br />
15.1.1 BLOCK MODELS<br />
The Block Models used for the Mineral Reserve Estimation have as a base the original Mineral<br />
Resources Estimation described in Section 14. Taking the original Resource model for Constancia and reblocking<br />
its Selective Mining Unit (SMU) from 10x10x15 meters to 20x20x15 meters, and re-blocking the<br />
Pampacancha resource model SMU from 10x10x5 meters to 20x20x10 meters.<br />
The regularized models which were created to simulate the actual mining practice by regularizing the<br />
SMU block sizes were considered a diluted model (the resulting dilution was approximately 2% in the<br />
Constancia deposit and 7.5% in the Pampacancha deposit). Neither internal nor external dilution was<br />
added to the block models during the Mineral Reserve Estimation.<br />
The Qualified Person concluded that smoothing within the block model provided sufficient dilution and<br />
accounted for potential mine losses.<br />
210 | P a g e
Mine Design and Reserve estimation for the Constancia and Pampacancha pits used the NSR block<br />
models, which consist of the NSR values calculation for each block in the block models, taking into<br />
account the Cu, Mo, Ag, and Au grades, mill recoveries, contained metal in concentrate, deductions and<br />
payable metal values, metal prices, freight costs, smelting and refining charges and royalty charges. All of<br />
these parameters were applied to the block model (re-blocked resource models) to form the basis of the<br />
reserve estimate.<br />
15.1.2 NET SMELTER RETURN<br />
Prior to the export of the resource model into the pit optimization software Whittle Four-X in the case of<br />
Constancia and Minesight for Pampacancha, the in-situ NSR value was first calculated and coded into<br />
each block in the model. This is to allow the pit optimization of the multi-element Constancia and<br />
Pampacancha deposits to be carried out on the in-situ NSR values. The following process is the<br />
procedure that was developed in order to achieve the NSR calculation:<br />
In-situ NSR is the net value of metals contained in a concentrate produced from an ore block after<br />
smelting and refining. Using the concentrator recovery of the metals into the concentrate and the grade of<br />
the concentrate produced, the mass pull of each block in the resource model expressed in terms of<br />
tonnes of concentrate per tonne of ore processed is first estimated.<br />
The value of the payable metals in the concentrate is then calculated based on agreed payable metal<br />
content in the concentrate subject to deductions with smelters and roasters. In the case of the copper<br />
concentrate, the payable precious metals silver and gold are added to the value of the payable copper.<br />
For the molybdenum concentrate, only the molybdenum metal is payable.<br />
From the value of the payable metals, the selling costs which include the marketing costs, transport costs,<br />
port charges, insurance costs, shipping costs, and smelting charges expressed in $/dmt concentrate and<br />
other deductions like the refining charges and price participation expressed in $/payable metal are taken<br />
out to obtain the gross concentrate NSR value (before royalties).<br />
The royalties applicable are then deducted from the gross concentrate NSR value to obtain the net<br />
concentrate NSR value (after royalties). The concentrate NSR value calculations described above are<br />
applied for both the copper and molybdenum concentrates.<br />
The concentrate NSR value after royalties for the copper and molybdenum concentrates are then<br />
multiplied by their respective mass pull expressed in tonnes of concentrate produced per tonne of ore<br />
processed to obtain the contribution of each concentrate to the in-situ NSR value.<br />
The in-situ NSR of each block in the regularized resource model is the sum of the in-situ NSR value from<br />
the copper concentrate and the molybdenum concentrate.<br />
Resource model blocks which are of the indicated or measured resource categories with NSR values<br />
greater than their processing costs are considered potential ore while blocks which have NSR values less<br />
than their processing costs are considered as waste.<br />
Process plant recoveries, throughputs, operating costs, and concentrate grades vary by ore type.<br />
Consistent with ore reserve reporting guidelines, only Measured and Indicated resources are coded to<br />
generate revenues in the NSR model. Inferred resources are coded and reported as waste.<br />
Processing metal recoveries for copper, silver, gold, zinc, and lead are fixed numbers depending on the<br />
metallurgical domain while molybdenum is calculated by a formula linked to molybdenum and copper<br />
feed grades, and copper recovery. Copper, silver, gold, zinc, and lead grades in the copper concentrate<br />
are calculated by a formula. The grade of molybdenum in the molybdenum concentrate is a fixed number.<br />
211 | P a g e
NSR Input Parameters<br />
The revenue, recovery and cost input parameters used for pit optimization are showed in Tables 15-1 and<br />
15-2.<br />
Table 15-1: NSR Parameters<br />
Parameter Unit Value<br />
Revenue<br />
Metal Price<br />
Copper $/lb 2.75<br />
Molybdenum $/lb 14.00<br />
Silver $/oz 23.00<br />
Gold $/oz 1150.00<br />
Recoveries into Concentrator<br />
Hypogene, Supergene and Mixed<br />
Copper % 89.0<br />
Moly % formula<br />
Silver % 80.0<br />
Gold % 60.0<br />
Zinc % 50.0<br />
Lead % 25.0<br />
Skarn, HiZinc and Pampacancha Skarn<br />
Copper % 84.4<br />
212 | P a g e
Parameter Unit Value<br />
Moly % formula<br />
Silver % 52.0<br />
Gold % 60.0<br />
Zinc % 30.0<br />
Lead % 41.4<br />
Payable Contained Metal<br />
Copper % 96.5<br />
Moly % 100.0<br />
Silver % 97.0<br />
Gold % 97.0<br />
Concentrate Grades<br />
Dilution % 10.0<br />
Copper concentrate grade<br />
Copper % formula<br />
Silver g/t formula<br />
Gold g/t formula<br />
Zinc % formula<br />
Lead % formula<br />
213 | P a g e
Parameter Unit Value<br />
Moly concentrate grade<br />
Molybdenum % 40.0<br />
Deductions<br />
Copper Deduction<br />
Per unit of<br />
payable Cu<br />
1.00<br />
Moly Discount<br />
% Mo in<br />
Moly Con<br />
0%<br />
Minimum Silver Deduction in Cu Concentrate<br />
Ag g/dmt Cu<br />
conc<br />
20.00<br />
Gold Deduction<br />
Au g/dmt Cu<br />
conc<br />
0.75<br />
Concentrate Moisture Contents<br />
Copper Concentrate Moisture Content % 9.0<br />
Moly Concentrate Moisture Content % 15.0<br />
Smelting Charges<br />
Smelting charges - copper concentrate (dry)<br />
$/dmt Cu<br />
conc<br />
80.00<br />
Roasting charges - moly concentrate (dry)<br />
$/dmt Mo<br />
conc<br />
1764.0<br />
Selling Costs<br />
Marketing Costs - Concentrates $/t conc 0.00<br />
Transport - Cu concentrates - truck to port $/wmt conc 35.00<br />
214 | P a g e
Parameter Unit Value<br />
Transport - Mo concentrates - truck to port $/wmt conc 216.00<br />
Port charges concentrate $/wmt conc 25.50<br />
Insurance $/wmt conc 1.24<br />
Shipping - Cu concentrates $/wmt conc 47.50<br />
Shipping - Mo concentrates $/wmt conc 0.00<br />
Payable Metal in Concentrate<br />
Copper<br />
% Cu in Cu<br />
conc<br />
27.13<br />
Moly<br />
% Mo in<br />
Moly conc<br />
40.00<br />
Silver<br />
g payable<br />
Ag/dmt Cu<br />
conc<br />
189.97<br />
Gold<br />
g payable<br />
Au/dmt Cu<br />
conc<br />
0.00<br />
215 | P a g e
Table 15-2: NSR Parameters<br />
Parameter Unit Value<br />
Refining Charges<br />
Payable Cu $/lb Cu 0.07<br />
Payable Mo $/lb Mo 0.00<br />
Payable Ag $/oz Ag 0.45<br />
Payable Au $/oz Au 4.50<br />
Royalties<br />
Royalties % of NSR 1.9%<br />
Operating Costs<br />
Processing<br />
Hypogene $/t 4.72<br />
Supergene $/t 4.34<br />
Mixed $/t 4.35<br />
Skarn $/t 4.25<br />
HiZinc $/t 4.25<br />
Pampacancha Skarn $/t 4.72<br />
General &<br />
Administration<br />
G & A Cost $/t 1.32<br />
216 | P a g e
Mining Cost - Open Pit<br />
Mining cost ore/waste $/t 1.90<br />
15.1.3 CONSTANCIA OPTIMIZATION RESULTS<br />
The Whittle 4-X program was utilized to create pit shells based on the Lerch Grossman method which<br />
calculates each block and its value (NSR). The following Figure 15-1 shows the results of the exercise for<br />
the Constancia pit.<br />
Figure 15-1: Constancia Whittle results<br />
In the case of Constancia, the pit that provides the risk-based maximum value on a break-even cutoff is<br />
just under 1Bdmt total material. This is indicated in the red circle above where the worst case starts to<br />
level off but most of the value has been achieved. Choosing this shell allows for flexibility and expansion<br />
potential in the future as well as providing an optimal NPV for this point in time.<br />
15.1.4 PAMPACANCHA OPTIMIZATION RESULTS<br />
For the Pampacancha pit, the current economics and measured and indicated resources were used by<br />
the Lerch-Grossman algorithm for setting the optimum pit limits. The Pampacancha mineral reserves are<br />
the measured and indicated resources contained in the ultimate pit design that are scheduled for<br />
treatment in the LOM plan. The reserve reporting is based on the NSR cut-off that is estimated using the<br />
metal prices and other parameters as part of the NSR calculations.<br />
The estimated reserves for Pampacancha are based on the May 2012 ultimate pit design which was<br />
designed based on the Lerch-Grossman shells created by Cube Consulting in May 2012 using<br />
MineSight® software and Whittle.<br />
The results from MineSight and Whittle were very similar with only minor differences. A total of 25 pit<br />
shells were created in each run starting at a factor of 5% of the base value for ore blocks through to 150%<br />
of the base value. The results from Whittle and the ultimate pit design are shown in the following Figure<br />
15-2.<br />
217 | P a g e
The current Pampacancha final pit limit is similar to pit shell 15 which was created at 50% of the base<br />
value for ore. Pit shell 15 is where the best case graph starts to level out, indicating that there is little<br />
additional value in going to a larger pit. This analysis implies that the current pit design allows for<br />
flexibility and expansion potential in the future as well as providing a risk-based maximum value for this<br />
point in time.<br />
Figure 15-2: Pampacancha Whittle results<br />
15.1.5 PIT DESIGN CRITERIA<br />
The Pit optimization and the detailed pit design were based on the anticipate profitability of the in situ<br />
blocks, and on the ability of each block of feed to cover the cost of stripping waste to access the feed<br />
block, utilizing the Lerch-Grossman algorithm.<br />
For the pit design, the targeted minimum mining width was 90 meters and honored the wall slope design<br />
provided by Knight Piésold (“KP”). Pit design parameters and final phase designs for Constancia and<br />
Pampacancha can be seen in the following Tables and Figures.<br />
218 | P a g e
Table 15-3: Constancia Pit Design Parameters<br />
Description<br />
Slope angles<br />
2012 KP Slopes<br />
Minimum Mining<br />
Width<br />
60 m, with a target of 90 m<br />
Road width<br />
30 m<br />
Catch berms<br />
8 and 9.9m (depending on IRAs)<br />
Bench height<br />
15 m single bench<br />
Ramp design grade 10%<br />
Other<br />
Last 4 benches will be designed as single lane (15 m) with 10% ramp<br />
Annual production<br />
Production maxes at 80 Mt/year between both pits<br />
Process production<br />
+/- 29 Mt/yr ore<br />
Table 15-4: Constancia Pit Slope Guidance<br />
Sector IRA Overall<br />
slope<br />
Face<br />
Angles<br />
North 1 45° 40° - 42° 65°<br />
North 2 48° 40° - 42° 65°<br />
East 3 45° 40° - 42° 65°<br />
Southeast 4 45° 40° - 42° 65°<br />
Southwest 5 40° 37° 60°<br />
West 6 40° 37° 60°<br />
219 | P a g e
Figure 15-3: Constancia Ultimate Pit – Plan View<br />
Table 15-5: Pampacancha Pit Design Parameters<br />
Description<br />
May 2012 Plan<br />
Slope angles<br />
2012 KP – Pre Feasibility Pit Slope Study<br />
Minimum Mining Width<br />
60 m<br />
Road width<br />
30 m<br />
Catch berms<br />
9 and 12m (depending on IRAs)<br />
Bench height<br />
20m double bench<br />
Ramp design grade 10%<br />
Other<br />
Last 4 benches will be designed as single lane (15 m) with 10% ramp<br />
Annual production<br />
production maxes at 80 Mt/year between both pits<br />
Process production<br />
+/- 29 Mt/yr ore (combined with Constancia)<br />
220 | P a g e
Table 15-6: Pampacancha Pit Slope Guidance<br />
Area IRA Overall slope Face Angles<br />
North 1 <strong>43</strong>° 40° 65°<br />
East 2 <strong>43</strong>° 40° 65°<br />
South 3 <strong>43</strong>° 40° 65°<br />
Southwest 4 49° 45° 70°<br />
Northwest 5 49° 45° 70°<br />
Figure 15-4: Pampacancha Ultimate Pit – Plan View<br />
15.2 MINERAL RESERVES<br />
Proven and probable reserves have continued to grow at Constancia and Pampacancha to 450 million<br />
tonnes at a copper equivalent grade of 0.49% supporting a 16 year mine life. The mine plan is such that<br />
the process plant is expected to operate to the capacity of the grinding circuit throughout LOM. The plant<br />
is expected to process 29 Mt /a (84,500 t/d at 94% availability) of ore. Concentrate production rates<br />
average 328,000 t/a over LOM. Constancia and Pampacancha Mineral Reserves are summarized in the<br />
following Table 15-7.<br />
221 | P a g e
Table 15-7: Constancia and Pampacancha Mineral Reserves<br />
Constancia Mineral Reserves - August 8, 2012<br />
Category<br />
M<br />
(tonnes)<br />
Cu<br />
(%)<br />
Mo<br />
(g/t)<br />
Ag<br />
(g/t)<br />
Au<br />
(g/t)<br />
Cu Eq (1)<br />
(%)<br />
Proven 349 0.37 100 3.29 0.0<strong>43</strong> 0.49<br />
Probable 54 0.24 60 2.98 0.035 0.33<br />
Total 403 0.35 96 3.25 0.042 0.47<br />
Pampacancha Mineral Reserves - August 8, 2012<br />
Proven 10 0.54 170 4.20 0.318 0.87<br />
Probable 37 0.46 140 4.56 0.276 0.76<br />
Total 47 0.48 149 4.49 0.285 0.78<br />
(1) Not accounting for recovery.<br />
The remaining mineral resources shown in the table below are exclusive of the mineral reserves above:<br />
Table 15-8: Constancia and Pampacancha Remaining Resources, Exclusive of Reserves<br />
Constancia Mineral Resources (1) - November 2, 2011<br />
Category<br />
M<br />
(tonnes)<br />
Cu<br />
(%)<br />
Mo<br />
(g/t)<br />
Ag<br />
(g/t)<br />
Au<br />
(g/t)<br />
Cu Eq (2)<br />
(%)<br />
Measured 119 0.23 62 2.3 0.038 0.31<br />
Indicated 344 0.20 58 2.0 0.034 0.27<br />
Total – Meas. and<br />
Ind.<br />
463 0.21 59 2.0 0.035 0.28<br />
Inferred 219 0.19 49 1.8 0.032 0.25<br />
222 | P a g e
Pampacancha Mineral Resources (3) - April 2, 2012<br />
Inferred 4 0.41 103 6.2 0.207 0.67<br />
1. The Constancia mineral resources are reported at a 0.12% copper cut-off<br />
2. Not accounting for recovery.<br />
3. The Pampacancha mineral resources are reported at a 0.20% copper cut-off.<br />
The Constancia and Pampacancha Mineral Reserves Estimates provide the optimal ore for feeding the<br />
crusher based on the mining rate of up to 80mtpa and the processing rates ~29mtpa. The first three<br />
phases target higher grade ore than the average, to maximize metal production in the first years of the<br />
project. The breakdown of the Constancia and Pampacancha mineral reserves by material type is<br />
showed in the following Table 15-9.<br />
Table 15-9: Breakdown of Constancia and Pampacancha Reserves by Material Type<br />
Constancia<br />
Tonnes<br />
(M)<br />
Cu (%) Mo (%) Ag (g/t) Au (g/t) % Material<br />
Hypogene 326.5 0.30 0.010 2.94 0.04 81%<br />
Supergene 26.9 0.71 0.010 4.77 0.04 6%<br />
Mixed 23.2 0.49 0.009 3.30 0.04 7%<br />
Skarn 13.5 0.58 0.006 5.24 0.08 3%<br />
HiZinc 12.9 0.38 0.005 5.67 0.06 3%<br />
Total Ore 403 0.35 0.010 3.25 0.04 100%<br />
Pampacancha<br />
Tonnes<br />
(M)<br />
Cu (%) Mo (%) Ag (g/t) Au (g/t) % Material<br />
Skarn 47 0.48 0.015 4.49 0.29 100%<br />
Total Ore 47 0.48 0.015 4.49 0.29 100%<br />
223 | P a g e
15.2.1 MINERAL RESERVE ECONOMICS<br />
The Economics of the mineral reserves were confirmed by the financial model described in Section 22 of<br />
this <strong>Technical</strong> <strong>Report</strong>. The financial model confirmed a 14.5 percent internal rate of return, based on a<br />
copper price of US$2.75/lb, gold price of US$1,150/oz, silver price of US$23.00 /oz and molybdenum<br />
price of US$14.00/lb. Metallurgical recoveries were determined and used for each of the metallurgical<br />
domains determined for the deposit.<br />
224 | P a g e
16.0 MINING METHODS<br />
16.1 INTRODUCTION<br />
The Constancia Project is a traditional open pit shovel/truck operation with two deposits, Constancia and<br />
Pampacancha. The project consists of open pit mining and flotation of sulphide minerals to produce<br />
commercial grade concentrates of copper and molybdenum. Silver and a small quantity of payable gold<br />
will report to the copper concentrate. The Pampacancha deposit, located about 5 Km SE from the<br />
Constancia exhibits higher grades of copper and gold and is scheduled to enter into production during<br />
2016.<br />
The Constancia ultimate pit will measure approximately 1.7 km east to west, 1.5 km north to south, and<br />
have a maximum depth of approximately 600 m. The Pampacancha ultimate pit will measure<br />
approximately 0.6 km east to west, 1 km north to south, and have a maximum depth of approximately 300<br />
m. There is one primary waste rock facility (WRF), which is located to the south of the Constancia pit and<br />
is intended to be used for both deposits. The processing facility is located approximately 1 km west of the<br />
Constancia pit, while the tailings management facility (TMF) is located 3.5 km southwest of the<br />
Constancia pit. The pits and facilities can be seen in Figure 16-1.<br />
The mine production plan contains 599 Mt of waste and 450Mt of ore, yielding a waste to ore stripping<br />
ratio of 1.33 to 1. An average LOM mining rate of 65 Mt/a, with a maximum of 80 Mt/a, will be required to<br />
provide the assumed nominal process feed rate of approximately 29 Mt/a. The ore production schedule<br />
for the project shows average grades of 0.36% Cu, 0.010% Mo, 0.07 g/t Au and 3.38 g/t Ag. The metal<br />
contained in this production plan is approximately 3.6 billion pounds of copper, 100 million pounds of<br />
molybdenum, 970 000 ounces of gold and 48.9 million ounces of silver.<br />
Total project mine life (not including construction) is estimated to be 17 years, including 9 months of prestripping<br />
and 8 months of ramp up. Feed stockpiled during the pre-stripping period will be processed<br />
during the first year of plant production. The priority plant feed will consist of high grade material (HG)<br />
and medium grade material (MG). The low grade material (LG) will be fed as needed and will otherwise<br />
be sent to the waste rock facility (WRF).<br />
225 | P a g e
Figure 16-1: Constancia Project – Main Facilities<br />
Total project life is estimated to be 19 years, which consists of 2 years of construction, plus 17 years of<br />
mine production, including 3 quarters of pre-stripping and 8 months of production ramp up.<br />
16.2 GEOTECHNICAL PARAMETERS<br />
16.2.1 CONSTANCIA<br />
Knight Piésold (KP) developed a supplementary geotechnical site investigation program in June 2011 to<br />
collect additional geomechanical and hydrogeological data for pit slope design.<br />
Pit slope recommendations have been developed based on the previous geotechnical studies, the 2011<br />
geomechanical data, updated geological and structural model, and the corresponding slope stability<br />
analysis results.<br />
KP prepared the geotechnical model for the project. The Constancia pit was split into six sectors, each<br />
with different generic slope angles that are based on the internal analysis. A Complex Slope option was<br />
used in the optimization, considering these six sectors.<br />
226 | P a g e
Geotechnical Characterization<br />
The bedrock geology at the Constancia deposit is dominated by the Apurimac Batholith intrusives<br />
comprised of monzonites, monzodiorites, and diorites. Another major rock unit is a sedimentary package<br />
consisting of sandstones, siltstones, and limestones from the Arcurquina Formation. Three geological<br />
domains; Sedimentary Rock, Intrusive Rock, and Overburden, were defined mainly based on the origins<br />
of each lithological unit.<br />
Large-scale structural features at the Constancia deposit include a series of steeply dipping faults along<br />
with heavily altered zones. Two structural domains were defined based on surface mapping data; a<br />
heavily faulted/altered zone to the west-southwest and a slightly faulted/altered zone to the northnortheast.<br />
Most of the faults and rock mass structures are steeply dipping at various orientations, as<br />
determined from surface mapping and oriented drill core data.<br />
The rock mass quality at the Constancia deposit was characterized according to various geomechanical<br />
indices using data from drill core and surface mapping. These included: intact rock Unconfined<br />
Compressive Strength (UCS), Rock Quality Designation (RQD), and Rock Mass Rating (RMR). The intact<br />
rock strengths were found to be STRONG to VERY STRONG. Combining the intact rock properties and<br />
characteristics of the observed rock fabric leads to an overall rock mass quality designation of POOR to<br />
FAIR for the Constancia deposit.<br />
Groundwater levels were found to be near surface and the hydraulic conductivity for most rock units<br />
ranged from 5x10⁻⁴ cm/s to 5x10⁻⁶ cm/s.<br />
A geotechnical model was subsequently developed based on the characteristics of pit wall geology,<br />
structure, rock mass, and hydrogeology. The model combines three geological domains and two<br />
structural domains. The model includes four inferred geotechnical domains as follows:<br />
• Domain A – Sedimentary rock<br />
• Domain B-I – Slightly faulted intrusive rock<br />
• Domain B-II – Heavily faulted intrusive rock, and<br />
• Domain C – Overburden.<br />
Slope Stability Analyses<br />
As described above, there are four geotechnical domains. However, two of them have more than one<br />
distinguish wall orientations. Therefore, kinematic stability analyses were conducted for six geotechnical<br />
sectors, based on wall orientations, geology, structure and rock mass characteristics.<br />
Kinematic stability analyses were conducted to identify possible failure modes in the pit walls. Bench<br />
geometries were selected to reduce the potential for small-scale discontinuities to form unstable wedges<br />
and blocks which can affect bench face integrity and reduce the effectiveness of the benches. Wedge<br />
type failure appears to be the dominant failure mode of structurally controlled slopes. Further bench and<br />
inter-ramp slope wedge/planar stability analyses were conducted to determine the cumulative failure<br />
frequency of bench slopes and factors of safety of potential multiple bench wedges.<br />
Limit equilibrium analyses of the rock mass slope were performed to estimate the factors of safety against<br />
large-scale, multiple bench failures through the rock mass. The rock mass stability analyses indicate that<br />
large-scale circular failure in the Constancia Pit can be avoided given the base case assumptions of rock<br />
mass strength, blasting disturbance, and pore water conditions. Aggressive slope depressurization will<br />
be required for the middle-lower slopes as the pit deepens.<br />
227 | P a g e
Pit Slope Design<br />
It is assumed that slopes will consist of single, 15 m high benches. A bench face’s angle varies from 60°<br />
to 65°. Slightly flatter bench face angles of 60° are more appropriate for the Southwest Sector where a<br />
weaker rock mass is present.<br />
The inter-ramp slope angles will be controlled by large scale structural features and/or bench geometries.<br />
A moderate inter-ramp slope angle of 45° is recommended for the Northwest, Northeast and Southeast<br />
Sectors.<br />
Table 16-1 below shows the design criteria for the Pit and Table 16-24 lists the configuration of the<br />
recommended pit slope configuration for each sector and Figure 16-2 shows the Ultimate Pit Slope<br />
Design with the corresponding Geotechnical Sectors.<br />
A flatter inter-ramp angle of 40° is appropriate for the Southwest and West sectors where heavily faulted<br />
and weaker rock units are present.<br />
Table 16-1: Constancia Pit Design Parameters<br />
Description<br />
Slope angles<br />
2011 KP Slopes<br />
Minimum Mining<br />
Width<br />
60 m, with a target of 90 m<br />
Road width<br />
30 m<br />
Catch berms<br />
8 and 9.9m (depending on IRAs)<br />
Bench height<br />
15 m single bench<br />
Ramp design grade 10%<br />
Other<br />
Last 4 benches will be designed as single lane (15 m) with 10% ramp<br />
Annual production<br />
Maximum Production at 80 Mt/year between both pits<br />
Process production<br />
+/- 29 Mt/yr ore<br />
228 | P a g e
Table 16-2: Constancia Slope Guidance<br />
Area IRA Overall slope Face Angles<br />
North W 45° 40° - 42° 65°<br />
North E 48° 40° - 42° 65°<br />
East 45° 40° - 42° 65°<br />
Southeast 45° 40° - 42° 65°<br />
Southwest 40° 37° 60°<br />
West 40° 37° 60°<br />
Figure 16-2: Constancia Geotech Zones<br />
The maximum height of the inter-ramp slopes should be limited to 200 m. Additional wider benches<br />
(stepouts) and/or haul ramps should be placed to provide access and additional rock protection during pit<br />
development. The overall slope angles are expected to be 3° to 5° flatter than the inter-ramp slopes after<br />
the haulage ramps and/or stepouts are incorporated. The resulting overall slope angles are expected to<br />
be in the range of 37° to 42°.<br />
16.2.2 PAMPACANCHA<br />
Knight Piésold Ltd. (KP) completed a Pre-Feasibility Study (PFS) level geotechnical assessment for the<br />
proposed Pampacancha pit. An initial site visit and desktop study was completed in April 2012, and the<br />
preliminary pit slope recommendations were provided. A supplementary geomechanical and<br />
hydrogeological site investigation program was carried out from May to June 2012. Further geotechnical<br />
characterization and slope stability analyses were subsequently conducted to refine the pit slope<br />
recommendations for the PFS.<br />
229 | P a g e
Geotechnical Characterization<br />
The Pampacancha deposit is comprised mainly of Tertiary intrusive rocks and Cretaceous sedimentary<br />
rocks. The sedimentary rock present at the east side of the deposit consists of Limestone. The intrusive<br />
rock forming the base of the deposit consists mainly of Diorite. Skarn, a metamorphic zone developed in<br />
the Limestone contact area around igneous rock intrusions, occupies the central portion of the deposit<br />
and is the main host of copper mineralization. Post mineralization Monzonite Porphyry is exposed along<br />
the west portion of the deposit. A simplified geological model has been developed that incorporates the<br />
inferred distribution of five major geological units as indicated below.<br />
Skarn (SKN)<br />
Monzonite Porphyry (MP2)<br />
Diorite Porphyry (PDI)<br />
Diorite (DIO), and<br />
Limestone (LMT)<br />
The intact strength of all rock types was found to be STRONG with average Unconfined Compressive<br />
Strength (UCS) estimated from Point Load Testing ranging from 65 to 90 MPa. The rock mass quality was<br />
characterized as POOR to FAIR with an average Rock Mass Rating (RMR) value of 45 across all units.<br />
Based on site observations, the Monzonite Porphyry and Diorite units appear to be the most competent.<br />
The rock mass structural features in the deposit are complex, but were found to be largely steeply dipping<br />
or sub-vertical. A north/south trending, steeply dipping fault was identified in the east area of the deposit.<br />
Groundwater levels varied between 10 and 20 m in the proposed pit area. The permeability of the rock<br />
mass is moderately low with an average hydraulic conductivity value in the order of 1 x 10⁻⁷ m/s.<br />
Slope Stability Analyses<br />
The proposed Pampacancha Pit will reach a maximum depth of 250 m. Five design sectors, namely, the<br />
North, East, South, Southwest, and Northwest Sectors, were delineated based on wall orientations,<br />
projected wall geology, and rock mass characteristics.<br />
Design methods used to analyse appropriate pit slope angles included a kinematic stability assessment<br />
and evaluation of the overall rock mass stability. Pit slope geometries for each design sector have been<br />
determined based on minimum acceptable criteria for each of these design methods. Stereographic<br />
analyses were performed to determine potential kinematic failure modes in the rock slopes.<br />
Rock mass structures are generally favourable for pit development, given the nature of steeply dipping<br />
features, and the defined fault has little impact on pit wall stability. Some possible kinematic controls on<br />
bench face and inter-ramp angles were evaluated for potential wedge and planar failures; achievable<br />
bench face angles are expected to be between 65° and 70°. A bench height of 10 m was assumed for the<br />
pit development in accordance with the anticipated mining equipment and a 20-m high double benching<br />
configuration is recommended. The kinematically determined inter-ramp slope angles range from <strong>43</strong>° to<br />
49°.<br />
Limit equilibrium analyses were performed to assess the rock mass stability of the pit slopes. It was<br />
determined that slopes excavated in the Skarn unit will require a flatter inter-ramp slope angle. The<br />
analyses indicate that the kinematically determined inter-ramp slopes will be achievable at maximum<br />
slope heights if the slopes are fully drained. If higher pore water pressure conditions are assumed, the<br />
230 | P a g e
overall slope angles will need to be 3 to 5 degrees flatter than the applied maximum inter-ramp slope<br />
angles in each sector. Recommended overall slope angles range from 40° in the North and East Sectors<br />
to 45° in the Southwest and Northwest Sectors. Flatter overall slopes can be achieved by incorporating<br />
haulage ramps and/or stepouts into the wall development. Low-damage blasting and slope<br />
depressurization are recommended for final wall development.<br />
Pit Slope Angles<br />
For the pit design, the targeted minimum mining width was 60 meters and honored the wall slope design<br />
provided by Knight Piésold (PFS Pit Slope Design). The following subsections show the considerations in<br />
terms of geotechnical and hydrogeological parameters; Table 16-3 shows the design criteria for the Pit,<br />
Table 16-4 lists the configuration of the recommended pit slope configuration for each sector, and Figure<br />
16-3 shows the Ultimate Pit Slope Design with the corresponding Geotechnical Sectors.<br />
Table 16-3: Pampacancha Pit Design Parameters<br />
Description<br />
May 2012 Plan<br />
Slope angles<br />
2012 KP Prefeasibility Slopes Study<br />
Minimum Mining Width<br />
60 m<br />
Road width<br />
30 m<br />
Catch berms<br />
9 and 12m (depending on IRAs)<br />
Bench height<br />
20m double bench<br />
Ramp design grade 10%<br />
Other<br />
Last 4 benches will be designed as single lane (15 m) with 10% ramp<br />
Annual production<br />
Maximum Production at 80 Mt/year between both pits<br />
Process production<br />
+/- 29 Mt/yr ore (combined with Constancia)<br />
231 | P a g e
Table 16-4: Pampacancha Slope Guidance<br />
Area IRA Overall slope Face Angles<br />
North <strong>43</strong>° 40° 65°<br />
East <strong>43</strong>° 40° 65°<br />
South <strong>43</strong>° 40° 65°<br />
Southwest 49° 45° 70°<br />
Northwest 49° 45° 70°<br />
Figure 16-3: Pampacancha Geotech Zones<br />
16.3 HYDROGEOLOGICAL PARAMETERS<br />
16.3.1 CONSTANCIA<br />
Ground Water International Consulting Hydrogeologists (GWI) carried out <strong>43</strong> Lugeon type permeability<br />
tests in the 2008 site investigation program, to determine the hydraulic conductivity of the basement rock<br />
in the Constancia deposit area. The results indicate that hydraulic conductivity in the Constancia deposit<br />
ranges from 5 x 10 -4 to 2 x 10 -6 cm/s. GWI also installed eight standpipe piezometers in 2008 drillholes<br />
CG-08-03 to CG-08-10. Groundwater levels were measured from these piezometers and showed that the<br />
232 | P a g e
groundwater table ranges between 0.4 m and 26 m depth at the deposit site. Shallower groundwater<br />
tables correspond to piezometers located near the marsh bed areas and the deeper groundwater table<br />
corresponds to topographically higher locations on the rolling hills within the deposit area.<br />
A supplementary hydrogeological field program was implemented by Golder Associates Ltd. (Golder) in<br />
2011 – 2012.<br />
16.3.2 PAMPACANCHA<br />
The hydrogeological assessment was based on the hydrogeological model and associated numerical<br />
model that was developed and used in the 2009 Environmental Impact Assessment (EIA) study for the<br />
Constancia pit, with some moderate changes in hydraulic parameters in the area of Pampacancha Pit.<br />
These changes were based on the result of more recent geologic mapping by <strong>Hudbay</strong> in the immediate<br />
vicinity of the proposed pit, and hydrogeological testing by Knight Piésold (KP) at three boreholes drilled<br />
as part of the investigation for the PFS Geotechnical Study for the Pampacancha pit.<br />
The local groundwater flow direction has been determined to be toward the south and west, and the<br />
recharge areas are located to the northeast of the deposit. Limited groundwater level measurement data<br />
indicates that the phreatic surface is in the order of 20 m deep at the north side of the Pampacancha<br />
deposit. The phreatic surface is expected to be shallower (less than 10 m deep) along the west and south<br />
sides of the deposit (Golder, June 2012). In situ permeability tests indicate that the hydraulic conductivity<br />
for the relatively competent rock units (Diorite and Monzonite Porphyry) ranges from 2 x 10 -9 m/s to 5 x<br />
10 -7 m/s. It is anticipated that the hydraulic conductivity of the rock mass is variable due to numerous<br />
fractured zones along the lithology contacts and/or multiple fault/shear features. Higher groundwater flow<br />
is expected along the fractured zones, geological contacts, and fault zones.<br />
For the ultimate pit extent, the predicted groundwater inflow to the pit was approximately 500 m 3 /day.<br />
Considering the uncertainty in the understanding of groundwater conditions adjacent to this point, the<br />
actual inflow could range between 350 m 3 /day and 1250 m 3 /day.<br />
16.4 PIT DESIGN<br />
The Constancia and Pampacancha whittle pit shells formed the basis of a detailed pit design (toe, crest,<br />
and ramping system). Detailed designs were developed for the intermediate phases and ultimate Pits.<br />
16.4.1 CONSTANCIA<br />
Tables 16-5 and 16-6 show the pit design criteria for the intermediate phases and ultimate pit for the<br />
Constancia deposit.<br />
233 | P a g e
Table 16-5: Constancia Pit Design Parameters<br />
Description<br />
Slope angles<br />
2012 KP Slopes<br />
Minimum Mining<br />
Width<br />
60 m, with a target of 90 m<br />
Road width<br />
30 m<br />
Catch berms<br />
8 and 9.9m (depending on IRAs)<br />
Bench height<br />
15 m single bench<br />
Ramp design grade 10%<br />
Other<br />
Last 4 benches will be designed as single lane (15 m) with 10% ramp<br />
Annual production<br />
Maximum Production at 80 Mt/year between both pits<br />
Process production<br />
+/- 29 Mt/yr ore<br />
Table 16-6: Constancia Pit Slope Guidance<br />
Sector IRA Overall slope Face<br />
Angles<br />
North W 45° 40° - 42° 65°<br />
North E 48° 40° - 42° 65°<br />
East 45° 40° - 42° 65°<br />
Southeast 45° 40° - 42° 65°<br />
Southwest 40° 37° 60°<br />
West 40° 37° 60°<br />
234 | P a g e
16.4.2 PAMPACANCHA<br />
Tables 16-7 and 16-8 show the Pit Design Criteria for the Pampacancha pit. One Phase was considered<br />
for this pit according economical, geotechnical and operative parameters.<br />
Table 16-7: Pampacancha Pit Design Parameters<br />
Description<br />
May 2012 Plan<br />
Slope angles<br />
2012 KP – Pre Feasibility Pit Slope Study<br />
Minimum Mining Width<br />
60 m<br />
Road width<br />
30 m<br />
Catch berms<br />
9 and 12m (depending on IRAs)<br />
Bench height<br />
20m double bench<br />
Ramp design grade 10%<br />
Other<br />
Last 4 benches will be designed as single lane (15 m) with 10% ramp<br />
Annual production<br />
Maximum Production at 80 Mt/year between both pits<br />
Process production<br />
+/- 29 Mt/yr ore (combined with Constancia)<br />
Table 16-8: Pampacancha Pit Slope Guidance<br />
Area IRA Overall slope Face Angles<br />
North <strong>43</strong>° 40° 65°<br />
East <strong>43</strong>° 40° 65°<br />
South <strong>43</strong>° 40° 65°<br />
Southwest 49° 45° 70°<br />
Northwest 49° 45° 70°<br />
235 | P a g e
16.5 MINE PHASES<br />
16.5.1 CONSTANCIA<br />
The ultimate pits have been divided into 6 phases to facilitate the early extraction of the most profitable<br />
feed and/or minimize the waste stripping. All phases are designed to provide the optimal ore for feeding<br />
the crusher based on the mining rate of up to 80mtpa and processing rates of ~29mtpa. The final<br />
configuration is showed in figures 16-4 and 16-5, for plan and sectional view. Individual mine phases are<br />
shown in Figure 16-6 and the breakdown of each phase is shown in Table 16-9.<br />
Figure 16-4: Plan View Constancia Pit Phases<br />
Phase 4<br />
A<br />
Phase 3<br />
Phase 1<br />
Phase 5<br />
Phase 6<br />
Phase 2<br />
A´<br />
236 | P a g e
Figure 16-5: Section AA´ View Constancia Pit Phases<br />
Phase 3<br />
Phase 4<br />
Phase 5<br />
Phase 6<br />
Phase 1<br />
Phase 2<br />
The breakdown of plan by phases can be seen in Figures 16-6 to 6-11 and Table 16-9respectively.<br />
237 | P a g e
Figure 16-6: Constancia Phases 1- 6<br />
238 | P a g e
Table 16-9: Constancia Breakdown of Phases<br />
Constancia Pit<br />
Ore<br />
Mdmt<br />
Cu % Mo % Ag g/t Au g/t Waste Total Strip<br />
Ratio<br />
Phase 1 57.5 0.53 0.011 3.68 0.04 61.37 118.87 1.07<br />
Phase 2 77 0.37 0.011 3.34 0.04 91.09 168.09 1.18<br />
Phase 3 (San Jose) 10 0.45 0.007 3.93 0.09 21.71 31.71 2.17<br />
Phase 4 93.5 0.31 0.010 3.54 0.04 179.81 273.31 1.92<br />
Phase 5 45 0.30 0.009 3.03 0.04 63.61 108.61 1.41<br />
Phase 6 120 0.29 0.008 2.79 0.04 110.59 230.59 0.92<br />
Total 403 0.35 0.010 3.25 0.04 528.18 931.18 1.31<br />
16.5.2 PAMPACANCHA<br />
The Pampacancha ore is assumed to be composed of 100% skarn material at this time. According to<br />
economical, geotechnical and operative parameters, only one phase has been developed for this satellite<br />
pit. The final configuration is shown in Figure 16-9, for plan view.<br />
Figure 16-7: Plan View Constancia Pit Phases<br />
239 | P a g e
Table 16-10: Pampacancha Phase<br />
Pampacancha Pit<br />
Ore<br />
Mdmt<br />
Cu % Mo % Ag g/t Au g/t Waste Total Strip<br />
Ratio<br />
Phase 1 47 0.48 0.015 4.49 0.29 70.89 117.89 1.50<br />
Total 47 0.48 0.015 4.49 0.29 70.89 117.89 1.50<br />
16.6 MINE AND PROCESS SCHEDULE<br />
16.6.1 MINE PRE – PRODUCTION<br />
Mine Infrastructure<br />
The Constancia Project is expected to have all necessary infrastructure for a large mine operation. Mining<br />
related infrastructure is expected to include a truck shop, truck wash facility, warehouse, fuel storage and<br />
distribution facility, and electrical power distribution and substations to support construction and mine<br />
operations.<br />
Primary Access<br />
For Constancia, mine road construction is expected to begin in the second quarter of 2013 and it is<br />
expected to require the construction of approximately 9 kilometers of haul roads during a six month<br />
period. Haul road access to pit phases 2 through 4 is expected to be constructed during 2015 and will<br />
require the construction of 4.4 kilometers of Haul roads.<br />
For Pampacancha, mine road construction is expected to begin in the third quarter of 2015 and is<br />
expected to require the construction of approximately 4.5 kilometers of haul roads during a six month<br />
period.<br />
240 | P a g e
Pre-Stripping<br />
The Pre-stripping is expected to commence in November 2013, nine months before the initial start-up of<br />
the process plant.<br />
Feed mined during pre-stripping will be stockpiled. Initial pre-stripping of 31 Mt of waste material is<br />
expected to be required before there are expected to be continuous access to feed grade mineralization.<br />
During pre-stripping, 16.5 Mt of Non Acid Generating material (NAG) will be mined. This material will be<br />
required for the access roads, tailings dam and other construction facilities.<br />
Mill Ramp-Up<br />
The mining ramp up rate is based on 50% availability of the three shovels in the first month, and 100% of<br />
availability of the shovel in the second month, with the erections starting one after another. Having the<br />
following configuration per month in terms of Tonnage:<br />
o Month1 0.8 Mt<br />
o Month2 1.6 Mt<br />
o Month3 2.4 Mt<br />
o Month4 3.2 Mt<br />
o Month5 4.0 Mt<br />
o Month6 5.0 Mt<br />
The mill production schedule followed the ramp up assumptions detailed in Table 16-11 with the<br />
production rates based on Table 16-9.<br />
Table 16-11: Mill Ramp Up Schedule<br />
Month Target % of Expected<br />
Recovery<br />
Month 1 45% 20%<br />
Month 2 66% 50%<br />
Month 3 66% 70%<br />
Month 4 79% 80%<br />
Month 5 79% 85%<br />
Month 6 92% 90%<br />
Month 7 92% 95%<br />
Month 8 92% 100%<br />
241 | P a g e
Table 16-12: Tonnage Formulas<br />
Yr<br />
Revisited<br />
MA<br />
Throughput<br />
1 94% 7.63<br />
2 94% 28.03<br />
3 94% 28.99<br />
4 94% 28.99<br />
16.6.2 PRODUCTION SCHEDULE<br />
The mine production plan contains 599 Mt of waste, and 450Mt of ore, yielding a waste to ore stripping<br />
ratio of 1.33 to 1. An average LOM mining rate of 65 Mt/a, with a maximum of 80 Mt/a, will be required to<br />
provide the assumed nominal process feed rate of approximately 29 Mt/a. The ore production schedule<br />
for the project shows average grades of 0.36% Cu, 0.010% Mo, 0.07 g/t Au and 3.38 g/t Ag. The metal<br />
contained in this production plan is approximately 3.6 billion pounds of copper, 100 million pounds of<br />
molybdenum, 970 000 ounces of gold and 48.9 million ounces of silver.<br />
Total project mine life (not including construction) is estimated to be 17 years, including 9 months of prestripping<br />
and 8 months of ramp up. Feed stockpiled during the pre-stripping period will be processed<br />
during the first year of plant production. The priority plant feed will consist of high grade material (HG)<br />
and medium grade material (MG). The low grade material (LG) will be fed as needed and will otherwise<br />
be sent to the waste rock facility (WRF).<br />
Figure 16.8 and 16.9 set out the anticipated production schedule by year for ore and waste and by ore<br />
type, respectively, while Table 16-13 sets out the mine production schedule by year for additional details.<br />
242 | P a g e
Figure 16-8: Mine Production Schedule<br />
Figure 16-9: Mine Production Schedule by Ore Type<br />
2<strong>43</strong> | P a g e
Table 16-13: Mine Production Schedule<br />
2013 2014 2015 2016 2017 2018 2019 2020 2021 2022<br />
Ore Mined<br />
000 t<br />
9,374.0 27,412.3 30,583.9 29,836.5 28,135.6 28,944.0 29,490.0 28,216.2 29,591.3<br />
Cu % 0.52 0.59 0.<strong>43</strong> 0.37 0.47 0.48 0.36 0.33 0.32<br />
Zn % 0.10 0.08 0.08 0.09 0.10 0.10 0.08 0.10 0.08<br />
Mo % 0.008 0.011 0.012 0.010 0.013 0.012 0.010 0.009 0.011<br />
Pb % 0.03 0.04 0.04 0.04 0.04 0.05 0.04 0.04 0.04<br />
Au g/t 0.06 0.05 0.06 0.08 0.23 0.18 0.04 0.05 0.04<br />
Ag g/t 3.58 4.04 3.71 3.17 4.23 4.90 3.30 3.57 3.13<br />
Ore Milled<br />
000 t<br />
7,638.0 28,031.9 28,990.1 28,990.1 28,990.1 28,982.0 28,990.1 28,990.1 28,990.1<br />
Ore Rehandle<br />
000 t<br />
Waste<br />
000 t<br />
Total<br />
Movement<br />
000 t<br />
1,279.9 3,847.4 1,531.1 406.7 869.6 336.2 50.0 1,166.0 2.1<br />
2,389.9 44,053.7 37,699.3 47,029.1 49,826.0 49,663.6 50,913.3 50,760.0 48,285.6 40,406.5<br />
2,389.9 54,707.7 68,959.0 79,144.0 80,069.2 78,668.8 80,193.6 80,300.0 77,667.8 70,000.0<br />
2023 2024 2025 2026 2027 2028 2029 2030 TOTAL<br />
Ore Mined<br />
000 t<br />
28,476.0 30,098.8 28,645.1 26,979.5 28,660.3 30,186.7 28,506.6 6,771.8 449,908.9<br />
Cu % 0.31 0.31 0.30 0.28 0.26 0.27 0.32 0.40 0.36<br />
Zn % 0.08 0.07 0.09 0.08 0.09 0.08 0.10 0.19 0.09<br />
Mo % 0.012 0.012 0.009 0.009 0.008 0.007 0.007 0.008 0.010<br />
Pb % 0.04 0.05 0.03 0.03 0.03 0.03 0.02 0.05 0.04<br />
Au g/t 0.03 0.05 0.04 0.04 0.04 0.04 0.04 0.05 0.07<br />
Ag g/t 3.30 3.21 2.82 2.81 2.84 2.77 2.73 3.74 3.38<br />
Ore Milled<br />
000 t<br />
28,990.1 28,990.1 28,990.1 28,990.1 28,990.1 28,990.1 28,990.1 8,385.3 449,908.9<br />
Ore Rehandle<br />
000 t<br />
Waste<br />
000 t<br />
Total Movement<br />
000 t<br />
997.5 0.024 1,588.9 3,240.8 1,198.4 675.3 2,095.4 1,613.5 20,898.9<br />
40,867.6 39,901.2 <strong>43</strong>,551.5 22,195.4 15,726.1 8,960.3 6,368.8 479.3 599,077.3<br />
70,341.1 70,000.0 73,785.5 52,415.7 45,584.9 39,822.3 36,970.9 8,864.6 1,069,885.0<br />
244 | P a g e
16.7 WASTE ROCK FACILITY<br />
The PAG-WRF with its components, Non PAG Stockpile and the Topsoil Stockpile are shown in the Figure<br />
16-10.<br />
Figure 16-10: Mine Components<br />
16.7.1 PAG - WRF<br />
The Potentially Acid Generating Waste Rock Facility (PAG - WRF) is located in Cunahuire Valley east of<br />
the Constancia pit and provides storage for 560 Mt of PAG waste based on the mine plan received from<br />
<strong>Hudbay</strong> on May 11-13, 2012 (May mine plan). It has a placed density of 1.9 t/m 3 ; resulting in a total<br />
volume of 295 Mm 3 . Under the May mine plan, 100% of the Pampacancha waste is considered PAG. This<br />
is a conservative assumption that might represent an opportunity in the future.<br />
245 | P a g e
Table 16-14: WRF Design Parameters<br />
Parameter Unit Value<br />
Level Lift m 20<br />
Berm Width m 32<br />
Angle of Repose ° 36<br />
Overall Angle ° 18.5<br />
Ramp Width m 30<br />
Dry Density t/m 3 1.9<br />
Max. dump Height m 220<br />
Toe Distance from Pit m 100<br />
PAG – WRF Retention Pond<br />
The Waste Rock Facility Retention Pond is located downstream from the WRF in the Cunahuiri Valley.<br />
The pond provides energy dissipation for surface water reporting to the downstream WRF Containment<br />
Pond via overland flows and the contact diversion channels and protects the WRF Containment Pond<br />
from possible falling waste rock and sedimentation. It has a design capacity of approximately 24,000 m3<br />
for the initial 7 years of operation (July 2014 through 2021).<br />
PAG – WRF Containment Pond<br />
The Waste Rock Facility Containment Pond is located downstream from the WRF Retention Pond in the<br />
Cunahuiri Valley. The pond provides storage capacity for surface runoff, direct precipitation and seepage<br />
collected from the WRF and its contact diversion channels. The pond will also store Acid Rock Drainage<br />
(ARD) water, which will be pumped to a lime neutralization facility at the process plant prior to its eventual<br />
use in the process plant. A foundation grout curtain is to be incorporated into the embankment foundation<br />
to minimize seepage.<br />
The pond design capacity is approximately 600,000 m3 for the initial 7 years of operation (July 2014<br />
through 2021) to accommodate the maximum operational volume and has additional storage to<br />
246 | P a g e
accommodate as 100-year/24-hr storm event. The capacity of these ponds will be reassessed for later<br />
years of operation due to the potential expansion of the WRF.<br />
PAG – WRF Channels<br />
Non-Contact Channels are sized to accommodate a 200-year/24-hour storm event with an additional<br />
freeboard or a 500-year/24-hr storm event with no allowance for a freeboard.<br />
PAG – WRF Pumping System<br />
The pumping system between the WRF Containment Pond and the treatment plant will be designed to<br />
pump ARD water from within the pond to the lime neutralization facility. This pumping rate should be such<br />
that the WRF Containment Pond water level will be maintained at or below the maximum operational<br />
water level.<br />
16.7.2 NON-PAG STOCKPILE<br />
The Non-PAG Stockpile facility has a design storage capacity of 27 Mt (14 Mm 3 at 1.9 t/m 3 ). Primarily,<br />
Non-PAG waste rock is to be used for the construction of various construction roads, access roads, and<br />
haul roads as well as the Tailings Management Facility (TMF) embankment.<br />
Excess Non-PAG waste will be placed within a temporary stockpile located 1 km southwest of the<br />
Constancia Pit. Around 20 Mt of NAG materials will be stored at approximately 250 meters west of the<br />
waste dump.<br />
16.7.3 TOPSOIL STOCKPILE<br />
The Topsoil Stockpile is located in the Cunahuire Valley downstream of the WRF Containment Pond and<br />
has a design storage capacity of 4.7 Mm3. This stockpile stores topsoil excavated during construction<br />
activities. Topsoil will be used throughout operations for progressive closure of various facilities.<br />
16.8 MINE FLEET ASSESSMENT<br />
The Constancia Project is expected to have all necessary infrastructure for a large mine operation. Mining<br />
related infrastructure includes a truck shop, truck wash facility, warehouse, fuel storage and distribution<br />
facility, and electrical power distribution and substations to support construction and mine operations.<br />
Caterpillar 793F haulage trucks and Hitachi EX-5600 shovels were selected as the most suitable<br />
equipment for the Project. The selection criterion was based on flexibility, commercial terms, service<br />
terms and prices.<br />
The required mining fleet for the operation can be seen in Tables 16-15 and 16-16.<br />
247 | P a g e
Table 16-15: Total Mine Fleet Requirement<br />
Type<br />
Quantity<br />
Total Fleet<br />
Shovel Hitachi EX5600-6 27m3 3<br />
Dump Truck CAT 793F 30<br />
FEL CAT 994F 2<br />
Production Drill Diesel SKL 3<br />
Pre-split Drill ROC L8 1<br />
Track Dozers D10 2<br />
Wheel Dozers 854K 1<br />
Graders 24M 2<br />
Water Truck CAT 777 2<br />
Excavator General Duties CAT 345 1<br />
Integrated Tool Carrier 1<br />
Tire Handler 1<br />
Lube Truck 1<br />
Fuel Tanker 1<br />
Low Loader 1<br />
Simulator 1<br />
Cranes 25 ton 1<br />
248 | P a g e
Genset 1<br />
Pumping System 1<br />
Table 16-16: Mine Fleet Requirement<br />
Activity<br />
Equipment<br />
Description<br />
2013/2014 2014 2015 2016 2017 2018 2019 2020 2021<br />
Y -1 Y1 Y2 Y3 Y4 Y5 Y6 Y7 Y8<br />
Drilling SKL Drill Rig 2 2 3 3 3 3 3 3 3<br />
ROC L8 0 1 1 1 1 1 1 1 1<br />
Loading Shovel EX5600-6 3 3 3 3 3 3 3 3 3<br />
CAT 994H 0 1 1 2 2 2 2 2 2<br />
Hauling CAT 793F - 227<br />
tonne<br />
15 15 19 26 30 30 28 28 28<br />
Ancillary Bulldozer CAT<br />
D10T<br />
2 2 2 2 2 2 2 2 2<br />
Wheeldozer<br />
854H<br />
CAT<br />
1 1 1 1 1 1 1 1 1<br />
Grader CAT 24M 2 2 2 2 2 2 2 2 2<br />
Water Truck CAT<br />
777<br />
2 2 2 2 2 2 2 2 2<br />
Lube Truck CAT<br />
777<br />
1 1 1 1 1 1 1 1 1<br />
Diesel Truck CAT<br />
777<br />
1 1 1 1 1 1 1 1 1<br />
CAT 345 1 1 1 1 1 1 1 1 1<br />
249 | P a g e
Activity<br />
Equipment<br />
Description<br />
2022 2023 2024 2025 2026 2027 2028 2029 2030 Total<br />
Qty<br />
Y 9 Y10 Y11 Y12 Y13 Y14 Y15 Y16 Y17<br />
Drilling SKL Drill Rig 3 3 3 3 2 2 2 2 2 3<br />
ROC L8 1 1 1 1 1 1 1 1 1 1<br />
Loading Shovel EX5600-6 3 3 3 3 2 2 2 2 2 3<br />
CAT 994H 2 2 2 2 1 1 1 1 1 2<br />
Hauling CAT 793F – 227<br />
tonne<br />
28 28 28 27 21 18 16 16 16 30<br />
Ancillary Bulldozer CAT D10 2 2 2 2 2 2 2 2 2 2<br />
Wheeldozer<br />
854H<br />
CAT<br />
1 1 1 1 1 1 1 1 1 1<br />
Grader CAT 24M 2 2 2 2 2 2 2 2 2 2<br />
Water Truck CAT<br />
777<br />
2 2 2 2 2 2 2 2 2 2<br />
Lube Truck CAT<br />
777<br />
1 1 1 1 1 1 1 1 1 1<br />
Diesel Truck CAT<br />
777<br />
1 1 1 1 1 1 1 1 1 1<br />
CAT 345 1 1 1 1 1 1 1 1 1 1<br />
250 | P a g e
16.9 MINE UNIT OPERATIONS<br />
16.9.1 DRILLING<br />
Primary Drilling (Or Production)<br />
For primary drilling production, a single – pass 251 (or 9 7/8”) millimetre diameter drill is planned to be<br />
matched with each shovel. After the evaluation of equipment dimensioning, three SKL were sized in order<br />
to achieve the planned production regarding the mine plans. The penetration ratio of the drill is<br />
approximately 27 m/Hr.<br />
Secondary Drilling<br />
All long term pit walls (more than six months) will require pre-split blasting to ensure stability. A Roc L8<br />
was selected to perform this function. The mine equipment assessment called for a drill with at least a<br />
156 millimetre diameter capability. The penetration ratio of the ROC L8 is approximately 26.5 m/Hr.<br />
Drill Patterns and Parameters<br />
Drill patterns were designed only for ORE and WASTE, based on the geomechanical characterization<br />
made by Knight Piésold in Nov 2011 for Constancia and in June 2012 for Pampacancha.<br />
Tables 16-17 and 16-18 show the parameters for the two kinds of drilling, production and pre-splitting.<br />
251 | P a g e
Table 16-17: Primary Drilling Parameters - SKL<br />
Parameter Unit Ore Waste<br />
Burden m 7.0 7.8<br />
Spacing m 8.0 9.0<br />
Bench Height m 15.0 15.0<br />
Over Drilling m 1.5 1.5<br />
Density t/BCM 2.56 2.62<br />
Tonnage to<br />
Remove<br />
t/Hole 2,137 2,768<br />
Table 16-18: Secondary Drilling Parameters – Roc L8<br />
Parameter Unit Ore/Waste<br />
Spacing m 3<br />
Bench Height m 15.0<br />
Over Drilling m 0.5<br />
Density t/BCM 2.56 O / 2.62<br />
W<br />
16.9.2 BLASTING<br />
For wet and dry holes, Heavy ANFO 64 (60% of Emulsion and 40% of ANFO) is expected to be used.<br />
Based on the evaluation of productivities, powder factors are estimated to be about 331 grams per tonne<br />
for Ore and 255 grams per tonne for Waste.<br />
The estimated blast design, explosive type, and powder factors for the Constancia Project were based on<br />
the Geomechanical Characterization of the Constancia and Pampacancha areas. Table 16-19 lists the<br />
blast parameters for the blasting, based on the required production according to the mine plans.<br />
252 | P a g e
Table 16-19: Blast Patterns, Production and Pre-Split<br />
Parameters Unit Production Holes Pre-<br />
Split<br />
holes<br />
Ore Waste<br />
Explosive - HA64 HA64 HA64<br />
Explosive<br />
Density<br />
Kg/lt 1.30 1.30 1.20<br />
Hole Diameter Inches 9.88 9.88 5.00<br />
Volume<br />
Capacity<br />
Lt/m 49.41 49.41 12.67<br />
Charge Length ml 11.01 11.00 1.12<br />
Linear Charge Kg/m 64.24 64.24 15.20<br />
Explosive<br />
Charge<br />
Kg 707.09 706.49 17.01<br />
Powder Factor Kg/tonne 0.33 0.26 -<br />
Stemming ml 5.00 5.00 14.40<br />
The overview of blasting practices includes the explosives supply and transportation to the hole, loading,<br />
stemming, tie-in, evacuation of work areas affected by the blast, and ignition of the blast.<br />
16.9.3 LOADING<br />
The primary units will be 27 m 3 (Hitachi EX5600-6) shovels, which are well-matched to the 227-tonne<br />
haulage trucks. A 19 m 3 (CAT 994H) loader will complement these shovels. The loader will also be<br />
required to provide flexibility for blending purposes. Pampacancha is expected to enter into production in<br />
2016, and for the start-up of the Pampacancha pit, a loader will be required to start the mining activities.<br />
All phases have been designed to achieve high productivity, taking advantage of double-side loading and<br />
working in faces of at least 90 metres in width.<br />
Tables 16-20 and 16-21 list the parameters for loading operation.<br />
253 | P a g e
Table 16-20: Loading Parameters, Shovel Hitachi EX 5600-6<br />
Parameters Unit Ore Waste<br />
Bucket Capacity m 3 27.0 27.0<br />
Pass Cycle Sec 32 32<br />
First Cycle Min 0.1 0.1<br />
Truck Changeover Min 0.83 0.83<br />
Loading Cycle time Min 3.1 3.1<br />
Productivity Tonne/Hr 3,483 3,649<br />
Number of Buckets to fill<br />
the 793F Truck<br />
passes 5 5<br />
Table 16-21: Loading Parameters, Loader CAT 994H<br />
Parameters Unit Ore Waste<br />
Bucket Capacity m 3 19.0 19.0<br />
Pass Cycle Sec 46 46<br />
First Cycle Min 0.1 0.1<br />
Truck Changeover Min 0.83 0.83<br />
Loading Cycle time Min 5.5 5.5<br />
Productivity Tonne/Hr 2,083 2,015<br />
Number of Buckets to fill<br />
the 793F Truck<br />
passes 7 7<br />
254 | P a g e
16.9.4 HAULING<br />
Longer term, ore and waste are expected to be transported by 227-tonne capacity haul trucks (CAT<br />
793F). The use of the ultra-class trucks will minimize road congestion, labour requirements, and operating<br />
costs. Trucks with a 227-tonne capacity require a minimum haulage road width of 30 metres. Haulage<br />
routes were determined to estimate productivities and operating hours required by year.<br />
Table 16-22 describes the parameters of hauling for the CAT 793F haul trucks.<br />
Table 16-22: Hauling Parameters, Loader CAT 994H and Haul Roads<br />
Parameters Unit Ore/Waste<br />
Capacity by Weight Tonnes 227<br />
Discharge Min 1.5<br />
(Dump)<br />
Min<br />
1.8 (ROM)<br />
Rolling Resistance<br />
Pit/WRF/Dumping Area<br />
% 3<br />
Main Haulage Route % 2<br />
Loose Density Tonne/m3 2<br />
Swell Factor % 35<br />
Bucket fill Factor % 90<br />
16.10 MINING LOSSES AND DILUTION<br />
Constancia is a massive copper porphyry deposit and hence is amenable to conventional bulk mining<br />
techniques using shovels and trucks. The massive nature of the ore body also means that mining<br />
dilution and ore loss are not expected to be significant issues.<br />
In addition, the regularized NSR block models, which was created to simulate the actual mining<br />
practice by regularising the SMU block size, was considered a diluted model and no additional dilution<br />
and loss factors were applied during the optimization procedure.<br />
255 | P a g e
17.0 RECOVERY METHODS<br />
17.1 INTRODUCTION<br />
17.1.1 GENERAL LAYOUT AND DESCRIPTION<br />
The process plant and facilities have been designed by Ausenco engineers in Australia, Canada and<br />
Peru. The design was based on the GRDMinproc DFS design, with one phase of optimization of the<br />
comminution circuit, followed by front end engineering and design (FEED) and is now in detailed<br />
engineering as part of the EPCM contract with Ausenco.<br />
The layout of the mine, processing plant, waste dumps, and tailings facilities are shown in Figure 17-1.<br />
The process plant is located to the west of the open pit mine, with the TMF located approximately 3 km<br />
south of the plant. The PAG WRF is located adjacent to the pit. Road access to the process plant and pit<br />
is from a connection to the existing north-south road 2 km to the western side of the plant. The<br />
construction and operations accommodation camp is located within walking distance of the process plant.<br />
The mine is sited in hilly terrain. The plant site has been selected as being the closest site available to<br />
the mine that is both economical and practical to develop, but significant earthworks are required to<br />
establish a multi-tiered pad. Major plant areas are all located on in-situ material, i.e. constructed on cut.<br />
Some general buildings are constructed on engineered embankment. A suitably sized construction<br />
laydown area is provided for the establishment of management offices and construction requirements.<br />
The crushing facility is benched into the hillside to minimise expensive ROM pad construction. The layout<br />
allows the crushing facility to be free-draining ensuring practical and economical maintenance.<br />
The mine office and workshops are located immediately to the north of the process plant, and is located<br />
outside the 500 m designated blast zone from the pit boundary.<br />
256 | P a g e
Figure 17-1: Site Layout<br />
17.1.2 FACILITY DESCRIPTION<br />
The plant is designed to process 76,000 tpd of ore (25.33 Mtpa at 91.3% plant availability) from the<br />
Constancia and San José ore bodies. In early 2012, Ausenco reviewed the processing plant and ancillary<br />
equipment design, resulting in the potential capacity moving from the originally designed throughput of<br />
76,000 tpd at 91.3% availability to 85,000 tpd at 94% availability. This increased capacity is expected to<br />
require very little additional capital.<br />
Annual concentrate production rates are expected to ramp up from 350,000 tpa in Year 1 year to a peak<br />
of 450,000 tpa in Year 3. Production then drops to around 300,000 tpa until Year 10, after which it falls to<br />
200,000 tpa and below until mine closure in Year 15.<br />
The primary crusher, belt conveyors, thickeners, tanks, pebble crushers, flotation cells, mills and various<br />
other types of equipment will be located outdoors without buildings or enclosures. To facilitate the<br />
appropriate level of operation and maintenance, molybdenum concentrate bagging plant, copper<br />
concentrate filters and concentrate storage will be housed in clad structural steel buildings.<br />
257 | P a g e
Ausenco designed the processing facilities according to the process design criteria in Table 17-1.<br />
Table 17-1: Key Process Design Criteria<br />
Plant Design Capacity Mt/a 25.3<br />
Copper feed grade Max, Cu % 0.79<br />
Copper feed grade Average, Cu % 0.39<br />
Molybdenum feed grade Max, Mo g/t 202<br />
Molybdenum feed grade Average, Mo g/t 105<br />
Primary crushing availability % 75<br />
Grinding availability % 91.3<br />
Design Bond Ball Work Index kW-h/t 15.9<br />
Primary crusher size<br />
Inches<br />
kW<br />
60 x 113<br />
600<br />
SAG mill size<br />
Feet<br />
kW<br />
36 x 24<br />
16,000 x 2<br />
Ball mill size<br />
Feet<br />
kW<br />
26 x 40<br />
16,000 x 2<br />
Rougher flotation cells<br />
m³, nominal<br />
Number<br />
300<br />
12 + 2<br />
Flotation cleaning column<br />
Stages 2 mechanical<br />
+ 1 column<br />
Stages 2 mechanical + 1<br />
Bulk concentrate thickener<br />
diameter<br />
M 24<br />
258 | P a g e
Copper concentrate thickener<br />
diameter<br />
M 24<br />
Molybdenum concentrate<br />
thickener diameter<br />
M 4<br />
Tailings thickener diameter m 75<br />
The plant has been designed in 3D, allowing for rapid collaboration and easy review. A view of the plant<br />
in 3D is given in Figure 17-2. The process flowsheet, set out in Figure 17-3, for the Constancia recovery<br />
process is similar to other major Copper-Molybdenum plants in Latin America.<br />
Figure 17-2: 3D view of the concentrator<br />
259 | P a g e
Figure 17-3: Process flow diagram<br />
260 | P a g e
17.1.3 THROUGHPUT OPTIMIZATION<br />
In 2012, considerable effort was made by Ausenco and <strong>Hudbay</strong> to re-evaluate the actual throughput<br />
capacity of the processing facilities. Higher throughput has been predicted for mine planning and<br />
financial planning purposes, based on the following points:<br />
(i) While the process designs criteria were 76,000 t/d at 91.3% availability, it was determined<br />
that 93 to 94% availability could be achieved if good maintenance and operating<br />
practices were in place.<br />
(ii) The SAG mill throughput was constrained by the competency of the hypogene ore type,<br />
but further review showed that much of this domain had very low rock quality (RQD).<br />
Therefore SAG milling is expected to require less energy per tonne, thus increasing the<br />
overall throughput.<br />
(iii) The grind size was relaxed for the hypogene ore type from P80 106 to 130 µm.<br />
(iv) In most of the equipment, including the flotation cells, filters, thickeners, pipes and<br />
pumps, no extra capital expense was required to project this higher throughput as it was<br />
already within the considered design factors.<br />
Therefore, the nominal throughput that has been considered for mine planning and the financial model is<br />
85,000t/d.<br />
17.2 PROCESSING PLANT – GENERAL<br />
The general layout of the processing plant is shown in Figure 17-4.<br />
Figure 17-4: Processing Plant Layout<br />
Primary<br />
Stockpile<br />
Grinding<br />
Regrind<br />
Switchyard<br />
Molybdenu<br />
m Plant<br />
Flotation<br />
Concentrate<br />
Area<br />
Tailings<br />
Thickener<br />
Water<br />
261 | P a g e
The processing plant has been laid out in accordance with established good engineering practice for<br />
traditional grinding and flotation plants. The major objective is to make the best possible use of the<br />
natural ground contours to minimise pumping requirements by using gravity flows and also to reduce the<br />
height of steel structures.<br />
To optimise the cost of the major footings for the SAG mill, the height of the SAG mill above grade has<br />
been minimised by locating the cyclone feed sump as low as possible. The mill cyclones have been<br />
located so that the cyclone overflow can gravitate into the rougher conditioning tank.<br />
At the tailing end of the flotation bank, the copper tailings thickener has also been located to facilitate<br />
gravity flow and eliminate the requirement for another large set of pumps.<br />
Due consideration has been given to the layout of the molybdenum plant to facilitate good housekeeping<br />
and occupational health and safety requirements. The robust nature of the molybdenum bearing froth<br />
very often results in difficult housekeeping conditions within the work area and the use of sodium<br />
hydrogen sulphide (NaHS) for copper depression and separation from molybdenum concentrate has the<br />
potential to generate hydrogen sulphide (H 2 S) gas.<br />
The copper and molybdenum plants are independent of each other and separated by a reasonable<br />
distance. Further, the molybdenum concentrator is sited downwind of major high occupancy plant areas<br />
(prevailing wind on site is from the north).<br />
Similarly, the reagents area can release hazardous gases and so is located downwind of high occupancy<br />
plant areas, but close enough to the flotation area to avoid long runs of piping.<br />
Rainwater runoff and general spillages from the processing plant are fully contained and directed to the<br />
dirty water sediment pond. Again, the natural fall of the site is used to direct flow to this pond, located at<br />
the western end of the site at the lowest point, to avoid the need for pumps.<br />
Wherever possible, major substations and motor control center (MCCs) have been located as close as<br />
possible to the drives to minimise cable run lengths.<br />
17.3 BUILDINGS<br />
The following buildings are expected to be part of the facilities:<br />
1. A plant gatehouse.<br />
2. Construction offices. After construction, these major office facilities will be available for plant<br />
operations to use.<br />
3. Warehouse and workshop. This combined building will have areas for mechanical and electronic<br />
workshops, heavy equipment maintenance, inside and outside supplies storage and associated<br />
offices. Above the maintenance and warehouse offices there will be a second floor with more<br />
offices and meeting spaces.<br />
4. A plant office building with the control room, server room, a DCS engineering station and a shift<br />
boss office.<br />
5. A combined chemical and metallurgical laboratory building.<br />
6. A crusher control room.<br />
7. A combined copper concentrate filtration and storage building.<br />
8. A molybdenum concentrate packing plant shed.<br />
262 | P a g e
17.4 CRUSHING<br />
17.4.1 CRUSHING<br />
A 60” x 113” gyratory crusher will receive ROM of up to 1 m in size and reduce it to less than 125 mm<br />
(Figure 17-5). A variable speed belt feeder delivers ore from the crusher chamber to the coarse ore<br />
stockpile feed conveyor. The site mobile crane will be used for major crusher maintenance. A drive-in<br />
dump pocket will make it possible to clear the crusher with a small FEL or bobcat.<br />
Figure 17-5: Primary Crusher Isometric View<br />
The selected crusher is an FLSmidth 60” x 113” gyratory crusher with a 1000 kW motor. This is likely to<br />
be under-utilized for most of the highly fractured ore, but will ensure throughput when processing an area<br />
of competent rock.<br />
The ROM bin and crusher surge pocket has the volume to hold 1.6 truck loads.<br />
17.4.2 CRUSHED ORE STOCKPILE AND RECLAIM<br />
The grinding circuit requires two SAG mill feed conveyors (Figure 17-6). Dual reclaim chambers (nearparallel)<br />
will be used to house a total of four apron feeders that will draw ore from the crushed ore<br />
stockpile to the SAG mill feed conveyors. A secondary egress or emergency tunnel is achieved through<br />
the connection of the two reclaim chambers.<br />
263 | P a g e
Figure 17-6: Coarse Ore Stockpile Isometric View<br />
17.5 GRINDING<br />
The grinding circuit consists of two trains of grinding mills, each train identical, treating 1584 t/h (Figure<br />
17-7). Each train consists of a single FLSmidth semi-autogenous grinding (SAG) mill, a ball mill and a<br />
pebble crusher (SABC). The ball mills are operated in closed circuit with a FLSmidth (Krebbs) cyclone<br />
cluster to produce a product from the grinding circuit of 80% passing 106 µm.<br />
The SAG mills are fitted with a dual pinion drive system and are driven by a variable-speed drive<br />
comprised of a SER hyper-synchronous drive. The SAG mills are 11 m (36’) dia, 7.3 m EGL (24’). Each<br />
SAG mill is driven by two 8 MW motors. The 16 MW, twin pinion, SAG mills were selected over the<br />
equivalent GMD to reduce both capital and commissioning costs.<br />
The 16 MW ball mills selected are fitted with twin pinion drives operated at fixed speed. The mills are<br />
7.9 m (26’) dia, 12.4 m EGL (40’). Like the SAG mills, each ball mill is driven by two, 8 MW motors. Each<br />
of the eight mill motors are interchangeable, and started using conventional liquid resistant starter circuits<br />
(although once started, the SAG mill SER system takes over control enabling limited variable speed<br />
control). The commonality of motors reduces the number of maintenance spares required to be held on<br />
site.<br />
The pebble crushers are only expected to be needed after Year 3 of operations, so their installation will be<br />
deferred. Each of the two pebble crushers is fitted with a 600 kW drive. Hydrocone crushers were<br />
selected for their capability of adjusting the closed side setting depending on power demand. This<br />
increases the flexibility of the machines and reduces the need for pebble storage prior to the crusher.<br />
264 | P a g e
Each grinding train has a single (duty only), 1.5 MW Warman 650 MCR M200 variable speed cyclone<br />
feed pump. A full rotable spare assembly is held on site and changed out when required. The layout<br />
allows for the flexibility to recycle cyclone underflow to the SAG mills; a single “drive-on” grinding floor; a<br />
simple cyclone tower; clear access to the wet end pumps; and clear access to scats clean-up from the<br />
ball mill.<br />
Figure 17-7: Grinding circuit isometric view<br />
The capital cost was reduced by not installing standby cyclone feed pumps. It is anticipated that during<br />
the start of operations there may be unscheduled stoppages when these pumps fail and have to be<br />
replaced on the fly. Spare units ready to be installed are expected to be installed in approximately six<br />
hours. Easy access by mobile cranes is provided and it is anticipated that it will be possible to only<br />
change the wet end of the pump, reducing time lost to motor alignment.<br />
17.6 COPPER-MOLYBDENUM FLOTATION<br />
The function of the copper flotation area (Figure 17-8) is to recover copper and molybdenum into a<br />
copper/molybdenum concentrate, reject zinc to the cleaner scavenger tailings stream and reject coarse<br />
non-sulphide gangue to the rougher tailings.<br />
Each grinding circuit line is conditioned with slaked lime to ensure the circuit pH is maintained at its set<br />
value.<br />
Cyclone overflow from each of the primary grinding hydrocyclones reports via gravity to the corresponding<br />
bulk rougher circuit. FLSmidth Krebs gMAX 26 cyclones are expected to be used. The bulk flotation<br />
consists of two copper rougher flotation banks each consisting of seven 300 m 3 mechanical flotation cells,<br />
operated at a pH of 10. These produce a bulk concentrate containing copper, silver, gold and<br />
molybdenum which reports to the regrind cyclone feed sump. The bulk tailings flow by gravity to the<br />
265 | P a g e
tailings thickener for eventual disposal at the TMF. Spillage and water are removed by two rougher<br />
flotation area sump pumps.<br />
The bulk rougher concentrate is pumped to a cyclone cluster. Finer material, which does not require<br />
regrinding, would report to the cyclone overflow. The coarse material reports to the cyclone underflow<br />
and is pumped to the bulk cleaner regrind mill. A 3 MW Xstrata M10.000 IsaMill is used.<br />
The regrind mill discharge is combined with the regrind mill cyclone cluster overflow, and is pumped to the<br />
first bulk cleaner flotation cell. In the bulk cleaner circuit the pH is increased to 11.0 with slaked lime.<br />
The copper cleaner circuit consists of three stages of cleaning and one bank of cleaner scavenger<br />
flotation cells.<br />
The first bulk cleaning circuit consists of four OK-130 130 m 3 flotation cells. Concentrate containing<br />
copper and molybdenum is recovered and reports to the 2nd stage cleaner feed sump and the 2nd stage<br />
cleaner flotation cells for further upgrading. The tails report to the five cleaner scavenger flotation cells.<br />
The 2nd stage copper cleaner flotation stage consists of three OK-130 130 m 3 mechanical flotation cells.<br />
The concentrate reports to the 3rd copper cleaner flotation stage for further upgrading. The tails from the<br />
2nd copper cleaner report back to the copper cleaner conditioning tank.<br />
The 3rd copper cleaner flotation stage consists of two ERIEZ (CPT) flotation columns, 4.88 m diameter x<br />
12 m high. The columns produce a bulk copper/molybdenum concentrate which reports to the<br />
molybdenum feed thickener in the molybdenum flotation circuit for further treatment. The tails stream<br />
reports to the head of the 2nd stage copper cleaner flotation stage via the feed sump. The flotation<br />
columns are supplied with compressed air from dedicated copper flotation column compressors.<br />
The copper cleaner scavenger stage consists of six OK-130 130 m 3 mechanical flotation cells. Low grade<br />
concentrate is recovered and reports back to the copper cleaner conditioning tank. The tails are fed to<br />
the tailings thickener.<br />
The flotation cells, other than the flotation columns, are supplied with low pressure air from dedicated low<br />
pressure air blowers.<br />
The copper/molybdenum concentrate from the copper 3rd stage cleaner flotation column reports to 24.0<br />
m diameter copper/molybdenum feed thickener. The main function of the thickener is to reduce carryover<br />
of reagents from copper flotation into the molybdenum flotation circuit. Thickener overflow is returned to<br />
the copper circuit.<br />
266 | P a g e
Figure 17-8: Cu-Mo flotation circuit isometric view<br />
17.6.1 LAYOUT<br />
The cleaning circuit, consisting of 1st, 2nd and scavenger flotation stages will be arranged in a counter<br />
current arrangement, whereby the largest flow, the tails, flows by gravity from one stage to the next. All<br />
cells are the same size. The concentrate launders and pumps are all arranged on the outside of the plant<br />
to allow for easy maintenance access. This arrangement also allows for the number of cells in each<br />
stage to be modified, with some minor pipework changes, during operations.<br />
17.6.2 BULK FLOTATION AREA SUMPS<br />
To reduce capital costs and improve the overall plant, the volume held in each sump has been minimized.<br />
Under normal operating conditions, the slurry that is collected under the flotation areas is concentrate<br />
from the top of the cells. This will be collected and pumped from the sump pump area back into the<br />
process.<br />
During routine shutdowns or power failures, the mechanical cells can stop and do not need to be drained.<br />
For maintenance, it will be occasionally necessary to dump the contents of the flotation cells.<br />
Since the value of the slurry in each rougher cell is low, the sump is not designed to contain an entire cell.<br />
In a typical maintenance shutdown the slurry dumped from the rougher cells is expected to be pumped to<br />
tails by the rougher area sump pump. If this pump fails or if there is no power, then the rougher slurry will<br />
overflow the sump and run along a channel to the plant run off pond. This would be an exceptional case,<br />
such as in an emergency.<br />
In the case of the 3 rd cleaner columns, the sump has enough volume to hold one of the two columns. If<br />
the plant is down for more than 3 to 4 hours then the columns will need to be drained. If the sump pump<br />
is down then the sump will over flow into the 2 nd cleaner sump.<br />
267 | P a g e
17.7 MOLYBDENUM SEPARATION<br />
The function of the molybdenum flotation area (Figure 17-9) is to recover molybdenum into a<br />
molybdenum concentrate and reject copper to the tailings as a copper concentrate. The stages of<br />
molybdenum flotation are: rougher, 1st to 7th stage cleaners and cleaner scavengers.<br />
The molybdenum roughers, first cleaners, second cleaners and cleaner scavengers consist of 10 m 3<br />
cells, and the subsequent molybdenum cleaner circuits consist of 3 m 3 cells. The flotation cells are<br />
covered and air is induced into each cell.<br />
Underflow from the copper-molybdenum concentrate thickener is pumped to a 38 m 3 agitated<br />
molybdenum rougher conditioning tank. NaHS is added to the conditioning tank to inhibit the flotation of<br />
copper, with promoter also added to enhance the flotation of molybdenum. From there the overflow flows<br />
to the ten 10 m 3 molybdenum rougher flotation cells. The tailings from the rougher cells form a portion of<br />
the copper concentrate and are pumped, with the molybdenum cleaner scavenger tailings, to the copper<br />
concentrate thickener. The molybdenum rougher concentrate reports to the molybdenum 1 st cleaner<br />
flotation cells.<br />
All of the molybdenum cells, other than the final cleaner, will be WEMCO type self aspirating cells from<br />
FLSmidth.<br />
The molybdenum cleaner circuit consists of seven stages of cleaning and one bank of cleaner scavenger<br />
flotation cells. The molybdenum 1st stage cleaner consists of three 10 m 3 mechanical flotation cells.<br />
From these a concentrate containing molybdenum values is recovered and flows to the molybdenum 2nd<br />
stage cleaner flotation cells for further upgrading. The tailings from the molybdenum 1st stage cleaner<br />
flow to the two 10 m 3 molybdenum cleaner scavenger flotation cells.<br />
The molybdenum 2nd stage cleaner flotation consists of two 10 m 3 flotation cells. From the flotation cells<br />
the concentrate reports to the molybdenum 3rd stage cleaner flotation cells for further upgrading. The<br />
tailings from the molybdenum 2nd stage cleaner flotation cells reports to the molybdenum 1st stage<br />
cleaner flotation cells.<br />
The molybdenum 3rd stage cleaner flotation consists of two 3 m 3 flotation cells. From the cells, the<br />
concentrate reports to the molybdenum 4th stage cleaner flotation cells for further upgrading. The<br />
molybdenum 3rd stage cleaner tailings report to the molybdenum 2nd stage cleaner flotation cells.<br />
The molybdenum 4th stage cleaner flotation consists of two 3 m 3 flotation cells. The cells produce<br />
molybdenum concentrate which reports to the molybdenum 5th stage cleaner flotation cells. The tailings<br />
from the molybdenum 4th stage cleaner cells reports to the molybdenum 3rd stage cleaner flotation cells.<br />
The molybdenum 5th stage cleaner flotation consists of a single 3 m 3 flotation cell. The cell produces a<br />
molybdenum concentrate which reports to the molybdenum 6th stage cleaner flotation cell. The tailings<br />
from the molybdenum 5th stage cleaner cell reports to the molybdenum 4th stage cleaner flotation cells.<br />
The molybdenum 6th stage cleaner flotation consists of a single 3 m 3 flotation cell. The cell produces a<br />
molybdenum concentrate which reports to the molybdenum 7th stage cleaner flotation cell. The tailings<br />
from the molybdenum 6th stage cleaner cell reports to the molybdenum 5th stage cleaner flotation cell.<br />
The molybdenum 7th stage cleaner flotation consists of a single 3 m 3 Xstrata Jameson flotation cell. The<br />
cell produces a molybdenum concentrate which is pumped to the molybdenum concentrate thickener.<br />
268 | P a g e
The tailings from the molybdenum 7th stage cleaner cell reports to the molybdenum 6th stage cleaner<br />
flotation cell.<br />
The molybdenum cleaner scavenger consists of two 3 m 3 mechanical flotation cells. A low grade<br />
concentrate is recovered and is pumped back to the copper/molybdenum feed conditioner tank. The<br />
tailings from the molybdenum cleaner scavenger are pumped to the copper concentrate thickener.<br />
Spillage and water are removed by a sump pump in the flotation building.<br />
Figure 17-9: Cu-Mo separation circuit isometric view<br />
17.8 COPPER CONCENTRATE THICKENING AND FILTRATION<br />
The tailings from the molybdenum flotation roughers and molybdenum cleaner scavengers report to a 24<br />
m diameter copper concentrate thickener (Figure 17-10), via a static screen to remove tramp material.<br />
Flocculant is added to enhance settling. The clarified thickener overflow reports to the process water<br />
pond, to be pumped to the process water tank. The thickener underflow is removed at 60% solids via<br />
duty/standby peristaltic pumps.<br />
The thickened and de-tramped slurry is stored in two 860 m 3 agitated tanks. These provide a 24 hour<br />
surge capacity, allowing filter maintenance to be conducted without affecting mill throughput. The filter<br />
feed is pumped to three vertical pressure filters with a combined maximum filtration rate of 91.2 t/h. The<br />
filters operate with a total cycle time of 12.5 min and are designed to produce a filter cake of 9.0%<br />
moisture. The filter cake is dropped to the floor below where it is transferred to the concentrate storage<br />
pile by front end loader. Filtrate, cloth wash, and flushing water are returned to the copper concentrate<br />
thickener.<br />
269 | P a g e
Figure 17-10: Cu concentrate thickening and filtration area isometric view<br />
17.9 CONCENTRATE STORAGE AND LOADOUT<br />
After filtering, the copper concentrate is transferred to a copper concentrate product storage stockpiles by<br />
front end loader inside the copper concentrate and load-out building. The building contains a live<br />
stockpile with capacity for seven days production (12, 024 t).<br />
A fleet of approximately 65 tractor trailers, each with 36 t hauling capacity, are expected to be used to<br />
transport the concentrate to the port. A single front end loader is expected to collect concentrate as it falls<br />
from the filters and either load it directly onto the trucks or temporarily store it in the same building. It is<br />
expected that this fleet and its operation will be outsourced. Several companies with similar experience<br />
have indicated their interest in doing so. During daylight hours the trucks will drive from site to the<br />
Matarani port then back to the site empty. At peak production, about 40 trucks per day are expected to<br />
leave site.<br />
17.10 MOLYBDENUM CONCENTRATE THICKENING AND FILTRATION<br />
The molybdenum concentrate gravitates to a 4 m diameter thickener where it is thickened to 60% solids.<br />
The thickener overflow reports to the molybdenum process water tank, where it is used as process water<br />
in the molybdenum flotation circuit. The thickened concentrate is pumped to an agitated 48 m 3<br />
molybdenum surge tank, which has a residence time of 24 hours and acts as surge capacity for filtration.<br />
The slurry is then pumped to a pressure filter to produce a filter cake of approximately 15% moisture.<br />
Filter cake is conveyed by a bobcat to the molybdenum bulk bagging plant. Molybdenum concentrate is<br />
bagged into 1 m 3 bulk bags. The bulk bags are loaded onto trucks using forklifts.<br />
The filtrate from the filter reports to the tailings thickener. The thickener overflow flows by gravity to the<br />
process water tank.<br />
270 | P a g e
17.11 TAILINGS DISPOSAL<br />
The copper tailings flow by gravity from the two copper rougher tailings lines, and by pumps from the<br />
cleaner scavenger tailings line, to a 75 m diameter tailings thickener, where it is thickened to 58% solids.<br />
Thickened underflow is then pumped to the tailings dam. The thickener overflow gravitates to the process<br />
water tank where it is used in the grinding and copper roughing circuits.<br />
The tailings pumping system consists of five cetrifugal pumps in series with an HDPE lined steel pipe that<br />
crosses the Chilloroya valley. The pumping station at the plant site is designed to take tailings thickener<br />
underflow and dilution water and pump the mixture to the tailings dam on the other side of the valley. The<br />
pipeline follows the haul road route to save costs, increase maintenance access and reduce land<br />
disturbance. The road is built at low slope angles, typically less than 10%. The tailings pipeline will have<br />
a maximum slope of 12%. This is less than the angle of repose of the settled solids in the slurry, which is<br />
15°. Consequently, if there is an unprogrammed shutdown, for example a power outage, the slurry can sit<br />
in the line without having to be discharged or flushed. To reduce the risk of plugs during startup, all of the<br />
pumps in the pump station will be fitted with variable speed drives.<br />
Under a normal scheduled stoppage, process water will be used to flush the solids from the line into the<br />
tailings dam.<br />
17.12 REAGENTS<br />
The reagents area is located to the west of the grinding and flotation areas.<br />
Coarse lime and flocculant are delivered as solids to the reagents area by road trucks and stored in the<br />
reagents building.<br />
A packaged flocculant mixing plant prepares flocculant for storage in an agitated tank for distribution.<br />
Other powdered reagents are mixed in agitated tanks before storage in tanks for distribution.<br />
Liquid flotation collector and frother will be received in one cubic meter iso-containers that will be stored in<br />
the reagent store and taken by forklift to the reagent dosing area as required.<br />
Reagents are distributed by duty/standby pumps or multiple peristaltic metering pumps along flexible<br />
small diameter tubing. Spillage and water are removed by the reagents area sump pump to tailings.<br />
A diesel/fuel oil emulsion preparation facilities will allow addition of small doses of this reagent for<br />
molybdenum promotion while assuring even dosing in the slurry.<br />
A spare solid reagent preparation tank, bag splitter and dosing tank are to be installed without<br />
interconnecting pipes and pumps. This is to facilitate reagent regime changes during operations, if<br />
required.<br />
Lime silo and attrition mills prepare milk of lime for pH adjustment. Lime is distributed by a lime ring to the<br />
dosing points. Spillage and water are removed by a lime slaking area sump pump.<br />
Nitrogen for blanketing the molybdenum separation cells will be supplied by a pressure swing adsorption<br />
plant on site.<br />
Carbon dioxide that will be used for pH regulation in the molybdenum plant will be supplied in tanks.<br />
271 | P a g e
NaHS will be delivered as a concentrated liquid by tanker. It will be diluted with water onsite for dosing. It<br />
was decided not to have solid NaHS preparation facilities onsite to reduce CAPEX, reduce safety risks<br />
and reduce the working capital and management issues of storing solid NaHS.<br />
Hydrogen sulphide gas that comes from the NaHS is extremely toxic. Sensors and suitable engineering<br />
controls have been designed in order to use NaHS safely in the plant.<br />
17.13 NOMINAL OPERATING PARAMETERS<br />
Based on metallurgical testing and the current level of engineering design, reagent, power, water and<br />
grinding media consumption rates are shown in Table 17-12.<br />
Table 17-2: Nominal Operating Parameters<br />
Item Section Item Value Unit<br />
Reagent<br />
Addition<br />
Grinding<br />
Cu Flotation<br />
Cu Flotation<br />
Mo Flotation<br />
Mo Flotation<br />
Mo Flotation<br />
Concentrate<br />
Thickeners<br />
Tailings Thickener<br />
Quicklime<br />
Primary Collector (Cytec A-<br />
3302)<br />
Frother (AF-65)<br />
Depressant (NaHS)<br />
Promoter (Diesel Emulsion)<br />
Carbon Dioxide<br />
Flocculant (Concentrate<br />
Thickener)<br />
Flocculant (Tailings Thickener)<br />
697<br />
30.0<br />
30.0<br />
5,000<br />
10.0<br />
35.7<br />
30.0<br />
10.0<br />
g/t fresh feed<br />
g/t fresh feed<br />
g/t fresh feed<br />
g/t Mo circuit<br />
feed<br />
g/t Mo circuit<br />
feed<br />
g/t fresh feed<br />
g/t thickener<br />
feed<br />
g/t thickener<br />
feed<br />
Power<br />
Consumption<br />
Plant<br />
Plant<br />
Electrical Load List<br />
Project Ancillaries<br />
762,591<br />
89,132<br />
MW-h/y<br />
MW-h/y<br />
Plant<br />
Total<br />
851,723<br />
MW-h/y<br />
272 | P a g e
Item Section Item Value Unit<br />
Water<br />
Raw Water<br />
Requirements in<br />
Process Plant<br />
Annual Average Flow<br />
Planned Average Flow<br />
0.88<br />
98<br />
Mm 3<br />
m 3 /h<br />
Instantaneous Flow<br />
107<br />
m 3 /h<br />
Grinding<br />
Media<br />
Grinding<br />
SAG mill media<br />
Ball mill media<br />
290<br />
480<br />
g/t<br />
g/t<br />
Regrind media<br />
64<br />
g/t<br />
17.14 METALLURGICAL ACCOUNTING AND CONTROL<br />
The plant will normally run in automatic mode whereby all major units will be monitored and maintained<br />
by the DCS system logic.<br />
The plant operations will be monitored and controlled from a central control room that will be located<br />
between the grinding, flotation and regrinding areas. This control room will have CCTV views of different<br />
plant areas and DCS views of all the plant equipment, valves and instrumentation.<br />
The crusher and molybdenum areas will also have DCS interfaces. Various managers and remote parties<br />
will have access to the operating data via a web interface.<br />
Plant operations will be facilitated by two online stream analysers (Outotec Couriers with stream<br />
multiplexers). These units will constantly measure the principal streams for elements of interest and<br />
transmit the results to the operations and metallurgical staff for plant control.<br />
The metallurgical accounting will be achieved by shift composite sample analysis in the site laboratory.<br />
The samples will be taken from the cyclone overflow, rougher tailings, cleaner scavenger tailings and<br />
overall tailings.<br />
Flows will be accounted for by weightometers on the SAG mill feed conveyors and flow meters on the<br />
concentrate and tailings flows.<br />
Final concentrate tonnage will be controlled by weigh bridges that will weigh trucks as they leave site and<br />
arrive at the port. A weightometer on the ship loading conveyor will measure the concentrate weight<br />
loaded onto the ships.<br />
17.15 PAMPACANCHA<br />
The Pampacancha resource has only been studied to the pre-feasibility study level and so testwork is still<br />
at the preliminary level and several assumptions have been made about its metallurgical performance.<br />
273 | P a g e
The comminution results indicate that the rock is typically less competent and softer than the Constancia<br />
hypogene ore, so the grinding circuit will likely be able to sustain the same throughput as the Constancia<br />
ore.<br />
Pampacancha contains a lot of magnetite, so the ore has a higher density than Constancia. That means<br />
that the primary crusher, feeders and stockpiles are not expected to be bottle necks as the volumetric<br />
flowrate will be lower.<br />
The pebble crushers could experience operating difficulties as the magnetite may be rejected by the<br />
magnets or set off the metal detectors.<br />
The flotation tests show that similar retention times and mass pulls are expected to those designed for<br />
Constancia.<br />
The tailings thickener is assumed to have similar or higher capacity for Pampacancha than for Constancia<br />
due to the high magnetite content, but no testwork has been conducted yet.<br />
The concentrate filters have been designed for similar copper minerals and higher concentrate tonnages<br />
than Pampacancha, so they are not expected to be bottle necks.<br />
The tailings pipeline has been designed for solids with a lower specific gravity. A higher minimum velocity<br />
may be required for Pampacancha tailings. The current design allows for higher flowrates, but further<br />
testwork and engineering will be required to confirm that the pipeline will be suitable for Pampacancha<br />
tailings.<br />
There was some difficulty in getting high recoveries and concentrate grades in locked cycle tests on the<br />
first phase of Pampacancha testwork. Additional plant reagents or equipment may be required in the next<br />
phase of testwork. It is assumed that minor plant modifications in the first year of operations will be<br />
adequate to prepare the Constancia plant to be able to treat Pampacancha ore suitably.<br />
274 | P a g e
18.0 PROJECT INFRASTRUCTURE<br />
The project infrastructure consists of the management of waste rock, tailings and water, electric power<br />
supply and transmission, and improvements to the roads and the port. Figure 18-1 provides an overall<br />
site layout showing the location of the various storage facilities relative to the Constancia and<br />
Pampacancha mines and the mill.<br />
Figure 18-1: Overall site layout<br />
18.1 TAILINGS, WASTE AND WATER STORAGE<br />
Knight Piésold and Co. (Knight Piésold) is responsible for the planning, designing, and cost estimating for<br />
the Tailings Management Facility (TMF), as well as the mine waste management facilities and site-wide<br />
water management plans, including sediment and erosion control.<br />
18.1.1 TAILINGS MANAGEMENT FACILITY<br />
The tailings management facility (TMF) will be developed behind an east to west aligned, zoned earthfill<br />
and rockfill cross-valley embankment dam that is expected to be raised in stages over the life of the mine<br />
and has been designed to store 445 million tonnes (Mt) of tailings (derived from 449.8 Mt of ore). The<br />
tailings are expected to be impounded behind the south side of the embankment in a basin that contains<br />
275 | P a g e
two natural valleys running north to south that are separated by a central ridge. Initially, it is anticipated<br />
that the embankments in the valleys will be developed independently, but after they are raised above the<br />
dividing ridge they will be combined and raised as one continuous structure. Construction of the<br />
embankments is expected to begin 2 years prior to the start of production. It is anticipated that the east<br />
valley will be initially used to store water for the mill startup and tailings deposition will commence in the<br />
west valley. Details of the TMF design are described below.<br />
Tailings will be deposited from designated off-take points from a distribution pipeline located along the<br />
upstream crest of the embankment and around the perimeter of the facility, and will be delivered through<br />
drop-bar pipes running down the upstream face of the embankment and down the valley perimeter slopes<br />
into the TMF. The points of active deposition will be frequently rotated to form a thin layered, drained, and<br />
well consolidated beach that will slope away from the embankment towards the south side of the TMF<br />
basin. Initially, the surface pond will be located against the embankment in the east valley, but it will be<br />
displaced progressively upward and to the south by the development of the tailings beach, such that<br />
within the first three years of operations the beach is expected to become well developed against the<br />
embankment. The surface pond will vary in size throughout the life of mine depending on the season,<br />
precipitation, and operational requirements.<br />
The design of the TMF includes a LLDPE geomembrane liner and underdrains. The liner is intended to<br />
cover the base of the entire eastern valley and a majority of the western valley to provide containment in<br />
areas where the surface water pond will be in contact with the base at any time over the life of mine. The<br />
liner will also be extended up the upstream face of the embankment to the top of the downstream<br />
constructed raise. Underdrain systems include groundwater underdrains beneath the liner, tailings<br />
underdrains, and an embankment toe drain.<br />
Water collected by the underdrains will be conveyed to sumps located immediately downstream of the<br />
embankment in both the east and west valleys. The groundwater underdrain and tailings underdrain<br />
outlet pipes in each valley will be installed in reinforced concrete encasements under the embankment.<br />
At the sumps, monitoring and control systems will allow for automated water quality and flow rate<br />
determinations to be made prior to pumping back to the surface water pond.<br />
<strong>Instrument</strong>ation will be installed in the TMF to monitor the structure throughout the life of the facility.<br />
Settlement and deformation monuments will be installed on the downstream embankment face and on<br />
the embankment crest during each major stage of construction. Additionally, vibrating wire piezometers<br />
will be installed within the embankment.<br />
Project risks and potential mitigating measures were identified as follows:<br />
Stability of Modified Centerline Raises - Risk is mainly associated with liquefaction of the tailings<br />
deposit in the event of a significant earthquake which will affect slope stability of the structure. Mitigation<br />
strategies for this will be to alter the cross-section of the embankment. Sophisticated geotechnical<br />
analyses will be completed to confirm the final geometry of the modified centerline raise and the widths of<br />
the various zones that are proposed.<br />
Availability and Suitability of Borrow Materials - Mitigation strategies include evaluation of alternate<br />
borrow sources.<br />
Delays to Construction Schedule and Sequencing - Careful construction management strategies will<br />
need to be implemented and correctly timed.<br />
276 | P a g e
Poor Tailings Water Quality - A careful tailings management plan shall be implemented so that the<br />
tailings are not left exposed for an extended period of time. Also, current planning for the facility is for it to<br />
operate as a “zero discharge” facility.<br />
Geotechnical laboratory testing is in progress for the tailings as well as the borrow materials which will<br />
comprise fill materials for the TMF embankment. Results of the testing will be used to evaluate material<br />
properties and inputs for use in subsequent geotechnical analyses. The current strategy is to complete<br />
seepage and slope stability analyses using the Geostudio software (SEEP/W and SLOPE/W) as an initial<br />
step, and then to complete more sophisticated analyses once a finalized cross-section is developed and<br />
geotechnical testing is complete.<br />
A Bog Storage Facility has been designed for the storage of approximately 2.8 million cubic meters of bog<br />
and unsuitable soils excavated from the TMF foundation.<br />
18.1.2 WASTE ROCK FACILITY<br />
The Potentially Acid Generating Waste Rock Facility (PAG WRF) is located in the Cunahuiri Valley east of<br />
the Constancia Pit and provides storage for 560 Mt of PAG waste based on the mine plan received on,<br />
May 11-13, 2012. It has a placed density of 1.9 t/m 3 , resulting in a total volume of 295 Mm 3 .<br />
The Waste Rock Facility Retention Pond is located downstream from the WRF in the Cunahuiri Valley.<br />
The pond provides energy dissipation for surface water reporting to the downstream WRF Containment<br />
Pond via overland flows and the contact diversion channels and protects the WRF Containment Pond<br />
from possible falling waste rock and sedimentation. It has a design capacity of approximately 24,000 m 3<br />
for the initial 7 years of operation (July 2014 through 2021). .<br />
The Waste Rock Facility Containment Pond is located downstream of the WRF Retention Pond in<br />
Cunahuiri Valley. The pond provides storage capacity for surface runoff, direct precipitation and seepage<br />
collected from the WRF and its contact diversion channels. The pond will also store Acid Rock Drainage<br />
(ARD) water, which will be pumped to a lime neutralization facility at the process plant prior to its eventual<br />
use in the process plant. A foundation grout curtain is to be incorporated into the embankment foundation<br />
to minimize seepage. The pond design capacity is approximately 600,000 m 3 for the initial 7 years of<br />
operation (July 2014 through 2021) to accommodate the maximum operational volume and additional<br />
storage to accommodate the 100-yr/24-hr storm event. This capacity of these ponds will be reassessed<br />
for later years of operation due to the potential expansion of the WRF.<br />
Non-Contact Channels are sized to accommodate the 200-year/24-hour (200-yr/24-hr) storm event with<br />
an additional freeboard or a 500-yr/24-hr storm event with no allowance for a freeboard.<br />
Topsoil Stockpile No.1 is located in Cunahuiri Valley downstream of the WRF Containment Pond and has<br />
a design storage capacity of 4.7 Mm 3 . This stockpile stores topsoil excavated during construction<br />
activities. Topsoil will be used throughout operations for progressive closure of various facilities.<br />
The Non-PAG Waste Rock Facility has a design storage capacity of 27 Mt (14 Mm 3 at 1.9 t/m 3 ). Primarily,<br />
Non-PAG waste rock is to be used for the construction of various construction roads, access roads, and<br />
haul roads as well as the Tailings Management Facility (TMF) embankment. Excess Non-PAG waste will<br />
be placed within a temporary stockpile located 1 km southwest of the Constancia Pit.<br />
The pumping system between the WRF Containment Pond and the treatment plant will be designed to<br />
pump ARD water from within the pond to the lime neutralization facility. This pumping rate should be such<br />
277 | P a g e
that the WRF Containment Pond water level will be maintained at or below the maximum operational<br />
water level. The operation pumping rate may be impacted from the results or findings of the<br />
hydrogeological study conducted by Golder for the final design. The pumping rates will be confirmed by<br />
Knight Piésold after completion of the hydrogeology study. The final design of the pumping system will be<br />
performed by Ausenco.<br />
18.1.3 WATER MANAGEMENT<br />
Hydrologic and hydraulic analyses, including a detailed process water balance, were completed to<br />
determine the frequencies and quantities of flows as well as the types of flow, location, and resulting sizes<br />
of the water management structures required to contain or convey them. From the site assessment of the<br />
water management within the project area, the water was divided into categories of process water (water<br />
that is associated with the process and will be used in the process operation and/or it will be transferred<br />
throughout the project via conveyance pipelines) and non-process water (water that is not associated with<br />
process and typically consists of storm water runoff from areas within the project site). The non-process<br />
water was further divided into contact water (potentially acid generating (PAG) runoff water and non-PAG<br />
runoff water) and non-contact water.<br />
Structures directly associated with the site water management include the following:<br />
Diversion Channels – These structures will divert both contact and non-contact water around the project<br />
site to the sediment or water management ponds, or to natural drainages down-gradient of the planned<br />
mine facilities.<br />
Sediment Ponds – These structures typically accept diverted contact water and control the release of<br />
sediments down-gradient of the project by settling the sediments out of the discharged water. The<br />
sediment ponds for the Constancia Project are identified as Main Sediment Pond, Road Sediment Pond<br />
No.1, Road Sediment Pond No.2, TMF Sediment Pond No.1, TMF Sediment Pond No. 2, Plant<br />
Construction Sediment Ponds (work as sediment ponds just during construction phase), and Crusher<br />
Sediment Pond (construction phase).<br />
Water Management Ponds – These structures typically deal with temporary water storage, and may<br />
include both process and non-process water structures. The water management ponds for the Constancia<br />
Project are identified as the TMF Supernatant Pond, Plant Process Pond (operational phase), Plant<br />
Contact Pond (operational phase), Crusher Pond (operational phase), and Cunahuiri Reservoir.<br />
Water Balance – Knight Piésold performed a site-wide process water balance for the final design phase<br />
of the Constancia Project based on the current Mine Plan. Based on the analysis of the water balance<br />
model, sufficient water exists in the system for average climatological conditions to operate at the<br />
proposed mining and milling rates and no additional water sources are required for operation.<br />
The Main Sediment Pond will be a source of makeup for operations, especially for dry conditions in the<br />
first 7 years of operation. As required, water accumulating in the sediment pond can be sent to the TMF<br />
for use in the process. Since the pond will accumulate most of its water during the wet season, in the first<br />
seven years of operation for dry climatological conditions (below average), it was estimated that the<br />
average transfer rates range from 250 to 400 m3/h (with a maximum of 600 m3/h) during the wet season.<br />
This water will then be stored in the TMF for use during the dry season, as needed. During the dry<br />
season, the flow rates are minimal as little water accumulates in the main sediment pond.<br />
278 | P a g e
18.2 ON SITE CAMPS<br />
Constancia is a remote site with restricted road access from the nearest significant town 1 ½ hours away.<br />
This requires that two camps (one permanent and one for the construction phase) be constructed to<br />
house all personnel needed for community relations, environmental and safety support, and<br />
management, engineers and work crews that are required to perform exploration, geotechnical<br />
investigations and construction of the facilities. The camp facilities have been designed with reference to<br />
the IFC standards for camp construction for mining activities.<br />
18.2.1 PERMANENT CAMP<br />
The permanent camp (called Fortunia) was developed to provide accommodations for the initial<br />
personnel needed for community relations, safety and environmental, security and the initial construction<br />
support activities. It is in the process of being expanded to house engineering and construction personnel<br />
to implement the larger camp required during peak construction activities. The Fortunia camp will remain<br />
for the duration of operations at the Constancia project to provide accommodation for operating personnel<br />
and the necessary support personnel.<br />
The base for the Fortunia camp was a hacienda. The rooms of this hacienda are now being used for<br />
office space as well as the kitchen and dining area. At present, with the hacienda and prefabricated<br />
modules that were installed prior to 2012, Fortunia has a nominal capacity of 200 people.<br />
When the Fortunia camp expansion is completed it will be capable of housing 620 people. This will be<br />
accomplished by installing additional prefabricated modules for room space. Prefabricated modules for<br />
service facilities such as a gate house, medical facility, additional office space and a new kitchen and<br />
dining room will be provided. The present kitchen and dining areas will be modified to provide meeting<br />
room space. The expansion of the accommodations also required the expansion of infrastructure which<br />
includes gas and diesel storage and dispensing, expanded waste water treatment plants, vehicle parking,<br />
and development of an additional water supply. Lightning is a concern in this area and a system of<br />
lightning protection will be incorporated into the expansion of the facilities. Block walls will be provided in<br />
strategic areas of the camp site for wind protection.<br />
Electric power will be provided by generators until such time as the main power line to the process plant<br />
is operational and a short feed line is installed to Fortunia for the long term.<br />
Once construction is complete and operations are underway, the accommodation needs for Fortunia as a<br />
permanent camp will be approximately 400. Fortunia can then be optimized for this accommodation need.<br />
18.2.2 TEMPORARY CAMP (CONSTRUCTION CAMP)<br />
The projected peak manpower requirement for constructing Constancia is in the range of 3000 to 3200.<br />
With the Fortunia camp capacity at 620, the Construction Camp has been designed with a capacity of<br />
2608 people in total. The construction camp will be located near the process plant facilities to allow for<br />
efficiencies during the construction effort. It is designed with facilities and equipment considering a 2 to 3<br />
year life duration. All the personnel accommodations and service facilities are intended to be removed<br />
after the construction effort is complete. During its existence, however, the construction camp requires the<br />
same support services such as a gate house, medical facility, offices, laundry, and power house. All of the<br />
support facilities are being coordinated with the Fortunia camp capabilities used to define the required<br />
capacity of the construction camp facilities.<br />
279 | P a g e
Water supply for the construction camp will come from a spring near to the construction camp site. Water<br />
treatment is provided to assure quality. Waste water treatment facilities will also be provided to treat the<br />
camps sewage to a point to meet discharge regulations.<br />
Fuel storage will be provided at the camp for distribution to the generators and for light vehicle refuelling.<br />
Fuel distribution to both Fortunia and the construction camp will be from a main temporary fuel storage<br />
site that will provide fuel for contractor activities as well.<br />
18.3 ELECTRIC POWER SUPPLY AND TRANSMISSION<br />
A study was undertaken by Alpha Plus Ingenieros S.A.C to evaluate the options for supply and<br />
transmission of electric power to the Constancia site. The results confirmed that the Peruvian bulk power<br />
system has been well established in legal, corporate, regulatory and technical matters, in order to<br />
continue supporting electric demand within the country.<br />
The difference between firm capacity (available to be contracted) and contracted capacity, changes every<br />
year. According to the evaluation conducted, even during the year (2014) with the minimal available<br />
capacity, the power available is 1,865 MW more than required for Constancia. Shortly after 2014, several<br />
contracts expire and demand drops off considerably. Even after taking into consideration that there are<br />
contracts currently under negotiation, there should still be 500 MW available as a minimum. The prices<br />
range from $60 to $80/MWh.<br />
18.3.1 POWER SUPPLY<br />
An option study was undertaken based on establishing a connection to the Peruvian <strong>National</strong><br />
Interconnected Electric System (SEIN), and terms of reference for the investigation included technical,<br />
economic, environmental, land ownership, cultural and heritage considerations. The scope of the study<br />
included the required facilities at the origin of supply, the transmission line, switchyard and main switch<br />
room at the Constancia mine site.<br />
The plant maximum demand is estimated to be 96 MW with an average load of 85 to 90 MW in the first<br />
five years, which will increase as more competent ore is treated in later years.<br />
The DFS identified the preferred option of initially securing supply at 138 kV from the Tintaya substation,<br />
with transmission by means of a single circuit supported by lattice steel towers over a route length of 70<br />
km to the Constancia mine site, designed for future operation at 220 kV. It was assumed at the time that<br />
220 kV supply would become available from the Tintaya substation in 2012. Part of the master plan<br />
developed by the MEM (Ministry of Energy and Mines) is the development of the Socabaya - Tintaya 220<br />
kV transition line, ensuring short and long term carrying capacity power from the national grid to the<br />
Tintaya substation, which will be the main connection point to the Constancia site.<br />
TESUR, the transmission company, advised in April 2012 that the new Tintaya substation upgrade and<br />
the 220kv power line have been approved by the grid operator, COES, with a scheduled completion of<br />
April 2013. OSINERGMIN (Government agency in charge of <strong>National</strong> Grid projects) has officially<br />
indicated that the 220kV supply is re-scheduled for completion in July 2013 and will be available for the<br />
Constancia project connection. OSINERGMIN unofficially has indicated that Tesur will request another<br />
extension of three months. This would put completion of this line out to October 2013 which will still be in<br />
time for connection to the Constancia substation. For reference, mechanical commissioning of mills in the<br />
concentrator is forecast to commence in the second quarter of 2014.<br />
280 | P a g e
18.3.2 POWER TRANSMISSION<br />
The transmission line from the Tintaya substation to the Constancia mine site has been designed in<br />
accordance with relevant North American and European codes and standards, and in recognition of all<br />
environmental, geological, social and cultural considerations related to the land and airspace easement<br />
along the proposed route of the line.<br />
The initial DFS design of the Tintaya Constancia Power Line (2009) defined the connection to the national<br />
grid across the old Tintaya Substation (138 kV) and was comprised a 70 km long power line, designed to<br />
operate at 220 kV during sustained operation and 138 kV during initial operation. Since the initial DFS<br />
design it has been concluded that the 138Kv line will have only 27Mw available due to the connection of<br />
the Antapacay project. Due to this, the 138Kv line will not be available for connection to the Constancia<br />
substation. As a result, <strong>Hudbay</strong> will need the 220Kv Socabaya Tintaya <strong>National</strong> Grid project completed in<br />
order to connect Constancia to the <strong>National</strong> Grid.<br />
Topographic and geological surveys were completed along the proposed route and at the Tintaya and<br />
Constancia substation sites.<br />
An archaeological survey was completed along the proposed power line route, from which it was<br />
concluded that there would be no impact upon, or compromise of any kind to archaeological remains in<br />
the vicinity of the easement along the full length of the proposed transmission line. <strong>Hudbay</strong> has the<br />
“Certification of the Non-Existence of Archaeological Remains” (CIRA) that is required from the <strong>National</strong><br />
Cultural Institute of Peru.<br />
The ESIA for the power transmission is included with the mine ESIA and is complete. <strong>Hudbay</strong> will be<br />
required to turn the CIRA and the ESIA portion of the mines ESIA over to the concessionaire. This is not a<br />
function which the government needs to approve or involved with; this is only part of the contractual<br />
agreement between <strong>Hudbay</strong> and the concessionaire.<br />
18.3.3 CURRENT STATUS<br />
Constancia requires the provision of electricity to the Constancia Electrical Substation located within the<br />
project itself. In order to achieve this, <strong>Hudbay</strong> is in the process of obtaining bids from third parties to<br />
provide Integrated Services and Power to the Constancia Project, which will include, in general terms,<br />
engineering, procurement and construction of the power facilities, followed by the operation and<br />
maintenance services of the Constancia 220 kV substation, the 220 kV transmission line running from the<br />
new Tintaya Substation to the Constancia HV Substation, and connection facilities.<br />
Under the terms of the Request for Tender, it has been established that, while the Constancia Substation<br />
and the 220Kv power line will be built, maintained and operated by the contractor, this infrastructure and<br />
the land on which it will be built will remain under the ownership of <strong>Hudbay</strong> and not become part of the<br />
electrical transmission company’s concession.<br />
18.4 ROADS AND PORT<br />
18.4.1 ROADS<br />
Currently there is a road to site, consisting of 70km of sealed road (<strong>National</strong> Route PE-3SG) from Yauri to<br />
the Livitaca turn-off and approximately 10 km of unsealed road (CU-764) from the Livitaca turn-off to site.<br />
These roads (and bridges) are expected to be upgraded, as necessary, to meet the needs for<br />
construction and life of mine use.<br />
281 | P a g e
SIGIT has agreed prepare an access road study for the Constancia Project, including the geotechnical,<br />
geological, traffic and construction material investigation/studies. SIGIT’s scope will include improvement<br />
of roads, and a detailed engineering study of the roads from Yauri to the Livitaca turnoff and the Livitaca<br />
turnoff to the Constancia site.<br />
The road has been divided into two sections as shown in Figure 18-2.<br />
Section 1 begins at the city of Yauri, at the start of the by-pass road (0 km). The route to the mine follows<br />
<strong>National</strong> Route PE-3SG Yauri – Velille – Santo Tomas to the Livitaca turnoff (70km). This section of the<br />
road passes through the villages of Coporaque (15km), Pumahuasi (28km) and Finaya (35km). The<br />
current road design is bitumen seal for the full length.<br />
The Pre-Investment Study recommends a by-pass that crosses the Santo Domingo Bridge which is 20 m<br />
in length. This is the preferred route as it avoids passing through the village of Coporaque and results in<br />
no reinforcements or new bridge lanes being added to the Querobridge, Coporaque bridge and also two<br />
small bridges.<br />
Section 2 begins at the Livitaca turnoff where Section 1 ends with the CU-764 route following the existing<br />
unsealed road up to the Chilloroya River. A new intersection will be constructed on this public road, from<br />
which a private road will be constructed to service the mine. This private road will be finished at the new<br />
Constancia bridge over the Chilloroya River.<br />
The section of road between Yauri and the project is classified as a <strong>National</strong> Class 3 road (less than 400<br />
vehicles per day). The road condition currently for both sections of the road is based on the design<br />
requirement for low traffic frequency and generally consists of a varying pavement width between 4 and 6<br />
m with a non-asphalted road surface (1/2” layer slurry seal and gravel surfacing).<br />
In Section 1 the road surfacing is a 1/2” layer slurry seal and in Section 2 the road surfacing consists of a<br />
layer of compacted wearing course approximately 0.25 m thick. The wearing course is obtained from local<br />
borrowed material consisting of either glacial tills and or weathered rock<br />
282 | P a g e
Figure 18-2: Road Map.<br />
Section 2<br />
Section 1<br />
18.4.2 PORT<br />
Copper concentrate is expected to be shipped from Constancia via road (~460km) and arrive at the<br />
Matarani port in trucks (Figure 18-3).These trucks are equipped with a hydraulically operated covered-box<br />
hinged at the rear, the front of which can be lifted to allow the concentrate to be deposited in the<br />
concentrate shed assigned to <strong>Hudbay</strong> by TISUR, the port operator. The shed is expected to have<br />
between 45 and 90 wet kt capacity. A chute from the shed will feed a conveyor system in a tunnel below.<br />
The same conveyor and ship loading equipment will be shared with other copper concentrate exporters.<br />
283 | P a g e
The ship loading conveyor will be tubular to avoid concentrate losses and to conform to Peruvian<br />
regulations. The design, installation and operation of the port will be by TISUR. <strong>Hudbay</strong> will pay for its use<br />
on a per tonne basis, but will not contribute to the capital cost.<br />
A new Pier F port expansion is currently going through environmental permitting. TISUR expects the new<br />
wharf to be operational by mid-2015. The investment decision (and therefore the completion date for the<br />
new pier and concentrate receiving and ship loading facilities) by TISUR depends on either Xstrata or<br />
Cerro Verde signing a “take or pay” contract for the new port.<br />
As the new pier and concentrate handling facilities come on line, there will be surplus capacity in the<br />
system and <strong>Hudbay</strong> is working with TISUR to secure this capacity for its concentrates. <strong>Hudbay</strong> is<br />
currently in negotiations with TISUR to discuss alternative methods to receive Constancia product during<br />
the period of initial operations and ramp-up in the second half of 2014.<br />
Figure 18-3: Matarani Port Aerial View<br />
Pier C<br />
Proposed<br />
Pier F<br />
284 | P a g e
19.0 MARKET STUDIES AND CONTRACTS<br />
19.1 MARKETING<br />
The following is based on information provided by <strong>Hudbay</strong>’s Marketing group which markets <strong>Hudbay</strong>’s<br />
concentrate production and arranges for freight. It is also consistent with the metals prices and<br />
concentrate sales forecasts used by <strong>Hudbay</strong>’s Treasury group for business planning purposes.<br />
Marketing information regarding molybdenum concentrates is based on a study undertaken in early 2012<br />
by a marketing consultancy company specializing in molybdenum (“Molybdenum Concentrates<br />
Marketing” – Molyexp, Jan.10, 2012).<br />
This information supports the assumptions made in this <strong>Technical</strong> <strong>Report</strong>.<br />
Copper Concentrates<br />
The copper concentrates produced at Constancia are expected (per <strong>Hudbay</strong> Director of Marketing) to be<br />
very marketable with average to above average copper grades, low impurities and low payable gold,<br />
making them attractive to smelters throughout Asia, Europe and even within South America. See Table<br />
19-1 for estimated typical copper concentrate composition.<br />
The medium size nature of the project means that the concentrates are expected to be easily absorbed in<br />
the marketplace. There are also expected to be competitive logistics costs since the project located in a<br />
region in Peru with other significant copper producing mines.<br />
<strong>Hudbay</strong> expects to enter into one or more medium to long term frame contracts with smelters in Asia and<br />
potentially Brazil or Europe. These frame contracts typically reference annual benchmark agreements<br />
between major concentrate producers and smelters for the purposes of fixing key terms such as<br />
treatment and refining charges.<br />
To the extent that Constancia produces a small amount of segregated high zinc/lead concentrates<br />
(expected to be less than 2% of life of mine production) in order to ensure low impurities in the primary<br />
concentrate stream, it is expected that the material will be sold under a long term contract with a metals<br />
trading firm who can blend those concentrates with those of other concentrate producers that have high<br />
levels of different impurities.<br />
Approximately 10-20% of anticipated copper concentrate production is expected to be left un-contracted<br />
and available for spot sales in order to adjust to potential production fluctuations and to take advantage of<br />
market opportunities.<br />
With copper concentrate supply constrained by a lack of mine production, benchmark smelter treatment<br />
and refining charges (TC/RCs) have been relatively steady over the past five years. Over time, TC/RC’s<br />
are expected to trend upwards as supply/demand balances, but we expect ongoing challenges in bringing<br />
new copper projects into production globally together with declining grades at existing projects to provide<br />
a ceiling to TC/RC’s.<br />
285 | P a g e
Table 19-1: Copper Concentrate Composition<br />
Metal Unit Project Average Range<br />
Cu % 26.8 23.7 to 31.8<br />
Ag g/t 219 174 to 2<strong>43</strong><br />
Au g/t 2.1 1.6 to 3.0<br />
Zn % 3.3 1.75 to 5.5<br />
Pb % 0.86 0.5 to 1.7<br />
Supply/Demand Outlook<br />
According to market analysts, the world copper concentrate market is currently exhibiting a slight deficit,<br />
with smelting capacity exceeding concentrate supply. However, concentrate availability is expected to rise<br />
significantly over the next several years, as new mine development and re-activations of brown-field sites<br />
outpace expected increases in smelter capacity. This concentrate surplus is expected to lead to higher<br />
long-term TC/RCs, which will most likely lead to an increase in primary smelter capacity to meet the<br />
available supply of concentrate.<br />
There are significant risks to <strong>Hudbay</strong>’s forecasts of TC/RCs and copper prices, including macroeconomic<br />
conditions and copper mine production. <strong>Hudbay</strong>’s forecasts assume continued economic growth in China,<br />
economic recovery in the U.S. and an eventual resolution of the sovereign debt crisis in Europe. A<br />
worsening of the economic outlook in China or the sovereign debt crisis in Europe could adversely impact<br />
copper prices. On the other hand, there have already been some announced delays and suspensions of<br />
large copper mine projects and difficult project financing conditions could result in further possible delays<br />
or cancellations with some of the smaller and/or more capital-intensive projects. These possible delays<br />
and cancellations could reduce the copper concentrate supply, leading to higher copper prices and lower<br />
TC/RCs.<br />
Molybdenum Concentrate<br />
It is anticipated that a 40% Mo concentrate containing
19.2 METAL PRICE AND COPPER CONCENTRATE TC/RC FORECAST<br />
The forecast metal prices that are currently used in <strong>Hudbay</strong> forecasting and that were used as<br />
assumptions in this <strong>Technical</strong> <strong>Report</strong> are presented in Table 19-2<br />
Table 19-2: Price Forecast<br />
Unit 2012 2013 2014 2015 2016 Long<br />
Term<br />
Metal Prices<br />
Copper US$/lb 3.40 3.40 3.40 3.30 3.10 2.75<br />
Molybdenum<br />
US$/lb 14.00 15.50 15.00 15.00 14.50 14.00<br />
Gold US$/oz 1,650 1,650 1,550 1,450 1,350 1,150<br />
Silver US$/oz 30.00 30.00 30.00 28.00 24.00 23.00<br />
Copper<br />
TC/RC<br />
TC US$/dmt 55.00 55.00 65.00 70.00 70.00 70.00<br />
RC US$/lb 0.055 0.055 0.065 0.070 0.070 0.070<br />
287 | P a g e
19.3 CONTRACTS<br />
Table 19-3 provides a summary of the contracts that are material to the project along with a brief<br />
description and status report.<br />
Table 19-3: Summary of Contracts<br />
Contract Status Comment<br />
Stracon<br />
Contract covering early Heavy Civil Works as well as<br />
the first 5 years of Mining<br />
In place<br />
Terms and Charges are consistent with<br />
industry norms<br />
Ausenco<br />
Contract covering project EPCM<br />
In place<br />
Terms and Charges are consistent with<br />
industry norms<br />
PPA<br />
Contract for supply of electricity to site<br />
Under<br />
negotiation<br />
Estimates used as assumptions in this<br />
technical report provided by local<br />
electricity consultants and appear to be<br />
consistent with area norms<br />
Transmission Line<br />
Contract to build, operate and maintain a 70 km,<br />
220Kv electricity transmission line from the Tintaya<br />
substation to site<br />
In place<br />
Contract in place as of the third quarter<br />
of 2012 with Abengoa<br />
Concentrate Transportation<br />
Contract will provide concentrate transportation<br />
from the site over highway (approx. 475km) to port of<br />
Matarani<br />
To be<br />
determined<br />
Estimates used as assumptions in this<br />
technical report provided by Local<br />
concentrate shipping companies and<br />
appear to be consistent with area<br />
norms<br />
TISUR<br />
Contract will provide storage and shipping services<br />
at the Port of Matarani<br />
Under<br />
negotiation<br />
Estimates used as assumptions in this<br />
technical report provided by TISUR and<br />
appear to be consistent with area<br />
norms<br />
Concentrate Sales and Ocean Freight<br />
To be<br />
determined<br />
Estimates used as assumptions in this<br />
technical report were based on<br />
<strong>Hudbay</strong>’s forecast for TC/RC’s and<br />
industry information regarding ocean<br />
freight supplied by a freight consulting<br />
company in Peru and appear to be<br />
consistent with industry norms<br />
288 | P a g e
20.0 ENVIRONMENTAL STUDIES, PERMITTING, AND SOCIAL<br />
OR COMMUNITY IMPACT<br />
20.1 ENVIRONMENTAL<br />
20.1.1 LEGAL FRAMEWORK<br />
The objective of current mining legislation in Peru is to ensure that new mining operations incorporate<br />
measures to prevent or mitigate foreseeable impacts to the surrounding environment, and that discharges<br />
meet the applicable effluent and emissions limits.<br />
The Constancia Project has been designed to comply with all relevant legislation applicable to the<br />
development of mining projects in Peru including mines, roads, port and transmission lines. Additional<br />
legislation that has been considered includes legislation and regulations regarding archaeological areas<br />
of significance, endangered and protected species as well as community relations and public disclosure<br />
programs. The ESIA is being developed in accordance with the following legislation and standards:<br />
• Peruvian Political Constitution, 1993<br />
• Environmental General Law, 2005<br />
• Private Investment Growth Law, 1991<br />
• Environmental Impact for Works and Activities Evaluation Law, 1997<br />
• Sustainable Utilisation of Natural Resources Organic Law, 1997<br />
• Environmental Impact Assessment <strong>National</strong> System Law, 2001<br />
• Water Resources Law, 2009<br />
• Water Quality <strong>National</strong> Standards, 2008<br />
• Air Quality <strong>National</strong> Standards, 2008<br />
• Noise Quality <strong>National</strong> Standards, 2003<br />
• Health Law, 1997<br />
• Environmental Management <strong>National</strong> System Law, 2004<br />
• Cultural Heritage Protection Law, 1985<br />
• Solid Waste Law (2004) and modifying (2008)<br />
• Forestry and Wildlife Protection Law, 2001<br />
• Mines Closure Law, 2003<br />
• Public Participation Regulations, 2008<br />
• Regulation for Environmental Protection in Mining - Mineral Processing Activities, 1993<br />
• Maximum Permissible Levels for Liquid Effluents from Mining – Mineral Processing Activities, 1996<br />
• IFC/World Bank Social and Environmental Performance Standards.<br />
289 | P a g e
20.1.2 LOCAL AND REGIONAL CONTEXT<br />
The Constancia Project concessions are located in the districts of Chamaca, Livitaca, and Velille – all of<br />
which are in the Province of Chumbivilcas, Region of Cusco (Appendix A – Project Location Map).<br />
The Constancia project includes surface land within the communities of Uchuccarco (District of Chamaca)<br />
and Chilloroya (District of Velille), as well as 4,097 hectares of land already purchased from private<br />
owners.<br />
Each of these communities includes a small “urban centre” and farmland. While the Constancia Project<br />
requires some land to be purchased from each community, and the relocation of 36 rural households of<br />
the Chilloroya community, line of sight from the urban centres to the mine operation will be largely<br />
obstructed by hills.<br />
<strong>Hudbay</strong> has purchased 4,097 ha of private lands to date and in 2012 reached a land purchase agreement<br />
with Chilloroya and a life of mine land use agreement with Uchuccarco to secure land required for project<br />
facilities and part of the project exclusion zone.<br />
The area has a mining history that dates back 50 years to when Mitsui operated a copper-zinc mine in<br />
Katanga near the community of Uchuccarco. Mitsui sold the mine to a Peruvian company which<br />
abandoned the mine in the late 1970s, leaving a legacy of environmental contamination. Tailings were<br />
discharged into the river basin, and the open pits and waste dumps were never reclaimed. People from<br />
the community of Uchuccarco continue to mine (illegally) the abandoned mine workings at Katanga, and<br />
recently installed a small mill to produce concentrate rather than shipping ore.<br />
Near the community of Chilloroya, the local population is engaged in the informal mining of superficial<br />
gold. The company and members of the community have raised concerns with Peruvian authorities<br />
regarding environmental and labour conditions related to the informal mining activities, and levels of<br />
mercury found in sediments near a rudimentary gold processing area exceed international standards for<br />
the protection of aquatic life. Studies completed as part of the ESIA have documented elevated blood<br />
levels of mercury in local children.<br />
In general, results indicate that the water quality within the project area has neutral to alkaline pH and in<br />
some locations exceeds the national standards for iron, manganese, copper, lead and zinc in the<br />
Chilloroya river; iron and microbiological parameters in “Hacienda Fortunia”; coliform in Pincullune –<br />
Condormarca creek (Jappococha); copper, manganese, zinc, and lead in Sacrane creek; lead and<br />
coliform in Huayllachane and Casanuma – Pumacocha creeks; zinc in Arocollo and Canrayoc creeks; and<br />
arsenic, iron, and lead in the Velille river and Catunhuaycco creek.<br />
Air quality (SPM, PM10, PM2.5, CO, NO 2 , SO 2 , O 3 , H 2 S, and metals in PM10) was monitored in the area<br />
of the project and in the communities of Chilloroya and Uchuccarco as part of the ESIA in 2007, 2008 and<br />
2009. Results indicate a maximum particulate concentration (PM10) of 103 µg/m 3 , well within applicable<br />
Peruvian standards. Air quality within the project site and the surrounding communities is generally good.<br />
A total of 494 different species of plants and 10 vegetative formations were identified within the project<br />
area. While 14 species of flora are classified as endangered, according to the IUCN, just three have been<br />
registered within the direct area of influence.<br />
290 | P a g e
A total of 96 different species of birds, 19 species of mammals, four species of reptiles, and four species<br />
of amphibians were identified within the project area. Of these, five species of birds, three species of<br />
mammals and one amphibian are listed as protected species.<br />
A detailed hydrobiological evaluation of aquatic environments located within the project area was<br />
conducted. One species of fish (a native catfish) belongs to the IUCN Red List of Threatened Species.<br />
In general, the Sacrane, Misayoc, Telaracaca and Chillorya river basins are considered to contain low<br />
values of visual quality as the landscape elements are common to the surrounding areas. The<br />
Japoccocha, Cuesoccocha-Yanaccocha, Urasana, Cunahuire – Huayllachane, Pumacocha – Casanuma<br />
and Huarmicocha – Condorcocha sectors are considered to contain medium values of visual quality, due<br />
to the presence of lakes and the dominant mountain landscapes in these sectors.<br />
An archaeological survey was completed in the areas expected to be directly affected by future project<br />
facilities and activities. A total of 46 archaeological sites were identified in the area of the future mine site.<br />
The certificate of non-existence of archaeological remains of significance (CIRA) was approved by the<br />
MC (Ministry of Culture) in September 2011. <strong>Hudbay</strong> has obtained a CIRA for (i) all the area comprised by<br />
the Constancia Project (excluding the archaeological sites as established in that same Certificate); and (ii)<br />
for the route covered by the power transmission line (excluding the identify archaeological sites).<br />
<strong>Hudbay</strong> has assumed liability for remediation in the San Jose zone, in which the Constancia pit will be<br />
located. Katanga is the only other zone in which remediation is required, but liability for this lies with<br />
another corporate entity, which has been identified by the MEM. <strong>Hudbay</strong> and artisanal miners in the<br />
Pampacancha zone have assumed joint liability for environmental damages in this area.<br />
As part of the evaluation of impacts, a traffic study was completed to evaluate the impacts from the<br />
transportation of Constancia concentrate on current traffic levels.<br />
20.1.3 ENVIRONMENTAL INSTRUMENTS<br />
Commencing in 2008, Knight Piesold Consultores S.A. and Social Capital Group S.A.C. carried out the<br />
environmental baseline investigations required to conclude an ESIA for the Constancia deposit. This ESIA<br />
reflected the project’s feasibility design and was approved by the MINEM on November 24, 2010.<br />
The first amendment to the overall project ESIA is currently being prepared by INSIDEO S.A.C. and<br />
Social Capital Group S.A.C. to match the information provided in the Detailed Design Feasibility Study.<br />
Changes that will be reflected in this amendment, which is anticipated to take approximately one year for<br />
approval, include:<br />
• Modified routing for the tailings line (lower cost and also lower environmental impact)<br />
• Addition of a NAG stockpile<br />
• Increased size of main sediment pond<br />
• Added four new sediment ponds<br />
• Additional topsoil stockpile<br />
• Relocated ammonia warehouse and explosives magazine<br />
• Added aggregates crusher & stockpile<br />
• Allowance for a higher plant throughput rate<br />
• Establishing Fortunia as a permanent camp, San Antonio and Stracon camps<br />
• Tecsup training facility<br />
291 | P a g e
• Communications antenna<br />
• Improved on the erosion and sediment control system<br />
A second ESIA amendment is planned for mid 2013 to include the Pampacancha deposit, which has not<br />
been evaluated as part of the original ESIA.<br />
<strong>Hudbay</strong> also obtained the approval of the third amendment to the Semi detailed Environmental Impact<br />
Assessment (SD-EIA) on May 23, 2011, which allows exploration activities at the Constancia Project. A<br />
fourth amendment to this environmental instrument was submitted to the MINEM on April 27, 2012 in<br />
order to allow <strong>Hudbay</strong> to conduct further exploration activities and confirm reserves in the Pampacancha<br />
and Chilloroya South deposits. This amendment is currently under evaluation.<br />
20.1.4 ENVIRONMENTAL IMPACTS<br />
The ESIA was approved by the Peruvian Ministry of Energy and Mines on November 24, 2010.<br />
In June 2012 the project received several key permits including the Beneficiation Concession and the<br />
construction permit for the Cunahuiri Reservoir (“Autorización de ejecución de obras: reservorio<br />
Cunahuiri”). All permits required for construction are now in place. The key remaining permit required for<br />
operation is the mine permit, and the approval process for this permit is proceeding and we expect to<br />
have it fully approved in 2012.<br />
The process for the evaluation of impacts was guided by national and international standards, using<br />
impact assessment matrices and predictive models. The evaluation of impacts considered direct, indirect<br />
and cumulative impacts. The following predictive tools were used in evaluating the impacts:<br />
• Noise and vibration modelling<br />
• Air dispersion modelling<br />
• Modelling of visual impacts<br />
• Water quality modelling<br />
<strong>Hudbay</strong>’s hydrogeological testwork has been completed for the areas of the Cunahuiri Reservoir, WRF,<br />
and TMF. From this completed testwork <strong>Hudbay</strong> has made the following design decisions: the TMF will<br />
include a partial liner and underdrain system; the WRF will not require a liner; and the Cunahuiri<br />
Reservoir will not require a liner.<br />
The hydrogeological testwork currently being carried out, which is expected to lead to a more refined<br />
hydrogeological model and plant water balance, is intended to answer three principal questions related to<br />
the detailed design of the mine and plant water systems: (1) connectivity between the pit dewatering area<br />
and reservoirs to the north of the pit; (2) impact of slope stability on the pit wall design; and (3) availability<br />
of groundwater supply through life of mine.<br />
<strong>Hudbay</strong> has engaged an Independent Project Review Board (IPRB) to conduct quarterly reviews of the<br />
major earth structures on the project, with regular visits to site, as well, for monitoring the progress of<br />
construction. This activity will continue for the duration of the project under the current scope and it is the<br />
intent of <strong>Hudbay</strong> to continue this review process during operation. Design reviews and site visits will be<br />
carried out at critical junctures throughout the course of mine operations to observe the performance of<br />
the structure and development of subsequent raises to the dam and the impoundment.<br />
292 | P a g e
<strong>Hudbay</strong>’s plant design and operating strategy for water management includes the following aspects:<br />
• <strong>Hudbay</strong>’s current plant design is for zero water discharge to the environment from the plant,<br />
tailings impoundment, and PAG waste rock storage facility. This is based on its calculation<br />
that the plant will require more water than will be available from pit dewatering, waste rock<br />
run-off and tailings under-drain and/or surface water availability.<br />
• <strong>Hudbay</strong>’s prioritization of water sources for the plant is expected to be as follows:<br />
1. Use of pit dewatering water, TMF (seepage from the tailings underdrain and the<br />
embankment toe drain is pumped back into the surface water pond and from there<br />
can be pumped to the plant) and WRF drainage water.<br />
2. Water required in excess of that available from the above sources is expected to<br />
be drawn from, in order of preference, pit wall dewatering, TMF groundwater<br />
underdrain, the main sediment pond, and lastly the Cunahuiri reservoir. To the<br />
extent that water from these sources is not required it can be discharged to the<br />
Chilloroya River (In the case of the sediment pond, sufficient retention time is<br />
required to achieve the required clarity of discharged water. If the flow rate into the<br />
pond exceeds the settling capacity this excess water will be pumped to the tailings<br />
dam).<br />
• The Cunahuiri reservoir is available for either plant make-up water or water supply to mitigate<br />
any reduced river flow or water supply impacts of pit dewatering. The reservoir is also sized<br />
to provide water to the community of Chilloroya at an agreed continuous rate of 10 l/s.<br />
The Constancia environmental monitoring program is summarized in the April 2012 environmental<br />
monitoring plan (CWS-PGM-303: Plan de Monitoreo Ambiental). This plan covers monitoring of air, noise<br />
and vibration, surface water quality and flow, surface lake/reservoir levels, groundwater levels and quality,<br />
domestic water consumption and quality, effluent monitoring (currently only domestic wastewater), soil<br />
and sediment, biological (flora and fauna) monitoring, and meteorological data collection.<br />
During the exploration phase, the project maintained a joint environmental monitoring committee with the<br />
community of Chilloroya. This joint monitoring process is being reconstituted to support the construction<br />
phase monitoring activities.<br />
The ESIA baseline assessment identified a number of flora, fauna and aquatic species that have been<br />
assigned conservation status, either by Peruvian legislation or international designation, and two endemic<br />
species in the project study area are part of the EISA commitments. <strong>Hudbay</strong> is working on several specific<br />
management plans for wetlands, flora and fauna; and has retained the service of a Peruvian<br />
environmental consultancy, INSIDEO S.A.C. (INSIDEO) to develop the project Biodiversity Action Plan<br />
(BAP), as generally anticipated and described in the ESIA and as required in the MAC TSM protocol and<br />
IFC performance standard N° 6. The BAP is intended to consolidate <strong>Hudbay</strong>’s commitments and efforts<br />
regarding biodiversity.<br />
20.1.5 MINE CLOSURE PLAN<br />
The Constancia Closure Plan, as prepared by Knight Piésold, describes the closure activities for all of the<br />
project’s components based on the project’s feasibility design and the approved EISA and includes details<br />
of the public consultation and public participation used in development of the plan. The Constancia<br />
Closure Plan was submitted to Peruvian authorities in November 2011.<br />
The progressive closure includes the tailings dam and the stages 1, 2 and 3 of the waste rock facility,<br />
which are expected to be executed during the last 8 years of operations.<br />
293 | P a g e
The final closure is expected to be implemented two years after the operations conclude, and the post<br />
closure activities are expected to last for five years.<br />
Upon closure, a pit lake will be formed and a 30 meter border around the pit will be established. Pit lake<br />
water level seepage studies predict minimal seepage until the lake level reaches 4,120 meters. <strong>Hudbay</strong><br />
intends to maintain the elevation of the water at this level to avoid all seepage.<br />
A water treatment plant will be required to perpetually treat pit lake water so that it can be discharged to<br />
the environment, and maintain the water level below 4,120 meters. This water treatment plant will also<br />
receive input from the WRF. The WRF will be capped with a 40 mm clay layer to reduce seepage.<br />
Effluent from the treatment plant will be discharged to a mixing channel located parallel to the Chilloroya<br />
River. The rate of discharge to this channel will be adjusted based on flows in the Chilloroya River (aiming<br />
for high flows) and the resultant water quality. Effluent from the water treatment plant will comply with<br />
Peruvian regulations and IFC EHS Guidelines for Mining Effluent prior to discharge to the mixing channel<br />
(and post treatment). The mixing channel will enable <strong>Hudbay</strong> to comply with the more stringent Peruvian<br />
Ambient Water Quality Guidelines.<br />
Through Resolution No. 286-2012-MEM-AAM dated September 4th, 2012, <strong>Hudbay</strong> obtained approval of<br />
the Closure Plan. The current Closure Plan contemplates expenditures of $289.3 million (not including<br />
VAT) for progressive rehabilitation and mine closure over the life of the Constancia Project and through to<br />
2077.<br />
20.2 PERMITTING<br />
20.2.1 CONSTANCIA<br />
<strong>Hudbay</strong> is required to obtain several permits for the construction and operation stages of the Constancia<br />
Project. All of these permits are required to be supported by the ESIA which, as mentioned in previous<br />
sections, has already been approved.<br />
<strong>Hudbay</strong> has secured all necessary permits and authorizations to start construction activities at the<br />
Constancia Project. A summary of these permits is detailed below:<br />
• ESIA - Besides being an environmental background and requirement for other permits,<br />
the ESIA allows the construction and operation of certain facilities that do not have a<br />
specific construction and operation permit, for instance, camps and stockpiles. As<br />
mentioned in previous sections, an ESIA for the Constancia Project has already been<br />
approved and a first addendum is under preparation to match the project’s current<br />
detailed design.<br />
• Certificate of Non-Existence of Archeological Remains (CIRA) - Although not a permit, it<br />
is highly recommended to obtain a CIRA from the Peruvian Ministry of Culture, in order to<br />
evidence that no archeological sites or remains are impacted as a consequence of the<br />
project. On October 6 th , 2011, <strong>Hudbay</strong> obtained CIRA 2011-366-MC for the area<br />
comprised by the Constancia Project, excluding certain archeological sites which are in<br />
the process of being rescued. A specific CIRA for these excluded areas will be requested<br />
once the rescue activities are concluded.<br />
• Beneficiation concession (construction stage) - A beneficiation concession allows a<br />
titleholder to process, purify and refine minerals by using chemical and/or physical<br />
procedures in process plants. The procedure to obtain a beneficiation concession is<br />
mainly divided in two stages: (i) the construction stage; and, (ii) the beneficiation<br />
294 | P a g e
concession granting stage (i.e. granting of the operation license), which is requested after<br />
the process plant construction is finished. Through Resolution No. 189-2012-MEM-<br />
DGM/V dated June 8 th , 2012, <strong>Hudbay</strong> obtained the authorization to construct the process<br />
plant, including the TMF and water collection pond.<br />
• Cunahuiri reservoir (construction stage) - Construction of water supply facilities is<br />
required to be done in accordance with the water license procedures, which consist of<br />
four stages. For purposes of construction and operation, <strong>Hudbay</strong> is required to obtain<br />
third and fourth stage approval. In this regard, by means of Resolution 151-2012-<br />
ANA/ALA Alto Apurimac Velille dated June 7 th , 2012, the Local Water Authority from Alto<br />
Apurimac Velille granted the authorization to construct the Cunahuiri reservoir with a<br />
maximum capacity of 2 million m3.<br />
• Authorizations to impact water ways - According to Peruvian Law, any impact caused to<br />
hydraulic bodies such as lakes and rivers, shall be previously authorized by the<br />
corresponding water authority. There are certain facilities within the Constancia Project<br />
that will be constructed in water ways (e.g. Huallachane stream and the Chilloroya River)<br />
and that have been duly authorized by the Local Water Authority from Alto Apurimac<br />
Velille. These facilities are the main sediment pond, the topsoil stockpile No. 1 and<br />
culverts. The corresponding authorizations were granted by means of Resolutions 55 and<br />
56-2012-ANA/ALA Alto Apurimac Velille dated April 24 th , 2012<br />
• Water authorizations - Other minor water authorizations have been requested in order to<br />
allow <strong>Hudbay</strong> to use water for construction activities. Some of these authorizations have<br />
been granted (for instance the authorization to use water for the construction of the plant<br />
sediment ponds and to use water for the Fortunia camp), and the other ones are in the<br />
final stage of evaluation before the Local Water Authority from Alto Apurimac Velille, since<br />
the corresponding site inspections to the water sources have been carried out.<br />
• Pit dewatering (wells installation) - As part of the water license procedure required to use<br />
water from the pit, <strong>Hudbay</strong> has obtained the authorization to install the corresponding<br />
wells. This authorization was granted by means of Resolution 49-2012-ANA/ALA Alto<br />
Apurimac Velille dated March 30 th , 2012.<br />
Operation permits that will be required for Constancia are the water license (which authorizes permanent<br />
use of water) for the Cunahuiri reservoir, the pit dewatering and the collection pond located over the TMF,<br />
the beneficiation concession (operating license), which allows the operation of the process plant, and the<br />
mine permit, which allows preparation (e.g pre-stripping) and exploitation activities in the pit. All these<br />
permits are on track. For instance, the mine permit which was submitted on December 15 th , 2011 is in its<br />
final stage of evaluation and its approval is expected to be granted before the end of 2012.<br />
20.2.2 PAMPACANCHA<br />
Currently, exploration activities are being carried out as permitted by the third amendment to the SD-EIA.<br />
As explained in Section 20.1.2, the fourth amendment to the SD-EIA (which is expected to allow further<br />
exploration activities in the Pampacancha and Chilloroya South deposits) has been requested and is<br />
currently under evaluation before the MINEM. It is worth noting that because of new legal regulations, a<br />
new authorization to initiate exploration activities for this exploration campaign is required to be obtained<br />
in advance from the MINEM. <strong>Hudbay</strong> will apply for this new authorization once the fourth amendment to<br />
the SD-EIA is approved, since this environmental study is a prerequisite to obtain the aforesaid<br />
authorization. Besides these permits, <strong>Hudbay</strong> has already obtained the necessary surface rights and<br />
mining concessions for exploration covering the Pampacancha and Chilloroya South deposits for the next<br />
13 years.<br />
295 | P a g e
Specific permits for developing and exploiting Pampacancha will be determined and scheduled once the<br />
feasibility design is completed.<br />
20.3 SOCIAL<br />
Between February and April 2012 <strong>Hudbay</strong> reached agreements with the neighboring communities of<br />
Uchuccarco and Chilloroya to secure the surface rights required for the construction of the Constancia<br />
Project. Each of these agreements was validated by two thirds of the community members and is in the<br />
process of being recorded in the public land registry. The community agreements are described in further<br />
detail below.<br />
Also in 2012, <strong>Hudbay</strong> negotiated an extension of the exploration agreement with Chilloroya to allow<br />
access to community land for exploration, including in the Pampacancha area. This access agreement is<br />
for three years (rather than a one year period as in the past) to avoid having to renew the exploration<br />
agreement during the project construction activity.<br />
<strong>Hudbay</strong> has also prepared a compensation plan for the 36 landholding families from the lchuni area of<br />
Chilloroya. This plan takes into account the needs of each family and the capital each one of them has to<br />
develop activities that allow them to restructure their working activities and adapt to a new house. The<br />
idea is to cover all the aspects a family needs to achieve sustainable development. To this end, <strong>Hudbay</strong><br />
developed a Resettlement Action Plan (RAP) which provides a general framework for negotiating with<br />
each family and is based on the concept that each family should receive distinct compensation based on<br />
the impact the resettlement is expected to have. Key provisions of the RAP include consultation, census<br />
of project-effected people, compensation, monitoring, grievance management plan and special<br />
consideration for vulnerable groups. This framework for negotiation was prepared in compliance with<br />
national laws and international provisions and standards in resettlement matters and in particular<br />
the IFC Performance Standards.<br />
A Community Relations Plan has been developed taking into account the following requirements:<br />
• Final determination of the Direct and Indirect Areas of Influence of the project, based on the<br />
outcomes of the Social Impact Analysis as mentioned above.<br />
• The needs in the construction and operation phases, as determined in the Social Impact Analysis.<br />
• The State’s requirements, as expressed in the Community Relations Guidelines of the MINEM and<br />
the Prior Commitment Act (DS-042-2003-EM).<br />
• The requirements of international financial institutions, taking into account as main references the<br />
Equator Principles, IFC Performance Standards, United Nations Environment Programme’s<br />
APELL (Awareness and Preparedness for Emergencies at Local Level) for Mining, and,<br />
supplementary social management standards.<br />
Specific social programs were designed for the mitigation and prevention of identified impacts. Generally,<br />
these programs addressed the following key topics:<br />
• Communication and consultation<br />
• Participatory monitoring<br />
• Claims and dispute resolution<br />
• Local employment and local suppliers services<br />
• Social investment<br />
296 | P a g e
• Land acquisition and resettlement<br />
• Code of conduct for workers<br />
Stakeholder mapping has been undertaken, identifying the two principal stakeholder groups in the direct<br />
area of influence as the communities of Uchuccarco and Chilloroya. There are three well-defined groups<br />
in each of the communities, namely:<br />
• Community assembly: people from the community.<br />
• Artisanal miners: community members who possess land (but do not have title).<br />
• Youth Groups: (in the case of Chilloroya and Uchuccarco, represented through the Youth<br />
Association), educated community members who have had the experience of living in other cities,<br />
but do not own any land or possess any economic capital.<br />
The youth groups and artisanal miners do not have a solid organisational structure, but do have marked<br />
interests and represent a significant proportion of the population.<br />
The association of artisanal miners in Chilloroya is two years old. Benefits from artisanal mining activities<br />
in Chilloroya are not distributed evenly across the population; they are primarily experienced by those<br />
members of the population who possess the land where the illegal mining activities are occurring.<br />
Uchuccarco has a greater number and variety of organisations inside its community structure, some of<br />
which have duties that are independent from the Governing Board, including: JAAS, the Committee of<br />
Water Users (“Comité de Regantes”), among others. In addition, Uchuccarco is the most active<br />
community in the District of Chamaca, and has more relationships with district and private institutions.<br />
In Chilloroya and Uchuccarco, the political strength of the Governing Board is solid and the different<br />
associations within the communities are not well organised. Although there is a varied array of<br />
organisations, many are focused on specific tasks and have little political presence, as in the case of<br />
women’s and parents’ organisations.<br />
The informal mining activity that is of most concern to <strong>Hudbay</strong> is the activity on our concession area at<br />
Pampacancha in the Community of Chilloroya. This is the only informal mining in Chilloroya and was the<br />
subject of an agreement between Norsemont and the community of Chilloroya whereby Norsemont<br />
permitted legal artisanal mining in the Pampacancha area and the community of Chilloroya undertook that<br />
this would be the only portion of the <strong>Hudbay</strong> mineral concession on which community operated artisanal<br />
mining would take place. This agreement has been effective in confining the informal mining to the<br />
Pampacancha area of <strong>Hudbay</strong>’s concessions and will be in force until mid-2015.<br />
<strong>Hudbay</strong> is working with the community of Chilloroya to continue to contain the informal mining activity,<br />
and it believes that the community is also interested in limiting such activities. The community has<br />
recently given <strong>Hudbay</strong> permission to start its new drilling program in the Pampacancha area. <strong>Hudbay</strong>’s<br />
medium term strategy is to draw the informal miners into employment related to the Constancia Project<br />
and finally reach a land acquisition agreement for the Pampacancha area by 2013 that will allow it to<br />
bring an end to informal mining in this area.<br />
The main economic activity in the area is agriculture and cattle farming. A labour force with basic mining<br />
knowledge is present in Espinar. Food and basic supplies can be obtained in Espinar.<br />
297 | P a g e
Arequipa and Cusco are the nearest major centres, and both are over 300 km from the Project site by<br />
road.<br />
Several small permanently flowing streams, which are adequate for exploration requirements, are present<br />
in the area. More significant water sources include the Apurimac and Chilloroya rivers.<br />
Infrastructure includes several poorly maintained unsealed roads. All bridges on the access routes have<br />
low load capacity.<br />
Public electricity is available in Uchuccarco and, only recently, in the Chilloroya community. This power is<br />
supplied from the main grid via Chamaca. Grid electricity is available at Tintaya, 70 km from the project.<br />
Power supply is 138 kV, but there are plans to upgrade this to 220 kV by 2012.<br />
A public, but privately managed, landing strip is located at Espinar, about two hours from the project. The<br />
air strip is paved and maintained by Xstrata, and <strong>Hudbay</strong> has authorisation to use the strip. Small<br />
commercial and/or charter flights can use the air strip for daytime operations.<br />
20.4 HEALTH AND SAFETY<br />
<strong>Hudbay</strong> Peru is managed to the same safety standards as other sites and operations within <strong>Hudbay</strong>, and<br />
many of the priority hazards and required management steps are similar across all exploration,<br />
construction, and mining activities. However, there are specific aspects of any location or operation that<br />
require particular focus and these aspects of the Constancia Project are best summarized in the output of<br />
the “HSEC High Level Risk Assessment Workshop” carried out in Lima on January 31, 2012. This<br />
workshop was attended by personnel from <strong>Hudbay</strong>, Ausenco, Stracon GyM, and GMI. Key site specific<br />
risk areas identified in this workshop included:<br />
• Vehicle accidents, particularly risks related to the poor pavement conditions from Imata to<br />
Espinar, and the state of the road and traffic conditions from Espinar to the Constancia site,<br />
especially in worse weather conditions (rain, hail). This risk poses a threat of injury or<br />
death to non-employees from potential vehicle collisions and vehicle-pedestrian collisions.<br />
Also risks related to travel within the site on steep terrain.<br />
• Risks related to severe weather events, particularly lightning storms in the area of the<br />
project.<br />
• Health risks related to food and hygiene for people travelling to and from the site and health<br />
diseases related to cold weather.<br />
• Risks posed by exploration operations in the vicinity of informal mining – including ground<br />
stability.<br />
• Risks related to the site elevation (4,000 to 4,500 m above sea level).<br />
• Risks related to the use of local labour with less experience in exploration, mining and<br />
construction hazards and/or safety practices.<br />
• Peru has a strong legal framework for Health and Safety management, which provides a<br />
good starting structure for Health and Safety management planning. The Constancia<br />
Project also draws on both <strong>Hudbay</strong> and Ausenco safety management practices. Key<br />
elements of H&S management include:<br />
o<br />
o<br />
The <strong>Hudbay</strong> Peru HSEC Management System, which links identified risks, legal<br />
and other requirements to management responsibilities, plans and procedures, and<br />
auditing needs.<br />
The <strong>Hudbay</strong> Peru health and safety team, including 6 site personnel dedicated to<br />
safety administration and audits, and an Emergency Response Team, which are in<br />
298 | P a g e
o<br />
o<br />
o<br />
charge of a medical centre that includes a medical doctor and paramedic on site at<br />
all times. Ausenco will also have a site safety team to support the EPCM activities.<br />
The Peruvian legally required joint management-employee Health and Safety<br />
committee.<br />
The Peruvian legally required annual third party health and safety audit. Normally it<br />
depends of the performance of the safety indicators.<br />
The Peruvian legally required compulsory 2 day (16 hour) orientation process for<br />
all employees that enter for work at the site. The Mine Safety Institute, Peruvian<br />
Council, Mining Engineer Institute and the <strong>National</strong> Society of Mining, Oil and<br />
Energy, is helping <strong>Hudbay</strong> in this process.<br />
Key aspects of the currently in place health and safety management program include:<br />
• Travel to site driving safety measures, including implementation of a driving safety<br />
program, and examination of options for improving tracking procedures and technologies<br />
(current procedures restrict dark hours vehicle travel and require check-in with site<br />
security at three points between Cusco or Arequipa and site). Additional controls are the<br />
periodical mechanical test of the vehicles and the route patrol (between Matarani and<br />
Espinar) that is being performed by a light vehicle from the Emergency Response Team.<br />
• Specific procedures related to site hazards, including a procedure for managing<br />
permission to travel to site (including confirmation of the Peruvian required medical checks<br />
for working at high elevations), and lightning detection equipment and procedures limiting<br />
outdoor work during lightning events.<br />
• Regular site safety audits, as well as injury / incident tracking and investigation.<br />
• Review of contractor health and safety procedures.<br />
• Development of area operating and safety procedures.<br />
• Development of expanded training program.<br />
• Initiation in 2012 of an occupational health and hygiene monitoring program.<br />
• Hazard Communication by Safety Alerts, Flash <strong>Report</strong>s and Safety Inspection reports.<br />
• HS Communication by HS Newsletters, Posters and Daily safety talks.<br />
299 | P a g e
21.0 CAPITAL AND OPERATING COSTS<br />
The capital and operating costs are estimated in constant 2012 US dollars.<br />
21.1 CAPITAL COSTS<br />
The LOM capital costs are estimated to be $2,211.6M, including $1,546.1M for major project capital as<br />
summarized in Table 21-1. The capital cost estimate has an accuracy of +/- 15%.<br />
There is an additional $665.4M for sustaining capital, which includes $33.5M for pebble crushers and<br />
other sustaining capital; $319.0M for new mine equipment, replacement equipment and equipment major<br />
rebuilds over the entire life of the project and $312.9M for tailings pipeline and tailings management<br />
facility expansion.<br />
A contingency plus growth component of $157.4M or 14.5% of “costs at risk” is included in the major<br />
project capital. As of the end of Q3 2012, $475.5M of the total $1,546.1M for major project capital had<br />
been spent or committed.<br />
Major equipment capital costs are based on quoted costs from equipment suppliers. Processing plant and<br />
site infrastructure capital equipment and construction costs were estimated by Ausenco from labour,<br />
materials and equipment workups. Mine, haul road and other heavy civil works construction costs were<br />
estimated by Stracon based on their experience at other mines in Peru. The costs for the tailings<br />
management facility, waste rock facility and various water storage ponds and reservoirs were estimated<br />
based on a design by Knight-Piesold and heavy civil works unit costs provided by Stracon.<br />
300 | P a g e
Table 21-1: Capital Costs<br />
Capital Expenditures<br />
Initial Capital<br />
Geology, Mine Design & Studies 000 US$ 2,112<br />
Mining 000 US$ 302,929<br />
Process Plant 000 US$ 359,838<br />
Site Services and Utilities 000 US$ 17,412<br />
Internal Infrastructure 000 US$ 372,505<br />
External Infrastructure 000 US$ 48,849<br />
Project Preliminaries 000 US$ 27,665<br />
Indirect Costs 000 US$ 144,049<br />
Owners Costs 000 US$ 270,787<br />
Total Initial Capital 000 US$ 1,546,146<br />
1, 2, 3<br />
Sustaining Capital<br />
Mining - Replacement 000 US$ 95,309<br />
Mining - Major Repair 000 US$ 223,706<br />
Plant - Pebble Crusher 000 US$ 18,858<br />
Plant - Tailings Pipeline 000 US$ 15,789<br />
TMF 000 US$ 297,130<br />
Other 000 US$ 14,657<br />
Total Sustaining Capital 000 US$ 665,448<br />
Total Capital Expenditures 000 US$ 2,211,594<br />
1<br />
Not including Closure costs<br />
2<br />
Cost model projects sustaining capital costs based on a forecast of the price of key<br />
input drivers, namely diesel, steel and the PEN/USD exchange rate<br />
3<br />
Undiscounted<br />
21.2 OPERATING COSTS<br />
Operating costs were estimated from a combination of benchmarking of similar mining operations in Peru,<br />
budget estimates from local suppliers, information provided by <strong>Hudbay</strong>’s service providers regarding the<br />
experience of other Peruvian operations and labour costs currently experienced in the local region.<br />
Operating costs include on-site mine development, ore production, processing, infrastructure and site<br />
specific G&A, as well as estimated costs for concentrate transport, storage and port handling.<br />
The total operating LOM costs are estimated to be US $9.40/tonne milled or $4,230.3M for the life of the<br />
mine, as summarized in Table 21-2.<br />
301 | P a g e
Table 21-2: Operating Costs<br />
Operating Costs 1, 2 Unit Costs Annual Average (LOM)<br />
(US$/tonne Milled)<br />
(000 US$)<br />
Mining $2.98 $80,798<br />
Milling $4.50 $121,929<br />
G&A $1.13 $30,753<br />
Total Mine/Mill $8.61 $233,480<br />
Transportation and Port Charges $0.79 $21,356<br />
Total $9.40 $254,836<br />
1<br />
LOM (Life of Mine) Average<br />
2<br />
Cost model projects operating costs based on a forecast of the price of key input<br />
drivers, namely diesel, steel and the PEN/USD exchange rate<br />
302 | P a g e
22.0 ECONOMIC ANALYSIS<br />
22.1 CASH FLOW, NPV, IRR AND PAYBACK PERIOD<br />
Based on <strong>Hudbay</strong>’s capital cost estimate for the Constancia Project, the NPV 8% of after-tax cash flows as<br />
of July 1, 2012 is C$571M and the IRR is 14.5%. The economic analysis incorporates capital<br />
expenditures that have been incurred during the first six months of 2012 and does not account for the<br />
silver stream transaction with Silver Wheaton. Project payback on an after-tax basis is expected to occur<br />
in late-2018, which is the fourth year of commercial production. The gross revenue by metal is expected<br />
to be 81.1% from copper, 6.9% from silver, 6.8% from molybdenum and 5.2% from gold.<br />
A summary of the life-of-mine undiscounted revenues and costs as well as the project NPV 8% and IRR is<br />
presented in figure 22-1.<br />
Table 22-1: Economic Model Results<br />
$ / tonne ore %<br />
Gross Revenue<br />
Copper 000 US$ 8,683,083 19.30 81.1%<br />
Silver 000 US$ 741,034 1.65 6.9%<br />
Gold 000 US$ 560,142 1.25 5.2%<br />
Molybdenum 000 US$ 722,750 1.61 6.8%<br />
Total Gross Revenue 000 US$ 10,707,009 23.80 100.0%<br />
TC/RC & Freight 000 US$ 1,316,580 2.93 12.3%<br />
Net Revenue 000 US$ 9,390,429 20.87 87.7%<br />
Operating Costs 000 US$ 3,885,756 8.64 36.3%<br />
Operating Margin 000 US$ 5,504,673 12.24 51.4%<br />
Major Project Capital 000 US$ 1,536,746 3.42 14.4%<br />
303 | P a g e
$ / tonne ore %<br />
Sustaining Capital 000 US$ 665,448 1.48 6.2%<br />
Closure Costs 000 US$ 135,342 0.30 1.3%<br />
Pre-Tax Cash Flow 000 US$ 3,167,136 7.04 29.6%<br />
Income & Mining Taxes 000 US$ 1,200,423 2.67 11.2%<br />
After-Tax Cash Flow 000 US$ 1,966,713 4.37 18.4%<br />
After-Tax Cash Flow 000 C$ 2,<strong>101</strong>,564 4.67<br />
NPV - 8% M C$ 571<br />
IRR % 14.5%<br />
A summary of the life-of-mine net revenue by metal is illustrated in Figure 22-1.<br />
304 | P a g e
Figure 22-1: Gross Revenue by Metal<br />
Gross Revenue by Metal<br />
Copper Silver Gold Molybdenum<br />
5.2%<br />
6.8%<br />
6.9%<br />
81.1%<br />
A summary of the annual life-of-mine undiscounted project cash flows is presented in Table 22-2. Included<br />
in the cash flow is annual ore and waste mined from each of the Constancia and Pampacancha open pits<br />
as well as annual mill feed and grades. Pampacancha is incorporated into the mine plan from years 2016<br />
through to 2019, inclusive.<br />
Stockpiling of ore from both Constancia and Pampacancha will occur in order to optimize sequencing and<br />
project economics. The Constancia cash flow model fully incorporates the Peruvian tax regime which<br />
includes the mining tax, mining royalty, 8% labour participation, corporate tax and IGV/VAT. The cash flow<br />
also incorporates the project’s closure and reclamation costs that are forecast to commence post-2020<br />
and continue through to post-mine closure in 2030. As noted above, the cash flow model does not<br />
account for the silver stream transaction with Silver Wheaton.<br />
The operating cost model adjusts capital development expenditures, operating costs and sustaining costs<br />
based on a forecast of the price of key input drivers, namely diesel, steel and the PEN/USD exchange<br />
rate.<br />
305 | P a g e
Table 22-2: Cash Flow by Year<br />
2012 2013 2014 2015 2016 2017 2018<br />
Constancia<br />
Ore Mined 000 t 9,374 27,412 25,568 22,179 8,5<strong>43</strong><br />
Waste Mined 000 t 2,390 44,054 37,699 27,419 20,066 34,321<br />
Pampacancha<br />
Ore Mined 000 t 5,016 7,657 19,593<br />
Waste Mined 000 t 19,610 29,760 15,342<br />
Mill Feed 000 t 7,638 28,032 28,990 28,990 28,990<br />
Copper Head Grade % 0.52% 0.59% 0.<strong>43</strong>% 0.37% 0.47%<br />
Silver Head Grade g/tonne 3.58 4.04 3.71 3.17 4.23<br />
Gold Head Grade g/tonne 0.057 0.053 0.063 0.083 0.234<br />
Molybdenum Head Grade % 0.0082% 0.0114% 0.0115% 0.0105% 0.0132%<br />
Concentrator Recoveries<br />
Copper Recovery % 88.2% 88.7% 88.7% 88.5% 86.5%<br />
Silver Recovery % 85.2% 83.3% 77.4% 72.1% 67.2%<br />
Gold Recovery % 60.0% 60.0% 60.6% 61.3% 63.4%<br />
Molybdenum Recovery % 55.0% 55.0% 53.1% 51.1% 44.9%<br />
Copper Concentrate Produced<br />
Payable Copper % 96.5% 96.5% 96.5% 96.4% 96.5%<br />
Payable Silver % 89.4% 89.2% 90.7% 89.9% 89.9%<br />
Payable Gold % 63.2% 56.5% 74.1% 83.5% 92.9%<br />
Payable Copper 000 lbs 49,738 310,217 235,846 200,<strong>43</strong>2 250,626<br />
Payable Silver oz 448,644 2,681,315 2,446,408 1,914,158 2,377,175<br />
Payable Gold oz 3,415 15,861 27,060 40,810 131,292<br />
Molybdenum Concentrate Produced<br />
Payable Molybdenum % 100.0% 100.0% 100.0% 100.0% 100.0%<br />
Payable Molybdenum 000 lbs 241 2,753 3,8<strong>43</strong> 3,363 3,601<br />
Metal Prices<br />
Copper Price US$/lb 3.40 3.40 3.40 3.30 3.10 2.75 2.75<br />
Silver Price US$/oz 30.00 30.00 30.00 28.00 24.00 23.00 23.00<br />
Gold Price US$/oz 1,650 1,650 1,550 1,450 1,350 1,150 1,150<br />
Molybdenum Price US$/lb 14.00 15.50 15.00 15.00 14.50 14.00 14.00<br />
Exchange Rate CAD/USD 1.02 1.01 1.01 1.02 1.05 1.05 1.05<br />
Revenue from Operations 000 US$ 191,483 1,163,083 882,087 689,222 945,293<br />
Third Party TC/RC & Freight 000 US$ -19,219 -125,568 -100,933 -86,398 -106,032<br />
Net Revenue 000 US$ 172,264 1,037,516 781,154 602,824 839,261<br />
Costs<br />
Mining Costs 000 US$ -26,636 -77,686 -97,384 -91,735 -90,016<br />
Milling Costs 000 US$ -47,118 -119,173 -116,736 -114,795 -114,795<br />
G&A Costs 000 US$ -18,021 -37,004 -37,442 -35,631 -35,613<br />
Royalties 000 US$ -916 -5,508 -3,577 0 0<br />
Profit Sharing 000 US$ 0 -47,926 -27,156 -15,893 -36,665<br />
Initial Capital 000 US$ -421,615 -940,307 -174,823 0 0 0 0<br />
Sustaining Capital 000 US$ -34,186 -66,863 -110,719 -38,392 -32,612<br />
Closure Costs 000 US$ 0 0 0 0 0<br />
Cash Flow Before Income & Mining Taxes 000 US$ -421,615 -940,307 -129,<strong>43</strong>5 683,356 388,141 306,377 529,560<br />
Modified Royalty 000 US$ -1,723 -25,741 -12,531 -6,376 -15,548<br />
Special Mining Tax 000 US$ -1,517 -22,533 -12,003 -6,279 -14,426<br />
Income Tax 000 US$ 0 0 -57,114 -59,618 -130,515<br />
000 US$<br />
Cash Flow After Income & Mining Taxes 000 C$ -421,615 -940,307 -132,675 635,082 306,493 234,105 369,072<br />
Cash Flow After Income & Mining Taxes -<strong>43</strong>0,048 -949,711 -134,002 647,784 321,818 245,810 387,525<br />
306 | P a g e
2019 2020 2021 2022 2023 2024 2025<br />
Constancia<br />
Ore Mined 000 t 14,491 29,490 28,216 29,591 28,476 30,099 28,645<br />
Waste Mined 000 t 44,733 50,760 48,286 40,407 40,868 39,901 <strong>43</strong>,551<br />
Pampacancha<br />
Ore Mined 000 t 14,453<br />
Waste Mined 000 t 6,180<br />
Mill Feed 000 t 28,982 28,990 28,990 28,990 28,990 28,990 28,990<br />
Copper Head Grade % 0.48% 0.36% 0.33% 0.32% 0.31% 0.31% 0.30%<br />
Silver Head Grade g/tonne 4.90 3.30 3.57 3.13 3.30 3.21 2.82<br />
Gold Head Grade g/tonne 0.177 0.0<strong>43</strong> 0.047 0.038 0.035 0.046 0.042<br />
Molybdenum Head Grade % 0.0123% 0.0104% 0.0088% 0.0108% 0.0117% 0.0120% 0.0092%<br />
Concentrator Recoveries<br />
Copper Recovery % 87.4% 89.9% 89.9% 90.2% 90.1% 90.3% 90.1%<br />
Silver Recovery % 69.6% 72.6% 70.3% 71.5% 70.6% 71.3% 70.6%<br />
Gold Recovery % 62.5% 60.0% 60.0% 60.0% 60.0% 60.0% 60.0%<br />
Molybdenum Recovery % 47.5% 55.0% 55.0% 55.0% 55.0% 55.0% 55.0%<br />
Copper Concentrate Produced<br />
Payable Copper % 96.5% 96.5% 96.4% 96.4% 96.4% 96.4% 96.4%<br />
Payable Silver % 91.3% 90.5% 91.4% 90.7% 91.2% 91.3% 90.3%<br />
Payable Gold % 90.3% 67.1% 71.8% 65.9% 63.5% 72.9% 72.1%<br />
Payable Copper 000 lbs 254,341 198,705 181,528 178,457 173,482 169,765 163,686<br />
Payable Silver oz 2,881,025 2,020,520 2,107,5<strong>43</strong> 1,874,654 1,952,500 1,942,313 1,648,266<br />
Payable Gold oz 95,770 16,261 18,823 13,944 12,266 18,559 17,130<br />
Molybdenum Concentrate Produced<br />
Payable Molybdenum % 100.0% 100.0% 100.0% 100.0% 100.0% 100.0% 100.0%<br />
Payable Molybdenum 000 lbs 3,599 3,656 3,086 3,802 4,120 4,218 3,224<br />
Metal Prices<br />
Copper Price US$/lb 2.75 2.75 2.75 2.75 2.75 2.75 2.75<br />
Silver Price US$/oz 23.00 23.00 23.00 23.00 23.00 23.00 23.00<br />
Gold Price US$/oz 1,150 1,150 1,150 1,150 1,150 1,150 1,150<br />
Molybdenum Price US$/lb 14.00 14.00 14.00 14.00 14.00 14.00 14.00<br />
Exchange Rate CAD/USD 1.05 1.05 1.05 1.05 1.05 1.05 1.05<br />
Revenue from Operations 000 US$ 926,222 662,790 612,529 603,1<strong>43</strong> 593,763 591,926 552,877<br />
Third Party TC/RC & Freight 000 US$ -108,100 -85,516 -79,253 -78,528 -78,125 -77,106 -71,639<br />
Net Revenue 000 US$ 818,123 577,274 533,276 524,615 515,638 514,820 481,239<br />
Costs<br />
Mining Costs 000 US$ -87,140 -89,992 -88,168 -80,461 -81,292 -84,581 -83,112<br />
Milling Costs 000 US$ -114,779 -114,795 -114,795 -114,795 -114,795 -114,795 -114,795<br />
G&A Costs 000 US$ -35,561 -31,596 -31,591 -31,454 -31,181 -31,181 -31,175<br />
Royalties 000 US$ 0 0 0 0 0 0 0<br />
Profit Sharing 000 US$ -36,408 -18,269 -15,194 -15,889 -15,664 -15,484 -13,205<br />
Initial Capital 000 US$ 0 0 0 0 0 0 0<br />
Sustaining Capital 000 US$ -38,165 -29,630 -32,784 -26,690 -39,561 -49,842 -39,892<br />
Closure Costs 000 US$ 0 0 -6,866 -6,866 -5,284 -5,284 -5,284<br />
Cash Flow Before Income & Mining Taxes 000 US$ 506,070 292,992 2<strong>43</strong>,880 248,461 227,861 213,654 193,778<br />
Modified Royalty 000 US$ -14,352 -5,773 -5,333 -5,246 -5,156 -5,148 -4,812<br />
Special Mining Tax 000 US$ -13,452 -5,383 -4,045 -3,889 -3,7<strong>43</strong> -3,386 -2,549<br />
Income Tax 000 US$ -130,263 -68,840 -58,091 -60,727 -59,974 -59,<strong>43</strong>0 -51,417<br />
Cash Flow After Income & Mining Taxes 000 US$ 348,003 212,995 176,410 178,598 158,988 145,691 135,000<br />
Cash Flow After Income & Mining Taxes 000 C$ 365,404 223,645 185,231 187,528 166,938 152,975 141,750<br />
307 | P a g e
2026 2027 2028 2029 2030 2031 TOTAL<br />
Constancia<br />
Ore Mined 000 t 26,980 28,660 30,187 28,507 6,772 403,189<br />
Waste Mined 000 t 22,195 15,726 8,960 6,369 479 528,186<br />
Pampacancha<br />
Ore Mined 000 t 46,720<br />
Waste Mined 000 t 70,891<br />
Mill Feed 000 t 28,990 28,990 28,990 28,990 8,385 449,909<br />
Copper Head Grade % 0.28% 0.26% 0.27% 0.32% 0.40% 0.36%<br />
Silver Head Grade g/tonne 2.81 2.84 2.77 2.73 3.74 3.38<br />
Gold Head Grade g/tonne 0.040 0.038 0.038 0.038 0.050 0.067<br />
Molybdenum Head Grade % 0.0088% 0.0077% 0.0072% 0.0074% 0.0081% 0.0<strong>101</strong>%<br />
Concentrator Recoveries<br />
Copper Recovery % 89.9% 90.2% 90.3% 89.9% 89.3% 88.1%<br />
Silver Recovery % 70.1% 71.0% 71.3% 70.1% 68.2% 71.0%<br />
Gold Recovery % 60.0% 60.0% 60.0% 60.0% 60.0% 61.8%<br />
Molybdenum Recovery % 55.0% 55.0% 55.0% 55.0% 55.0% 51.1%<br />
Copper Concentrate Produced<br />
Payable Copper % 96.4% 96.4% 96.4% 96.4% 96.3% 96.4%<br />
Payable Silver % 90.9% 91.6% 91.1% 88.8% 88.9% 90.5%<br />
Payable Gold % 72.1% 72.2% 71.5% 66.1% 66.7% 79.5%<br />
Payable Copper 000 lbs 152,350 142,820 150,788 177,055 63,831 3,053,668<br />
Payable Silver oz 1,644,473 1,700,767 1,663,151 1,514,125 576,023 31,393,060<br />
Payable Gold oz 15,960 15,248 15,276 14,002 5,373 477,049<br />
Molybdenum Concentrate Produced<br />
Payable Molybdenum % 100.0% 100.0% 100.0% 100.0% 100.0% 100.0%<br />
Payable Molybdenum 000 lbs 3,110 2,699 2,545 2,595 820 51,274<br />
Metal Prices<br />
Copper Price US$/lb 2.75 2.75 2.75 2.75 2.75<br />
Silver Price US$/oz 23.00 23.00 23.00 23.00 23.00<br />
Gold Price US$/oz 1,150 1,150 1,150 1,150 1,150<br />
Molybdenum Price US$/lb 14.00 14.00 14.00 14.00 14.00<br />
Exchange Rate CAD/USD 1.05 1.05 1.05 1.05 1.05<br />
Revenue from Operations 000 US$ 518,679 487,198 506,117 574,156 206,440 10,707,009<br />
Third Party TC/RC & Freight 000 US$ -67,265 -63,803 -65,037 -75,726 -28,332 -1,316,580<br />
Net Revenue 000 US$ 451,414 423,395 441,080 498,<strong>43</strong>0 178,108 9,390,429<br />
Costs<br />
Mining Costs 000 US$ -62,355 -57,426 -51,588 -50,567 -12,592 -1,212,729<br />
Milling Costs 000 US$ -114,795 -114,795 -114,795 -114,795 -60,323 -1,835,664<br />
G&A Costs 000 US$ -31,124 -30,842 -29,646 -21,966 -9,473 -510,501<br />
Royalties 000 US$ 0 0 0 0 0 -10,000<br />
Profit Sharing 000 US$ -12,748 -11,709 -14,053 -17,065 -3,535 -316,863<br />
Initial Capital 000 US$ 0 0 0 0 0 -1,536,746<br />
Sustaining Capital 000 US$ -37,783 -26,708 -22,029 -26,870 -12,722 -665,448<br />
Closure Costs 000 US$ -5,284 -93 -93 -31,339 -33,954 -34,997 -135,342<br />
Cash Flow Before Income & Mining Taxes 000 US$ 187,326 181,822 208,875 235,829 45,509 -34,997 3,167,136<br />
Modified Royalty 000 US$ -4,514 -4,234 -4,411 -4,984 -1,781 -127,663<br />
Special Mining Tax 000 US$ -2,400 -1,862 -2,180 -2,872 0 -102,519<br />
Income Tax 000 US$ -49,879 -46,316 -54,786 -65,463 -17,808 -970,240<br />
Cash Flow After Income & Mining Taxes 000 US$ 130,533 129,409 147,499 162,509 25,920 -34,997 1,966,713<br />
Cash Flow After Income & Mining Taxes 000 C$ 137,060 135,879 154,874 170,635 27,216 -36,747 2,<strong>101</strong>,564<br />
308 | P a g e
22.2 PRINCIPAL ASSUMPTIONS<br />
The metal prices and exchange rates used in the economic analysis are based on a blend of consensus<br />
metal price forecasts from over 20 well known financial institutions as of June 2012 as well as Brook<br />
Hunt’s metal price forecasts for copper. In addition to these forecasts, the forward curve and spot metal<br />
prices are taken into consideration. Long term equilibrium prices (LTEP) are used from 2017 onward. The<br />
metal prices used in the economic analysis are shown in Table 22-3.<br />
Table 22-3: Metal and exchange rate assumptions<br />
Metal 2012 2013 2014 2015 2016 2017/LTEP<br />
Copper US$/lb 3.40 3.40 3.40 3.30 3.10 2.75<br />
Silver US$/oz 30.00 30.00 30.00 28.00 24.00 23.00<br />
Gold US$/oz 1,650 1,650 1,550 1,450 1,350 1,150<br />
Molybdenum US$/lb 14.00 15.50 15.00 15.00 14.50 14.00<br />
Exchange Rate CAD/USD 1.02 1.01 1.01 1.02 1.05 1.05<br />
Two concentrates will be produced at the Constancia Project: copper concentrate and molybdenum<br />
concentrate. Copper recovery to copper concentrate is 88%, producing a 28% grade concentrate. In<br />
addition, recoveries to copper concentrate are 71% silver and 62% gold. Recovery to molybdenum<br />
309 | P a g e
concentrate is 51% molybdenum. The molybdenum concentrate grade is 40% molybdenum. Refer to<br />
Table 22-4 for a summary of metallurgical recoveries and concentrate grades. Metal recoveries and<br />
concentrate grades were based on the results of the metallurgical program as discussed in Section 13 of<br />
this <strong>Technical</strong> <strong>Report</strong>.<br />
Table 22-4: Metallurgical Recovery Assumptions<br />
Metallurgical Recoveries<br />
Copper<br />
Concentrate<br />
Molybdenum<br />
Concentrate<br />
Copper 88%<br />
Silver 71%<br />
Gold 62%<br />
Molybdenum 51%<br />
Copper Grade 28%<br />
Molybdenum Grade 40%<br />
Cost assumptions for the sale of concentrates are based on benchmark terms and are summarized in<br />
Table 22-5<br />
Table 22-5: Smelting and Refining Cost Assumptions<br />
Copper<br />
Concentrate<br />
Ground Freight to Port US$/wmt 35.00<br />
Port Charges US$/wmt 25.50<br />
Ocean Freight US$/wmt 47.50<br />
Copper<br />
Payable % 96.5%<br />
310 | P a g e
Copper<br />
Concentrate<br />
Unit deduction % 1<br />
Concentrate<br />
Charge<br />
Treatment<br />
US$/dmt 70<br />
Payable Metal Refining<br />
Charge<br />
US$/lb 0.07<br />
Silver<br />
Payable % 97.0%<br />
Unit deduction g 20<br />
Refining Charge US$/oz 0.45<br />
Gold<br />
Payable % 97.0%<br />
Unit deduction g 0.75<br />
Refining Charge US$/oz 4.50<br />
Lead + Zinc<br />
Penalty US$/dmt 1.27<br />
Molybdenum<br />
Concentrate<br />
Ground Freight to Refinery US$/wmt 216.00<br />
Molybdenum<br />
311 | P a g e
Copper<br />
Concentrate<br />
Payable % 100.0%<br />
Roasting Charge (% of Mo<br />
price)<br />
% 13.5%<br />
The assumed life-of-mine production is shown in Table 22-6<br />
Table 22-6: Life of Mine Production Summary<br />
Constancia Pampacancha Total<br />
Production tonnes 403,189,044 46,719,818 449,908,862<br />
Copper Grade % 0.35% 0.48% 0.36%<br />
Silver Grade g/t 3.25 4.49 3.38<br />
Gold Grade g/t 0.042 0.285 0.067<br />
Molybdenum Grade % 0.0096% 0.0149% 0.0<strong>101</strong>%<br />
Copper in Ore tonnes 1,406,950 224,063 1,631,013<br />
Silver in Ore troy oz 42,126,053 6,741,619 48,867,672<br />
Gold in Ore troy oz 5<strong>43</strong>,034 427,965 970,999<br />
Molybdenum in Ore tonnes 38,571 6,938 45,509<br />
The estimate of copper and molybdenum concentrate, contained metals in concentrate and payable<br />
metals produced over the life-of-mine are summarized in Table 22-7.<br />
312 | P a g e
Table 22-7: Life of Mine Concentrate Production Summary<br />
Copper<br />
Concentrate<br />
Molybdenum<br />
Concentrate<br />
Concentrated Product dmt 5,110,002 58,144<br />
Grades<br />
Copper % 28.10%<br />
Silver g/t 211.1<br />
Gold g/t 3.7<br />
Molybdenum % 40%<br />
Contained Metal in Concentrate<br />
Copper tonnes 1,<strong>43</strong>6,283<br />
Silver troy oz 34,678,867<br />
Gold troy oz 600,266<br />
Molybdenum tonnes 23,257<br />
Payable Metal<br />
Copper tonnes 1,385,121<br />
Silver troy oz 31,393,060<br />
Gold troy oz 477,049<br />
Molybdenum tonnes 23,257<br />
313 | P a g e
22.3 SENSITIVITY ANALYSIS<br />
A sensitivity analysis for the Constancia Project was prepared based on assumed percentage changes in<br />
various input assumptions above or below the base case assumptions. Each input assumption change<br />
was assumed to occur independently from changes in other input assumptions. The analysis is<br />
summarized in figure 22-2. The project is most sensitive to the copper price, followed by capital costs,<br />
operating costs, the PEN/USD exchange rate and lastly secondary metal prices (silver, molybdenum and<br />
gold), respectively.<br />
Figure 22-2: NPV Sensitivity<br />
500<br />
NPV Sensitivity<br />
NPV M C$<br />
400<br />
300<br />
200<br />
100<br />
0<br />
(100)<br />
(200)<br />
(300)<br />
(400)<br />
(500)<br />
-15% -10% -5% 0% 5% 10% 15%<br />
Copper Sensitivity Molybdenum Sensitivity Silver Sensitivity<br />
PEN/USD Sensitivity Capex Sensitivity Opex Sensitivity<br />
Sensitivities to the base case commodity price and exchange rate assumptions are shown in table 22-8.<br />
The three year historical price case improves the project NPV to C$1,202M and the IRR to 19.7%.<br />
314 | P a g e
Table 22-8: Base case commodity price and exchange rate<br />
Base Case<br />
3 year Historical<br />
Average Prices 1<br />
Price and Exchange Weighted Averages<br />
Copper<br />
US$/lb<br />
2.84<br />
3.55<br />
Silver<br />
US$/oz<br />
23.61<br />
26.36<br />
Gold<br />
US$/oz<br />
1,174.18<br />
1,379.33<br />
Molybdenum<br />
US$/lb<br />
14.10<br />
14.92<br />
Exchange<br />
C$/US$<br />
1.04<br />
1.02<br />
NPV- 8% M C$<br />
IRR %<br />
571<br />
14.5%<br />
1,202<br />
19.7%<br />
1<br />
Bloomberg three year historical average (Sept 13, 2009 to September 12, 2012).<br />
22.4 TAXES AND ROYALTIES<br />
The Constancia project is subject to the Peruvian tax regime, which includes the mining tax, mining<br />
royalty, 8% labour participation, corporate tax and IGV/VAT. The Special Mining Tax (SMT) and the Mining<br />
Royalty (MR) are recently introduced taxes (late-2011) for companies in the mineral extractive industries.<br />
Both the SMT and the MR are applicable to mining operating income (EBIT) based on a sliding scale with<br />
progressive marginal rates. The effective tax rate is calculated according to the operating profit margin of<br />
the company. Over the life-of-mine, Constancia’s operating profit margin is expected to average<br />
approximately 35.2% which implies that the effective SMT and MR tax rates are projected to be 2.86%<br />
and 2.61% of operating income over the life of the project. The MR is subject to a minimum of 1% of sales<br />
during a given month. Please refer to tables 22-9 and 22-10 for the SMT and MR marginal tax rates and<br />
effective tax rates at varying levels of operating profit margin. The taxation and royalty information above<br />
was obtained from taxation experts within <strong>Hudbay</strong> Peru and added to the evaluation model by <strong>Hudbay</strong>’s<br />
Director – Treasury.<br />
315 | P a g e
Table 22-9: SMT Marginal Tax Rate and Effective Tax<br />
EBIT Margin SMT Marginal SMT Effective Rate<br />
Lower Upper Rate Lower Upper<br />
0% 10% 2.00% 0.00% 2.00%<br />
10% 15% 2.40% 2.00% 2.13%<br />
15% 20% 2.80% 2.13% 2.30%<br />
20% 25% 3.20% 2.30% 2.48%<br />
25% 30% 3.60% 2.48% 2.67%<br />
30% 35% 4.00% 2.67% 2.86%<br />
35% 40% 4.40% 2.86% 3.05%<br />
40% 45% 4.80% 3.05% 3.24%<br />
45% 50% 5.20% 3.24% 3.44%<br />
50% 55% 5.60% 3.44% 3.64%<br />
55% 60% 6.00% 3.64% 3.83%<br />
60% 65% 6.40% 3.83% 4.03%<br />
65% 70% 6.80% 4.03% 4.23%<br />
70% 75% 7.20% 4.23% 4.<strong>43</strong>%<br />
75% 80% 7.60% 4.<strong>43</strong>% 4.63%<br />
80% 85% 8.00% 4.63% 4.82%<br />
85% 100% 8.40% 4.82% 5.36%<br />
316 | P a g e
Table 22-10: MR Marginal Tax Rate and Effective Tax<br />
EBIT Margin MR Marginal MR Effective Rate<br />
Lower Upper Rate Lower Upper<br />
0% 10% 1.00% 0.00% 1.00%<br />
10% 15% 1.75% 1.00% 1.25%<br />
15% 20% 2.50% 1.25% 1.56%<br />
20% 25% 3.25% 1.56% 1.90%<br />
25% 30% 4.00% 1.90% 2.25%<br />
30% 35% 4.75% 2.25% 2.61%<br />
35% 40% 5.50% 2.61% 2.97%<br />
40% 45% 6.25% 2.97% 3.33%<br />
45% 50% 7.00% 3.33% 3.70%<br />
50% 55% 7.75% 3.70% 4.07%<br />
55% 60% 8.50% 4.07% 4.44%<br />
60% 65% 9.25% 4.44% 4.81%<br />
65% 70% 10.00% 4.81% 5.18%<br />
70% 75% 10.75% 5.18% 5.55%<br />
75% 80% 11.50% 5.55% 5.92%<br />
80% 100% 12.00% 5.92% 7.14%<br />
The corporate tax in Peru is 30% for companies with no stability agreement. Peru offers fifteen-year tax<br />
stability agreements that guarantee the present income tax regime. Companies operating under a tax<br />
stability agreement are subject to a 32% corporate tax rate and receive accelerated depreciation for<br />
certain classes of assets. The Constancia cash flow model assumes that a tax stability agreement will be<br />
finalized in 2012. Both the SMT and the MR as well as Peru’s 8% labour participation are deductible<br />
expenditures for the purposes of calculating the corporate tax.<br />
Capital expenditures in Peru are subject to a refundable IGV/VAT tax that is based on 18% of the cost of<br />
capital goods. During the pre-operating period, approximately 75% of the tax paid is refundable within two<br />
quarters. Once the project is operational, the IGV/VAT accumulated tax pool is refundable up to 18% of<br />
the revenue earned during a given month.<br />
317 | P a g e
23.0 ADJACENT PROPERTIES<br />
There is no material information concerning mining properties adjacent to the Constancia Project.<br />
318 | P a g e
24.0 OTHER RELEVANT DATA AND INFORMATION<br />
There is no other relevant data or information material to the Constancia Project that is necessary to<br />
make this <strong>Technical</strong> <strong>Report</strong> understandable and not misleading.<br />
319 | P a g e
25.0 INTERPRETATION AND CONCLUSIONS<br />
The mine plan developed for the Constancia deposit is of feasibility study quality and has been integrated<br />
with the mine plan for the Pampacancha deposit which is of pre-feasibility study quality. The projected<br />
supply of 16 year mill feed includes 450 million tonnes of proven and probable mineral reserves from the<br />
Constancia and Pampacancha deposits.<br />
In addition, there are approximately 463 million tonnes of material currently classified as measured and<br />
indicated mineral resources that can be reviewed for economic returns should metal prices remain<br />
elevated. The 219 million tonnes of inferred mineral resources by its nature cannot be converted to a<br />
reserve; this material is predominantly lower grade than the average reserve grade and should be<br />
reviewed if the elevated metal price environment persists. The 4 million tonnes of inferred resource at<br />
Pampacancha are planned to be upgraded in resource classification with future infill drilling.<br />
In the opinion of the Qualified Person responsible for Section 14, the database is of sufficient quality to<br />
support the mineral resource and it has been validated by two external reviews. The block model is of<br />
sufficient quality to support the mineral resource and it has also been validated by both internal and<br />
external review.<br />
In the opinion of the Qualified Person responsible for Sections 15 and 16 of this <strong>Technical</strong> <strong>Report</strong>, the<br />
mineral resource estimates, mineral reserve estimates, mining methods, methodology for pit limit<br />
determination for both the Constancia and Pampacancha deposits, cut-off grade optimization, production<br />
sequence and scheduling, and estimation of equipment/manpower requirements are in line with good<br />
industry practice.<br />
The Constancia Project is one of many large projects scheduled to be constructed in Peru over the next<br />
several years and, as a result, it is anticipated that there will be competition for workers and resources,<br />
which could result in potential schedule challenges during the construction period. The author believes that<br />
schedule slip will be the principal pressure on cost should the project experience construction delays. In<br />
the opinion of the author, the contingency allotted to construction capital cost should mitigate most cost<br />
risk. At the time of publication of this <strong>Technical</strong> <strong>Report</strong>, committed and spent dollars would raise this<br />
contingency to approximately 15% of the remaining capital cost.<br />
The Constancia and Pampacancha deposits represent what is considered to be by industry standards, low<br />
grade copper porphyry with the principal material being hypogene in nature. The metallurgy provides for a<br />
robust and clean concentrate production. With construction underway the author believes that the current<br />
supply and demand for copper is such that the project will be completed in a favorable elevated copper<br />
market cycle when it reaches full production in 2015.<br />
The Constancia open pit deposit mineralized horizon is closed off and offers little exploration upside. There<br />
exists to the West, adjacent to the proposed Constancia pit and at a depth of 250m, a Titan chargeability<br />
anomaly that the company plans to test through diamond drilling in 2012. Further exploration is planned<br />
and warranted on the Pampacancha deposit with mineralization open to the North and West of the<br />
delineated deposit. The Chilloroya South prospect also has several exploration targets that merit follow up.<br />
As discussed in Section 22, Economic Analysis, of this <strong>Technical</strong> <strong>Report</strong>, the return on investment and net<br />
present value are most sensitive to the price of copper. The resulting NPV (C$571 Million) and IRR<br />
(14.5%) utilizing the current <strong>Hudbay</strong> long term view on metal prices, TC/RC’s and economic assumptions,<br />
in the opinion of the author, support the declaration of mineral reserves as outlined in the CIM guidelines.<br />
The final base case economic model assumes different operating costs and metal prices than what were<br />
used as the basis to calculate the NSR cut-off for mineral reserves estimation. The higher net smelter<br />
return cut-off grade that this will produce is favorably offset by higher metal production. It is the Qualified<br />
Person’s opinion that the project’s economics would not change materially if mineral reserves were to be<br />
recalculated using the revised base case economic model values.<br />
320 | P a g e
The Qualified Person responsible for Item 13 of this <strong>Technical</strong> <strong>Report</strong> is of the opinion that the test work to<br />
define the comminution characteristics of the Constancia deposit, particularly for the mill feed, is sufficient<br />
for all Constancia ore types that are likely to be encountered and are at a feasibility level of design. An<br />
independent third-party verification of the anticipated throughput has been conducted and confirmed that<br />
the proposed grinding circuit is sufficient to process the design tonnage and is at a feasibility study level of<br />
design. The communition characteristics of the Pampacancha ore body have been tested to a prefeasibility<br />
study level of design recognizing they will be treated in the Constancia mill.<br />
The flotation response of the Constancia ores has been well defined in metallurgical testing. Additional test<br />
work is required to raise the Pampacancha ores to feasibility study level but sufficient testing is complete to<br />
be considered at a pre-feasibility study level.<br />
Metallurgical test work has confirmed that marketable copper concentrates can be produced. The mine<br />
sequencing and planning will require care and review to ensure zinc concentrate grades are kept at<br />
marketable levels. The re-interpretation of the zinc zones has enhanced the confidence that this can be<br />
managed through mine planning processes by better modeling the distribution of zinc throughout the ore<br />
body. The molybdenum recovery circuit has assumed a lengthy ramp up to mitigate the difficult nature of<br />
achieving design recoveries.<br />
321 | P a g e
26.0 RECOMMENDATIONS<br />
The authors recommend that <strong>Hudbay</strong> continue with the advancement of the Constancia Project activities,<br />
as approved by <strong>Hudbay</strong>’s board of directors, with a total project capital expenditure of approximately<br />
US$1,546 million. The recommendations below will improve the understanding of the project but the<br />
outcomes and costs are not expected to be material to the current project economics.<br />
The surface rights adjacent to the Pampacancha deposit are required to be purchased. <strong>Hudbay</strong>’s<br />
relationship with the informal miners in this area is currently good. The status of this relationship will be<br />
critical to the purchase of the surface rights and the mining at Pampacancha, as proposed in this <strong>Technical</strong><br />
<strong>Report</strong>.<br />
It will be very important to meet the commitments that were agreed to with respect to the relocation of the<br />
Chilloroya families and the agreements outlining the continued investment by <strong>Hudbay</strong> in the communities<br />
of Chilloroya and Uchuccarco. The relationships with these communities are key to the successful<br />
construction and operation of the mine.<br />
Baseline and ESIA modification applications are necessary for the inclusion of the Pampacancha deposit in<br />
the Constancia Project. The modifications will include the increase in plant throughput, changes in<br />
Peruvian law to account for new suspended solids discharge limits, and the increase in the requirement for<br />
the tailings management facility. These processes are underway.<br />
Additional infill drilling in Pampacancha is ongoing and the data from this program should be incorporated<br />
into future resource model updates.<br />
Exploration should continue on the prospective properties. Priority should be given to exploring the mineral<br />
extents of the Pampacancha deposit. It is recommended that the Chilloroya prospects be followed up and<br />
a macro understanding of the regional geology be compiled.<br />
Optimization of Pampacancha pit slope designs should be conducted and should be based on an updated<br />
geotechnical model. This model can then provide the basis for revised slope geometry and pushback<br />
(mining phase) configurations that have the potential to increase mineral reserves and reduce overall<br />
stripping requirements.<br />
It is recommended that the engineering design of the Pampacancha deposit proceed to feasibility study<br />
level and that the principal areas of focus be:<br />
• Greater understanding of hydrogeological parameters, through more detailed modeling.<br />
• More detailed design of the waste dump considering the additional waste material.<br />
• More detailed design of the increased capacity in the tailings management facility.<br />
• Further testwork on the Pampacancha deposit, including collecting new samples from fresh drill<br />
cores in order to get metallurgical parameters from comminution, flotation, mineralogical and<br />
settling testwork. Care should be taken to purge and store samples so they do not oxidise.<br />
• Further testwork on mining blends of Pampacancha and Constancia ores to ensure that they do<br />
not adversely affect each other. In particular, the minor chalcocite-diginite components in<br />
Pampacancha feed may activate sphalerite in the high zinc Constancia ore type, so the two should<br />
be kept separate.<br />
322 | P a g e
• Further testwork on comminution, including JK Drop Weight Tests, SMC testing and a repeat of<br />
Bond work index and abrasion indexes to confirm the assumptions made at this stage.<br />
• Detailed diagnostic mineralogy should be conducted on rougher concentrates, final concentrate<br />
and cleaner scavenger tailings samples in order to target regime changes to improve cleaner<br />
recovery and final concentrate grades.<br />
It is also recommended that a check of 3-5% of pulps from resource delineation diamond drill campaigns<br />
be added to the sampling and assaying protocols of the <strong>Hudbay</strong> Peru exploration department.<br />
Although not deemed material to the resulting reserve statement, a review of the ST800039 molybdenum<br />
blank revealed that <strong>Hudbay</strong> Peru’s exploration department should conduct period reviews of blank<br />
performance during diamond drill campaigns.<br />
323 | P a g e
27.0 REFERENCES<br />
- A2Z Mining Inc, Constancia and Pampacancha Mineral Reserves, NI <strong>43</strong> <strong>101</strong> <strong>Technical</strong> <strong>Report</strong>,<br />
Constancia Project, May 2012<br />
- A2Z Mining Inc., Mining Methods, NI <strong>43</strong> <strong>101</strong> <strong>Technical</strong> <strong>Report</strong>, Constancia Project, May 2012.<br />
- AMEC, Amec QC Evaluation, NI <strong>43</strong> <strong>101</strong> <strong>Technical</strong> <strong>Report</strong>, Constancia Project, August 2011<br />
- AMEC, Checking Samples, NI <strong>43</strong> <strong>101</strong> <strong>Technical</strong> <strong>Report</strong>, Constancia Project, From 2006 to 2007<br />
- AMEC, Constancia Mineral Resources Estimate, NI <strong>43</strong> <strong>101</strong> <strong>Technical</strong> <strong>Report</strong>, Constancia Project,<br />
August 2011<br />
- Ausenco PSI, Constancia Tailings Transport System Detail Engineering, Lab <strong>Report</strong> Samples<br />
AdoB420 and AdoB421 (PSP5605-2000-INF-HI-006), April 2012<br />
- C.H. Plenge &Cia, Metallurgical Investigation No.6447-6449 Norsemont Peru S.A.C. Mina<br />
Constancia Composites HY, SG, SK, March 2007<br />
- C.H. Plenge &Cia, Metallurgical Investigation No.6637-6639 Norsemont Peru S.A.C. Mina<br />
Constancia Composites PSG, PHY, PSK, July 2008<br />
- Cube Consulting, Pampacancha Pit Optimization, NI <strong>43</strong> <strong>101</strong> <strong>Technical</strong> <strong>Report</strong>, Constancia<br />
Project, May 2012<br />
- Hydrogeological Pre-feasibility Pampacancha, Golder Associates, NI <strong>43</strong> <strong>101</strong> <strong>Technical</strong> <strong>Report</strong>,<br />
Constancia Project, August 2012.<br />
- JKTech Pty Ltd, SMC Test <strong>Report</strong> on Fifty Samples from Constancia Project Tested at A.R.<br />
MacPherson Consultants Ltd., SGS Lakefield Research Chile S.A., Santiago, Chile for<br />
Norsemont (JKTech Job No. 08004), May-Jun 2008<br />
- JKTech Pty Ltd, SMC Test <strong>Report</strong> on Two Samples from Constancia Project Tested at A.R.<br />
MacPherson Consultants Ltd., SGS Lakefield Research Chile S.A., Santiago, Chile for<br />
Norsemont (JKTech Job No. 08004) , June 2008<br />
- Knight Piesold, “Constancia Project Detailed Engineering Climatological Data Analysis <strong>Report</strong>”,<br />
December 8, 2011, Prepared for <strong>Hudbay</strong> Perú S.A.C. by Knight Piésold Consultores S.A.<br />
- Knight Piésold, Constancia Pit Slope Design, NI <strong>43</strong> <strong>101</strong> <strong>Technical</strong> <strong>Report</strong>, Constancia Project,<br />
August 2012<br />
- Knight Piésold, Pampacancha Pit Slope Design, NI <strong>43</strong> <strong>101</strong> <strong>Technical</strong> <strong>Report</strong>, Constancia Project,<br />
August 2012<br />
- Norsemont, Data Verification (Norsemont QC Protocol), NI <strong>43</strong> <strong>101</strong> <strong>Technical</strong> <strong>Report</strong>, Constancia<br />
Project, From 2006 to 2012<br />
- Pampacancha: SGS, Sample Preparation and Assaying, NI <strong>43</strong> <strong>101</strong> <strong>Technical</strong> <strong>Report</strong>, Constancia<br />
Project, For Pampacancha 2011<br />
- Pocock Industrial, Sample Characterization & PSA, Flocculant, Screening, Gravity Sedimentation<br />
and Pulp Rheology Studies, April 2012<br />
324 | P a g e
- SGS Canada Vancouver, An investigation into Flotation Behavior and QEMScan Characteristics<br />
of Constancia Samples, April 2005<br />
- SGS Lakefield Research Chile, An investigation by QEMScan into the Mineralogical<br />
Characteristics of the Composite Samples from the Constancia Project (Project 4169-Q77), April<br />
2009<br />
- SGS Lakefield Research Chile, Final <strong>Report</strong>: Third <strong>Report</strong> (Third Flotation Stage) Metallurgical<br />
Test Program (Project Code 4169) , September 2009<br />
- SGS Lakefield Research Chile, June 2008. An investigation by QEMScan into the Mineralogical<br />
Characteristics of the Heads Products from the Constancia Project (Project 4169-Q33)<br />
- SGS Lakefield Research Chile, Pruebas de Molienda y Medición de Densidad, (Proyecto OL-<br />
4081/Informe final), August 2007<br />
- SGS Lakefield Research Chile, <strong>Report</strong>: Molybdenum Separation Flotation Test Program (Project<br />
Code 4169) , September 2009<br />
- SGS Mineral Services Chile, Programa de Ensayos Piloto de Flotación con Mineral de<br />
Constancia (Proyecto 4169 - Informe #2), March 2009<br />
- “Norsemont Perú S.A.C. Proyecto Constancia Estudio de Impacto Social y Ambiental” (Spanish),<br />
March 2010, Prepared for Norsemont Perú S.A.C. by Knight Piésold Consultores S.A.<br />
- “Cuarta Modificación Del Estudio De Impacto Ambiental Semi-Detallado (Categoria II) Protecto<br />
De Exploración Constancia” (Spanish), April 2012, Prepared for <strong>Hudbay</strong> Perú S.A.C. by Insideo<br />
S.A.C.<br />
- “Norsemont Perú S.A.C. Proyecto Constancia Plan de Cierre” (Closure Plan in Spanish),<br />
November 2011, Prepared for Norsemont Perú S.A.C. by Knight Piésold Consultores S.A.<br />
- “Norsemont Perú S.A.C. Proyecto de Exploración Constancia Tercera Modificación del Estudio<br />
de Impacto Ambiental Semidetallado Categoría II” (Spanish), December 2010, Prepared for<br />
Norsemont Perú S.A.C. by Knight Piésold Consultores S.A.<br />
- “Titan-24 DC/IP/MT Survey Geophysical <strong>Report</strong>”, August 2011, Prepared for Norsemont Perú<br />
S.A.C by Quantec Geoscience Ltd.<br />
325 | P a g e
28.0 SIGNATURE PAGE<br />
This <strong>Technical</strong> <strong>Report</strong> titled “<strong>National</strong> <strong>Instrument</strong> <strong>43</strong>-<strong>101</strong>, <strong>Technical</strong> <strong>Report</strong>, Constancia Project, Province<br />
of Chumbivilcas, Department of Cusco, Peru”, dated October 15, 2012 was prepared under the<br />
supervision and signed by the following authors:<br />
Dated this 15 th day of October, 2012.<br />
(signed) Cashel Meagher<br />
________________________<br />
Signature of Qualified Person<br />
Cashel Meagher, P. Geo.<br />
Vice President, South America Business Unit<br />
<strong>Hudbay</strong><br />
Dated this 15 th day of October, 2012.<br />
(signed) Michael Humphries<br />
________________________<br />
Signature of Qualified Person<br />
Michael Humphries, P. Eng.<br />
Director, Engineering Studies<br />
<strong>Hudbay</strong><br />
326 | P a g e
29.0 CERTIFICATES OF QUALIFIED PERSONS<br />
CASHEL MEAGHER<br />
CERTIFICATE OF QUALIFICATION<br />
Re: Constancia Project <strong>Technical</strong> <strong>Report</strong>, October 15, 2012<br />
I, Cashel Meagher, B. Sc., P. Geo, of Lima, Peru, do hereby certify that:<br />
1. I am currently employed as Vice President, South America Business Unit, with HudBay <strong>Minerals</strong><br />
Inc., Av. El Derby 055, Torre 3, Piso 4 Santiago de Surco, Lima, Peru.<br />
2. I graduated from Saint Francis Xavier University with a Joint Advanced major in Geology and<br />
Chemistry in 1994.<br />
3. I am a member in good standing with the Association of Professional Geoscientists of Ontario,<br />
member #1056.<br />
4. I have practiced my profession continuously over 16 years and have been involved in mineral<br />
exploration, project evaluation, resource and reserve evaluation, and mine operations in<br />
underground and open pit mines for base metal and precious metal deposits in North and South<br />
America.<br />
5. I have read the definition of “qualified person” set out in <strong>National</strong> <strong>Instrument</strong> <strong>43</strong>-<strong>101</strong> (“NI <strong>43</strong>-<strong>101</strong>)<br />
and certify that by reason of my education and affiliation with a professional association and past<br />
relevant work experience, I fulfill the requirements to be a “qualified person” for the purpose of NI<br />
<strong>43</strong>-<strong>101</strong>.<br />
6. I reviewed and approved the compilation of the Executive Summary and I am responsible for the<br />
preparation, with the assistance of other contributing colleagues, of sections 4 to 12, 14 to 16, 20<br />
and 23 to 26 of the “<strong>National</strong> <strong>Instrument</strong> <strong>43</strong>-<strong>101</strong> <strong>Technical</strong> <strong>Report</strong>, Constancia Project, Province<br />
of Chumbivilcas, Department of Cusco, Peru” (the “<strong>Technical</strong> <strong>Report</strong>”).<br />
7. I last visited the property on August 29, 2012 and also visited it several times prior to that date.<br />
8. As of the date of this certificate, to the best of my knowledge, information and belief, the <strong>Technical</strong><br />
<strong>Report</strong> contains all scientific and technical information that is required to be disclosed to make the<br />
<strong>Technical</strong> <strong>Report</strong> not misleading.<br />
9. I am not independent of the Issuer. Since I am an employee of the Issuer, a producing issuer, I fall<br />
under subsection 5.3(3) of NI <strong>43</strong>-<strong>101</strong> where “a technical report required to be filed by a producing<br />
issuer is not required to be prepared by or under supervision of an independent qualified person”.<br />
10. I have been involved with the Constancia Project property, which is the subject of the <strong>Technical</strong><br />
<strong>Report</strong>, continuously since March, 2011.<br />
11. I have read NI <strong>43</strong>-<strong>101</strong> and Form <strong>43</strong>-<strong>101</strong>F1, and the <strong>Technical</strong> <strong>Report</strong> has been prepared in<br />
compliance with the instrument and form.<br />
12. I consent to the public filing of the <strong>Technical</strong> <strong>Report</strong> with any stock exchange, securities<br />
commission or other regulatory authority and any publication by them, including electronic<br />
327 | P a g e
publication in the public company files on their websites accessible by the public, of the <strong>Technical</strong><br />
<strong>Report</strong>.<br />
Dated as of October 15, 2012.<br />
Original signed by:<br />
Cashel Meagher<br />
Cashel Meagher, B. Sc., P.Geo.<br />
328 | P a g e
MIKE HUMPHRIES<br />
CERTIFICATE OF QUALIFIED PERSON<br />
Re: Constancia Project <strong>Technical</strong> <strong>Report</strong>, October 15, 2012<br />
I, Michael E.T. Humphries, B.Eng., P. Eng., of Aurora, Ontario, do hereby certify that:<br />
1. I am currently employed as Director – Engineering Studies with HudBay <strong>Minerals</strong> Inc. (the<br />
“Issuer”), 800 – 25 York Street, Toronto, Ontario, Canada, M5J 2V5.<br />
2. I graduated from McGill University, Montreal, Quebec, Canada in 1971 with a degree in<br />
Metallurgical Engineering.<br />
3. I am a member in good standing of Professional Engineers Ontario, Registration # 20903019.<br />
4. I have over 40 years of general management experience in my profession in the zinc, copper,<br />
nickel and cobalt extractive metallurgy field, covering operations, engineering, procurement,<br />
commercial contracting and energy policy at major mining operations in Canada.<br />
5. I have read the definition of “qualified person” set out in <strong>National</strong> <strong>Instrument</strong> <strong>43</strong>-<strong>101</strong> (“<strong>43</strong>-<strong>101</strong>”)<br />
and certify that, by reason of my education, affiliation with a professional association and past<br />
relevant work experience, I fulfill the requirements to be a “qualified person” for the purpose of NI<br />
<strong>43</strong>-<strong>101</strong>.<br />
6. I was responsible for the supervision of the compilation of the Executive Summary and for the<br />
preparation, with the assistance of other contributing colleagues, of sections 2, 3, 13, 17, 18, 19,<br />
21, 22 and 27 of the “<strong>National</strong> <strong>Instrument</strong> <strong>43</strong>-<strong>101</strong> <strong>Technical</strong> <strong>Report</strong>, Constancia Project, Province<br />
of Chumbivilcas, Department of Cusco, Peru” (the “<strong>Technical</strong> <strong>Report</strong>”).<br />
7. As of the date of this certificate, to the best of my knowledge, information and belief, the <strong>Technical</strong><br />
<strong>Report</strong> contains all scientific and technical information that is required to be disclosed to make the<br />
technical report not misleading.<br />
8. I have been involved in various technical reviews of processing and infrastructure aspects of the<br />
project since early 2011 and visited the site in June, 2011 with a focus on infrastructure and port<br />
facilities.<br />
9. I am not independent of the Issuer. Since I am an employee of the Issuer, a producing issuer, I fall<br />
under subsection 5.3(3) of NI <strong>43</strong>-<strong>101</strong> where “A technical report required to be file by a producing<br />
issuer is not required to be prepared by or under supervision of an independent qualified person”.<br />
10. I have read NI <strong>43</strong>-<strong>101</strong> and Form <strong>43</strong>-<strong>101</strong>F1, and the <strong>Technical</strong> <strong>Report</strong> has been prepared in<br />
compliance with the instrument and form.<br />
11. I consent to the public filing of the <strong>Technical</strong> <strong>Report</strong> with any stock exchange, securities<br />
commission or other regulatory authority and any publication by them, including electronic<br />
publication in the public company files on their websites accessible by the public, of the <strong>Technical</strong><br />
<strong>Report</strong>.<br />
329 | P a g e
Dated as of October 15, 2012.<br />
Original signed by:<br />
Michael Humphries<br />
Michael Humphries, B. Eng., P. Eng.<br />
330 | P a g e