July - IATA
July - IATA
July - IATA

You also want an ePaper? Increase the reach of your titles
YUMPU automatically turns print PDFs into web optimized ePapers that Google loves.
AIR TRANSPORT MARKET ANALYSIS<br />
JULY 2011<br />
KEY POINTS<br />
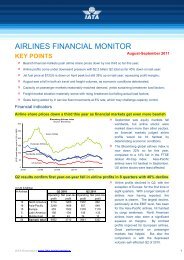
Despite an increasingly gloomy economic outlook, air travel continued to expand at a pace close to trend in <strong>July</strong>,<br />
to a level 5.9% higher than a year earlier. However, air freight markets stagnated as world trade stopped<br />
growing. Air freight volumes were 0.4% lower than a year ago in <strong>July</strong>;<br />
International markets remain stronger on average than domestic air transport markets. Air travel expanded by<br />
7.3% in <strong>July</strong> on international markets, compared to growth of just 3.5% on domestic markets. The stagnation of<br />
air freight is apparent on both international and domestic markets;<br />
Performance continues to differ across international markets. One of the weakest regions was the Asia-Pacific,<br />
largely due to the situation in Japan. North American airlines also saw relatively weak growth in <strong>July</strong>. The<br />
strongest region continues to be Latin America, where airlines continue to see double figure growth. Despite the<br />
crisis in some European economies, airlines from the region have experienced one of the strongest expansions.<br />
Domestic air travel markets show the biggest differences. Japan’s domestic market is recovering slowly from the<br />
shock of the March earthquake and tsunami, but remained 16% lower than in February. China’s market<br />
continued to go through a softer expansion phase, slowed by the impact of economic policies aimed at<br />
restraining inflation. By contrast the domestic markets in India and Brazil continue to expand fast, up 20.6% and<br />
17.8% respectively in <strong>July</strong>.<br />
Monthly RPK (Billions)<br />
430<br />
410<br />
390<br />
370<br />
350<br />
RPK<br />
Total Air Freight and Passenger Volumes<br />
Seasonally Adjusted<br />
FTK<br />
17<br />
16<br />
15<br />
14<br />
13<br />
12<br />
Monthly FTK (Billions)<br />
Index of business confidence<br />
65<br />
60<br />
55<br />
50<br />
45<br />
40<br />
35<br />
Worldwide growth in air travel and business confidence<br />
Growth in RPKs<br />
(right scale)<br />
Business<br />
confidence<br />
(left scale)<br />
15%<br />
10%<br />
5%<br />
0%<br />
-5%<br />
-10%<br />
% change over year<br />
330<br />
2006 2007 2008 2009 2010 2011<br />
11<br />
30<br />
2006 2007 2008 2009 2010 2011<br />
-15%<br />
Our analysis suggests the expansion of air travel in Q2 and the start of Q3 was propelled by stronger economic<br />
growth and confidence at the start of the year. The recent fall in business and consumer confidence, the<br />
stagnation of international trade, and the still high level of the jet kerosene price, removes a lot of the positive<br />
support for air travel growth. We would expect to see air travel growth slowing in the next few months. Now that<br />
international trade has stopped growing a strong near term renewal in air freight growth seems unlikely. .<br />
Year on Year<br />
Comparison<br />
<strong>July</strong> 2011 vs. <strong>July</strong> 2010 YTD 2011 vs. YTD 2010<br />
RPK ASK PLF FTK AFTK FLF RPK ASK PLF FTK AFTK FLF<br />
International 7.3% 7.2% 83.1% -0.4% 4.6% 49.8% 7.8% 9.2% 77.1% 1.5% 7.3% 51.2%<br />
Domestic 3.5% 2.3% 82.9% -0.4% -0.2% 27.6% 4.0% 2.7% 78.9% -1.9% 0.1% 28.0%<br />
Total Market 5.9% 5.4% 83.1% -0.4% 3.6% 45.0% 6.4% 6.8% 77.7% 1.0% 5.6% 46.2%<br />
RPK: Revenue-Passenger-Kilometers; ASK: Available-Seat-Kilometers; PLF: Passenger-Load-Factor; FTK: Freight-Tonne-Kilometers; AFTK:<br />
Available Freight Tonne Kilometers; FLF: Freight Load Factor;<br />
All Figures are expressed in % change Year on Year except PLF and FLF which are the load factors for the specific month.<br />
<strong>IATA</strong> Economics www.iata.org/economics<br />
1
Air Transport Market Analysis<br />
<strong>July</strong> 2011<br />
Airlines have been keeping the expansion of seat capacity growing at a relatively steady pace throughout the<br />
past year. That led to load factors falling sharply when demand was hit by a number of shocks earlier this year.<br />
The stronger traffic seen during Q2 and <strong>July</strong> has allowed the average load factor on passenger markets to<br />
recover to its peak of Q3 last year;<br />
The picture differs on air freight markets. Growth in capacity coupled with stagnating air freight markets has led<br />
to a steady deterioration in the average air freight load factor, which has fallen 4 percentage points since early<br />
2010 and is now back to the level prevailing before the recession.<br />
COMPARING JULY TO JUNE<br />
Month on Month<br />
Comparison<br />
<strong>July</strong> 2011 vs. June 2011<br />
RPK ASK PLF pt FTK AFTK FLF pt<br />
International 2.0% 0.6% 1.1% 0.6% 0.6% 0.0%<br />
Domestic 1.2% 0.4% 0.6% -0.1% 0.9% -0.3%<br />
Total Market 1.7% 0.6% 0.9% 0.5% 0.7% -0.1%<br />
Data are seasonally adjusted.<br />
All figures are expressed in % change month on month except, PLF pt and FLF<br />
pt which are the percentage point difference between load factors of two<br />
consecutive months.<br />
PASSENGER MARKET<br />
International Market<br />
<br />
<br />
The month-on-month comparison gives a<br />
similar broad picture to the year-on-year<br />
comparison shown on page 1, because<br />
there was no major disruption in <strong>July</strong> last<br />
year to distort the growth rates;<br />
The figures clearly show the relative<br />
strength of international air travel, the<br />
improvement in passenger load factors,<br />
the weakness of air freight demand and<br />
the deterioration of load factors in these<br />
markets.<br />
International Passenger Market<br />
Source: <strong>IATA</strong><br />
International Passenger Growth by Region<br />
Source: <strong>IATA</strong><br />
Monthly RPKs (Billion)<br />
300<br />
280<br />
260<br />
240<br />
220<br />
200<br />
180<br />
Actual<br />
Seasonally Adjusted<br />
% Growth in RPKs<br />
12%<br />
10%<br />
8%<br />
6%<br />
4%<br />
2%<br />
0%<br />
-2%<br />
-1.9%<br />
6.6%<br />
3.9%<br />
4.9%<br />
9.1%<br />
9.3%<br />
8.2%<br />
10.3%<br />
7.0%<br />
9.7%<br />
2.4%<br />
Jun-11<br />
3.9%<br />
Jul-11<br />
7.3%<br />
6.0%<br />
160<br />
2006 2007 2008 2009 2010 2011<br />
-4%<br />
Africa Asia/Pacific Europe Latin Middle East North<br />
America<br />
America<br />
Industry<br />
<strong>July</strong> (and August) are always the seasonal high points for air travel due to the timings of holidays in the North.<br />
But even after adjusting for this seasonal boost the chart above shows that there was a further underlying<br />
expansion in air travel in <strong>July</strong>.<br />
By <strong>July</strong> the level of international air travel markets was up 7% so far this year and was 12% higher than the prerecession<br />
peak in early 2008. This has been an encouraging performance. However, to put this in perspective,<br />
if air travel had continued to grow at the 8% pace seen before the recession the size of the market would have<br />
been an additional 14% higher than today’s (<strong>July</strong> 2011) level. Air travel markets have recovered above the prerecession<br />
level but it looks as though 2 years of growth were permanently lost as a result of the recession;<br />
As the chart below shows there has been an encouraging recovery of load factors on international air travel<br />
markets, following the sharp decline earlier this year. This has not been due to cutbacks in capacity – in fact<br />
there has been a moderate acceleration in capacity growth – but because of the rebound in demand.<br />
<strong>IATA</strong> Economics www.iata.org/economics 2
Air Transport Market Analysis<br />
<strong>July</strong> 2011<br />
80%<br />
78%<br />
Passenger Load Factor on International Market<br />
Seasonally Adjusted<br />
Source: <strong>IATA</strong><br />
90%<br />
85%<br />
80%<br />
Jul-10<br />
International Passenger Load Factor by Region<br />
Source: <strong>IATA</strong><br />
80.9%<br />
Jul-11<br />
80.2%<br />
84.8% 85.1%<br />
80.3%<br />
82.6%<br />
80.8%<br />
81.4%<br />
87.2%<br />
86.8%<br />
83.0%<br />
83.1%<br />
% of ASKs<br />
76%<br />
% ASKs<br />
75%<br />
70%<br />
71.9%<br />
73.1%<br />
74%<br />
65%<br />
72%<br />
2006 2007 2008 2009 2010 2011<br />
60%<br />
Africa Asia/Pacific Europe Latin<br />
America<br />
Middle East<br />
North<br />
America<br />
Industry<br />
Domestic Market<br />
190<br />
180<br />
170<br />
Domestic Passenger Market<br />
Source: <strong>IATA</strong><br />
25%<br />
20%<br />
15%<br />
16.0%<br />
Domestic Passenger Growth by Country<br />
Source: <strong>IATA</strong><br />
17.8%<br />
15.9%<br />
20.6%<br />
Jun-11<br />
Jul-11<br />
Monthly RPKs (Billion)<br />
160<br />
150<br />
140<br />
130<br />
120<br />
Actual<br />
Seasonally Adjusted<br />
% Growth in RPKs<br />
10%<br />
5%<br />
0%<br />
-5%<br />
-10%<br />
-15%<br />
-20%<br />
1.5%<br />
2.7%<br />
4.9%<br />
5.1%<br />
-20.3%<br />
-16.7%<br />
1.3%<br />
2.1%<br />
2.4%<br />
3.5%<br />
110<br />
2006 2007 2008 2009 2010 2011<br />
-25%<br />
Australia Brazil China,<br />
P.R.<br />
India Japan USA Industry<br />
Domestic air travel in aggregate has been much more sluggish than air travel on international markets. There<br />
has been very little growth since the end of the third quarter of last year. This is partly because of mature US<br />
market and its sluggish economy. Domestic US markets have shrunk 2% over the same period and represent<br />
50% of worldwide domestic air travel. China is the second biggest market. Growth in this domestic market<br />
slowed abruptly in the middle of 2010 from annual rates close to 20% to a pace of expansion of around 5%.<br />
These two markets represent almost 70% of domestic air travel. Coupled with the impact of the still unrecovered<br />
shock in Japan they have more than offset the strong growth still being seen on India and Brazil’s domestic<br />
markets, which continues to be driven by strong economic growth and previous market liberalization.<br />
80%<br />
Passager Load Factor on Domestic Market<br />
Seasonally Adjusted<br />
Source: <strong>IATA</strong><br />
90%<br />
Domestic Passenger Load Factor by Country<br />
Source: <strong>IATA</strong><br />
86.5%<br />
87.1%<br />
Jul-10<br />
87.3%<br />
Jul-11<br />
79%<br />
78%<br />
85%<br />
80%<br />
79.9%<br />
83.6%<br />
81.9% 82.9%<br />
81.9%<br />
% of ASKs<br />
77%<br />
76%<br />
75%<br />
% ASKs<br />
75%<br />
70%<br />
65%<br />
60%<br />
69.3%<br />
73.8%<br />
71.8%<br />
71.2%<br />
63.0%<br />
60.8%<br />
74%<br />
55%<br />
73%<br />
50%<br />
72%<br />
2006 2007 2008 2009 2010 2011<br />
45%<br />
Australia Brazil China, P.R. India Japan USA Industry<br />
<strong>IATA</strong> Economics www.iata.org/economics 3
Air Transport Market Analysis<br />
<strong>July</strong> 2011<br />
Total Market (Domestic + International)<br />
530<br />
Total Passenger Market<br />
Source: <strong>IATA</strong><br />
14%<br />
Total Passenger Growth by Region<br />
Source: <strong>IATA</strong><br />
Monthly RPKs (Billion)<br />
480<br />
430<br />
380<br />
% Growth in RPKs<br />
12%<br />
10%<br />
8%<br />
6%<br />
4%<br />
2%<br />
4.3%<br />
3.7%<br />
4.7%<br />
8.0%<br />
8.5%<br />
10.4%<br />
12.1%<br />
6.9%<br />
9.8%<br />
1.7%<br />
Jun-11<br />
2.8%<br />
4.7%<br />
Jul-11<br />
5.9%<br />
330<br />
Actual<br />
0%<br />
Seasonally Adjusted<br />
-2%<br />
280<br />
2006 2007 2008 2009 2010 2011<br />
-4%<br />
-2.4%<br />
Africa Asia/Pacific Europe Latin Middle East North<br />
America<br />
America<br />
Industry<br />
Strong domestic air travel in Brazil added to the leading international growth performance of airlines from Latin<br />
America in <strong>July</strong>. The total RPKs carried by these airlines rose 12.1% above a year earlier in <strong>July</strong>. However,<br />
weakness in Japan and sub-par growth in China offset strong Indian domestic growth and depressed the growth<br />
of total RPKs carried by airlines based in the Asia-Pacific region. North American airlines’ performance was also<br />
weakened by domestic markets, which represent two-thirds of total RPKs for these airlines. European airlines,<br />
with just 10% of their total RPKs coming from domestic markets, are benefiting from their stronger international<br />
performance.<br />
Average load factors on air travel markets have recovered to the highs of Q3 last year. North American and<br />
European airlines continue to achieve the highest load factors. Latin American airlines have seen the largest<br />
improvement.<br />
80%<br />
Passager Load Factor on Total Market<br />
Seasonally Adjusted<br />
Source: <strong>IATA</strong><br />
90%<br />
Total Passenger Load Factor by Region<br />
Source: <strong>IATA</strong><br />
86.9%<br />
86.9%<br />
79%<br />
78%<br />
85%<br />
80%<br />
Jul-10<br />
79.9%<br />
Jul-11<br />
80.2%<br />
83.8% 84.1%<br />
79.6%<br />
80.6%<br />
81.5%<br />
82.6%<br />
83.1%<br />
% of ASKs<br />
77%<br />
76%<br />
75%<br />
% of ASKs<br />
75%<br />
70%<br />
71.3%<br />
72.7%<br />
76.5%<br />
74%<br />
65%<br />
73%<br />
72%<br />
2006 2007 2008 2009 2010 2011<br />
60%<br />
Africa Asia/Pacific Europe Latin<br />
America<br />
Middle East<br />
North<br />
America<br />
Industry<br />
FREIGHT MARKET<br />
International Market<br />
15<br />
International Freight Market<br />
Source: <strong>IATA</strong><br />
International Freight Growth by Region<br />
Source: <strong>IATA</strong><br />
14<br />
10%<br />
8%<br />
8.4%<br />
7.4%<br />
8.4%<br />
Jun-11<br />
Jul-11<br />
Monthly FTKs (Billion)<br />
13<br />
12<br />
11<br />
10<br />
9<br />
Actual<br />
Seasonally Adjusted<br />
% Growth in FTKs<br />
6%<br />
4%<br />
2%<br />
0%<br />
-2%<br />
-4%<br />
-6%<br />
-0.1%<br />
-6.2%<br />
-3.9%<br />
-0.5%<br />
-1.2%<br />
2.5%<br />
3.5%<br />
-0.5%<br />
2.0%<br />
-2.7%<br />
-0.4%<br />
8<br />
2006 2007 2008 2009 2010 2011<br />
-8%<br />
Africa Asia/Pacific Europe Latin Middle East North<br />
America<br />
America<br />
Industry<br />
<strong>IATA</strong> Economics www.iata.org/economics 4
Air Transport Market Analysis<br />
<strong>July</strong> 2011<br />
International air freight markets were marginally stronger than domestic markets in <strong>July</strong>. The volume of air<br />
freight carried on international markets in <strong>July</strong> was up just over 1% from the start of the year. Now that air<br />
freight markets have shrunk 5% from the peak reached in early 2010 the size of these markets in <strong>July</strong> was just<br />
3% higher than pre-recession levels.<br />
During the second half of 2010 the weakness of air freight was due to a loss of share of world trade to other<br />
modes, partly due to the composition of goods traded. World trade was expanding strongly during that period<br />
but other modes benefited. However, so far this year there has been no further growth in world trade – in part<br />
because of the disruptions caused to electronics and automobile supply chains by the earthquake and tsunami<br />
in Japan, but also a sign of economic slowdown. While this environment persists there is little scope for further<br />
expansion in air freight volumes;<br />
Capacity continued to expand throughout the eighteen months to <strong>July</strong>. Since air freight demand shrank 5% in<br />
the past fourteen months load factors fell back to pre-recession levels.<br />
The regional divergence in load factors largely reflects the importance of the Asia-Pacific region as the major<br />
centre for manufacturing. Manufacturing, particularly industries such as electronics and capital goods, are key<br />
shippers by air. As a result the major flows of these goods are out from the Asia-Pacific region, while inward<br />
flows are much lower. Asia-Pacific airlines have the home carrier advantage in better utilizing their capacity and<br />
achieve by far the highest load factors. At the other extreme are airlines from Africa, where manufacturing is<br />
weak and the principle export – commodities – is mostly not shipped by air.<br />
% of AFTKs<br />
58%<br />
56%<br />
54%<br />
52%<br />
50%<br />
48%<br />
46%<br />
44%<br />
Freight Load Factor on International Market<br />
Seasonally Adjusted<br />
Source: <strong>IATA</strong><br />
% AFTKs<br />
70%<br />
65%<br />
60%<br />
55%<br />
50%<br />
45%<br />
40%<br />
35%<br />
30%<br />
25%<br />
25.1%<br />
25.9%<br />
65.4%<br />
International Freight Load Factor by Region<br />
Source: <strong>IATA</strong><br />
62.5%<br />
50.0%<br />
47.6%<br />
43.2%<br />
41.8%<br />
45.8%<br />
44.2%<br />
Jul-10<br />
41.0%<br />
38.8%<br />
Jul-11<br />
52.2%<br />
49.8%<br />
42%<br />
2006 2007 2008 2009 2010 2011<br />
20%<br />
Africa Asia/Pacific Europe Latin<br />
America<br />
Middle East<br />
North<br />
America<br />
Industry<br />
Total Market<br />
17<br />
16<br />
Total Freight Market<br />
Source: <strong>IATA</strong><br />
10%<br />
8%<br />
7.4%<br />
Total Freight Growth by Region<br />
Source: <strong>IATA</strong><br />
8.2% 8.4%<br />
Jun-11<br />
Jul-11<br />
Monthly RPKs (Billion)<br />
15<br />
14<br />
13<br />
12<br />
% Growth in FTKs<br />
6%<br />
4%<br />
2%<br />
0%<br />
-2%<br />
-4%<br />
-0.9%<br />
-3.6%<br />
-0.7%<br />
-1.3%<br />
2.7%<br />
3.5%<br />
-0.6%<br />
1.0%<br />
-2.5%<br />
-0.4%<br />
11<br />
Actual<br />
Seasonally Adjusted<br />
10<br />
2006 2007 2008 2009 2010 2011<br />
-6%<br />
-8%<br />
-5.8%<br />
Africa Asia/Pacific Europe Latin Middle East North<br />
America<br />
America<br />
Industry<br />
Air freight markets in total were depressed further by declines in domestic air freight, which in <strong>July</strong> was around<br />
10% lower than prior to the recession. Airlines from most regions have experienced very weak air freight<br />
businesses so far this year. During the first seven months of 2011 only airlines in the Latin American and Middle<br />
East regions have seen volumes grow at a high single figure pace. Airlines in the Asia-Pacific and Africa<br />
regions have seen the size of their air freight businesses decline;<br />
<strong>IATA</strong> Economics www.iata.org/economics 5
Air Transport Market Analysis<br />
<strong>July</strong> 2011<br />
52%<br />
50%<br />
Freight Load Factor on Total Market<br />
Seasonally Adjusted<br />
Source: <strong>IATA</strong><br />
70%<br />
60%<br />
60.2%<br />
Total Freight Load Factor by Region<br />
Source: <strong>IATA</strong><br />
58.1%<br />
Jul-10<br />
Jul-11<br />
% of AFTKs<br />
48%<br />
46%<br />
44%<br />
42%<br />
% of AFTKs<br />
50%<br />
40%<br />
30%<br />
24.7%<br />
25.5%<br />
49.0%<br />
46.8%<br />
42.2%<br />
39.9%<br />
45.1%<br />
43.6%<br />
34.2%<br />
33.0%<br />
46.8%<br />
45.0%<br />
40%<br />
20%<br />
38%<br />
2006 2007 2008 2009 2010 2011<br />
10%<br />
Africa Asia/Pacific Europe Latin<br />
America<br />
Middle East<br />
North<br />
America<br />
Industry<br />
.<br />
<strong>IATA</strong> Economics www.iata.org/economics 6
ANNEX<br />
Year on Year<br />
Comparison<br />
<strong>July</strong> 2011 vs. <strong>July</strong> 2010 YTD 2011 vs. YTD 2010<br />
Air Transport Market Analysis<br />
<strong>July</strong> 2011<br />
RPK ASK PLF FTK AFTK FLF RPK ASK PLF FTK AFTK FLF<br />
Africa 6.6% 4.9% 73.1% 8.4% 5.1% 25.9% 1.0% 4.7% 65.9% -1.6% 2.9% 26.5%<br />
Asia/Pacific 4.9% 5.8% 80.2% -3.9% 0.5% 62.5% 4.1% 6.4% 76.2% -3.5% 2.4% 62.5%<br />
Europe 9.3% 8.9% 85.1% -0.5% 4.3% 47.6% 11.0% 11.7% 78.1% 4.2% 8.7% 50.3%<br />
Latin America 10.3% 7.2% 82.6% 7.4% 4.0% 43.2% 12.2% 8.8% 77.9% 7.0% 4.0% 43.0%<br />
Middle East 9.7% 8.9% 81.4% 8.4% 12.4% 44.2% 8.9% 9.9% 75.2% 9.5% 14.1% 44.8%<br />
North America 3.9% 4.4% 86.8% 2.0% 7.6% 38.8% 6.0% 8.6% 80.1% 5.3% 11.4% 41.4%<br />
International 7.3% 7.2% 83.1% -0.4% 4.6% 49.8% 7.8% 9.2% 77.1% 1.5% 7.3% 51.2%<br />
Australia 2.7% 0.2% 81.9% 4.3% 4.5% 77.9%<br />
Brazil 17.8% 10.7% 73.8% 18.3% 11.0% 70.4%<br />
China 5.1% 1.6% 86.5% 7.3% 2.8% 82.4%<br />
India 20.6% 21.7% 71.2% 18.2% 18.6% 75.5%<br />
Japan -16.7% -13.7% 60.8% -18.7% -12.4% 57.1%<br />
US 2.1% 2.0% 87.3% 2.4% 2.0% 82.8%<br />
Domestic 3.5% 2.3% 82.9% -0.4% -0.2% 27.6% 4.0% 2.7% 78.9% -1.9% 0.1% 28.0%<br />
Africa 4.3% 2.3% 72.7% 7.4% 3.8% 25.5% -0.2% 2.5% 66.4% -2.5% 2.0% 26.1%<br />
Asia/Pacific 4.7% 4.2% 80.2% -3.6% 0.0% 58.1% 4.5% 4.9% 76.6% -3.5% 1.9% 58.0%<br />
Europe 8.5% 8.1% 84.1% -0.7% 4.0% 46.8% 10.1% 10.7% 77.2% 4.0% 8.3% 49.3%<br />
Latin America 12.1% 7.7% 79.6% 8.2% 2.4% 42.2% 14.4% 9.6% 75.5% 7.3% 2.3% 41.4%<br />
Middle East 9.8% 8.7% 81.5% 8.4% 12.1% 43.6% 8.3% 9.0% 75.4% 9.5% 13.5% 44.1%<br />
North America 2.8% 2.7% 86.9% 1.0% 4.5% 33.0% 3.5% 4.1% 81.8% 2.5% 6.1% 34.5%<br />
Total Market 5.9% 5.4% 83.1% -0.4% 3.6% 45.0% 6.4% 6.8% 77.7% 1.0% 5.6% 46.2%<br />
RPK: Revenue-Passenger-Kilometers; ASK: Available-Seat-Kilometers; PLF: Passenger-Load-Factor; FTK: Freight-Tonne-Kilometers; AFTK:<br />
Available Freight Tonne Kilometers; FLF: Freight Load Factor;<br />
All Figures are expressed in % change Year on Year except PLF and FLF which are the load factors for the specific month.<br />
<strong>IATA</strong> Economics www.iata.org/economics 7
Air Transport Market Analysis<br />
<strong>July</strong> 2011<br />
Month on Month<br />
Comparison<br />
<strong>July</strong> 2011 vs. June 2011 Market Share<br />
RPK ASK PLF FTK AFTK FLF RPK FTK<br />
Africa 4.5% 1.9% 1.7% 1.7% 0.4% 0.3% 3.2% 1.3%<br />
Asia/Pacific 2.0% 1.2% 0.6% 1.7% 2.0% -0.2% 24.9% 43.3%<br />
Europe 1.2% 0.5% 0.5% -0.3% 0.1% -0.2% 41.5% 24.4%<br />
Latin America 1.9% 2.5% -0.5% 2.4% 1.6% 0.4% 4.2% 3.0%<br />
Middle East 2.0% 1.0% 0.8% 4.2% 1.9% 1.0% 10.8% 11.4%<br />
North America 1.3% 0.6% 0.5% 1.9% 0.0% 0.8% 15.4% 16.7%<br />
International 2.0% 0.6% 1.1% 0.6% 0.6% 0.0% 100.0% 100.0%<br />
Australia 0.8% 3.1% -1.8% 3.1%<br />
Brazil 5.4% 2.8% 1.7% 3.5%<br />
China 0.8% -0.2% 0.8% 18.1%<br />
India 0.5% 2.4% -1.5% 2.7%<br />
Japan 3.5% 1.3% 1.4% 2.7%<br />
US 0.3% 0.0% 0.3% 49.7%<br />
Domestic 1.2% 0.4% 0.6% -0.1% 0.9% -0.3% 100.0%<br />
Africa 3.8% 1.7% 1.4% 1.6% 0.3% 0.3% 2.3% 1.1%<br />
Asia/Pacific 1.6% 1.2% 0.3% 1.6% 2.1% -0.3% 26.9% 40.9%<br />
Europe 1.3% 0.6% 0.5% -0.3% 0.1% -0.2% 29.8% 21.6%<br />
Latin America 2.9% 2.0% 0.6% 2.6% 3.0% -0.1% 5.1% 2.9%<br />
Middle East 2.0% 1.0% 0.7% 3.2% 1.9% 0.6% 7.3% 9.9%<br />
North America 0.3% 0.2% 0.1% 1.1% 0.2% 0.3% 28.6% 23.6%<br />
Total Market 1.7% 0.6% 0.9% 0.5% 0.7% -0.1% 100.0% 100.0%<br />
Data are seasonally adjusted.<br />
All figures are expressed in % change month on month except, PLF pt and FLF pt which are the percentage point<br />
difference between load factors of two consecutive months.<br />
<strong>IATA</strong> Economics<br />
E-Mail: economics@iata.org<br />
1 st September 2011<br />
FURTHER ANALYSIS AND DATA<br />
Access data related to this briefing<br />
through the Route Tracker publication:<br />
www.iata.org/ps/publications/Pages/<br />
<strong>IATA</strong> Economics www.iata.org/economics<br />
carrier-tracker<br />
NEW RELEASE ALERTS<br />
To receive email notification of new<br />
analysis from <strong>IATA</strong> Economics,<br />
select ‘Economic Briefings’ from:<br />
www.iata.org/optin<br />
8