Revised - Illinois Community College Board
Revised - Illinois Community College Board
Revised - Illinois Community College Board

You also want an ePaper? Increase the reach of your titles
YUMPU automatically turns print PDFs into web optimized ePapers that Google loves.
<strong>Revised</strong><br />
Agenda Item #12.2<br />
January 28, 2010<br />
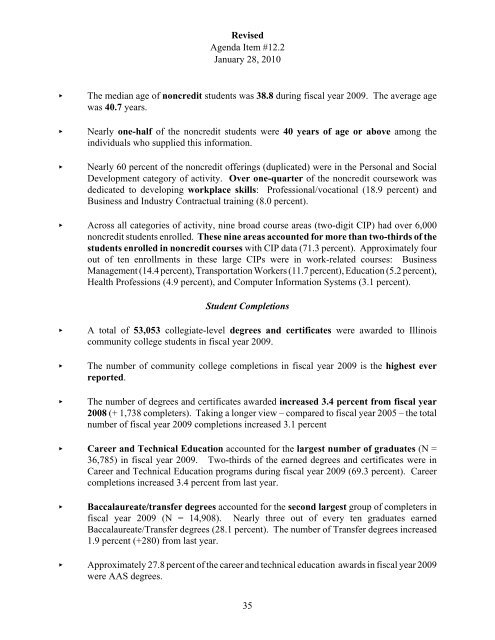
< The median age of noncredit students was 38.8 during fiscal year 2009. The average age<br />
was 40.7 years.<br />
< Nearly one-half of the noncredit students were 40 years of age or above among the<br />
individuals who supplied this information.<br />
< Nearly 60 percent of the noncredit offerings (duplicated) were in the Personal and Social<br />
Development category of activity. Over one-quarter of the noncredit coursework was<br />
dedicated to developing workplace skills: Professional/vocational (18.9 percent) and<br />
Business and Industry Contractual training (8.0 percent).<br />
< Across all categories of activity, nine broad course areas (two-digit CIP) had over 6,000<br />
noncredit students enrolled. These nine areas accounted for more than two-thirds of the<br />
students enrolled in noncredit courses with CIP data (71.3 percent). Approximately four<br />
out of ten enrollments in these large CIPs were in work-related courses: Business<br />
Management (14.4 percent), Transportation Workers (11.7 percent), Education (5.2 percent),<br />
Health Professions (4.9 percent), and Computer Information Systems (3.1 percent).<br />
Student Completions<br />
< A total of 53,053 collegiate-level degrees and certificates were awarded to <strong>Illinois</strong><br />
community college students in fiscal year 2009.<br />
< The number of community college completions in fiscal year 2009 is the highest ever<br />
reported.<br />
< The number of degrees and certificates awarded increased 3.4 percent from fiscal year<br />
2008 (+ 1,738 completers). Taking a longer view – compared to fiscal year 2005 – the total<br />
number of fiscal year 2009 completions increased 3.1 percent<br />
< Career and Technical Education accounted for the largest number of graduates (N =<br />
36,785) in fiscal year 2009. Two-thirds of the earned degrees and certificates were in<br />
Career and Technical Education programs during fiscal year 2009 (69.3 percent). Career<br />
completions increased 3.4 percent from last year.<br />
< Baccalaureate/transfer degrees accounted for the second largest group of completers in<br />
fiscal year 2009 (N = 14,908). Nearly three out of every ten graduates earned<br />
Baccalaureate/Transfer degrees (28.1 percent). The number of Transfer degrees increased<br />
1.9 percent (+280) from last year.<br />
< Approximately 27.8 percent of the career and technical education awards in fiscal year 2009<br />
were AAS degrees.<br />
35